

Abstract
People with amblyopia show deficits in global motion perception, especially at slow speeds. These observers are also known to have unstable fixation when viewing stationary fixation targets, relative to healthy controls. It is possible that poor fixation stability during motion viewing interferes with the fidelity of the input to motion-sensitive neurons in visual cortex. To probe these mechanisms at a behavioral level, we assessed motion coherence thresholds in adults with amblyopia while measuring fixation stability. Consistent with prior work, participants with amblyopia had elevated coherence thresholds for the slow speed stimuli, but not the fast speed stimuli, using either the amblyopic or the fellow eye. Fixation stability was elevated in the amblyopic eye relative to controls across all motion stimuli, and not selective for conditions on which perceptual deficits were observed. Fixation stability was not related to visual acuity, nor did it predict coherence thresholds. These results suggest that motion perception deficits might not be a result of poor input to the motion processing system due to unstable fixation, but rather due to processing deficits in motion-sensitive visual areas.
Keywords: Amblyopia, Fixation stability, Global motion perception, Motion coherence, Speed
Subject terms: Human behaviour, Oculomotor system
Introduction
Amblyopia is characterized by poor visual acuity in one eye that cannot be optically corrected. In addition to a variety of spatial and binocular vision deficits1–4, several aspects of motion perception are often disrupted in both eyes5–7. For example, global motion integration, or the capacity to combine local motion signals from individual elements into a perception of overall motion direction, is commonly assessed using random dot stimuli. Coherence thresholds for discriminating the direction of motion in these stimuli have been shown to be elevated for slow speeds, but not fast speeds, in people with unilateral amblyopia8. This is consistent with the finding that coherence thresholds typically mature to adult levels at a later age for slow than for fast speeds of motion9. We assume that these global motion tasks probe the functioning of cortical mechanisms involved in motion integration. However, information is processed through a variety of regions prior to reaching motion integration regions of the brain, and so it is possible that atypical thresholds reflect a deficit at earlier stages rather than motion processing per se. The goal of the current study is to investigate the extent to which fixation stability, one factor that may influence spatial vision at earlier stages, may account for the speed-tuned elevation of motion coherence thresholds in people with amblyopia.
Fixation instability in amblyopia has been well-established in the literature (reviewed in10,11). Compared to control observers, children and adults with amblyopia demonstrate less stable fixation, commonly quantified using the bivariate contour ellipse area (BCEA; in deg2) to measure the area over which eye positions are dispersed, when viewing a stationary target with the amblyopic eye12–15 or binocularly16,17. Stability in the fellow eye is usually equal, or only slightly reduced, when compared to age-matched control eyes12,13,15,16. Moreover, poor stability is often associated with poorer visual acuity in the affected eye13–15,18, poorer stereoacuity12,17,19, and poorer contrast sensitivity18. Using blurring lenses in patients’ fellow eyes to match their amblyopic eye acuity does not impact stability in these fellow eyes15, so it is unlikely that an acuity reduction per se is the sole cause of poor fixation stability in amblyopia. Children without amblyopia who have anisometropia and/or strabismus, however, do have poorer stability compared to age-matched controls12,17. Applying a blurring lens to healthy controls has been shown to decrease stability (using a + 3 diopter lens, inducing a poor acuity of 0.53 logMAR)20, or to not affect stability at all (using a + 5.5 diopter lens, inducing acuity of 0.70 logMAR)15. Some authors have suggested that abnormal fixation patterns in amblyopia reflect an oculomotor adaptation in an attempt to increase contrast sensitivity21, and others have found improved stability in the amblyopic eye when the contrast to each eye is psychophysically balanced to reduce interocular suppression22. While fixation stability does improve with treatment-related increases in visual acuity for the amblyopic eye23, this improvement does not always correlate with acuity gains24 and stability can remain abnormal in children who have completed treatment successfully (reaching at least 0 logMAR, or 20/20 Snellen)25.
Humans continuously make small eye movements called microsaccades, drift, and tremor during fixation26. Microsaccades are small, high-velocity jerks of the eye that occur several times per second when a healthy observer fixates on a stationary object. These movements are functional, since an image on a perfectly still retina will fade after a few hundred milliseconds, and they assist with corrective fixation control and enhancement of fine spatial detail (for reviews see27–29). Ocular drifts also do not occur at random but are systematically driven by stimulus patterns30 and sensitively tuned to visual features31. Of interest to this work is whether the fixation stability of an observer can impact the perception of global motion during direction-discrimination tasks. Microsaccade activity predicts the direction of perceived motion in an ambiguous signal32, suggesting that fixational eye movements may influence direction discrimination in global motion. However, while some studies have measured coherence thresholds by assessing optokinetic responses to global motion stimuli in children too young to perform direction discrimination tasks (such as infants33 and two-year-olds34), no studies have directly investigated whether fixation stability is predictive of global motion coherence thresholds in amblyopia.
There is theoretical reason to believe that the fixational instability experienced by observers with amblyopia may more severely impact perception of slow- than fast-speed stimuli. Motion detectors tuned to higher spatial frequencies (and thus slower speeds) tend to be smaller than those tuned to lower spatial frequencies (faster speeds)35–37. Consequently, poor fixation stability may be most likely to interfere with good alignment of smaller finely-tuned motion-sensitive receptive fields, because a small positional change in the retina between stimulus animation frames can place a signal dot in a non-corresponding receptive field, effectively reducing the spatial resolution of cells tuned for slower speeds of motion. Larger receptive fields that make coarse matches between a dot in two positions over time, on the other hand, may be robust to some retinal noise. Indeed, minimum motion detection thresholds for random dot patterns, which reflect the smallest spatial displacement that can be reliably detected as motion, are correlated with fixation stability38,39. Thus, if fixation stability does affect coherence thresholds, it may have a selective impact on the perception of stimuli using the smallest spatial displacements, typically corresponding to slower speeds. If this is the case, previous accounts of speed-tuned deficits observed in amblyopia may be more easily explained by eye-movement abnormalities rather than by cortical processing deficits.
Given that less stable fixation is predicted to have a more detrimental effect on slower stimuli, and a common trait in amblyopia is fixation instability, it is possible that speed-tuned deficits in motion perception may be a function of poor fixational stability in people with amblyopia, rather than deficient motion mechanisms per se. Whereas it is already known that observers with amblyopia have less stable eye fixations, it is not known if the degree of stability is associated with the magnitude of global motion deficits. This study was designed to determine whether there is a relationship between fixational stability and performance on a short-duration motion perception task, and whether this relationship holds only for slow speeds. Here, we investigate this relationship in healthy controls and adults who have a history of amblyopia.
Results
Direction discrimination thresholds were assessed for global motion stimuli at slow (1 deg/s) and fast (30 deg/s) speeds (duration 600 ms) while eye position was recorded from one eye while the other eye wore an opaque patch. This short duration was chosen to match that of the stimuli used in a previous study, which showed motion deficits in amblyopia selectively for slow speeds8. Eye position was also recorded for a stationary condition in which a static field of dots was presented for the same duration as a motion stimulus. Control participants’ eyes were compared to the patient group as a function of eye with worst (amblyopic) and best (fellow) visual acuity. Analysis of variance (ANOVA) was performed on coherence thresholds and on fixation stability measures to investigate the between-subjects factor group (amblyopia, control) and within-subjects factor speed (slow, fast). Below, we report key statistics; full ANOVA tables can be found in the Supplementary documentation. Data from the participants with amblyopia are shown plotted by etiology (anisometropic, and strabismic or aniso-strabismic) but no statistics are performed on these subtypes and they do not appear to differ on any of our measures.
Visual assessment
Participants wore their habitual correction during this experiment. Summary measures of visual and stereoacuity are described in Table 1; individual data for the amblyopia group are provided in Table 2 (Methods). Control participants were screened for any ophthalmic, psychiatric or neurological disorders that could affect eye movements (see Methods), but no exclusion criteria were applied based on visual acuity to allow for natural variation on this characteristic. Participants wore their habitual correction. Most participants with amblyopia did not have measurable stereoacuity, and there was not enough variation to warrant further analyses using this measure.
Table 1.
Participant visual acuity and stereoacuity.
| Group | Best/fellow eye acuity, logMAR M (SD), range | Worst/amblyopic eye acuity, logMAR M (SD), range | Interocular difference, logMAR M (SD), range | Stereoacuity, arcsec (n) |
|---|---|---|---|---|
|
Amblyopia (n = 13) |
− 0.03 (0.07) * − 0.16 to 0.11 |
0.54 (0.25) * 0.26 to 0.89 |
0.56 (0.26) * † 0.24 to 0.99 |
nil: 11 100: 1 60: 1 |
|
Control (n = 26) |
− 0.09 (0.07) − 0.20 to 0.05 |
− 0.04 (0.10) − 0.19 to 0.28 |
0.05 (0.05) † 0.00 to 0.23 |
40: 26 |
Amblyopic eye and interocular difference values from one participant with amblyopia excluded (see Table 2); *Significant difference between amblyopia and control group, p ≤ 0.007; †significant difference between the eye with best and worst acuity, p < 0.001.
Table 2.
Clinical details for participants with amblyopia.
| Subtype | Age (years) | AE acuity, logMAR (eye) | FE acuity, logMAR | Stereoacuity, arcsec | Refractive error |
|---|---|---|---|---|---|
| Aniso * | 23 | 0.89 (L) | − 0.10 | NM |
R: + 1.50 + 0.50 × 080 L: + 3.50 + 2.75 × 120 |
| Aniso | 27 | 0.26 (L) | 0.03 | NM |
R: − 0.75 L: + 1.00 + 0.75 × 130 |
| Aniso | 29 | 0.74 (L) | 0.01 | 100 |
R: plano L: + 7.00 + 3.50 × 070 ¶ |
| Aniso * | 42 | 0.26 (R) | − 0.16 | 60 |
R: + 3.25 + 1.75 × 070 L: − 2.00 ¶ |
| Aniso | 48 | 0.51 (L) | − 0.05 | NM |
R: − 2.25 L: + 2.75 + 0.75 × 080 |
| Aniso † | 55 | 0.51 (L) | 0.01 | NM |
R: − 5.25 + 1.00 × 130 L: − 4.50 + 1.00 × 090 |
| Aniso | 56 | NM (R) § | − 0.05 | NM |
R: − 20.0 L: plano |
| Aniso * | 62 | 0.89 (L) | − 0.03 | NM |
R: plano L: + 2.75 |
| Aniso * | 65 | 0.36 (L) | 0.04 | NM |
R: plano L: + 3.00 + 0.50 × 090 |
| Aniso-Strab ‡ | 29 | 0.30 (L) | 0.04 | NM |
R: − 1.75 + 2.25 × 070 L: − 4.00 + 1.25 × 080 ¶ |
| Strab | 47 | 0.40 (R) | − 0.06 | NM | None |
| Strab * | 55 | 0.48 (R) | 0.11 | NM |
R: + 0.50 + 0.50 × 025 L: + 0.50 + 0.75 × 150 |
| Strab † | 61 | 0.88 (R) | − 0.03 | NM | None |
AE = amblyopic eye; FE = fellow eye; NM = not measurable. Unless otherwise indicated, participants underwent occlusion therapy during childhood. *No documented occlusion therapy during childhood. †Cataract surgery at least two years prior to experiment. ‡Strabismus surgery age 9 months. §Participant could detect hand motion but was unable to see the chart or count fingers with their amblyopic eye at 1.5 m, with or without glasses. ¶Participant wore contact lenses during the experiment.
Coherence thresholds
Direction discrimination coherence thresholds are shown in Fig. 1 for each speed, separated by amblyopic (or control worst acuity) and fellow (or control best acuity) eye. One participant with amblyopia was unable to detect the motion stimulus using the amblyopic eye and has no data for these conditions.
Fig. 1.

Mean direction discrimination thresholds for the slow (1 deg/s) and fast (30 deg/s) motion stimuli, separated by amblyopic eye (or eye with worst acuity) and fellow eye (or eye with best acuity). Lower values indicate better performance. Lighter markers indicate individual datapoints. Anisometropic amblyopia in filled triangles; strabismic or ansio-strabismic amblyopia in open triangles. Error bars reflect standard error.
For the amblyopic eye, there were significant main effects of group (p < 0.0001, = 0.30) and speed (p < 0.0001, = 0.31), qualified by a significant group by speed interaction, F(1,36) = 13.85, p < 0.0007, = 0.11). This interaction was driven by a simple main effect of group selective for the slow speed (p < 0.0001), reflecting that observers with amblyopia had significantly elevated thresholds compared to controls when viewing stimuli at the slow speed only (Glass’s δ = 1.92). Thresholds in the slow condition were not significantly predicted by acuity after controlling for group, F(1,35) = 1.75, p = 0.19, nor was there a significant correlation between acuity and thresholds within the amblyopia group alone (p = 0.18). This confirmed that our group of adults with amblyopia showed the same speed-tuned deficit in performance as previously observed in children8 and that poorer acuity on its own does not lead to elevated motion coherence thresholds9.
Similarly, for the fellow eye, there were significant main effects of group (p = 0.014, = 0.12) and speed (p < 0.0001, = 0.17), qualified by a significant group by speed interaction, F(1,37) = 7.98, p < 0.008, = 0.045 that was driven by a simple main effect of group selective for the slow speed (p = 0.001, Glass’s δ = 1.05). This threshold elevation at the slow speed in the fellow eye of adults with amblyopia is also consistent with previous work in children with amblyopia8. As with the amblyopic eye, fellow eye thresholds in the slow condition were not significantly predicted by acuity once controlling for group, F(1,36) = 2.65, p = 0.11, nor was there a significant correlation between acuity and thresholds within the amblyopia group alone (p = 0.29).
Fixation stability
Fixation stability was quantified using the 95% bivariate contour ellipse area (BCEA). This is a measure of dispersion representing the area of an ellipse encompassing 95% of fixation points on each trial, such that a larger value reflects more spread and thus less stable fixation. By convention, the log10 BCEA is calculated for final analysis to mitigate skewness in this variable12–17. After calculating this trial-by-trial measure, we extracted mean stability for trials near each participants’ threshold (defined as trials with coherence levels spanning 0.05 above and below a participant’s calculated threshold), and on high coherence trials (defined as those with coherence levels between 0.8 and 0.9). This allowed us to determine whether differences in stability are consistent regardless of coherence, or if they increase at near-threshold levels where deficits usually become apparent in amblyopia. Full details of this analysis are described in the Methods. We also presented a stationary-dots condition, in which a dot field of the same density was displayed on the screen for the same duration as in motion trials but remained stationary.
Fixation stability during near-threshold and high coherence trials as a function of speed is shown in Fig. 2. For the amblyopic eye, a three-way ANOVA to examine the between-subjects effect of group and within-subjects effects of speed and coherence revealed a significant main effect of group, F(1,36) = 4.63, p = 0.038, = 0.088, reflecting the fact that observers with amblyopia have, on average, less stable fixation across all motion conditions. Group did not interact with any factors. Significant speed (p < 0.0001, = 0.076) and coherence (p = 0.0002, = 0.029) effects were qualified by a significant speed by coherence interaction, F(1,36) = 39.6, p < 0.0001, = 0.067); this was driven by higher BCEA (lower stability) during high coherence compared to near-threshold coherence only for fast stimuli (p < 0.0001, = 0.16). Stability in the fellow eye also showed significant speed (p = 0.005, = 0.036) and coherence (p = 0.014, = 0.023) effects qualified by a significant interaction, F(1,37) = 6.44, p = 0.015, = 0.021; again, this was driven by higher BCEA (lower stability) in high compared to threshold coherence only for fast stimuli (p = 0.004, = 0.11). Notably, there was no main effect of group in the fellow eye (p = 0.84), nor was group involved in any two- or three-way interactions. In summary, observers with amblyopia had less stable fixation than controls when viewing motion stimuli with their amblyopic eye regardless of stimulus speed or coherence, but had typical stability when viewing with the fellow eye.
Fig. 2.

Mean log10 bivariate contour ellipse area (BCEA) in (a) the amblyopic eye or (b) the fellow eye for slow (1 deg/s) and fast (30 deg/s) motion stimuli, separated for trials near each individual’s threshold coherence and trials at high coherence. Lower values indicate greater stability, as gaze points are dispersed over a smaller area. Lighter markers indicate individual datapoints. Anisometropic amblyopia in filled triangles; strabismic or ansio-strabismic amblyopia in open triangles. Error bars reflect standard error.
Higher BCEA values could indicate less stable fixation, or they could result from a motion signal driving a horizontal eye movement. We examined the relationship between motion signal direction and eye movement direction by calculating the mean horizontal eye velocity on each trial, separated into the same near-threshold and high coherence trials as before (Fig. 3). Velocity was normalized to the signal direction, such that positive values indicated movement in the same direction as the motion signal. For the amblyopic eye, there was a significant main effect of speed (p = 0.0004, = 0.088), such that fast motion caused a larger horizontal eye movement in the signal direction than slow motion; and a main effect of coherence (p < 0.0001, = 0.14), such that high-coherence trials caused a larger horizontal eye movement in the signal direction than near-threshold coherence trials. These effects were qualified by a significant speed by coherence interaction, (p = 0.009, = 0.059), driven by the fact that this coherence effect was significantly larger for fast stimuli (p < 0.0001, = 0.21) than for slow stimuli (p = 0.050, = 0.051). There was also an interaction between group and speed (p = 0.015, = 0.040), such that controls showed larger horizontal eye movements in the signal direction than the amblyopia group for slow stimuli (p = 0.022, = 0.084), but there was no difference between groups for fast (p = 0.26). For the fellow eye, there were similar main effects of speed (p = 0.013, = 0.039) and coherence (p = 0.0011, = 0.10). There were no other effects or interactions. Thus, the higher BCEA values shown for higher coherence stimuli and for fast stimuli may be in part due to horizonal eye movements in the signal direction induced by motion signals, but these direction effects do not account for the higher BCEA values (lower stability) seen in the group with amblyopia.
Fig. 3.
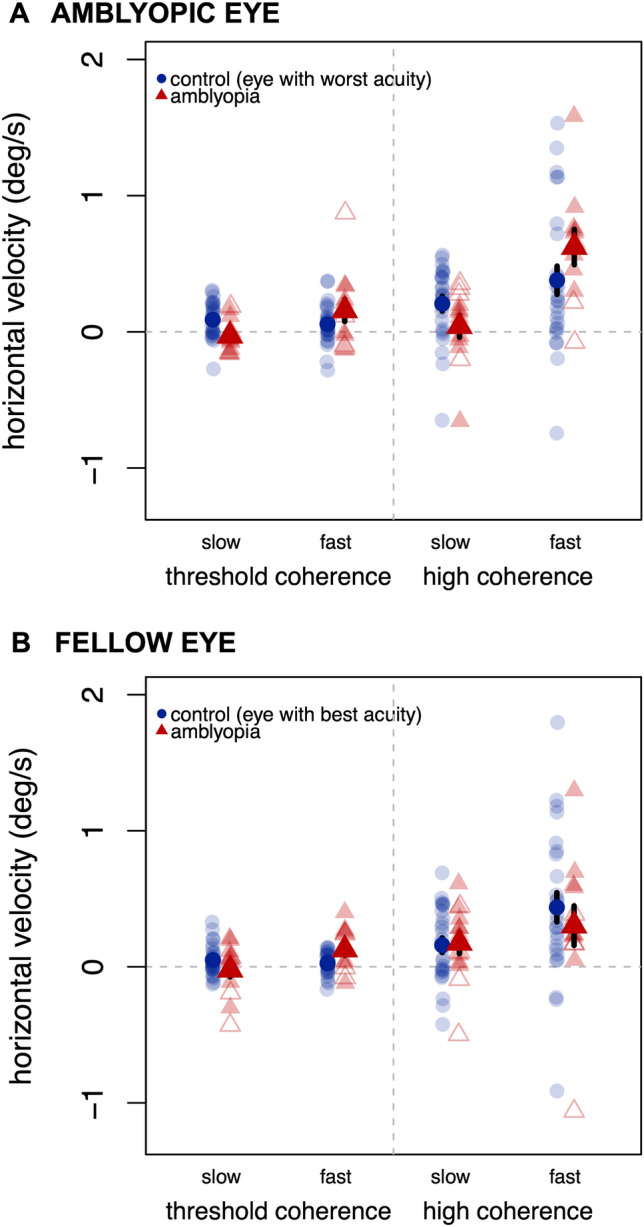
Mean horizontal eye velocity in (a) the amblyopic eye or (b) the fellow eye for slow (1 deg/s) and fast (30 deg/s) motion stimuli, separated for trials near each individual’s threshold coherence and trials at high coherence. Positive values indicate an eye movement in the same direction as the motion signal; negative values in the opposite direction. Lighter markers indicate individual datapoints. Anisometropic amblyopia in filled triangles; strabismic or ansio-strabismic amblyopia in open triangles. Error bars reflect standard error.
The stationary stimulus was intended to act as a control to establish stability under short-duration viewing conditions without motion information. An ANOVA investigating the effects of group and eye on BCEA values showed no effects of group (p = 0.28), eye (p = 0.68), or group by eye interaction (p = 0.15), indicating gaze position stability in observers with amblyopia did not differ from controls for this condition. To compare stability when viewing the stationary stimulus to stability during all motion conditions, we used Bonferroni-corrected pairwise contrasts against each of the motion conditions separately. When using the amblyopic eye, observers with amblyopia showed no difference between stationary and moving stimuli (p = 1 after adjustment) except for the high-coherence fast condition, which had less stability (p = 0.008). Controls showed the opposite pattern: the stationary condition was not different from the high-coherence fast condition (p = 1 after adjustment) but was less stable than the other motion conditions (ps ≤ 0.020). We did not separate this analysis out by group for fellow eyes given that stability in the fellow eye was not different between amblyopia and controls in either ANOVA reported above; again, the stationary condition was not different from the high-coherence fast condition (p = 1 after adjustment) but was less stable than the other motion conditions (ps ≤ 0.008).
In summary, controls and the fellow eye of observers with amblyopia have better stability when viewing motion stimuli at slow speeds regardless of coherence, or at fast speeds at near-threshold coherence, compared to viewing stationary dots. Fixational stability in observers with amblyopia was comparable to controls for stationary stimuli, but these observers did not show better stability for motion stimuli when viewing them with their amblyopic eye. There was no relationship between visual acuity and stability in either eye for all five conditions described above, either within the control (ps ≥ 0.22 after adjustment) or amblyopia group (ps = 1 after adjustment).
Coherence thresholds as a function of fixation stability
The relationships between motion coherence threshold and gaze stability are plotted in Fig. 4 (for the amblyopic eye) and Fig. 5 (for the fellow eye). A positive relationship would indicate that observers with less stable fixation (higher BCEA) tend to have worse perceptual performance (higher thresholds). Because we are attempting to rule out a relationship between the two, we were liberal with our significance testing and did not make adjustments for multiple comparisons. In sum, we found no evidence that degree of fixation stability was related to perceptual performance on this direction discrimination task at either speed for either eye.
Fig. 4.

Motion coherence thresholds as a function of BCEA for slow (top row) and fast (bottom row) speeds, for trials near threshold (left column) and trials at high coherence (right column). Significance figures above are not adjusted for multiple comparisons. Data are from amblyopic eye/control best eye viewing. Colors and symbols are the same as Figs. 1, 2 and 3.
Fig. 5.

Same as Fig. 4, but for fellow eye/control worst eye viewing.
Discussion
The aim of this study was to determine whether fixation stability, which is known to be poor in amblyopia, is worse for slow (1 deg/s) than for fast (30 deg/s) speeds of global motion and could account for amblyopic psychophysical performance with these stimuli.
We found that adults with amblyopia had significantly elevated coherence thresholds for global motion discrimination tasks at slow but not fast speeds, replicating a result previously documented in children using these stimuli8. This deficit appeared in both the amblyopic and the fellow eyes. While observers with amblyopia did show less stable fixation than controls while viewing motion stimuli, this was only the case for the amblyopic eye and did not show the same speed tuning found for the perceptual deficit. In addition, the fellow eye of amblyopic observers, showed fixation stability that was similar to that of control eyes. This is consistent with other work showing fixation stability is typical in fellow eyes, particularly under monocular viewing conditions (reviewed in11).There was no relationship between fixation stability and coherence threshold in any condition tested. Thus we did not find convincing evidence that motion perception deficits in amblyopia are a result of poor fixation stability.
Both groups of observers showed a significant speed effect on coherence thresholds, with better performance (lower thresholds) for the fast speed compared to the slow speed. This effect in controls was expected, and the coherence thresholds obtained here have similar values to prior work using this specific set of spatiotemporal parameters9,40,41. Motion coherence thresholds are non-monotonic as a function of signal dot speed42, with best sensitivity at intermediate speeds; as motion speeds approach the extremes of the slow and fast ranges, thresholds increase until the task becomes impossible. The threshold elevation on the slow end of this spectrum in typical vision may be due to increased similarity to noise at a motion opponency stage43, an increase in internal (observer) noise and reduction in sampling efficiency44, spatial resolution limits for neurons sensitive to slow speeds45, and the fact that there may simply be fewer cells tuned to the slowest speeds46. These factors account for the higher coherence thresholds for our slow condition observed in controls. Observers with amblyopia have even higher coherence thresholds for slow speeds8, which is partly a function of shifts in the peak of the behavioral motion sensitivity function towards larger spatial displacements (faster speeds)47,48. Neurophysiological recordings in amblyopic macaques indicate this tuning shift is represented in MT47, possibly inherited from V148. This tuning shift is also observed in VEPs for the amblyopic eye in humans49. These shifts may be due to poor spatiotemporal resolution for cells tuned to slow speeds; here, we suggest poor stability is not contributing to this decrease in resolution. From a modeling perspective, factors such as the width of speed-tuning curves43, motion filter parameters50, or the size of correspondence noise field pools51 may all be able to account for a reduction in sensitivity to slow-speed signals in amblyopia, or to exacerbate the limiting factors that impact controls. Additional observer factors52 such as increased internal noise or decreased sampling efficiency may also limit perception of motion signals at slow speeds. While we cannot explore these options with the current data, they remain important avenues of investigation.
In both controls and amblyopia participants, fixation was least stable when viewing fast, high coherence stimuli and most stable when viewing slow dots or fast dots at threshold coherence. The decreased stability observed for the fast, high coherence stimuli may reflect the fact that this condition contained the strongest motion signals, likely inducing eye movements such as optokinetic nystagmus (OKN) in the signal direction. These types of reflexive eye movement responses to large-field moving stimuli can be suppressed when a fixation target is provided, but suppression of OKN is not immediate53. Decreasing stimulus coherence weakens the motion signal that drives the OKN, and fixation becomes less dispersed. The velocity limits for OKN depend on a range of spatiotemporal stimulus parameters, but the slow speed of 1 deg/s may be near the lower velocity limit54. Thus, slow-speed signal dots may not be moving fast enough to induce OKN, even at high coherence. Our study was not designed to investigate the relationship between OKN and perceptual thresholds, but rather between fixation stability and perception. We therefore did not explore any potential tracking eye movements that might have occurred in response to high-coherence stimuli. It is well established that the magnitude of tracking eye movements such as smooth pursuit and the OKN or ocular following response are generally aligned with perceived direction and speed of simple dot or coherent pattern motion55,56. Whether the close perception-pursuit relationship is maintained in people with amblyopia, and whether perceptual deficits might be related to deficits in the initiation and maintenance of pursuit and other forms of reflexive tracking, should be investigated systematically in a separate study.
In our stationary-dot pattern condition, we did not find any differences between observers with amblyopia and those from the control group. This was somewhat surprising, but may be due to the relatively short duration of our stimulus (600 ms). Motion perception deficits in amblyopia are often documented using this short duration5,6,8,57,58. This duration is sufficient for measuring fixational eye movements59, and was long enough for detecting poorer stability during amblyopic eye viewing of our motion stimulus. However, this relatively brief presentation interval may have minimized eye movements, leading to a smaller range of obtained values. Previous studies have typically recorded fixation to stationary targets for a duration of at least a few seconds. In our participants, the stationary condition had around − 0.70 log BCEA. This is slightly more stable than other studies comparing amblyopia to controls under monocular viewing conditions, which have reported mean values of − 0.59 log BCEA in control adults fixating for 15 seconds16 and − 0.48 log BCEA in children fixating for 45 s14. Additional studies have reported mean BCEA, so it is not possible to precisely recover log BCEA for comparison, but relative to the estimates reported here, other studies have reported more stable fixation (30 s, adults13) or less stable fixation (30 s, children19 ; 15 s, adults15). Participants with amblyopia in all of these studies, and others measuring binocular viewing conditions, have poorer fixational stability in the amblyopic eye than controls12–19. Thus, while the fixational stability in controls for our short-duration stationary stimuli is generally in agreement with that reported for longer-duration stimuli reported in other studies, fixational stability in amblyopia for these stimuli was better in our sample, and more control-like, compared to longer-duration stimuli reported in other studies.
The current study makes a novel contribution to understanding ocular control in amblyopia by comparing fixational stability for a stationary pattern to stability for random dot motion. The eyes of controls and the fellow eye of observers with amblyopia had less stable fixation while viewing a stationary dot pattern relative to motion stimuli (aside from the high coherence fast stimulus discussed above). This may reflect the decreased attentional demands in this condition, where participants do not need to make a direction-discrimination decision. It is possible that the more involved act of conducting a task promotes greater diligence in maintaining fixation. Compared to viewing stationary targets, engaging in active discrimination tasks appears to partially inhibit microsaccades60, though that study found the corresponding increase in drift and corrective saccades led to an increase in fixation area.
We found that visual acuity was not associated with coherence thresholds or with fixational stability in any condition, including the stationary dot condition. A lack of correlation between acuity and coherence thresholds in healthy observers is consistent with our data previously reported in children8,9. It is known that using lenses to induce poor visual acuity in observers with normal visual acuity does not impact coherence thresholds61, but whether this does62 or does not15 cause unstable fixation is inconsistent, suggesting the two measures are not tightly coupled. Simulating poor fixation stability by introducing position uncertainty in controls does not impact visual acuity at any eccentricity63, although visual acuity in healthy controls can be predicted by eye drift characteristics during a simple fixation task63. Significant relationships between poor stability and poor visual acuity in observers with amblyopia have been reported12–14,19, though not always15–17,21,22. Fixation stability can improve as a function of treatment23,25, and although these improvements are not always associated with acuity gains24, longer patching durations are required to restore visual acuity in patients with fusion maladaptive nystagmus64, a condition associated with high levels of fixation instability.
In summary, we demonstrated that performance on a motion coherence task, at both slow and fast speeds, is not related to fixational stability during the task at high coherence or at near-threshold coherence. Fixation stability cannot account for performance on a global motion task in adults with healthy vision, indicating that poor fixation stability—similar to visual acuity—is unlikely to cause elevated coherence thresholds ipso facto. While fixation was less stable in amblyopic eyes, the magnitude of this elevation was not large ( = 0.09; with an area about 0.24 deg2 greater than both fellow and control eyes), and appeared to occur for all motion stimuli regardless of whether they yielded deficits. Moreover, stability in fellow eyes was not elevated, even in conditions where motion deficits were observed. Thus, motion perception deficits in amblyopia are unlikely to be a consequence of degraded input to the visual system due to poor fixation and reflect changes in higher cortical mechanisms.
Methods
This work was carried out in accordance with the Code of Ethics of the World Medical Association (Declaration of Helsinki) and approved by the University of British Columbia’s Children and Women’s Clinical and Behavioural Ethics Board. Informed consent was obtained from all participants.
Participants
Thirteen adults with a history of amblyopia (10 female) were referred from a clinic affiliated with Vancouver General Hospital. Prior to referral, amblyopia diagnosis (≥ 2 line interocular acuity difference with best optical correction in place) was confirmed by an ophthalmologist. Participants were screened to exclude for any vision disorder aside from amblyopia caused by anisometropia (≥ 1 diopter spherical or ≥ 1.5 diopter astigmatic difference in refractive error) and/or strabismus (presence of heterotropia at near and/or distance) as determined by the referring ophthalmologist. Participants with amblyopia had a mean age of 46.1 years (SD = 14.7, range 23–65).
Thirty-two adults with healthy vision (20 female) were recruited from the greater Vancouver area to participate in this study. Participants were screened to exclude for a history of cognitive, sensory, or neurological disorder, or any report of issues with vision beyond requiring corrective lenses. Participants were not excluded for poor visual acuity, because variation on this measure was useful for the goals of this study. However, data from three participants with stereoacuity worse than 40 arcsec were excluded; and data from two participants were removed for an excessive number of trials with no data due to blinks (see below). One participant had difficulty conducting the task because they would see the motion signal in reverse65; their data were also excluded. The remaining 26 control participants had a mean age of 32.6 years (SD = 11.2, range 20–64).
In previous studies using these stimuli8,9,40 we restricted the adult comparison group to young adults aged 18–30 years. To investigate and control for possible age effects, control participants were first split on a criterion of 30 years into younger (n = 13, M = 24.5 years, SD = 2.8, range = 20–28) and older (n = 13, M = 41.2 years, SD = 11.3, range = 31–64) groups and compared prior to combining; these groups did not significantly differ on any measures.
Apparatus
Prior to initiating the experiment, participants’ visual acuity was assessed with the Regan high-contrast letter chart (Regan, 1988) and stereoacuity was assessed with the Randot Preschool Stereoacuity Test (Stereo Optical Co., Inc.).
Stimuli were generated using an Intel Core i7 Macintosh MacBook Pro running MATLAB R2015a (The MathWorks, Inc.) and the Psychophysics Toolbox extension version 3.0.1266–68. Stimuli were presented on a BenQ XL2420T LED-backlit LCD monitor, set to a resolution of 1920 × 1080 and a refresh rate of 60 Hz.
An Eyelink 1000 (SR Research Ltd., Kanata, ON) video-based eye-tracker was used to monitor monocular gaze position at 1,000 Hz. Participants were seated at a distance of 1 m from the monitor in a dimly-lit room, and used a Gravis Gamepad Pro controller to make responses while their heads were stabilized with a combined chin and forehead rest.
Stimuli and experimental conditions
The stimuli used in this experiment are identical to those described in our previous studies8,9,40. Each stimulus consisted of an array of 64 white dots (260 cd/m2, 1 arcmin diameter), displayed on a black background (0.7 cd/m2). The stimuli occupied a 7.7 × 7.7 deg square area at the center of the screen, resulting in a density of 1.1 dots/deg2 (1.7% of area). At each update of an animation frame (frame duration ∆t = 17 ms), a dot was selected to be a signal dot with a probability equal to the coherence value, which ranged from 0 to 1. Signal dots moved either left or right on each frame update with a spatial displacement (∆x) described below, and the remaining noise dots were repositioned in a random location (white noise). The lifetime of signal dots was determined probabilistically, so the likelihood of each signal dot disappearing matched the stimulus coherence level for that trial. The stimulus duration was 600 ms.
Two speed conditions were presented, using frame displacement parameters ∆x = 1 arcmin (for slow) and ∆x = 30 arcmin (for fast). These are a subset of conditions from our previous studies: the slow stimulus corresponds to a condition from the previous studies where deficits in performance in children with amblyopia8 or immature performance in typically-developing children9 were observed; the fast stimulus corresponds to a condition from these previous studies where no differences in performance were observed. Additionally, a control condition was included in which dots appeared on the screen for the same duration, but remained stationary.
Each condition was conducted monocularly, with the other eye patched. Data from control participant eyes were kept separate for analysis and grouped by acuity such that the eye with better acuity is described below as the amblyopic-control, and the eye with worst acuity as the fellow-control. One control participant had equal acuity between the two eyes, and the left eye was selected at random to be labeled fellow-control.
Procedure
A two-alternative forced choice direction discrimination task was used to assess coherence thresholds while gaze position was tracked. A two-down, one-up staircase was used to control stimulus coherence level. The first trial began at full coherence and was reduced after two correct responses, or increased after one incorrect response. Stimulus coherence was adjusted in steps of 0.1 for the first three response reversals after which the step size was halved at each reversal until a minimum step of 0.05 was reached. Motion staircases consisted of 70 trials each. For the stationary condition, 50 trials of a stationary dot stimulus were presented in one block.
The trial sequence is shown in Fig. 6. At the beginning of each trial, a fixation cross (1 deg width) was presented in the center of the screen. Participants were asked to keep their eye on the cross and press a button on the controller to advance the trial when they were ready. A gaze-contingent display was used to ensure participants were viewing the centre of the display when they pressed this button: if they were not, the next trial would not advance. The stimulus appeared for 600 ms while the fixation cross remained on the screen. The fixation cross was then replaced with a question mark, prompting a response from the participant. In the motion conditions, participants were asked to decide if the stimulus moved left or right and press the corresponding button on the response pad; in the stationary condition, participants were asked to make a response even though there was no movement by pressing a direction button of their choice. Feedback was provided as an image of a cartoon character accompanied by an auditory chime after a correct response in the motion conditions (or any response in the stationary condition); or a different cartoon character accompanied by no sound after an incorrect response in the motion conditions.
Fig. 6.

Trial sequence. Motion stimulus is schematic and not representative of dot size or density; see in-text for details.
Before beginning experimental trials, participants first conducted 8 binocular practice trials using the parameters ∆x = 15 arcmin and ∆t = 33 ms. All subsequent trials were conducted monocularly with the gaze position of the viewing eye being recorded while the non-viewing eye was occluded with an opaque eye patch. A nine-point calibration procedure was conducted with the eye-tracker prior to beginning each run of a motion staircase or block of stationary trials.
Condition order across participants (left or right eye; slow motion, fast motion, or stationary stimulus) was balanced using a Latin square. For the motion conditions, participants completed each eye × condition pairing twice, so that there were 140 trials of data from two staircases for each eye in the fast and slow conditions. In the stationary condition, each run consisted of 50 trials conducted once for each eye.
Behavioral measures
Thresholds were calculated by fitting a Weibull function to all 140 trials from the two staircases per condition using a maximum-likelihood minimization bootstrap procedure (Paladmedes toolbox69). In addition to an overall coherence threshold, trial-by-trial information on stimulus coherence, motion direction, responded direction, and accuracy were extracted to compare against trial-by-trial gaze measures.
Eye movement measures
All trials that contained any blinks or dropped samples were excluded from further analysis. Two control participants were excluded for missing data from greater than 15% of all trials they conducted. The remaining participants had very few trials with missing data (M = 2% of all trials per control participant, 3% of all trials per participant with amblyopia).
Gaze data were pre-processed offline using custom MATLAB scripts. First, a second-order low pass Butterworth filter with cutoff frequencies of 20 and 40 Hz, for position and velocity respectively, was applied to the raw gaze data. Then, for each trial, the 95% bivariate contour ellipse area (BCEA), in deg2, was determined70. The BCEA is a value that quantifies an elliptical area around which 95% of gaze positions fall, following the equation:
| 1 |
where X2 is the chi-square value corresponding to the percentile of interest (in this case, 95%), and H and V are vectors of the horizontal and vertical gaze positions for a trial. A larger BCEA value reflects less stable fixation during a trial than a smaller BCEA value. By convention, the log10 BCEA is calculated for final analysis to mitigate skewness in this variable.
After calculating these trial-by-trial measures, three participant-level stability measures were extracted to compare against behavioural measures: stability during high coherence trials, during threshold coherence trials, and during stationary trials. A participant’s mean log10 BCEA for high coherence stimuli was calculated for trials with coherence levels between 0.8 and 0.9. All participants obtained 100% accuracy on these trials aside from one who obtained 95% and two who obtained 97% accuracy, confirming direction discrimination for high coherence stimuli was not difficult. Mean log10 BCEA for trials presented at threshold coherence was defined as trials with coherence levels spanning 0.05 above and below a participant’s calculated threshold (for example, for a threshold of 0.21 this includes trials with coherence of 0.16 to 0.26). Participants’ mean accuracy on the trials used in this analysis was 79% for both controls and participants with amblyopia, indicating the + /- span of 0.05 was appropriate to capture near-threshold (80%) conditions. Mean log10 BCEA was also calculated for all stationary trials; this condition had no psychophysical accuracy measures. Each of these measures were calculated independently for the left and right eye.
Finally, we also examined whether motion stimuli induced an eye movement in the direction of the motion signal by calculating the trial-by-trial mean velocity of eye movements in the horizontal direction. Velocity (deg/s) was normalized to the motion signal direction, such that values are positive when the motion signal and eye movement are in the same direction, and negative when they are in the opposite directions. Two participant-level direction measures were extracted: mean horizontal velocity during high coherence trials, and during threshold coherence trials. Each of these measures were calculated independently for the left and right eye, and the same trial bins were used for this analysis as in the stability analysis described above.
Statistical analysis
Statistical analyses were carried out using R version 4.3.371 with the help of packages dplyr72, emmeans73, and rstatix74. Analyses of variance (ANOVAs) were performed to assess the main effects of speed (within: slow, fast) and group (between: amblyopia, control), as well as their interaction, on coherence thresholds and on fixation stability. Subjects were included as random factors. Effect sizes for ANOVA results were quantified using generalized eta squared (). Significant interactions were probed with simple main effects analyses using Bonferroni-corrected pairwise comparisons of the estimated marginal means for the two groups at each speed; these effects were quantified using Glass’s δ with the control group standard deviation for reference.
Supplementary Information
Acknowledgements
The authors would like to thank Kevin Chang, Violet Chu, Farnaz Javadian, Laveniya Kugathasan, and Yousef Shahin for assistance with data collection.
Author contributions
Conceptualization: KM, DG; Methodology: KM, DG, MS; Software: KM, MS; Formal analysis: KM, DG, MS; Resources: SW, DG, MS; Writing–Original Draft: KM; Writing–Reviewing & Editing: KM, SW, DG, MS; Visualization: KM; Funding: DG.
Data availability
The data and scripts for analysis that support the findings of this study are available upon reasonable request to the corresponding author, Kimberly Meier, kmeier@uh.edu.
Declarations
Competing interests
The authors declare no competing interests.
Footnotes
Publisher’s note
Springer Nature remains neutral with regard to jurisdictional claims in published maps and institutional affiliations.
Supplementary Information
The online version contains supplementary material available at 10.1038/s41598-024-83624-9.
References
- 1.Birch, E. E. Amblyopia and binocular vision. Prog. Retin. Eye Res.33, 67–84. 10.1016/j.preteyeres.2012.11.001 (2013). [DOI] [PMC free article] [PubMed] [Google Scholar]
- 2.Levi, D. M. Crowding—an essential bottleneck for object recognition: A mini-review. Vis. Res.48, 635–654. 10.1016/j.visres.2007.12.009 (2008). [DOI] [PMC free article] [PubMed] [Google Scholar]
- 3.McKee, S. P., Levi, D. M. & Movshon, J. A. The pattern of visual deficits in amblyopia. J. Vis.3, 380–405. 10.1167/3.5.5 (2003). [DOI] [PubMed] [Google Scholar]
- 4.Baker, D. H., Meese, T. S. & Hess, R. F. Contrast masking in strabismic amblyopia: Attenuation, noise, interocular suppression and binocular summation. Vis. Res.48, 1625–1640. 10.1016/j.visres.2008.04.017 (2008). [DOI] [PubMed] [Google Scholar]
- 5.Hayward, J., Truong, G., Partanen, M. & Giaschi, D. Effects of speed, age, and amblyopia on the perception of motion-defined form. Vis. Res.51, 2216–2223. 10.1016/j.visres.2011.08.023 (2011). [DOI] [PubMed] [Google Scholar]
- 6.Ho, C. S. et al. Deficient motion perception in the fellow eye of amblyopic children. Vis. Res.45, 1615–1627. 10.1016/j.visres.2004.12.009 (2005). [DOI] [PubMed] [Google Scholar]
- 7.Ho, C. S. & Giaschi, D. E. Deficient maximum motion displacement in amblyopia. Vis. Res.46, 4595–4603. 10.1016/j.visres.2006.09.025 (2006). [DOI] [PubMed] [Google Scholar]
- 8.Meier, K., Sum, B. & Giaschi, D. Global motion perception in children with amblyopia as a function of spatial and temporal stimulus parameters. Vis. Res.127, 18–27. 10.1016/j.visres.2016.06.011 (2016). [DOI] [PubMed] [Google Scholar]
- 9.Meier, K. & Giaschi, D. Effect of spatial and temporal stimulus parameters on the maturation of global motion perception. Vis. Res.135, 1–9. 10.1016/j.visres.2017.04.004 (2017). [DOI] [PubMed] [Google Scholar]
- 10.Ghasia, F. & Wang, J. Amblyopia and fixation eye movements. J Neurol. Sci.441, 120373. 10.1016/j.jns.2022.120373 (2022). [DOI] [PubMed] [Google Scholar]
- 11.Niechwiej-Szwedo, E., Colpa, L. & Wong, A. M. F. Visuomotor behaviour in amblyopia: Deficits and compensatory adaptations. Neural. Plast.2019, 6817839. 10.1155/2019/6817839 (2019). [DOI] [PMC free article] [PubMed] [Google Scholar]
- 12.Subramanian, V., Jost, R. M. & Birch, E. E. A quantitative study of fixation stability in amblyopia. Invest. Ophthalmol. Vis. Sci.54, 1998–2003. 10.1167/iovs.12-11054 (2013). [DOI] [PMC free article] [PubMed] [Google Scholar]
- 13.Chung, S. T., Kumar, G., Li, R. W. & Levi, D. M. Characteristics of fixational eye movements in amblyopia: Limitations on fixation stability and acuity?. Vis. Res.114, 87–99. 10.1016/j.visres.2015.01.016 (2015). [DOI] [PMC free article] [PubMed] [Google Scholar]
- 14.Shaikh, A. G., Otero-Millan, J., Kumar, P. & Ghasia, F. F. Abnormal fixational eye movements in amblyopia. PLoS One11, e0149953. 10.1371/journal.pone.0149953 (2016). [DOI] [PMC free article] [PubMed] [Google Scholar]
- 15.Raveendran, R. N., Bobier, W. & Thompson, B. Reduced amblyopic eye fixation stability cannot be simulated using retinal-defocus-induced reductions in visual acuity. Vis. Res.154, 14–20. 10.1016/j.visres.2018.10.005 (2019). [DOI] [PubMed] [Google Scholar]
- 16.González, E. G., Wong, A. M., Niechwiej-Szwedo, E., Tarita-Nistor, L. & Steinbach, M. J. Eye position stability in amblyopia and in normal binocular vision. Invest. Ophthalmol. Vis. Sci.53, 5386–5394. 10.1167/iovs.12-9941 (2012). [DOI] [PubMed] [Google Scholar]
- 17.Kelly, K. R., Cheng-Patel, C. S., Jost, R. M., Wang, Y. Z. & Birch, E. E. Fixation instability during binocular viewing in anisometropic and strabismic children. Exp. Eye Res.183, 29–37. 10.1016/j.exer.2018.07.013 (2019). [DOI] [PMC free article] [PubMed] [Google Scholar]
- 18.Dulaney, C. S., Murray, J. & Ghasia, F. Contrast sensitivity, optotype acuity and fixation eye movement abnormalities in amblyopia under binocular viewing. J. Neurol. Sci.451, 120721. 10.1016/j.jns.2023.120721 (2023). [DOI] [PubMed] [Google Scholar]
- 19.Birch, E. E., Subramanian, V. & Weakley, D. R. Fixation instability in anisometropic children with reduced stereopsis. J AAPOS17, 287–290. 10.1016/j.jaapos.2013.03.011 (2013). [DOI] [PMC free article] [PubMed] [Google Scholar]
- 20.Vikesdal, G. H. & Langaas, T. Optically induced refractive errors reduces fixation stability but saccade latency remains stable (2016).
- 21.Shi, X. F. et al. Fixational saccadic eye movements are altered in anisometropic amblyopia. Restor. Neurol. Neurosci.30, 445–462. 10.3233/RNN-2012-129000 (2012). [DOI] [PubMed] [Google Scholar]
- 22.Raveendran, R. N., Babu, R. J., Hess, R. F. & Bobier, W. R. Transient improvements in fixational stability in strabismic amblyopes following bifoveal fixation and reduced interocular suppression. Ophthalmic Physiol. Opt.34, 214–225. 10.1111/opo.12119 (2014). [DOI] [PubMed] [Google Scholar]
- 23.Aizenman, A. M. & Levi, D. M. Fixational stability as a measure for the recovery of visual function in amblyopia. Proc. Eye Track Res. Appl. Symp.10.1145/3450341.3458493 (2021). [DOI] [PMC free article] [PubMed] [Google Scholar]
- 24.Wang, S. et al. Fixation stability improvement after occlusion treatment for severe amblyopia. Int. Ophthalmol.42, 1007–1012. 10.1007/s10792-021-02084-6 (2022). [DOI] [PubMed] [Google Scholar]
- 25.Carpineto, P. et al. Fixation patterns evaluation by means of MP-1 microperimeter in microstrabismic children treated for unilateral amblyopia. Eur. J. Ophthalmol.17, 885–890. 10.1177/112067210701700603 (2007). [DOI] [PubMed] [Google Scholar]
- 26.Leigh, R. J. & Zee, D. S. The Neurology of eye Movements 5th edn. (Oxford University Press, Oxford, 2015). [Google Scholar]
- 27.Rucci, M. & Poletti, M. Control and functions of fixational eye movements. Annu. Rev. Vis. Sci.1, 499–518. 10.1146/annurev-vision-082114-035742 (2015). [DOI] [PMC free article] [PubMed] [Google Scholar]
- 28.Martinez-Conde, S., Otero-Millan, J. & Macknik, S. L. The impact of microsaccades on vision: Towards a unified theory of saccadic function. Nat. Rev. Neurosci.14, 83–96. 10.1038/nrn3405 (2013). [DOI] [PubMed] [Google Scholar]
- 29.Rolfs, M. Microsaccades: small steps on a long way. Vis. Res.49, 2415–2441. 10.1016/j.visres.2009.08.010 (2009). [DOI] [PubMed] [Google Scholar]
- 30.Malevich, T., Buonocore, A. & Hafed, Z. M. Rapid stimulus-driven modulation of slow ocular position drifts. Elife10.7554/eLife.57595 (2020). [DOI] [PMC free article] [PubMed] [Google Scholar]
- 31.Khademi, F. et al. Visual feature tuning properties of short-latency stimulus-driven ocular position drift responses during gaze fixation. J Neurosci.10.1523/JNEUROSCI.1815-23.2024 (2024). [DOI] [PMC free article] [PubMed] [Google Scholar]
- 32.Laubrock, J., Engbert, R. & Kliegl, R. Fixational eye movements predict the perceived direction of ambiguous apparent motion. J Vis8(13), 11–17. 10.1167/8.14.13 (2008). [DOI] [PubMed] [Google Scholar]
- 33.Blumenthal, E. J., Bosworth, R. G. & Dobkins, K. R. Fast development of global motion processing in human infants. J. Vis.13, 8. 10.1167/13.13.8 (2013). [DOI] [PMC free article] [PubMed] [Google Scholar]
- 34.Yu, T. Y. et al. Global motion perception in 2-year-old children: A method for psychophysical assessment and relationships with clinical measures of visual function. Invest. Ophthalmol. Vis. Sci.54, 8408–8419. 10.1167/iovs.13-13051 (2013). [DOI] [PMC free article] [PubMed] [Google Scholar]
- 35.Mikami, A., Newsome, W. T. & Wurtz, R. H. Motion selectivity in macaque visual cortex. II. Spatiotemporal range of directional interactions in MT and V1. J. Neurophysiol.55, 1328–1339. 10.1152/jn.1986.55.6.1328 (1986). [DOI] [PubMed] [Google Scholar]
- 36.Grzywacz, N. M. & Yuille, A. L. A model for the estimate of local image velocity by cells in the visual cortex. Proc. R. Soc. Lond. B Biol. Sci.239, 129–161. 10.1098/rspb.1990.0012 (1990). [DOI] [PubMed] [Google Scholar]
- 37.Fredericksen, R. E., Verstraten, F. A. & van de Grind, W. A. Spatial summation and its interaction with the temporal integration mechanism in human motion perception. Vis. Res.34, 3171–3188. 10.1016/0042-6989(94)90082-5 (1994). [DOI] [PubMed] [Google Scholar]
- 38.Murakami, I. Eye movements during fixation as velocity noise in minimum motion detection. Jpn. Psychol. Res.52, 54–66 (2010). [Google Scholar]
- 39.Tong, J., Lien, T. C., Cisarik, P. M. & Bedell, H. E. Motion sensitivity during fixation in straight-ahead and lateral eccentric gaze. Exp. Brain Res.190, 189–200. 10.1007/s00221-008-1462-1 (2008). [DOI] [PubMed] [Google Scholar]
- 40.Meier, K. & Giaschi, D. The maturation of global motion perception depends on the spatial and temporal offsets of the stimulus. Vis. Res.95, 61–67. 10.1016/j.visres.2013.12.007 (2014). [DOI] [PubMed] [Google Scholar]
- 41.Shahin, Y. M., Meier, K. & Giaschi, D. Effect of visual field location on global motion perception: A developmental study. Perception49, 733–748. 10.1177/0301006620930901 (2020). [DOI] [PubMed] [Google Scholar]
- 42.Fredericksen, R. E., Verstraten, F. A. & van de Grind, W. A. Spatio-temporal characteristics of human motion perception. Vis. Res.33, 1193–1205. 10.1016/0042-6989(93)90208-e (1993). [DOI] [PubMed] [Google Scholar]
- 43.van Boxtel, J. J. & Erkelens, C. J. A single motion system suffices for global-motion perception. Vis. Res.46, 4634–4645. 10.1016/j.visres.2006.06.015 (2006). [DOI] [PubMed] [Google Scholar]
- 44.Bogfjellmo, L. G., Bex, P. J. & Falkenberg, H. K. Reduction in direction discrimination with age and slow speed is due to both increased internal noise and reduced sampling efficiency. Invest. Ophthalmol. Vis. Sci.54, 5204–5210. 10.1167/iovs.13-12005 (2013). [DOI] [PMC free article] [PubMed] [Google Scholar]
- 45.Lappin, J. S., Tadin, D., Nyquist, J. B. & Corn, A. L. Spatial and temporal limits of motion perception across variations in speed, eccentricity, and low vision. J. Vis.9(30), 31–14. 10.1167/9.1.30 (2009). [DOI] [PubMed] [Google Scholar]
- 46.Priebe, N. J., Lisberger, S. G. & Movshon, J. A. Tuning for spatiotemporal frequency and speed in directionally selective neurons of macaque striate cortex. J. Neurosci.26, 2941–2950. 10.1523/JNEUROSCI.3936-05.2006 (2006). [DOI] [PMC free article] [PubMed] [Google Scholar]
- 47.El-Shamayleh, Y., Kiorpes, L., Kohn, A. & Movshon, J. A. Visual motion processing by neurons in area MT of macaque monkeys with experimental amblyopia. J. Neurosci.30, 12198–12209. 10.1523/JNEUROSCI.3055-10.2010 (2010). [DOI] [PMC free article] [PubMed] [Google Scholar]
- 48.Kiorpes, L., Tang, C. & Movshon, J. A. Sensitivity to visual motion in amblyopic macaque monkeys. Vis Neurosci23, 247–256. 10.1017/S0952523806232097 (2006). [DOI] [PubMed] [Google Scholar]
- 49.Hou, C., Pettet, M. W. & Norcia, A. M. Abnormalities of coherent motion processing in strabismic amblyopia: Visual-evoked potential measurements. J. Vis.8(2), 1–12. 10.1167/8.4.2 (2008). [DOI] [PMC free article] [PubMed] [Google Scholar]
- 50.Adelson, E. H. & Bergen, J. R. Spatiotemporal energy models for the perception of motion. J. Opt. Soc. Am. A.2, 284–299. 10.1364/josaa.2.000284 (1985). [DOI] [PubMed] [Google Scholar]
- 51.Barlow, H. & Tripathy, S. P. Correspondence noise and signal pooling in the detection of coherent visual motion. J. Neurosci.17, 7954–7966. 10.1523/JNEUROSCI.17-20-07954.1997 (1997). [DOI] [PMC free article] [PubMed] [Google Scholar]
- 52.Dakin, S. C., Mareschal, I. & Bex, P. J. Local and global limitations on direction integration assessed using equivalent noise analysis. Vis. Res.45, 3027–3049. 10.1016/j.visres.2005.07.037 (2005). [DOI] [PubMed] [Google Scholar]
- 53.Wyatt, H. J. & Pola, J. A mechanism for suppression of optokinesis. Vis. Res.24, 1931–1945. 10.1016/0042-6989(84)90027-0 (1984). [DOI] [PubMed] [Google Scholar]
- 54.Schor, C. & Narayan, V. The influence of field size upon the spatial frequency response of optokinetic nystagmus. Vis. Res.21, 985–994. 10.1016/0042-6989(81)90002-x (1981). [DOI] [PubMed] [Google Scholar]
- 55.Spering, M. & Montagnini, A. Do we track what we see? Common versus independent processing for motion perception and smooth pursuit eye movements: a review. Vis. Res.51, 836–852. 10.1016/j.visres.2010.10.017 (2011). [DOI] [PubMed] [Google Scholar]
- 56.Kreyenmeier, P., Kumbhani, R., Movshon, J. A. & Spering, M. Shared Mechanisms drive ocular following and motion perception. eNeuro.10.1523/ENEURO.0204-24.2024 (2024). [DOI] [PMC free article] [PubMed] [Google Scholar]
- 57.Birch, E. E., Jost, R. M., Wang, Y. Z., Kelly, K. R. & Giaschi, D. E. Impaired fellow eye motion perception and abnormal binocular function. Invest. Ophthalmol. Vis. Sci.60, 3374–3380. 10.1167/iovs.19-26885 (2019). [DOI] [PMC free article] [PubMed] [Google Scholar]
- 58.Giaschi, D., Chapman, C., Meier, K., Narasimhan, S. & Regan, D. The effect of occlusion therapy on motion perception deficits in amblyopia. Vis. Res.114, 122–134. 10.1016/j.visres.2015.05.015 (2015). [DOI] [PubMed] [Google Scholar]
- 59.Martinez-Conde, S., Macknik, S. L. & Hubel, D. H. The role of fixational eye movements in visual perception. Nat. Rev. Neurosci.5, 229–240. 10.1038/nrn1348 (2004). [DOI] [PubMed] [Google Scholar]
- 60.Bowers, N. R., Gautier, J., Lin, S. & Roorda, A. Fixational eye movements in passive versus active sustained fixation tasks. J. Vis.21, 16. 10.1167/jov.21.11.16 (2021). [DOI] [PMC free article] [PubMed] [Google Scholar]
- 61.Zwicker, A. E., Hoag, R. A., Edwards, V. T., Boden, C. & Giaschi, D. E. The effects of optical blur on motion and texture perception. Optom. Vis. Sci83, 382–390. 10.1097/01.opx.0000222919.21909.1e (2006). [DOI] [PubMed] [Google Scholar]
- 62.Vikesdal, G. H. & Langaas, T. Optically induced refractive errors reduces fixation stability but saccade latency remains stable. J. Eye Mov. Res.9, 8. 10.16910/jemr.9.7.3 (2016). [Google Scholar]
- 63.Falkenberg, H. K., Rubin, G. S. & Bex, P. J. Acuity, crowding, reading and fixation stability. Vis. Res.47, 126–135. 10.1016/j.visres.2006.09.014 (2007). [DOI] [PubMed] [Google Scholar]
- 64.Scaramuzzi, M. et al. Fixation instability in amblyopia: Oculomotor disease biomarkers predictive of treatment effectiveness. Prog. Brain Res.249, 235–248. 10.1016/bs.pbr.2019.04.024 (2019). [DOI] [PMC free article] [PubMed] [Google Scholar]
- 65.Manning, C., Meier, K. & Giaschi, D. The reverse motion illusion in random dot motion displays and implications for understanding development. J. Illusion.10.47691/joi.v3.7916 (2022). [DOI] [PMC free article] [PubMed] [Google Scholar]
- 66.Kleiner, M., Brainard, D. & Pelli, D. What’s new in Psychtoolbox-3?. Perception36, 14 (2007). [Google Scholar]
- 67.Pelli, D. G. The VideoToolbox software for visual psychophysics: Transforming numbers into movies. Spat. Vis.10, 437–442 (1997). [PubMed] [Google Scholar]
- 68.Brainard, D. H. The psychophysics toolbox. Spat. Vis.10, 433–436 (1997). [PubMed] [Google Scholar]
- 69.Prins, N. & Kingdom, F. A. A. Applying the model-comparison approach to test specific research hypotheses in psychophysical research using the palamedes toolbox. Front. Psychol.9, 1250. 10.3389/fpsyg.2018.01250 (2018). [DOI] [PMC free article] [PubMed] [Google Scholar]
- 70.Castet, E. & Crossland, M. Quantifying eye stability during a fixation task: a review of definitions and methods. Seeing Perceiving25, 449–469. 10.1163/187847611X620955 (2012). [DOI] [PubMed] [Google Scholar]
- 71.R Core Team. R: A Language and Environment for Statistical Computing (R Foundation for Statistical Computing, Vienna, 2024). [Google Scholar]
- 72.Wickham, H., François, R., Henry, L., Müller, K. & Vaughan, D. dplyr: A grammar of data manipulation. https://CRAN.R-project.org/package=dplyr (2023).
- 73.Lenth, R. V. emmeans: Estimated marginal means, aka least-squares means. https://CRAN.R-project.org/package=emmeans (2024).
- 74.Kassambara, A. rstatix: Pipe-friendly framework for basic statistical tests. https://CRAN.R-project.org/package=rstatix (2023).
Associated Data
This section collects any data citations, data availability statements, or supplementary materials included in this article.
Supplementary Materials
Data Availability Statement
The data and scripts for analysis that support the findings of this study are available upon reasonable request to the corresponding author, Kimberly Meier, kmeier@uh.edu.