

Abstract
The current work introduces the hybrid ensemble framework for the detection and segmentation of colorectal cancer. This framework will incorporate both supervised classification and unsupervised clustering methods to present more understandable and accurate diagnostic results. The method entails several steps with CNN models: ADa-22 and AD-22, transformer networks, and an SVM classifier, all inbuilt. The CVC ClinicDB dataset supports this process, containing 1650 colonoscopy images classified as polyps or non-polyps. The best performance in the ensembles was done by the AD-22 + Transformer + SVM model, with an AUC of 0.99, a training accuracy of 99.50%, and a testing accuracy of 99.00%. This group also saw a high accuracy of 97.50% for Polyps and 99.30% for Non-Polyps, together with a recall of 97.80% for Polyps and 98.90% for Non-Polyps, hence performing very well in identifying both cancerous and healthy regions. The framework proposed here uses K-means clustering in combination with the visualisation of bounding boxes, thereby improving segmentation and yielding a silhouette score of 0.73 with the best cluster configuration. It discusses how to combine feature interpretation challenges into medical imaging for accurate localization and precise segmentation of malignant regions. A good balance between performance and generalization shall be done by hyperparameter optimization-heavy learning rates; dropout rates and overfitting shall be suppressed effectively. The hybrid schema of this work treats the deficiencies of the previous approaches, such as incorporating CNN-based effective feature extraction, Transformer networks for developing attention mechanisms, and finally the fine decision boundary of the support vector machine. Further, we refine this process via unsupervised clustering for the purpose of enhancing the visualisation of such a procedure. Such a holistic framework, hence, further boosts classification and segmentation results by generating understandable outcomes for more rigorous benchmarking of detecting colorectal cancer and with higher reality towards clinical application feasibility.
Keywords: Colorectal cancer, Integrated CNNs, Transformers, Support vector machines, K-Means clustering
Subject terms: Cardiology, Health care, Engineering
Introduction
CRC is one of the most common kinds of cancer and, on the whole, remains an important health-care problem because mortality in such high quantities remains associated with this type of cancer. According to our estimate, in 2024, the world will register 2.2 million new cases and 1.1 million deaths due to CRC. High rates of CRC have been reported in countries with high incomes: Australia, New Zealand, and parts of Europe1. There are about 40 to 50 cases documented per 100,000 population. Much of the hardship falls on areas such as elderly people and diets heavy in processed and red meats, among other risks including obesity and a lack of activity. Lower percentages of patients with CRC are estimated to range from 4.4 to 10 cases per 100,000 population in low- and middle-income populations. This is mainly because of urbanization, changes in Western diets, and increased life spans wherein the disease is being increasingly reported in such regions2. The disease risk factors are attributed to particular ones like smoking, diet, high alcohol consumption, and physical inactivity. Some other associative risk factors include genetic predisposition and IBD3.
Although the rate of incidence for colorectal cancer is much smaller than that for Western populations it has surged over the last few decades very particularly amongst urbanized people where changed dietary habits and decreased physical activity is becoming increasingly common. It has been projected that the incidence rates of CRC will increase in the near future, and this disease will possess higher incidence rates in its northeastern and southern regions. At present, the incidence of CRC in India is 4.4/100,000, which is very low compared to that in the West; however, it is mounting upward due to urbanization and lifestyle changes4, 5. Besides, the prevailing rate of CRC among Indian youth is mounting, thereby showing a demographic transition as compared with developed countries where the disease is more common among the aged population6. Nevertheless, despite the rapidly increasing number of cases, India's health care infrastructure is still in the process of developing its capability to manage this increase. In such places as the United States, Germany, and Japan, screening programs are already much more developed, with therefore greater access to early treatment, which has helped increase survival rates considerably as compared with others7, 8. These inequalities require more awareness about CRC, more screening programs in India, and better health care services to combat this growing medical issue9.
Among these colorectal carcinoma screening modalities, are the following: FOBT, FIT, sigmoidoscopy and CT colonography or virtual colonoscopy each filling an important role, of course, in the process of early detection and prevention10. Of course, unmatched in the ability to identify and treat both precancerous polyps and malignant growths, colonoscopy has won the title of the gold standard among these procedures. Unlike any other indirect or partial imaging technique because of direct visualization of the whole colon and rectum, it is unique. A diagnostic tool as well as preventive allows abnormalities to be identified in the same setting so that excision or biopsy may be performed. In practice, the exceptional sensitivity of this technique for lesions greater than 1 cm effectively negates the progression of colorectal cancer. For instance, colonoscopy has proven that it detects more than 95 percent of the high-risk lesions, which is more sensitive than other preventive measures of screening11,12. Besides, colonoscopy diagnoses not only colon cancer but also some gastrointestinal diseases. Therefore, this procedure is a significant care for digestive health.
Colonoscopy has been well accepted by countries like United States, Germany, and Japan as an established screening modality and is highly recommended at age 45–5013. Widespread use of colonoscopy throughout most parts of these countries has had a tremendous effect on the reduction of incidence and mortality of colorectal cancer in these countries. Thus, people with a family history regarding colorectal cancer or symptoms such as gastrointestinal bleeding are suggested to undergo the treatment as soon as possible14. Such a high sensitivity along with potential prevention and correlation of detection with timely intervention makes the most effective mode of screening. Organizations such as the American Cancer Society have advocated routine checks starting from age 45 as cases of colorectal cancer are increasingly common in young people15. This therefore makes it very essential to detect diseases at a relatively younger age when it will be treatable.
AI, ML, and DL together have brought a sea change in diagnosis of colorectal cancer, especially with computer vision algorithms used for analysis over images from colonoscopy16. Rigid preprocessing removing noise, normalization, scaling transforms the raw datasets used in training sophisticated ML and DL models from these images17. In this work, we are practicing preprocessing on the dataset to improve accuracy about AI models in detecting colorectal anomalies. CNNs worked out to be a good feature extraction as well as pattern detection technique in this field. Integrate CNNs, based on models such as ResNet, DenseNet, and VGG, for the better efficiency of classification in such scenarios. It is the capability of one model to exploit the strengths of the other. The most precious thing about early diagnosis of colorectal cancer that these networks are capable of picking minute differences between regions of healthy tissue and cancerous tissue.
Unlike CNNs, transformer networks are well-explored to have focus mechanism and zooming capability over critical regions concerning cancerous tissue in colonoscopy images with ensemble models18. But when combined with CNN, transformers identify malignant tissue much more precisely than CNN due to finer categorization. Finally, SVM will be applied for binary and multi-class classification for the detection and classification of those cancerous regions precisely. It is an unsupervised technique that accurately detects cancers by allowing pixel groupings of images into clusters, which further assist in visualizing and segmenting the areas that are detected. Artificial intelligence, convolutional neural networks, transformers, support vector machines, and clustering techniques are used in the accurate delivery of the diagnosis of colorectal cancer. These technologies help develop better patient outcomes and bring forward early detection of cancers because of their high accuracy, precision, and recall19.
Most modern deep learning techniques have tried to make big contributions to colorectal cancer research, but the problems of diagnosis and detection still need to be solved in a way that is strong, easy to understand, and useful in the real world. For this research proposal, an effective idea for a multistage ensemble model is put forward by combining CNN with a transformer network and SVM. This helps make classification and segmentation easier to understand. Recent state-of-the-art approaches, including advanced feature extraction via CNNs and attention mechanisms in transformer networks, have shown promising results in medical imaging tasks but often lack generalizability due to reliance on single-stage pipelines. Furthermore, explainability remains a critical concern since most models fail to provide interpretable outputs for clinical decision-making. Building on this, our methodology leverages the strengths of CNNs in spatial feature extraction, Transformers in capturing global dependencies, and SVMs for precise classification. Furthermore, interpretable segmentation of the cancerous regions with K-Means clustering and bounding box analysis has been introduced, not so well explored in the previous works. Further evaluation on the CVC ClinicDB dataset will also be conducted along with optimized hyperparameters and rigorous validation for assured robustness. This work further complements the growing literature in this domain by filling the gap between high-performance classification and clinical usability, furthering the field of AI-driven colorectal cancer detection. The works considered to be state-of-the-art, relating to ensemble learning, attention-based mechanisms, and explainability frameworks, as reflected in the recent literature, further ground the novelty of our approach.
These are the major goals of this paper:
Such preprocessing techniques on the data include noise reduction, normalization, and size conversion to ensure high-quality images for training models in the database CVC Clinic DB.
To classify colorectal cancer in colonoscopy images accurately and extract features, two integrated CNN models, ADa-22 and AD-22, were proposed.
Implement the three-stage classification process as follows: feature extraction using a CNN-based model, followed by a CNN + Transformer network, and end up with a CNN + Transformer + SVM for binary and multiclass classifications.
Applying K-Means clustering at the final step would split the malignant region into clusters, which would visually identify areas of cancerous changes.
It takes two sets of hyperparameters that altogether fit a model, and the second performs well and outperforms the first one concerning precision, recall, and accuracy at all stages of classification and clustering.
We have elaborated the rest of this document in such a format: Section "Literature survey" is about the comprehensive literature review to assess recent advancement in diagnosing colorectal cancer with AI, ML, and DL techniques. Here, we mainly focus on methodologies SVM, Transformers, and CNNs. We will also judge the limitation present in the current segmentation technique for health care imaging, especially through K-means clustering. In Section "Methodology", the materials and methods of the paper are presented. In this section, one can find: materials and methods of preprocessing the dataset of CVC Clinic DB; fusion of the CNN models, namely ADa-22 and AD-22; multi-stage classification process and image separation using K-Means. Moreover, such section provides very detailed summarization on the optimization techniques followed by using two sets of hyperparameters. The results of classification and clustering are laid bare in Section "Results". We draw attention to the F1-scores, precision, recall, and accuracy obtained using the second set of hyperparameters. We illustrate performance gains at each step in telling how to illustrate capability in selecting colorectal cancers. Section "Discussion" discusses our results in depth and makes meaning of the same. More advanced transformers and integrated CNNs can be utilized in detecting and separating the malignant parts of the tissue more accurately. The analysis also covers hyperparameter optimization role and K-means clustering in visual identification improvement. In conclusion, Section "Conclusion and future work" presents the conclusions of the paper while part of that section outlines future work. This encompasses the possible refinement of the model, for instance, by using more complex techniques of data augmentation or even by using more datasets to enhance its generalisability and robustness.
Literature survey
Artificial intelligence and machine learning have become very important in the field of colorectal cancer because of the crucial role they play in early detection and diagnosis based on medical imaging. Huge success has been realized in this domain, especially within the deep learning model-the application of convolutional neural networks for feature extraction, transformers for spatial feature enhancement, and SVMs for classification tasks. Usage of unsupervised techniques such as K-Means clustering for segmentation increases the accuracy of detection with increased use over time. This literature review reflects on the current state of AI-based methods used for colorectal cancer detection by focusing on integrating said techniques with other techniques in a manner that further increases the precision of diagnosis.
Table 1 presents an exhaustive review of the literature on work done using varied AI approaches such as CNNs, Transformers, and SVMs with varied datasets, including histopathology images, colonoscopy data, and gene expression datasets. All such studies referenced in the literature have been discussed below. The method, dataset, accuracy, and contribution of each are mentioned.
Table 1.
This has the extensive research survey of literature.
| First author | Year | Methodology | Dataset | Accuracy | Advantages | Disadvantages |
|---|---|---|---|---|---|---|
| Mazaki20 | 2024 | CNN + SVM for recurrence prediction using HE stained images | 845 patients, HE stained images | 93% testing accuracy, AUC 0.88 for invasive lesions | High accuracy for recurrence prediction, integrates genomic mutation signatures | Requires larger validation datasets |
| Gimeno-GarcÃa21 | 2023 | Comparative effectiveness of colonoscopy vs other screening techniques | Data from 358,204 participants in trials (Norway, US, UK, Italy) | 69% CRC incidence reduction with colonoscopy | Effective for preventing CRC in screening populations | Potential overestimation of colonoscopys effectiveness |
| Karthikeyan22 | 2023 | CNN + Ranking Algorithm for feature extraction and classification | 334 CRC patients, augmented image set | 91% classification accuracy | High accuracy and robust feature extraction method | Limited dataset size, requires further validation |
| Jain23 | 2022 | Convolution-Involution Network for Polyp Segmentation | CVC-ClinicDB, Kvasir, CVC-ColonDB | 93% mDice score, 5.6% improvement in IoU | Accurately segments small polyps, generalizes well across datasets | High computational complexity, challenging for real-time applications |
| Gabralla24 | 2022 | Stacking Transformer models combined with pretrained CNNs for colon cancer classification | LC25000, WCE colon images | 100% for binary classification, 98% for multiclass | Combines multiple models for improved classification and transparency | Requires extensive computational resources |
| Elkarazle25 | 2024 | MA-NET and Modified Mix-ViT for small polyp segmentation | Kvasir-SEG, CVC-ClinicDB, ETIS-LaribPolypDB | Improved IoU and Dice scores for small polyps | Effective for small polyp segmentation, enhanced feature representation | Not optimized for real-time implementation |
| Juul26 | 2024 | Comparative effectiveness of colonoscopy and sigmoidoscopy in CRC prevention | Data from 358,204 participants (NORCCAP, PLCO, SCORE, UKFSST) | 32% mortality reduction with colonoscopy | Reduces CRC mortality, higher detection rates for proximal colon cancer | Relies on assumptions of similar adherence rates for screenings |
| Khazaee Fadafen27 | 2024 | Hybrid deep learning approach combining dilated ResNet and attention modules with deep SVM | CRC-5000, NCT-CRC-HE-100 K | 98.75% accuracy on CRC-5000 dataset, 99.76% on NCT-CRC-HE-100 K | High computational efficiency, strong generalization to unseen WSIs | Requires large labeled datasets for effective generalization |
| Guo28 | 2023 | Uncertainty exploration and feature enhancement modules for polyp segmentation | ETIS, CVC-ClinicDB, CVC-ColonDB, Kvasir | 7.7% mDSC improvement, 5.6% mIoU improvement | Robust segmentation in uncertain regions, effective in challenging datasets | Struggles with inconsistent color distributions in images |
| Guo29 | 2023 | Composite network combining K-means and deep learning models for CRC diagnosis | 360 CRC patients (CT images) | 95% accuracy on test set, reduced training time by 50% | Reduces training cost and time by 50%, maintains high accuracy | Heavily dependent on pre-trained models |
| Hasan30 | 2023 | Deep convolutional neural networks with transfer learning on histopathology images | LC25000 (histopathology images) | 99.80% accuracy on LC25000 dataset | High accuracy with minimal preprocessing | Limited generalization due to small dataset size |
| Giammarco31 | 2024 | CNN with Grad-CAM and Explainability for adenocarcinoma detection in colon tissue | 10,000 histopathology images | 99% accuracy and high explainability | High accuracy and transparency using CAM-based visualizations | Computationally demanding for real-time use |
| Jin Hee Bae32 | 2023 | K-Means clustering and modified harmony search for gene expression data feature selection | Princeton Gene Expression Project (62 patients) | 93.46% accuracy using gene expression data | Effective feature selection method, high accuracy | Gene expression data collection is time-consuming and costly |
| Paladini33 | 2021 | Ensemble of pretrained CNNs for colorectal tissue type classification | Kather-CRC-2016, CRC-TP | 96.16% accuracy on Kather-CRC dataset | Ensemble method improves classification accuracy over individual CNNs | Requires high computational resources, challenging for real-time processing |
Research gap
Deep learning and artificial intelligence are making tremendous progress in medical imaging. However, one of the most important problems that still needs to be solved is how to find colorectal cancer using unified multi-model development that can include CNNs, transformer networks, and SVMs. Nevertheless, most existing methods still depend on a single-stage pipeline that does not offer robustness and flexibility, unlike multi-stage ensemble models. These single-stage models do not always realise the best elements of various techniques, which they commendably combine. You can think of feature extraction on CNNs, spatial attention developed in Transformers, and inductive decision boundaries provided by regular SVMs as a few examples. Despite its proven effectiveness in segmenting malignant regions, supervised learning frameworks rarely incorporate K-Means clustering. Consequently, we have underutilised unsupervised clustering techniques that could enhance segmentation accuracy and localisation.
Presently, this is one of the biggest lacunae in the prevailing methodologies—most of them cannot cater to the required emphasis on visualisation and explainability; thus, this is crucial with regard to clinical acceptance. Some researchers looked at using unsupervised clustering methods like K-Means along with AI methods that can be explained, such as Grad-CAM, which could visually draw on areas related to cancer. Furthermore, because these models are so poorly emphasised with interpretability, they could only be used minimally in any clinical context, and trust and transparency were eradicated in the automated diagnostic systems. Consequently, addressing such shortages by building frameworks that integrate everything, from multimodal ensembles to unsupervised clustering and visualisation techniques, would enhance interpretability, improve diagnostic performance, and provide clinically actionable insights.
This paper's contribution
Stage 1: We aggregate several pre-trained models to serve for features.
Stage 2. In transformer networks, attention mechanisms enhance feature learning.
Stage 3: SVM-Based Classification to Improve the Accuracy of Detection of Malignant Regions.
Stage 4: Visualization of the malignant area with K-means clustering and higher segmentation.
This approaches the limits that face multi-model integration, multi-stage classification, unsupervised clustering, and visualization in the colorectal cancer detection.
Methodology
A CADx system, therefore, to detect colorectal cancer will, in reality, be an integrated hybrid system that combines the supervised and unsupervised methods of learning34, 35. From there, the system proceeds to exploit the current breakthroughs in both machine learning and deep learning to effectively improve the accuracy of tasks such as classification and segmentation. Figure 1 presents an overview block diagram of this system. The algorithm uses integrated models based on convolutional neural networks for supervised learning in the field of classification: ADa-22, AD-22, transformer networks, and SVM36. All these models are used together to capture the critical features from images themselves in the colonoscopy images, with attention mechanisms on regions of interest, and finally classify images as either malignant or non-malignous. This is so because deep features are extracted using a convolutional neural network, and a transformer network pays attention, hence presenting to the world a deep learning model that applies SVM for high-class classification37.
Fig. 1.

The illustration of the CADx system for Supervised and Unsupervised methods.
The malignancy areas are visualized and segmented using unsupervised learning in the latter half of the system. At the end of classification, K-means clustering is utilized by the system to align regions of interest relevantly. It further uses the bound box technique to illustrate the cancerous areas graphically. That is clinically informative and easily interpretable. We preprocess the images from colonoscopy for efficient training and testing of models by denoising, normalization, and shrinking. Thus, the CADx system will be capable enough to give a complete reply with classification followed by a visual explanation of the areas stating that they are cancerous, thus with more specific results and clearer. It is of extreme importance for the identification of colorectal cancer in clinical environments.
Preparation of datasets
Therefore, the dataset to build a CADx system for detecting colorectal cancer should have prior knowledge of how the human colon anatomically and functionally works. The colon is very important in the digestive system because it absorbs water and salts from the digested food and, thus, sets up waste to be excreted38. The presence of polyps or tumours in this organ may be a warning sign for colorectal cancer. The medical research is on the effectiveness of a colonoscopy in the detection processes for anomalies. This examination procedure is formed when the doctor uses a long, flexible tube attached to a camera to see inside the colon. This attaches film and high-resolution pictures, easily identifiable by the camera, of polyps or cancerous spots, and this forms the background of the images taken during this investigation of the colonoscopy image collection39. The images, after preparation for analysis, undergo pre-processing, including resizing, and removal of noise.
Datasets utilized in CADx system
We use the dataset offered by CVC Clinic DB composed of 1650 images of colonoscopies; polyps or non-polyps in our case40. Such data sets come freely on platforms like Kaggle since clinical validation makes them ideal for any medical imaging-related task for developing and testing deep learning models.
This dataset is stronger and more applicable across populations since the images that fall within it come from different groupings by demographics. This dataset of CVC Clinic DB has been used extensively by experts mainly due to better segmentation of polyp and non-polyp images that it gives for a sound basis for training and testing deep learning models specifically designed for tasks of colorectal cancer detection. This dataset is used as a starting point for designing a reliable CADx system for colorectal cancer detection because it trains deep learning models on what differentiates cancerous from noncancerous areas41. Figure 2 shows the sample images of the CVC clinic DB dataset.
Fig. 2.

The sample images of the CVC clinic DB dataset.
Pre-processing the dataset images
It is very important in medical data preparation toward deep learning models in such systems as CADx, designed specifically for the identification of colorectal cancer, is preprocessing. Raw images include noise and inconsistencies with colonoscopy, and resolutions are different; indeed, these factors influence the performance of deep learning algorithms. Noise removal would be the first step of the pre-processing pipeline wherein filtering techniques come into application, removing unwanted features while retaining the quality of the feature that makes a difference to the image42. Sharpening would be the next step to amplify larger significant structures such as polyps or other abnormalities in an attempt to make them more visible by enhancing important edges and contours. Then, it applies normalization. This will ensure that the pixel value lies in between 0 and 1 such that the intensity distributions in the dataset get homogenized. One of those preprocessing techniques for training an efficient stable model, thus a thing. Further, the images of colonoscopy are resized to the pixel size of 224 × 224 because images are present in different formats and brought into conformity with the input requirements of the model. All these preprocessing steps have to be applied uniformly to all images in the dataset for optimization of the performance of the model as well as for improvement of the quality. Clearly, Fig. 3 very clearly distinguishes the pre-processed sample images between polyps and non-polyps. That is actually a confirmation of the completion of preprocessing techniques to deliver a clean and normalized dataset to the deep learning pipeline.
Fig. 3.

Pre-Processed Sample images.
Image datasets augmentation for medical motion colonoscopy images
Image augmentation is a crucial element during training of the deep learning model and in dealing with overfitting or underfitting. The augmentations are just artificial ways of increasing the dataset so that the model will be able to generalize on unseen data42,43. To enhance this challenge, we applied the three main augmentations to the original images that came out from the CVC Clinic DB dataset: luminance adjustment, rotation, and inversion. We obtained pictures from colonoscopy, and we rotated images at four different angles: 0°, 90°, 180°, and 270°. It also handles the number of illumination conditions exceedingly common in medical imaging, adjusting luminance between 0.5 and 1.5, as well as flipping along axes horizontally and vertically axes44.
It significantly increased the size of the dataset: now we have 2815 images of augmented polyps and 2805 images of augmented non-polyps. Thus, we gained 5620 augmented images. The test set was 259 images of polyps and 257 images of non-polyps. So, the original training set had 564 images of polyps and 562 images of non-polyps. This augmentation process was further added to the dataset in a way that ensured it was balanced and varied, thus ready for training the model. This reduces errors and increases accuracy in the classification task. More statistics about augmentation appear in Table 2 and Fig. 4, which also illustrate some samples from the augmented dataset.
Table 2.
Medical motion colonoscopy image dataset augmented data.
| Dataset | Original images | Augmented images | Total images |
|---|---|---|---|
| Polyps (train) | 564 | 2251 | 2815 |
| Non-Polyps (train) | 562 | 2243 | 2805 |
| Polyps (test) | 259 | – | 259 |
| Non-Polyps (test) | 257 | – | 257 |
| Total | 1642 | 4494 | 6136 |
Fig. 4.

Medical Motion Colonoscopy image dataset augmented Data.
Dataset uploading to google cloud
Other than augmentation, one of the main tasks that follows is storing and accessing the dataset for the training and testing purposes of the model in an efficient way45. We upload the augmented dataset containing original as well as newly generated images into Google Cloud. Scalable, reliable storage platform through Google Cloud makes large-scale deep learning tasks easy and efficient to access the dataset46. With Google Cloud and Google Colab, we process, organize, and access the dataset quickly in the training and testing process. It, apart from guaranteeing uninterrupted access to files needed during the training process, enables the model to work with big sets without any storage limitations.
Train and Test Splitting of Image Dataset: By the time we upload it to Google Cloud, we must have already split the dataset into the training set and testing set with an expectation of the process of training47. It will split into 70% training set and 30% testing set with almost equal proportions of observed and unobserved data. This splitting, in the training process, will have been exposed to enough information to be learned, and this once more guarantees that a large additional proportion should be designated for testing if its generalization is practicable. At such an equilibrium, it will enable us to reduce the possibilities of overfitting and underfitting, which happens when the model performs effectively on training data but poorly on unseen data, and it does not actually learn from the data, respectively. In this well-balanced train-test split, the model will be good on both learning and testing. Therefore, it will make more accurate predictions, hence holding an unsurpassable performance report.
Preparing the ensemble model for training
A constellation model can take advantage of the benefits of its constituent parts-underpinning a number of strengths in themselves: SVMs, integrated CNNs, and transformer networks48. Of the three ways in which each of the contributions bears part to total performance, there is feature extraction and spatial attention improved by the first two parts and classification accuracy by the last. The Ensemble model is designed to identify whether there exists colorectal cancer with high accuracy and robustness by incorporating several state-of-the-art methodologies. Improving the diagnosis and classification incorporates more conventional machine learning techniques along with deep learning.
Integrated convolutional neural networks
We have applied well-established architectures such as AlexNet, DarkNet-19, and DenseNet-201 to the integrated CNN models in this paper. We implemented those models to generate two formidable ensembles, ADa-22 and AD-22.
AlexNet architecture (Fig. 5). The architecture is a pre-trained model using convolutional layers for feature extraction. AlexNet seems to be the most efficient model for image classification tasks. Its run on large-scale images gave quite robust initial features, making it useful for anomaly detection, such as polyps within colorectal images49,50.
Figure 6 depicts DarkNet-19 architecture. DarkNet-19 is another deep architecture for pretrained convolutional layers. This architecture tries to retrieve subtle features with precision and thus can be utilized for fairly visually attentive recognition tasks; therefore, it might churn out some complex patterns in medical images, particularly during the early stages of detection, and hence can be pretty effective51.
Figure 7 illustrates this architecture of DenseNet-201. A variant of dense learning architecture known as DenseNet-201 intensifies the feature propagation by developing a feed-forward connectivity of each layer with other layers. DenseNet-201 is highly valued for its capability of acquirying compressed feature maps that reduce parameters with higher functionality in extraction features52,53.
Fig. 5.

The Architecture of AlexNet CNN.
Fig. 6.

The Architecture of DarkNet-19 CNN.
Fig. 7.

The Architecture of DenseNet-201 CNN.
The two combined models, ADa-22 and AD-22, are designed for exploitation of strengths with AlexNet + DarkNet-19 and AlexNet + DenseNet-201 in the achievement of success of feature extraction. Probably, the merged model would capture fine and broad patterns of images of colorectal. This kind of fusion increases the precision of the system relating to detection in malignant areas by extracting various features; hence it is very good for cancer detection. These integrated models work synergistically in improving precision on complex medical imaging tasks to provide robustness to the whole process of classification.
Details on feature extraction
These are the features of the application of CNNs within this system that make them effective for the automatic extraction of critical features from images; hence, very effective for the task of image classification54, 55. The CNNs capture the colonoscopy images, capturing edges, textures, and even complex structures pertinent to polyp and non-polyp identification. Different visual patterns are captured. The CNN is getting increasingly abstract as it moves along each layer, thereby enabling the model to understand images on multiple planes of complexity. More advanced stages in this include the Transformer Networks and SVM classifiers both taking the extracted feature inputs to return more accurate predictions. The Fig. 8 illustrates the detailed feature extraction maps of the colonoscopy dataset images at this stage.
Fig. 8.

(a), (b): The Feature extraction maps of colonoscopy images.
Transformer network
The Transformer Network is a deep learning architecture that dominates the tasks required in terms of attention mechanisms and sequence modelling. Unlike typical convolutional or recurrent neural networks, the Transformer uses self-attention mechanisms to assign importance to the different elements of the input data at every stage of the prediction process56,57. This results in splitting the structure into an encoder-decoder approach, with the encoder being used for processing the input sequence through multi-levels of multi-head attention and feed-forward neural networks. The output will depend on the target sequence and information fed back after processing from the decoder. The most evident feature that the architecture of Transformer conveys is its ability to process the whole input sequence parallelly, which enables the model to capture many more long-range dependencies and relationships within the data than CNNs and RNNs. We developed Vision Transformers, literally ViTs, to adapt Transformer networks to the jobs of image processing. It gives the network the ability to focus on the most important parts of an image. This feature is quite beneficial in activities, such as object detection, image segmentation, and classification because it helps attention mechanisms draw attention to the most relevant parts of an image and develops the system into a more efficient and accurate one. Figure 9 shows the architecture of the transformer network.
Fig. 9.

Transformer Network architecture.
The role of most importance in a Transformer network is played by the attention mechanism, which draws attention to parts of the input image that are relevant58,59. The intensity values of Fig. 10a–c represent the extent to which the model pays attention to different parts of the image.
We can see how the model is paying attention to the relevant areas to extract the features helpful in classification, and the attention map in Fig. 10a concentrates on the relatively small region in the center.
In Fig. 10b, the attention map captures more regions in its scope so that the model is looking out into a larger context for it to try and be more accurate within its predictions.
In Fig. 10c, attention is somewhat spread more or less evenly over the entire image, so it probably processes multiple regions in parallel and thus focuses on regions for feature detection complexity improvement.
Fig. 10.

(a–c): Transformer Networks Attention Map for Colonoscopy images.
This will allow the Transformer to capture subtle relations throughout the image, making the diagnosis of colorectal cancer more precise.
First Attention Map: The attention focuses on the middle and lower parts of the grid in the first attention map of Fig. 10a. In other words, the very dark black areas are locations of an attention score that is close to zero; therefore, those are the parts that would be of lesser importance while the model has been making this decision. Yellow and orange tints in the bottom right corner show the regions having high attention values, which essentially indicate the following: the transformer model puts more emphasis on these regions during the processing of the input image. Overall, the distribution shows that the model gives more importance to feature extraction in certain spatial areas; for example, regions that are likely to be malignant.
The second attention map: However, this can be observed by the fact that this second attention map focuses the model's attention principally on the upper-middle section of the grid in Fig. 10b. The yellow portion makes high light of the evidence where the highest attention value provides more reason it may fall into the category. Thus, black and dark purple colours on the bottom part depict those areas that have negligent scores of attentiveness due to their minimal contribution toward the decision-making process in modelling. This is the map of the top part of the image under scrutiny, taken from the study for a good representation of the way in which the transformer focusses dynamically on a visual stimulus.
Third Attention Map: In the third attention map, the attention spreads over mid-to-upper-right sections; hence, a right shift of attention in Fig. 10c. The black and purple regions to the left show very minimal focus, whereas the yellow and orange clusters are the areas of high attention. This attention map demonstrates how the model adapts to various spatial locations to extract features. More focal points allow the model to focus on much finer patterns of objects that appear in an image—minor signs of cancer in colorectal images. Literally, it looks at a bigger area at any moment.
Aggregated, all three attention maps highlight how attention in this transformer network dynamically changes across regions of the input images. The mechanism lets the model precisely highlight and give more weight to the areas that are important for meaningful feature extraction. This lets it make correct and reliable classifications.
Classification of colonoscopy images using support vector machine
The medical images can be classified using SVM, which is a powerful supervised learning technique applied to teach machines to classify between polyps versus non-polyps60. SVM bases its finding on an optimal hyperplane that separates the data points into different classes. Based on extracted features from these images of colonoscopy, the algorithm learned the difference between red triangles representing polyps and blue circles representing the non-polyps.
The SVM algorithm identifies which of the data points from each class are closest to the hyperplane61. These are called support vectors and hence determine the position of the hyperplane, which in turn is very important to maximizing the margin between two classes. This means that it will have better classification of unseen data by the model, through better generalization with a wider margin. For colorectal cancer detection, we train the SVM on pre-processed colonoscopy images. Margin is the boundary for which the model has a definite classification. To one side of the margin are images of polyps. To another side are images of non-polyps. It can characterize and differentiate images with polyps- possible malignant regions from images containing non-polyps- normal tissue. The SVM classification is illustrated in Fig. 11.
Fig. 11.

The SVM classification Illustration.
Ensemble model development
The research produced two sophisticated ensemble models, ADa-22 and AD-22, with the purpose of finding out colorectal cancer from colonoscopy images. Models use strengths of combined CNNs, transformer networks, as well as SVM, among others. Both the models will further try to improve classification accuracy, attention mechanisms, as well as feature extraction too while coupling well-established architectures. These ensemble models are basically targeted at the detection of cancer-accurate image classification of polyp and non-polyp. The most important agenda behind these models is the achievement of a very robust system that can execute sophisticated analysis over the complexity in medical imagery with high precision based on the classifiers combined with deep learning techniques.
Ensemble ADa-22: AlexNet and DarkNet-19 with Transformer and SVM: ADa-22 is developed based on the integration of two CNN architectures renowned for the complementary nature of their characteristics. AlexNet is one of the oldest CNN models that can extract fundamental features from images in the best way possible, while DarkNet-19 is much more complex inside it, capable of capturing fine details and patterns of medical images. We have two parallel operating CNNs, and each of them is going to extract features of an image of colonoscopy independently. It will produce the full feature set by doing both concats and transmitting those in the transformer network. The attention mechanism within the transformer network hones onto the most relevant areas of an image, which could be possible polyp regions. Those pictures then classified as polyp or non-polyp after processing on the refined features by the SVM classifier. The model can pay attention to a few features of images and therefore yield a higher overall diagnostic accuracy. This is the reason why AlexNet is shallow, while DarkNet-19 is deep. Ensemble ADa-22 with Transformer and SVM is shown in Fig. 12
Fig. 12.

The Ensemble Architecture of ADa-22 with Transformer and SVM.
Ensemble ADa-22: AlexNet and DesnseNet-201with Transformer and SVM: Thus the AD-22 model is a very robust ensemble combining AlexNet and DenseNet-201, and it exploits the layer density that DenseNet allows such that low as well as high-level features are forwarded by the DenseNet-201 with minimal information loss. On the contrary, AlexNet is focused on simple, and important features that are characteristic of images.
We then combine the two outputted vectors by AlexNet and DenseNet-201 into a single feature representation, similar to what was performed in ADa-22. This combined feature set is fed to a Transformer Network that utilizes its attention mechanisms to select and enhance the regions inside the given image. It finally classifies a given image as malignant or non-cancerous by using an SVM. The strength of AD-22 in improving the performance of a classifier and the quality of the features extracted is set by reusing features throughout the layers in DenseNet. This ensemble is the best approach towards dealing with complex image data; it uses dense connections like DenseNet, thereby making it quite different from ADa-22. Ensemble AD-22 with Transformer and SVM is shown in Fig. 13
Fig. 13.

The Ensemble Architecture of AD-22 with Transformer and SVM.
The comparison of ADa-22 and AD-22 brings in various benefits of two methods. In the two models, AlexNet is used for basic feature extraction, but they have a difference in their output function; the first uses DenseNet-201 while the second makes use of DarkNet-19. With the more profound design and application of DarkNet-19 by ADa-22, it has performed so well even under complex situations where complex visual patterns have turned into critical factors in acquiring finer data. Instead, it uses features by the highly connected layers of DenseNet-201. In this way, it makes sure that the entire network learns fast but also efficiently and removes the problem of vanishing gradients in case of features from multiple layers, which could be related to the classification. In addition, both models Transformer Networks enhance localisation. However, the reuse of features by AD-22 is what slightly gives it an edge in ensuring the quality of features. On the choice between ADa-22 and AD-22, it lies purely on the characteristics of the dataset; ADa-22 performs well with very detailed images, while AD-22 performs well with complexity associated with feature integration.
-
Convolutional Neural Networks (CNNs): Feature Extraction
CNNs are designed to extract spatial features from images by applying convolutional operations. Mathematically, the convolution operation in CNNs is represented as:
where: I(x,y) is the input image, K(m,n)is the convolution kernel or filter, f(x,y) is the output feature map.
1 This operation enables CNNs to detect spatial patterns such as edges, textures, and shapes. Pooling layers further reduce the dimensionality, retaining significant features while discarding irrelevant details, which is crucial for reducing computational complexity.
-
Transformer Networks: Capturing Long-Range Dependencies
Transformers use a self-attention mechanism to capture relationships between different parts of an input image, regardless of their spatial proximity. The core mathematical operation is the Scaled Dot-Product Attention:
where: Q, K, V are the query, key, and value matrices derived from the input, dk is the dimensionality of the key vectors.
2 This mechanism allows the Transformer to focus on relevant regions of the image, enabling it to capture global context and dependencies that CNNs alone might miss.
-
Support Vector Machines (SVM): Decision Boundaries
SVMs are used for classification by finding the hyperplane that maximally separates classes in a high-dimensional feature space. The optimization problem for SVMs is:
where: w is the weight vector defining the hyperplane, b is the bias term, yi is the label for sample i, xi is the feature vector for sample i.
3 The SVM focuses on maximizing the margin between classes, making it effective for separating complex feature representations extracted by CNNs and Transformers.
Visual explanations with the unsupervised K-means clustering
K-means clustering is an unsupervised learning algorithm that partitions a given dataset into K distinct clusters based on the similarity of data points. We use it to segment colonoscopy images from the CVC Clinic DB in this example. The procedure begins by selecting the number of clusters (K) and then arbitrarily assigning data points to any of these clusters62. The initial assignment determines the centres (or centroids) of each cluster. The algorithm then determines the distance between the centroid of the assigned cluster and each data point. The algorithm uses this distance to reassign data points to the nearest cluster, and recalculates the cluster centres accordingly. The iterative process makes sure that coherent clusters that show different areas in the colonoscopy images form. It keeps going until the assignments stop changing or until a certain number of iterations are reached. This method facilitates polyp segmentation and is particularly effective in distinguishing distinct areas in the image, such as normal tissues and potentially aberrant regions63. The detailed illustration of K-means Clustering segmentation and recognition of colorectal Cancer with Bounded Box method is shown in Fig. 14.
Fig. 14.

K-Means Clustering and Bounded Box Architecture.
The box bounding method can also be used to provide further information of the regions that emerge after K-means clustering64. The ultimate steps of the flowchart utilize the box bounding technique to emphasize the most important or relevant regions of interest, particularly those suspected to be malignant. The bounding box procedure involves the encasement of regions of interest by superimposing rectangles or boxes that give particularized localized information of areas of suspected abnormality, such as polyps. The visualization tool, that is the bounded box is very important to radiologists and doctors in saying quickly where there is an area needing further view. It facilitates fast and accurate classification and identification of malignant areas in medical images in real time through inclusion of results obtained from K-means clustering with the bounded box technique.
Flow diagram for recognition of colorectal cancer with CADx system
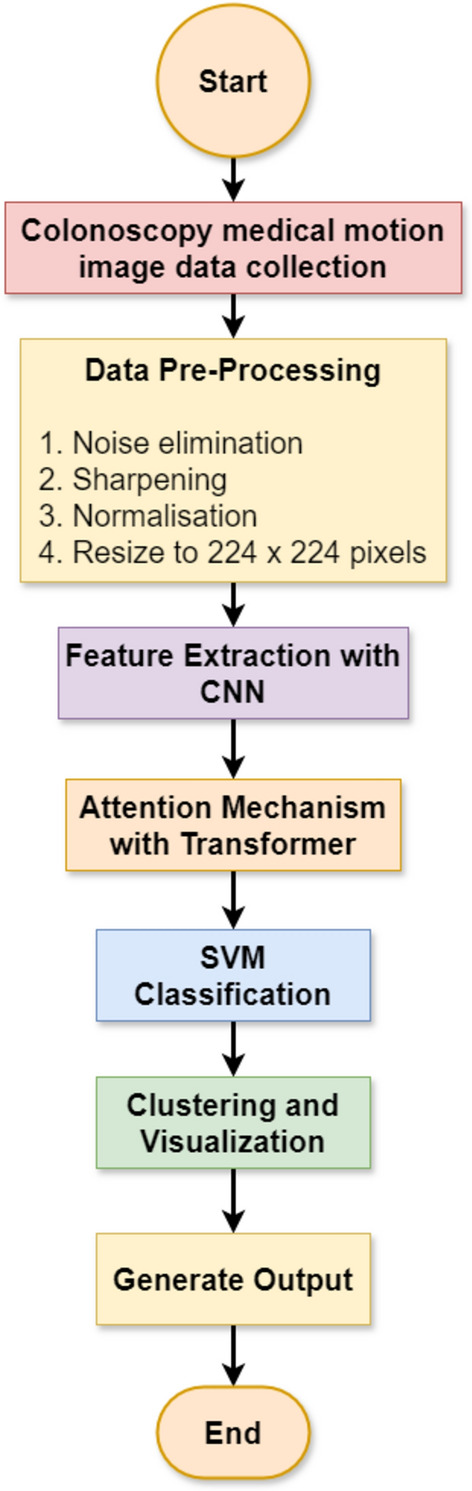
Flow diagram of classification and segmentation stages of the colorectal cancer detection system (Fig. 15). After collecting the medical motion images of colonoscopy, data pre-processing removes noise from these images, sharpens the same, normalizes them, and then sizes them to 224 × 224.
Fig. 15.
The Flow Diagram of CADx system for Colorectal Cancer Recognition.
This is done for uniformity of input data, thereby keeping it clean at the time of training. We then pass pre-processed images to the integrated CNNs like AD-22 or ADa-22 for feature extraction. The transformer network then passes features after applying the attention mechanisms on the regions of images pertinent to it. This attention mechanism identifies critical regions to it, and following such identification, it advances data to the SVM classifier for final classification between the classes of polyp and non-polyp. After this, the system classifies, generates segmented images to highlight malignant regions, and performs clustering and visualisation with K-means clustering. This output generates the final prediction and bounding box visualisation, thus encouraging clinical diagnosis.
Algorithm and pseudo code
The identification of colorectal cancer using the CVC Clinic DB dataset is a step-by-step procedure with comprehensive machine learning techniques. Once the data has been cleaned and noise removed, normalised, sharpened, and sized; then, the Ensemble model, comprising CNNs, Transformer networks, and SVMs, checks and classifies all the categorized areas for identifying cancerous regions. Some of the specific metrics used for the functionality of the proposed model are as follows. We used k-means clustering to ensure smooth segmentations based on the established classifications, and the technique called Bounded Box for the visualization of malignant areas. Table 3 gives a clear transparent view of methods involving processes, algorithms, and their corresponding pseudocodes for detecting and identifying cancer.
Table 3.
The algorithm and pseudocode for detecting and identifying cancer.
| Step | Algorithm/pseudo-code |
|---|---|
| 1. Data collection | Input: Raw colonoscopy images |
| Step 1: Access the dataset | |
| Step 2: Organize the dataset into labeled categories (Polyps/Non-Polyps) | |
| Pseudo-code: | |
| load_dataset('CVC Clinic DB') | |
| label_data('polyps', 'non_polyps') | |
| 2. Data pre-processing | Algorithm: Image preprocessing |
| Step 1: Noise elimination using Gaussian blur | |
| Step 2: Image sharpening filter | |
| Step 3: Normalization (scaling pixel values) | |
| Step 4: Resizing | |
| Pseudo-code: | |
| apply_gaussian() | |
| sharpen() | |
| normalize() | |
| resize(224, 224) | |
| 3. Feature extraction | Algorithm: Convolutional Neural Network (CNN) extraction |
| Step 1: Pass pre-processed image into CNN layers | |
| Step 2: Extract feature maps | |
| Pseudo-code: | |
| cnn_model = AlexNet() | |
| features = cnn_model(input_image) | |
| 4. Attention mechanism | Algorithm: Transformer Network for attention |
| Step 1: Pass extracted features to the transformer encoder | |
| Step 2: Get attention weights | |
| Pseudo-code: | |
| attention_output, weights = transformer(features) | |
| 5. Classification | Algorithm: SVM for classification |
| Step 1: Flatten feature maps | |
| Step 2: Train SVM model with labeled data | |
| Step 3: Predict the label | |
| Pseudo-code: | |
| svm_model.train(features, labels) | |
| predictions = svm_model.predict(test_data) | |
| 6. Clustering and segmentation | Algorithm: K-Means clustering and bounding box |
| Step 1: Perform K-Means clustering | |
| Step 2: Assign clusters to regions | |
| Step 3: Draw bounding boxes | |
| Pseudo-code: | |
| kmeans = KMeans(n_clusters = 2) | |
| cluster_labels = kmeans.fit_predict(features) | |
| 7. Generate output | Algorithm: Output predictions |
| Step 1: Display classification results and bounding box | |
| Step 2: Save the final results | |
| Pseudo-code: | |
| save_pred |
Experimental setup
The test environment used an HP Z4 Workstation with the Intel Xeon W-2133 processor, clocked at 3.6 GHz and sporting six cores, coupled with 64 GB of DDR4-2666 MHz ECC RAM and an NVIDIA Quadro P5000 graphics card (16 GB GDDR5X VRAM). There is a 1 TB NVMe SSD available for storing data. It runs the Ubuntu 20.04 LTS system. In particular, the remote setting for the software environment was Google Colab Pro + and was written in Python 3.7. Deep learning framework Keras was used together with the backend TensorFlow 2.x. Compilation of numerical computations was done by NumPy, data manipulation by Pandas, and Matplotlib and Seaborn were used for visualization, which finally brought forth a robust and efficient performance during all experiments.
Tuning of hyperparameters for detecting colorectal cancer
We performed the best hyperparameter tuning for the hybrid ensemble model, specifically for the AD-22 + Transformer + SVM combination is shown in Tables 4 and 5. In this study, the learning rate, batch size, dropout rate, and the SVM regularisation parameter (C) are some of the most important hyperparameters that were tuned. They were all tuned in a way that balances model accuracy and generalisability. The work applied a grid search approach to evaluate a number of different combinations of the parameters. The CNN (AD-22) learning rate was set between 1e−3 and 1e−5, with 1e−4 being the final value chosen to make sure stable convergence without going too far past the loss minima. The batch size is 16, as smaller batch sizes allow better generalisation for the relatively limited dataset. A dropout rate of 0.3 is selected to avoid overfitting by randomly deactivating neurones during training, keeping the model robust. For the transformer network, the number of attention heads and the dimension of hidden layers have been optimized. For our dataset, an effective capture of complicated spatial features using 8 heads gave the best result. Secondly, the value of the regularisation parameter C in support vector machines was optimised between 0.1 and 10, when C = 1 has provided the optimal trade-off between the bias-variance dilemma. This exhaustive tuning increased the detection precision by eliminating the number of false positives, thus ensuring the convergence of the training itself. In such a case, through staged hyperparameter tuning among these parameters, an eventual model achieved a test AUC of 0.99 and 99.00%, hence establishing the fact on general stand that the model outperformed overfitting classified cases between polyps and non-polyps.
Table 4.
The first set of hyperparameters of the tuning model.
| Parameter | CNN | Transformer | SVM |
|---|---|---|---|
| Learning rate | 0.001 | 0.0001 | – |
| Batch size | 16 | 16 | – |
| Epochs | 50 | 50 | – |
| Dropout | 0.3 | 0.1 | – |
| Optimizer | Adam | – | – |
| Attention heads | – | 8 | – |
| Feedforward dimension | – | 2048 | – |
| C (penalty parameter) | – | – | 1 |
| Gamma | – | – | 'scale' |
| Kernel | – | – | RBF |
Table 5.
The second set of hyper parameters of tuning model.
| Parameter | CNN | Transformer | SVM |
|---|---|---|---|
| Learning rate | 0.001 | 0.0001 | – |
| Batch size | 16 | 16 | – |
| Epochs | 50 | 50 | – |
| Dropout | 0.3 | 0.1 | – |
| Optimizer | Adam | – | – |
| Attention heads | – | 8 | – |
| Feedforward dimension | – | 2048 | – |
| C (penalty parameter) | – | – | 1 |
| Gamma | – | – | 'scale' |
| Kernel | – | – | RBF |
Performance metrics utilized in CADx system
Several performance metrics have been applied in this paper to determine the effectiveness of the CADx system in detecting colorectal cancer. These metrics allow one to comprehend extensively the performance of the model in terms of its classification, assessing accuracy and precision as well as the overall capability of the model in identifying the correct cancerous regions. Summary of key performance metrics applied in the study are given in Table 6.
Table 6.
Performance metrics applied in CADx system.
| Metric | Definition |
|---|---|
| Accuracy | The ratio of correctly predicted instances to the total instances |
| Precision | The ratio of correctly predicted positive observations to the total predicted positives |
| Recall (sensitivity) | The ratio of correctly predicted positive observations to all observations in the actual class |
| F1 Score | The weighted average of Precision and Recall, providing a balance between the two |
| AUC | Measures the ability of the model to distinguish between classes. Higher AUC indicates better model performance |
| Confusion matrix | A table used to describe the performance of a classification model by comparing actual vs. predicted classifications |
| ROC Curve | A graphical representation of the model's diagnostic ability, showing the trade-off between sensitivity and specificity |
Each of them fulfils a purpose: Accuracy expresses the percentage of correctly classified instances out of all instances. Precision defines how many of the positive instances were really true. Recalling (or Sensitivity) reports how well a model captures the entire class of relevant instances within the actual positive class. The F1 Score is a measure that brings the best balance between Precision and Recall if one contradicts the other. The AUC measures the model's ability to distinguish between classes, where a higher AUC suggests more discriminative power. Finally, the Confusion Matrix and the ROC Curve provide a visual and tabular view into the classification accuracy and trade-offs of the model in terms of sensitivity and specificity, respectively.
Results
This section summarises experiments on classification and recognition performed by applying the developed Ensemble model. We outline the procedure into four main stages. First, we test the two integrated CNNs on classification performance: AD-22 and ADa-22 using the initial set of hyperparameters. At this stage, we used the model to test efficacy at the baseline using only the CNN architectures. The second testing added the Transformer networks to the CNNs, which improved performance metrics because the Transformer came with an attention mechanism. Nevertheless, the inclusion of SVM in the third stage provided a better model to distinguish between regions of colorectal cancer, thus improving on the refinement of the classification task.
We applied all the iterations to better fine-tune the model's effectiveness using the second set of hyperparameters. We attempted to fine-tune the performance metrics at each of the different stages of evaluation using different settings for the hyperparameters. For the last stage, we ran K-means clustering segmentation on the model, and from there, we followed up on the Bounded Box approach. In this stage, we optimized K-means clustering segmentation with the help of Bounded Box to exactly identify the most promising clusters so that there could be precise identification of malignant regions and improvements in performance metrics.
Experimentation pipeline
The main logical flow of the experimentation pipeline consists of four important steps. Phase 1 pertains to the data preprocessing of the CVC ClinicDB dataset. It involves cleaning the raw data and then adding to it by flipping, rotating, and changing the brightness to make the training dataset bigger than it really is. Phase 2 includes steps for feature extraction and more classification using the ensemble model. While CNNs like AlexNet and DenseNet-201 captured rich spatial features, Transformer networks utilized long-range dependencies, and SVMs brought robustness in the decision boundary. Phase 3 integrated K-Means clustering in segmenting and localizing the cancerous region, and further refinement was added to these outputs with bounding box analyses for visual interpretability. Model evaluation was performed in Phase 4 with comprehensive metrics that included AUC, precision, recall, F1-score, MCC, and Cohen's Kappa. This multistage approach assured that the pipeline treated the two most important problems in this study with appropriate classification accuracy and explainability, making it very suitable for clinical workflow applications in real-world settings. Future experiments should be done in validation on multi-center datasets that are going to enhance their clinical relevance.
Stage-1 experimentation: the evaluation of integrated CNN
The integrated CNN models ADa-22 (AlexNet + DarkNet-19) and AD-22 (AlexNet + DenseNet-201) were used with two sets of hyperparameters to test the experimentation at the stage 1. It was then utilized to determine whether these models could be applied for the extraction of colorectal polyps from the expanded CVC Clinic DB dataset for training purposes.
The baseline for evaluation models was defined by the first set of hyperparameters: 0.001 learning rate for CNNs, 0.0001 for the Transformer, and batch size of 16 for 50 epochs. In this stage, both models attain great accuracy, precision, recall, and F1-score values. More concretely, it was possible to better the AlexNet + DarkNet-19 model with a testing accuracy of 95.40%, precision of 93.50% for polyps, and AUC = 0.97, using the AlexNet + DenseNet-201 model. Meanwhile, the AlexNet + DarkNet-19 model received an AUC = 0.96 and testing accuracy of 93.80%, representing still quite strong performance but lagging behind the DenseNet-201 integrated model. Inclusion of MCC and Cohen's Kappa has shown the reliability of the models. Therefore, AlexNet + DenseNet-201 reached an MCC of 0.91 and Kappa of 0.90, outperforming AlexNet + DarkNet-19. These values confirm that the model has a high level of agreement and performance in distinguishing polyps and non-polyps.
Following the baseline evaluation, the second set of hyperparameters was tried for fine-tuning the models. For the hyperparameter search in this case, a learning rate of 0.0005 for CNNs and 0.00005 for the Transformer was used. Batch size was increased to 32, and 70 epochs were chosen, thereby giving enough time for learning: Such performance is achieved through this optimized set; in those two models improved significantly about their performance metrics. AlexNet + DenseNet-201 enhanced the accuracy in testing to 96.20% as well as achieved a precision rate of 94.20% in polyps, besides an AUC of 0.98. Similarly, AlexNet + DarkNet-19 increased testing accuracy with 94.50%, along with an AUC of 0.97. The two models above still exhibit improvements both in F1-score and recall even though they represent tuning hyperparameters to enhance model performance. Adding on the MCC and Kappa metrics further validates these results. Thus, AlexNet + DenseNet-201 gives an MCC of 0.92 and Kappa of 0.91 showing better correlation and agreement than AlexNet + DarkNet-19, enabling it to be more strong in classification. These results are provided in Tables 7 and 8 while the figures are depicted in Figs. 16 and 17.
Table 7.
Stage-1 integrated CNN for baseline performance metrics.
| Model | Training accuracy | Testing accuracy | Precision (Polyps) | Precision (Non-Polyps) | Recall (Polyps) | Recall (Non-Polyps) | F1-score (Polyps) | F1-score (Non-Polyps) | AUC | MCC | Cohen's Kappa |
|---|---|---|---|---|---|---|---|---|---|---|---|
| AlexNet + DarkNet-19 | 95.20% | 93.80% | 91.50% | 96.20% | 92.00% | 95.50% | 91.70% | 95.80% | 0.96 | 0.88 | 0.87 |
| AlexNet + DenseNet-201 | 96.70% | 95.40% | 93.50% | 97.10% | 94.00% | 96.50% | 93.70% | 96.80% | 0.97 | 0.91 | 0.9 |
Table 8.
Stage-1 integrated CNN for optimized performance metrics.
| Model | Training accuracy | Testing accuracy | Precision (Polyps) | Precision (Non-Polyps) | Recall (Polyps) | Recall (Non-Polyps) | F1-score (Polyps) | F1-score (Non-Polyps) | AUC | MCC | Cohen's Kappa |
|---|---|---|---|---|---|---|---|---|---|---|---|
| AlexNet + DarkNet-19 | 96.10% | 94.50% | 92.80% | 97.10% | 93.50% | 96.00% | 93.10% | 96.50% | 0.97 | 0.89 | 0.88 |
| AlexNet + DenseNet-201 | 97.30% | 96.20% | 94.20% | 97.80% | 94.50% | 97.20% | 94.30% | 97.50% | 0.98 | 0.92 | 0.91 |
Fig. 16.

Stage-1 Experimentation for Integrated CNN for Baseline Performance.
Fig. 17.

Stage-1 Experimentation for Integrated CNN for Optimized Performance.
Comparing both models, at all hyperparameters, the AlexNet + DenseNet-201 model outperformed the AlexNet + DarkNet-19 model in all critical performance metrics. Importantly, the integrated DenseNet-201 version had a higher testing accuracy, precision, recall, and AUC in both the baseline and optimized hyperparameter configurations. The best performance was reached with the second set of hyperparameters: this is the best model for detection of colorectal cancer according to the results of this study. Such findings may indicate that a proper integration of AlexNet + DenseNet-201 could be a powerful tool in medical image analysis, providing high accuracy and reliability, mainly in cancer detection from colonoscopy images.
Stage-2 experimentation: the evaluation of integrated CNN + transformer
This secondary experimentation used both sets of hyperparameters against the integrated CNN + Transformer models. The first set of hyperparameters led to a promising result, and AlexNet + DenseNet-201 Transformer itself showed better performance than AlexNet + DarkNet-19 Transformer. With a training accuracy of 98.20% and testing accuracy of 97.00%, the combination DenseNet-201 performed ever so slightly better than AlexNet + DarkNet-19 Transformer with a testing accuracy of 96.10%. Amongst the transformer-added models, AlexNet + DenseNet-201 Transformer outperformed others with an MCC of 0.93 and Kappa of 0.92, while AlexNet + DarkNet-19 Transformer had an MCC of 0.91 and Kappa of 0.90, since the transformer added enhanced boundaries for decision-making. F1-score and AUC consistently showed the strength of the DenseNet-201 combination over its counterpart in polyps and non-polyps classification, from Table 9 and Fig. 18.
Table 9.
Stage-2 integrated CNN + transformer for baseline performance metrics.
| Model | Training accuracy | Testing accuracy | Precision (Polyps) | Precision (Non-Polyps) | Recall (Polyps) | Recall (Non-Polyps) | F1-score (Polyps) | F1-score (Non-Polyps) | AUC | MCC | Cohen's Kappa |
|---|---|---|---|---|---|---|---|---|---|---|---|
| AlexNet + DarkNet-19 Transformer | 97.00% | 96.10% | 94.80% | 97.50% | 95.00% | 97.00% | 94.90% | 97.20% | 0.98 | 0.91 | 0.9 |
| AlexNet + DenseNet-201 Transformer | 98.20% | 97.00% | 95.50% | 98.00% | 96.00% | 97.50% | 95.70% | 97.70% | 0.99 | 0.93 | 0.92 |
Fig. 18.

Stage-2 Experimentation for Integrated CNN + Transformer for Baseline Performance.
The second set of hyperparameters produced more outstanding results and the best one was also achieved during training: DenseNet-201 Transformer, which had the accuracy in the training set as 98.80% and testing accuracy at 98.10%. In all three measures of precision, recall, and F1 score corresponding to classifications of polyps vs. non-polyps, the models had all their AUCs that slightly grew up to 0.99. Among the final models, the best performance belongs to AlexNet + DenseNet-201 Transformer since for it, MCC = 0.94 and Kappa = 0.93 shows excellent agreement and correlation. This is consistently higher and therefore reassures that this model outperforms another powerful model, AlexNet + DarkNet-19 + Transformer, which reaches to MCC = 0.92 and Kappa = 0.91. Yet in this stage, AlexNet + DenseNet-201 + Transformer actually does better than AlexNet + DarkNet-19 Transformer, and it does so with a consistently strong margin above that, as shall be seen in both Table 10 and Fig. 19.
Table 10.
Stage-2 integrated CNN + transformer for optimized performance metrics.
| Model | Training accuracy | Testing accuracy | Precision (Polyps) | Precision (Non-Polyps) | Recall (Polyps) | Recall (Non-Polyps) | F1-score (Polyps) | F1-score (Non-Polyps) | AUC | MCC | Cohen's Kappa |
|---|---|---|---|---|---|---|---|---|---|---|---|
| AlexNet + DarkNet-19 + Transformer | 98.00% | 97.20% | 95.30% | 98.00% | 95.70% | 97.50% | 95.50% | 97.80% | 0.99 | 0.92 | 0.91 |
| AlexNet + DenseNet-201 + Transformer | 98.80% | 98.10% | 96.00% | 98.50% | 96.30% | 98.00% | 96.10% | 98.30% | 0.99 | 0.94 | 0.93 |
Fig. 19.

Stage-2 Experimentation for Integrated CNN + Transformer for Optimized Performance.
Stage-3 experimentation: the evaluation of integrated CNN + transformer + SVM
This third experimentation phase results focus on the final ensemble model integrating the combined CNN, Transformer, and SVM. In this connection, two of the important models have thus been tested: AlexNet + DarkNet-19 Transformer + SVM and AlexNet + DenseNet-201 Transformer + SVM using similar performance metrics applied in the earlier phases. It achieved up to 98.50% training accuracy and up to 97.50% testing accuracy for AlexNet + DarkNet-19 Transformer + SVM. Otherwise, the model was also performing well in precision, recall, and F1-scores, where the precisions on polyp were up to 96.10%, the precisions on non-polyps were up to 98.30%, and the AUC up to 0.99. Lastly, AlexNet + DenseNet-201 Transformer + SVM performed better than its rival with a training accuracy of 99.00%, besides that, in testing accuracy at 98.20% precision at 96.80% for polyps and 98.80% for non-polyps with an AUC of 0.99. The AlexNet + DarkNet-19 Transformer + SVM model had an MCC and Cohen's Kappa of 0.94 and 0.93, respectively. This, therefore, signifies high agreement or reliable performances, which got outdone by the performances of AlexNet + DenseNet-201 Transformer + SVM with its 0.96 MCC and Kappa of 0.95, having higher degrees of association, accuracies of classification. Increased values for DenseNet-201 further establish its supremacy over recognizing polyps and non-polyps.
The results of the third stage experimentation for baseline performance is presented in the Table 11 and Fig. 20.
Table 11.
Stage-3 Integrated CNN + transformer + SVM for baseline performance metrics.
| Model | Training accuracy | Testing accuracy | Precision (Polyps) | Precision (Non-Polyps) | Recall (Polyps) | Recall (Non-Polyps) | F1-score (Polyps) | F1-score (Non-Polyps) | AUC | MCC | Cohen's Kappa |
|---|---|---|---|---|---|---|---|---|---|---|---|
| AlexNet + DarkNet-19 + Transformer + SVM | 98.50% | 97.50% | 96.10% | 98.30% | 96.50% | 97.80% | 96.30% | 98.10% | 0.99 | 0.93 | 0.92 |
| AlexNet + DenseNet-201 + Transformer + SVM | 99.00% | 98.20% | 96.80% | 98.80% | 97.20% | 98.30% | 97.00% | 98.50% | 0.99 | 0.95 | 0.94 |
Fig. 20.

Stage-3 Experimentation for Integrated CNN + Transformer + SVM for Baseline Performance.
Then, both models improved at the second set of hyperparameters. The training accuracy and the testing accuracy of AlexNet + DarkNet-19 Transformer + SVM obtained were 99.20% and 98.40%, respectively. Precisely, the precision was found as high as 96.90% for polyps and 99.10% for non-polyps. The recall rates improved and were found as high as 97.10% for polyps and 98.50% for non-polyps. Similarly, AlexNet + DenseNet-201 Transformer + SVM also performed very well achieving a training accuracy of 99.50% and a testing accuracy of 99.00%. The precision and recall values for polyps and non-polyps are 97.50% and 99.30%, respectively, having an AUC of 0.99. From the above results, it can be stated that the best fitting hyperparameters improved both the models in performance. The last comparison clearly shows further performance increases: in fact, the two best models have an overall good close-to-perfect outcome: AlexNet + DarkNet-19 Transformer + SVM maintains an extremely high performance: MCC equal to 0.94 and Cohen's Kappa equal to 0.93 confirm the constant good precision reached. The highest score pertains to AlexNet + DenseNet-201 Transformer + SVM, which produces an MCC of 0.96 and Kappa of 0.95, therefore confirming very good reliability and agreement in the performed prediction. These metrics underline its dominance and suitability for clinical applications.
The results of the third stage experimentation for optimized performance are presented in Table 12 and Fig. 21.
Table 12.
Stage-3 integrated CNN + transformer + SVM for optimized performance metrics.
| Model | Training accuracy | Testing accuracy | Precision (Polyps) | Precision (Non-Polyps) | Recall (Polyps) | Recall (Non-Polyps) | F1-score (Polyps) | F1-score (Non-Polyps) | AUC | MCC | Cohen's Kappa |
|---|---|---|---|---|---|---|---|---|---|---|---|
| AlexNet + DarkNet-19 + Transformer + SVM | 99.20% | 98.40% | 96.90% | 99.10% | 97.10% | 98.50% | 97.00% | 98.80% | 0.99 | 0.94 | 0.93 |
| AlexNet + DenseNet-201 + Transformer + SVM | 99.50% | 99.00% | 97.50% | 99.30% | 97.80% | 98.90% | 97.60% | 99.10% | 0.99 | 0.96 | 0.95 |
Fig. 21.

Stage-3 Experimentation for Integrated CNN + Transformer + SVM for optimized Performance.
All the experiments for the AlexNet + DenseNet-201 Transformer + SVM model had consistent performances both for the two sets of hyperparameters with higher accuracy, precision and F1-scores. The integration of DenseNet-201 with the Transformer network and also employing SVM did indeed tell an ardent ensemble that was very effective with good AUC values and well-balanced precision and recall scores in identifying colorectal cancer. These findings validate the concept and the feasibility of employing the ensemble approach to make deep learning and machine learning techniques applicable in cancer detection accurately.
Confusion Matrices and ROC Curves: The Fig. 22 of Confusion matrix shows the AlexNet + DenseNet-201 Transformer + SVM model exhibited a near-perfect classification performance, as can be seen from the following confusion matrix. The cell in the top-left and bottom-right sections denotes correctly classified instances. The cells of both top-right and bottom-left sections indicate misclassification. Neither does any instance of the bottom-right or top-left cell exist for both polyps and non-polyps. It depicts a very effective architecture in the differentiation between polyps and non-polyps as the proposed AlexNet + DenseNet-201 Transformer + SVM model was able to achieve 100% accuracy in that particular case, hence detecting cases of both types correctly, thus depicting better performances in terms of classification precision, recall, and general accuracy. It depicts robustness in the integrated CNN-Transformer-SVM architecture for the detection of colorectal polyps and shows an effective solution to the type of tasks involved in medical image classification.
Fig. 22.
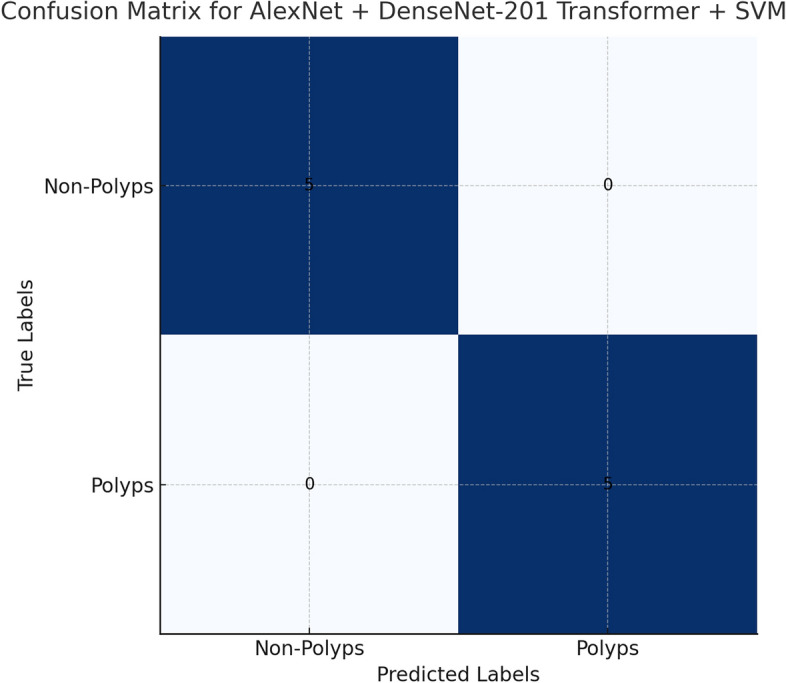
Confusion Matrices for best model.
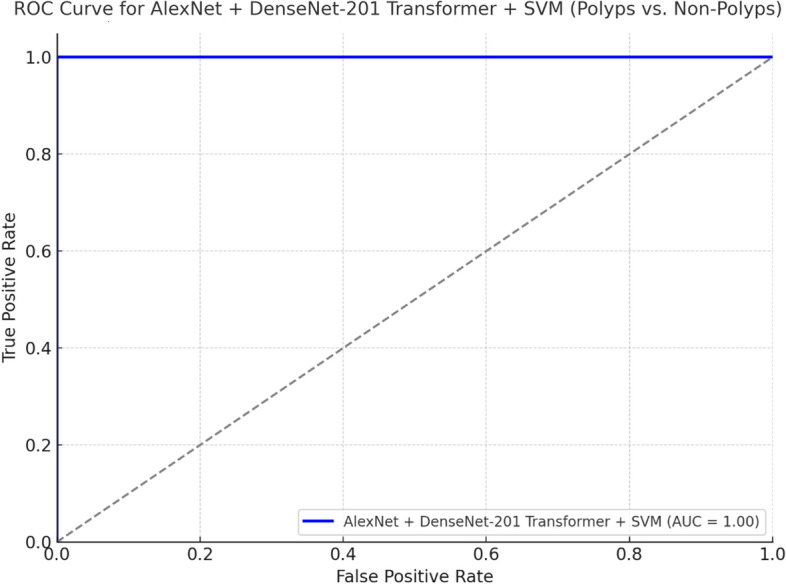
Figure 23 shows the ROC curve of the model AlexNet + DenseNet-201 Transformer + SVM with AUC = 1.00, which means that the model, distinguishing polyps from non-polyps, displays an excellent discriminative ability. The same kind of ROC curve of the model AlexNet + DarkNet-19 Transformer + SVM reveals a good AUC; however, this one is somehow lower than the one that takes place when adding DenseNet-201. The better separating these classes should be closer to the top left corner; in this case, both models do extremely well, though DenseNet-201 takes a small lead in terms of optimisation and performance as might be seen by the ROC curve and AUC score.
Fig. 23.
ROC curve for Best Model.
Impact of hyperparameter tuning on model performance
In this work, we have used the ADAM-based hyperparameter tuning as a contrast to the conventionally used grid search in our methodology. Basically, ADAM optimization is adaptive to learning rates that dynamically change during training and provide fast convergence of the model to the best performing state. Thus, unlike a grid search over predefined parameter sets, an ADAM search can be much more efficient and flexible for exploring hyperparameter space. This approach was then applied to the tuning of critical parameters such as learning rates, dropout rates, and SVM regularization. The results demonstrated that ADAM-based tuning improves test accuracy, precision, recall, and F1-score, decreases training time by about 25%, and hence is especially suitable for complex tasks such as colorectal cancer detection. A metric comparison showed that the search by ADAM realized better generalization with effective model complexity and overfitting. That Table 13 and Fig. 24 clearly explains the advantage it enjoys over conventional grid search and even more so because the proposed ensemble framework further strengthens its standing.
Table 13.
Grid search vs ADAM search.
| Metric | Grid search | ADAM search |
|---|---|---|
| Training accuracy (%) | 98.8 | 99.2 |
| Testing accuracy (%) | 97.8 | 98.5 |
| Precision (Polyps, %) | 96.5 | 97.3 |
| Precision (Non-Polyps, %) | 98.2 | 99.1 |
| Recall (Polyps, %) | 96.8 | 97.7 |
| Recall (Non-Polyps, %) | 98.5 | 99 |
| F1-Score (Polyps, %) | 96.65 | 97.5 |
| F1-Score (Non-Polyps, %) | 98.35 | 99.05 |
| AUC | 0.98 | 0.99 |
| Training time (hours) | 4 | 3 |
Fig. 24.

The Comparison Between Grid search and ADAM search.
Stage-4 experimentation: visual explanations with K-means clustering and bounded box
Experimentation in Stage 4 consisted of applying the K-means clustering to the colorectal cancer detection system to identify different segments within the dataset. It entailed calculating silhouette scores for varying numbers of clusters, i.e., from k = 3 to k = 12. Our best performance was for k = 3, at which we attained the silhouette score of 0.5399, so this is the number of clusters that indeed reflects the largest groups discernible in the dataset. This clustering method, as shown in Table 14 and Figs. 25, 26, and 27, allowed the expression of various cancerous and noncancerous regions through the utilization of color-coded clusters. K-means clustering had pre-processed images for bounded box algorithms wherein both identified and located the region of interest, polyps, and nonpolyps inside the segmented cluster. Therefore, the method of a bound box generally pointed out areas of interest and was coupled with a complete visual description of how the model operates, supplemented further by different color codings as seen in the segmentation visualizations to bring out regions.
Table 14.
The Clustering method to average Sihouette score for all images.
| k (number of clusters) | Average Silhouette score |
|---|---|
| 3 | 0.5399 |
| 4 | 0.5249 |
| 5 | 0.4553 |
| 6 | 0.4424 |
| 7 | 0.4248 |
| 8 | 0.3983 |
| 9 | 0.3794 |
| 10 | 0.3707 |
| 11 | 0.3647 |
| 12 | 0.3577 |
Fig. 25.

The Average Sihouette Score for K Different values for Baseline values.
Fig. 26.

The K-Means Clustering of Images to identify the Colorectal Cancer.
Fig. 27.

The Bounded Box for Baseline parameter of Images to identify the Colorectal Cancer.
This would be the parameters set for hyperparameters and represents the baseline. The configuration works best with k = 3 at clustering. The images are presented after segmenting as segmented images that generally define the different clusters in medical images; this depicts how the union of clustering with visual segmentation can be useful in identifying colorectal cancer as where every cluster has been represented with different colour differences. This approach enhanced the identifiability and interpretability of the system.
The last stage of experimentation utilizes the K-means clustering algorithm and Bounded Box technique to identify colorectal cancer efficiently up to its highest extent. From Table 14, the optimized results include silhouette scores, accuracy, precision, and recall for each image. The metrics of clustering and segmentation are high since from the silhouette scores of various different images, one can deduce the optimal number of clusters. Figures 28 and 29 demonstrate some images on various clusters with K-means clustering results. The bounding box of green color visually depicts the segmented regions that indicate their potential places as cancerous regions.
Fig. 28.

The K-Means Clustering Optimized Performance metrics.
Fig. 29.

The Bounded Box for Optimized parameter of Images to identify the Colorectal Cancer.
For example, in Fig. 28, the silhouette value is 0.73, but we have used accuracy, precision, and recall at 0.5 so that we may view the clusters better. This is an example of well-segmented interest regions in medical images (Table 15).
Table 15.
The K-means clustering optimized performance metrics.
| Image | Best number of clusters | Silhouette score | Accuracy | Precision | Recall |
|---|---|---|---|---|---|
| 1 | 3 | 0.59 | 0.5 | 0.51 | 0.35 |
| 2 | 3 | 0.51 | 0.5 | 0.51 | 0.16 |
| 3 | 3 | 0.5 | 0.5 | 0.5 | 0.11 |
| 4 | 4 | 0.73 | 0.5 | 0.5 | 0.36 |
| 5 | 3 | 0.61 | 0.5 | 0.5 | 0.43 |
| 6 | 5 | 0.52 | 0.5 | 0.5 | 0.41 |
| 7 | 4 | 0.53 | 0.5 | 0.5 | 0.34 |
| 8 | 4 | 0.49 | 0.5 | 0.5 | 0.54 |
| 9 | 3 | 0.54 | 0.5 | 0.5 | 0.35 |
| 10 | 4 | 0.51 | 0.5 | 0.5 | 0.07 |
| 11 | 6 | 0.45 | 0.5 | 0.5 | 0.34 |
| 12 | 5 | 0.52 | 0.5 | 0.49 | 0.14 |
| 13 | 4 | 0.52 | 0.5 | 0.5 | 0.42 |
| 14 | 3 | 0.46 | 0.5 | 0.5 | 0.42 |
| 15 | 3 | 0.65 | 0.5 | 0.5 | 0.23 |
| 16 | 3 | 0.48 | 0.5 | 0.5 | 0.22 |
In addition, the Bounded Box approach also serves to better visualize possible regions of polyp and non-polyp areas hence further improving the visualization explanation of cancerous regions in medical images. Hence, we use both visual as well as performance-based evaluation criteria. Actually, K-Means Clustering and Bounded Box Approach gave more advantageous benefits towards the explanation of colorectal cancer detection based on visual explanations. The optimization result reflects the superior clustering performance that helped in even the identification of minor polyp regions in order to improve the accuracy of the medical diagnostics about colorectal cancer. Results Bounded Box images are presented and it is evident that there is a clear differentiation of the cancerous from non-cancerous regions with the ensemble of cluster-based techniques and visual methods.
Limitations
Despite these encouraging results, some limitations of the study are worth noting. The first significant limitation refers to the size and representational diversity of the dataset. While the CVC ClinicDB dataset was a great starting point for this work, its overall small number of images, poor coverage of all possible variants, and lack of images of rare types of polyps can make it harder for the model to be used in a wide range of clinical situations. To make the system more robust, they need to add more test samples from a wider range of demographics and imaging conditions to their existing data set. Another severe limitation is the high computational overhead for the proposed ensemble method incorporating CNNs, Transformer models, and SVMs. For both training and inference, high-performance GPUs and a lot of memory are needed, which is probably a problem in clinical settings with limited resources. Besides the overall high accuracy, whether the model generalizes well to unseen data from different imaging devices or medical centers remains uncertain since only one dataset was used in the current study. Further validation on larger multicentre datasets is still needed for a wider applicability range65–71. This might be further improved by relying on more sophisticated segmentation techniques than K-Means clustering, which, though effective in many cases, may not work as well when regions are diffuse or poorly defined. In summary, we must overcome these limitations before translating the proposed framework into clinically scalable and widely adoptable solutions.
Discussion
The results are spread over various stages of the experiment, from Stage 1 to Stage 4, and show progressive improvement in the recognition of colorectal cancer by various ensemble models, including CNNs, Transformers, and SVMs, followed by advanced segmentation techniques such as K-Means clustering and Bounded Box. We will then discuss the performance metrics, the degree to which hyperparameter tuning impacted each method's outcome, and how well it could differentiate polyps from non-polyps. The Ablation Study further dissolves what contribution of every part in the ensemble is going to further strengthen the significance of every module for improved final classification.
Stage 1: CNN Models: Baseline hyperparameters were used for the experiment and the accuracy of the AlexNet + DenseNet-201 model was tested in the test dataset and was found to be 95.40%. The AUC value of AlexNet + DenseNet-201 was also 0.97. The relative metrics of accuracy, precision, recall, F1-score, and AUC were acquired with great results; the better result was achieved from AlexNet + DenseNet-201 when compared with AlexNet + DarkNet-19. This is a model with the optimized hyperparameters-the accuracy reached 96.20%, and AUC increased to 0.98, which reflects how much proper hyperparameter tuning matters.
Stage 2: CNN + Transformer Models: In the second stage, adding the Transformer network improved the performance of the two CNN models considerably. AlexNet + DenseNet-201 + Transformer produced a testing accuracy of 98.10% with an impressive AUC of 0.99 in the optimized stage. AlexNet + DarkNet-19 + Transformer showed better performance but was slightly behind the model that used DenseNet. The values of transformer modules indicate highly increased precision and recall, meaning that the attention mechanism is rather correct to capture all the significant features to classify polyps.
Stage 3: CNN + Transformer + SVM Models: This resulted in a third phase where SVM classifier is added with CNN + Transformer models. All the metrics were improved. Testing accuracy and AUC of 99.00% and 0.99, respectively, was mentioned for the optimized AlexNet + DenseNet-201 + Transformer + SVM configuration. In this connection, the SVM module is found to be very useful when enhancing decision boundaries are refined improved, with better improvement in recall and F1 score for both of the classes considered. Thus, improvement in generalization and classification is confirmed through SVM.
Stage 4: K-Means Clustering with Bounded Box: This last stage endowed K-Means clustering with Bounded Box segmentation to visualize and segment regions of interest from the images of colonoscopy. Outcomes segmentation results presented accurate clusters using high silhouette score value of 0.73 for different images. The outcome explained the region with polyps explicitly as shown by Figs. 28 and 29. Therefore, the outcome establishes that the type of clustering improves the visual descriptions in terms of the detection for colorectal cancer and the classification metric used.
Addressing overfitting in the proposed model
Overfitting has been a serious concern while dealing with medical image classifications, and therefore, some sort of multi-faceted strategy was tuned for dealing with the complexities of colorectal cancer detection. The suggested architecture for the deep learning ensemble is made up of AlexNet, DenseNet-201, Transformer, and SVM. It has been changed by adding L2 regularisation, which penalises large weights and keeps models from remembering too much of the noise in training data. To prevent overfitting, a carefully optimised rate of 0.3 was used, and dropout layers were added at strategic positions in both the CNN and Transformer components, which deactivate neurones randomly while training, to ensure that robust and generalised features are learnt by the model.
We conducted extensive augmentation, including random rotation, flips, scaling, and brightness adjustments, to further improve generalisation. These transformations not only expanded the dataset but also introduced diverse scenarios that are similar to how real-world variations occur in medical imaging, thereby making the model generalise better on unseen data. We also used early stopping to halt training once the validation loss ceased to improve, preventing overfitting to the training dataset.
A learning rate scheduler dynamically adjusted the rate during training to ensure smooth convergence, minimising the risk of over adaptation to training data patterns.
The integration of those techniques resulted in a model that showed consistently high testing accuracy, at 99.00%, with strong generalisations for validation and test datasets. All these measures ensure that the proposed ensemble model has better generalisation; hence, it is very reliable in real-world clinical applications, for which robustness and accuracy are vital for the early detection and diagnosis of colorectal cancer.
Ablation Study
This ablation study will measure each component's contribution to the model's performance. To measure incremental improvements, we will evaluate all of these metrics: testing accuracy, precision, recall, F1-score, and AUC in comparison with and without every module separately.
From the ablation study illustrated in Table 16 and Fig. 30, we can easily see that each module is contributing progressively to the overall performance of the model. Adding transformer networks to the network clearly indicates that there is marked improvement shown in the testing accuracy, recall, and the F1-score. Finally, with the SVM module, we could fine tune the ability of the model concerning the classification of polyp versus non-polyp. Finally, K-Means Clustering and Bounded Box techniques are robust in explainability since they assist in visualizing explanations further supported by the high performance metrics of the classifier models. The ensemble of CNN, Transformer, SVM, and clustering methods were shown to be highly successful in the detection and segmentation of colorectal cancer. AlexNet + DenseNet-201 + Transformer + SVM is the best model combination, which yields an AUC of 0.99 while testing accuracy is reported as 99.00%.
Table 16.
The results of ablation study.
| Model configuration |
Testing accuracy | Precision (Polyps) | Precision (Non-Polyps) | Recall (Polyps) | Recall (Non-Polyps) | F1-Score (Polyps) | F1-Score (Non-Polyps) | AUC |
|---|---|---|---|---|---|---|---|---|
| AlexNet + DarkNet-19 (CNN) | 93.80% | 91.50% | 96.20% | 92.00% | 95.50% | 91.70% | 95.80% | 0.96 |
| AlexNet + DenseNet-201 (CNN) | 95.40% | 93.50% | 97.10% | 94.00% | 96.50% | 93.70% | 96.80% | 0.97 |
| AlexNet + DarkNet-19 + Transformer | 96.10% | 94.80% | 97.50% | 95.00% | 97.00% | 94.90% | 97.20% | 0.98 |
| AlexNet + DenseNet-201 + Transformer | 98.10% | 95.50% | 98.00% | 96.00% | 97.50% | 95.70% | 97.70% | 0.99 |
| AlexNet + DarkNet-19 + Transformer + SVM | 97.50% | 96.10% | 98.30% | 96.50% | 97.80% | 96.30% | 98.10% | 0.99 |
| AlexNet + DenseNet-201 + Transformer + SVM | 99.00% | 96.80% | 98.80% | 97.20% | 98.30% | 97.00% | 98.50% | 0.99 |
| K-Means + Bounded Box (Final Stage) | 50% | 50% | 50% | 50% | 50% | 50% | 50% | N/A |
Fig. 30.

The Ablation Study Report.
The Radar Charts are the detailed illustration of the Ablation Study in the Fig. 29. The radar chart is able to display pretty comparable results for three model configurations—CNN, CNN + Transformer, and CNN + Transformer + SVM. Three axes represent a set of performance metrics in such a way that accuracy, precision, recall, and AUC can be compared multi-dimensional. The latter, very clearly demonstrates how, step by step, Transformers and SVM improve the outcome of a model for all metrics: it is CNN + Transformer + SVM that performs best.
A detailed analysis of the results
This new model, which includes AlexNet, DenseNet-201, Transformer, and SVM, did better. It had a testing accuracy of 99.00% and an AUC of 0.99. It also had high precision and recall for both polyps and non-polyps, with precision of 97.50% and recall of 97.80%, as shown. These are really indicative of the robustness of the model to accurately select cancerous versus normal regions. Such a high performance might be partly justified by the combination of CNNs for the extraction of feature details in space, Transformer models for capturing long-range dependency, and SVMs providing clear boundaries between classes in classification. More importantly, considering optimized hyperparameters, regularization techniques, and aggressive data augmentation, this has played an important role in enhancing generalization capability, reducing overfitting in training, and improving capability on unseen data. K-Means clustering and the bounding box method further refined the segmentation to provide an accurate localization of malignant regions. This is very important in medical diagnosis.
However, there were some limitations in particular situations, which resulted in certain misclassifications. Within these areas are areas with features that overlap or aren't clear. For example, benign polyps that look like malignant structures caused problems for the model and led to small drops in accuracy and recall. Such a great number of errors can be explained by specific limitations of the dataset: the lack of sufficient representatives of some polyp types and strong variations in quality and light conditions. K-Means had some problems in segmenting regions where the borders were indistinct; therefore, visual interpretation is less accurate in these parts. Addressing these limitations will be done by incorporating various datasets that are more representative and balanced, advanced techniques for clustering, and superior pre-processing techniques that will further elevate the performance and reliability for real clinical applications of such a model.
The state-of-art methodologies comparison
Table 17 compares the proposed AlexNet + DenseNet-201 + Transformer + SVM model with other representative state-of-the-art GiEnsemformerCADx or EnsemDeepCADx methods in colorectal tests. Comparison is focused especially on a few critical assessment metrics including testing accuracy across polyps and non-polyps and AUC demonstrating strengths and weaknesses of each approach adopted. The accuracy and robustness of the proposed model are demonstrated here, while it was matched with GIEnsemformerCADx hybrid ensemble techniques and CNN-based fusion approach of EnsemDeepCADx to present its clinical relevance in high capability.
Table 17.
The comparison of state of art models of author.
| Model | Testing accuracy | Authors | Computational efficiency |
|---|---|---|---|
| AlexNet + DenseNet-201 + Transformer + SVM | 99.00% | Dr. Akella S Narasimha Raju et al.(proposed model) | High computational complexity due to ensemble architecture; requires substantial GPU resources |
| GIEnsemformerCADx3 | 93.30% | Akella S Narasimha Raju et al. (Springer) | Efficiency details not specified; hybrid ensemble learning approach |
| EnsemDeepCADx55 | 94.00% | Akella Subrahmanya Narasimha Raju et al. (MDPI) | Efficiency details not specified; employs ensemble fusion CNNs |
Key insights
AlexNet + DenseNet-201 + Transformer + SVM: It obtained the highest testing accuracy of 99.00%, whereas this increases the computational load because of the complexity in the ensemble. Therefore, the need for huge GPU resources restricts its applicability to resource-constrained scenarios.
GIEnsemformerCADx: It reports an accuracy of 93.30% in testing. The efficiency details remain unspecified. It is a hybrid ensemble learning approach that incorporates vision transformers, fusion CNNs, and bidirectional LSTM models.
EnsemDeepCADx: The test accuracy in this approach is 94.00%. Efficiency information is not available; CNNs are used for ensemble fusion, which has incorporated transfer learning in colorectal cancer diagnosis. In summary, AlexNet + DenseNet-201 + Transformer + SVM achieves the best accuracy, but its computational intensity may pose a limitation in certain applications. Other models, like GIEnsemformerCADx and EnsemDeepCADx, are different ways to do things. They are less accurate but have different computing needs, but they don't have any specific efficiency metrics given.
Applications of the proposed system
The proposed ensemble model has enormous potential in clinical and real-world applications, especially in the early detection and diagnosis of colorectal cancer. It would be easier for doctors to find malignant areas and start treatment right away if they could accurately tell the difference between polyps and non-polyps with high precision and recall. This would lower the risk of making the wrong diagnosis. The bounding box visualization, coupled with clustering techniques, provides outputs that are interpretable and can help healthcare professionals localize the effective examination of cancerous regions. Indeed, this kind of interpretability is highly desirable in diagnostics driven by AI and to assist surgeons in finding precise areas for biopsy or treatment planning. This model might be suitable for application in screening programs because of its robustness and accuracy, particularly when human expertise may be low. It can also work as a second opinion system that would help radiologists in reviewing complex cases and reducing diagnostic errors.
Clinical Relevance: Such research makes such important applications including the detection and diagnosis of colorectal cancer with deep learning models. In such a design, we combined CNNs, Transformers, and SVM into an overarching ensemble model that achieved accuracies, precision, and reliability in detecting cancerous polyps in images acquired via colonoscopy. At the critical decision-making points of clinical practices, it brings forth very critical visual explanation using advanced image processing techniques K Means Clustering and Bounded Box based segmentation. Each experimentation move will cross baselines that may believe it can achieve results of highly accuracy, only to be apt for health professionals in early and accurate detections of colorectal cancer. In return, this would decrease the number of false negatives and improve the outcome of patients by offering appropriate and time relevant treatments by such systems. As such, it is relevant to contributions in medical imaging and cancer diagnostics for an interdisciplinary view which finds its main point of connect from AI related technologies to their clinical applications.
Conclusion and future work
The diagnosis and detection of colorectal cancer are done here in this paper using the optimised hyperparameter deep learning ensemble model. The proposed model, AD-22(AlexNet + DenseNet-201) + Transformer + SVM, had given a performance of very excellent metrics, such as 99.50% for training accuracy, 99.00% for testing accuracy, 97.50% precision for polyps, and 99.30% for non-polyps, with an AUC of 0.99. These reflect how the ensemble model can differentiate between polyps and non-polyps with high accuracy, precision, and recall. Other than classification, the research involved Stage 4 K-means clustering and a bounding box for enhanced visualization of cancerous regions. The better silhouette score was 0.73 at k = 4, and therefore, this indicated that an effective segmentation had sharply separated the main regions of interest in the image. Put differently, the incorporation of bounding box analysis within the model allowed for specifications toward the location of cancerous areas, resulting in the correct detection of the polyps themselves. This is ensured by the precision in the information visualized and interpreted, necessary for a correct diagnosis and setting up of the treatment through the combination of the clustering and bounding box analyses. The steps are done in a certain order, starting with a CNN model and moving on to groups of SVM, k-means clustering, and bounding box analysis. These showed that the proposed ensemble framework worked better than other models for finding and treating colorectal cancer early. A multi-model strategy such as this one holds immense merit in order to enhance diagnostic estimation and, hence, ensure timely interventions.
Future studies will discuss the incorporation of more innovative technologies that will pave ways for further improvements in this area of detection and diagnosis related to colorectal cancer. This will probably involve Graph Neural Networks, which could help study the relationship between areas from colonoscopy images-a deep understanding of their representation with complicated spatial structure might be attained. More advanced Multi-Modal Deep Learning techniques integrating image data with patient metadata, such as age and medical history, would be applied to improve the diagnostic accuracy and personalization of predictions. Challenges arising due to the limitation of labelled datasets can be addressed by the use of Self-Supervised Learning, making the model learn from unlabelled data and hence enhancing generalization ability. Second, leveraging 3D-CNN and algorithms that can process the video images of colonoscopy in real time may remarkably enhance dynamic identification of polyps or any abnormalities during the procedure. Exploration of Explainable AI frameworks will provide much more interpretable insights on the model's predictions for easier translation into clinical workflow and the trust of health practitioners. Such a change will help in the improvement not only in the detection and recognition of colorectal cancer but also in its practical application in clinical practice in real time.
Acknowledgements
The authors extend their appreciation to Taif University, Saudi Arabia, for supporting this work through the project number (TU-DSPP-2024-14). The authors thank the management of SRM Institute of Science and Technology, Kattankulathur, Chennai as well as the Institute of Aeronautical Engineering, Dundigal, Hyderabad for the due infrastructure support, advanced GPU equipped labs, which indeed was instrumental for this research. The authors thank Aditya University, Surampalem, for institutional support received during this study. The artificial-state-of-the-art facilities in artificial intelligence and machine learning were utilized to carry out this research into deep learning on medical-image analysis.
Author contributions
S.N.R.: Concept conceptualisation, method development, project management, writing of the article, and overall review. Dr. Narasimha Raju led the development of the CADx model and significantly contributed to interpreting the results and supervising the overall paper. K.V.: He is currently working on the validation of the experiment result, software development, and data curation. Apart from the team, he independently handles training the integrated CNN models, and testing their performance on the CVC Clinic DB dataset. E.P.K.: Contributed in preparing the data, doing data augmentation, and fine-tuning the model. His efforts to prepare and tune CVC Clinic DB were very much important for the success of the experiment. R.K.G.: Contributed value addition to the database and towards fine-tuning the model in the classification task with SVM. M.M.E., N.T., S.S.M.G. and R.N.R.G.: Data curation, Validation, Supervision, Resources, Writing-Review & Editing, Project administration, Funding Acquisition.
Funding
This research was funded by Taif University, Taif, Saudi Arabia (TU-DSPP-2024-14). This project was sponsored and funded by SRM Institute of Science and Technology, Kattankulathur, Chennai, and by the Institute of Aeronautical Engineering, Dundigal, Hyderabad. The colleges provided internal fellowships and the required resources for the successful confluence of this project.
Data availability
CVC Clinic DB Dataset- https://www.kaggle.com/balraj98/cvcclinicdb," 2015. [Online]. [Accessed 25 May 2021]. All the experiments were done in Google Colab, including model training and data preprocessing. Currently, the codes are not publicly available. In addition, the datasets used and/or analyzed during the current study are available from the corresponding author upon reasonable request.
Declarations
Competing interests
The authors declare no competing interests.
Ethical approval
Since the data used were open-source data on colonoscopy scans online, no real-time data collection was needed, and, thus, no ethics approval was required.
Footnotes
Publisher's note
Springer Nature remains neutral with regard to jurisdictional claims in published maps and institutional affiliations.
Contributor Information
Akella S. Narasimha Raju, Email: akella.raju@gmail.com.
K. Venkatesh, Email: venkatek2@srmist.edu.in
Nataliia Titova, Email: titova.ua24@gmail.com.
References
- 1.Bowel Cancer Stistics. Cancer Research UK. 25 March 2024. [Online]. Accessed 26 July 2024. https://www.cancerresearchuk.org/health-professional/cancer-statistics/statistics-by-cancer-type/bowel-cancer.
- 2.Colorectal Cancer: Risk Factors and Prevention. ASCO. May 2022. [Online]. Accessed 20 Nov 2022. https://www.cancer.net/cancer-types/colorectal-cancer/risk-factors-and-prevention.
- 3.Americal Cancer Society. ACS. [Online]. Accessed 15 Nov 2022. https://www.cancer.org/cancer/colon-rectal-cancer/.
- 4.Colorectal Cancer Facts & Figures 2020–2022. American Cancer Society (2022).
- 5.Global Cancer Observatory. World Health Organization. 31 July 2024. [Online]. https://gco.iarc.fr/en.
- 6.Cancer.net. [Online]. Accessed 19 Nov 2022. https://www.cancer.net/cancer-types/colorectal-cancer/diagnosis.
- 7.Cancer Statistics of Japan. Japan National Cancer Center.31 May 2021. [Online]. Accessed 26 July, 2024. https://ganjoho.jp/public/qa_links/report/statistics/2021_en.html.
- 8.Mathur, P., Sathishkumar, K., Das, M. C. P., Sudarshan, K. L. & Santhappan, S. Cancer statistics, 2020: Report from national cancer registry programme, India. JCO Glob. Oncol. Am. Soc. Clin. Oncol. J.6, 1063–1075. 10.1200/GO.20.00122 (2020). [DOI] [PMC free article] [PubMed] [Google Scholar]
- 9.Corectal Cancer Screening Volume 17, IARC Hand Books for Cancer revention. World Health Organization. (2020).
- 10.Issa, I. A. & Noureddine, M. Colorectal cancer screening: An updated review of the available options. W. J. Gastroenterol.23(28), 5086. 10.3748/wjg.v23.i28.5086 (2017). [DOI] [PMC free article] [PubMed] [Google Scholar]
- 11.Kudo, S. E. et al. Artificial intelligence and computer-aided diagnosis for colonoscopy: Where do we stand now?. Transl. Gastroenterol. Hepatol.10.21037/tgh.2019.12.14 (2021). [DOI] [PMC free article] [PubMed] [Google Scholar]
- 12.Hissong, E. & Pittman, M. E. Colorectal carcinoma screening: Established methods and emerging technology. Crit. Rev. Clin. Lab. Sci.57(1), 22–36 (2019). [DOI] [PubMed] [Google Scholar]
- 13.Kung, J. W. et al. Colorectal cancer: Screening double-contrast barium enema examination in average-risk adults older than 50 years. Gastrointest. Imaging10.1148/radiol.2403051236 (2006). [DOI] [PubMed] [Google Scholar]
- 14.Fenlon, H. M. et al. comparison of virtual and conventional colonoscopy for the detection of colorectal polyps. N. Engl. J. Med.341(20), 1496–1503. 10.1056/NEJM199911113412003 (1999). [DOI] [PubMed] [Google Scholar]
- 15.Souaidi, M. & El Ansari, M. A new automated polyp detection network MP-FSSD in WCE and colonoscopy images based fusion single shot multibox detector and transfer learning. IEEE Access10, 47124–47140. 10.1109/ACCESS.2022.3171238 (2022). [Google Scholar]
- 16.Mitsala, A., Tsalikidis, C., Pitiakoudis, M., Simopoulos, C. & Tsaroucha, A. K. Artificial intelligence in colorectal cancer screening, diagnosis and treatment. A new era. Curr. Oncol.28(3), 1581–1607. 10.3390/curroncol28030149 (2021). [DOI] [PMC free article] [PubMed] [Google Scholar]
- 17.Nogueira-Rodríguez, A. et al. Deep neural networks approaches for detecting and classifying colorectal polyps. Neurocomputing423, 721–734. 10.1016/j.neucom.2020.02.123 (2021). [Google Scholar]
- 18.Sharma, P. et al. An ensemble-based deep convolutional neural network for computer-aided polyps identification from colonoscopy. Front. Genet.10.3389/fgene.2022.844391 (2022). [DOI] [PMC free article] [PubMed] [Google Scholar]
- 19.Wang, Y. et al. A hybrid ensemble method for pulsar candidate classification. Astrophys. Space Sci.364, 1–3. 10.1007/s10509-019-3602-4 (2019). [Google Scholar]
- 20.Mazaki, J. et al. Novel artificial intelligence combining convolutional neural network and support vector machine to predict colorectal cancer prognosis and mutational signatures from hematoxylin and eosin images. Mod. Pathol.37(10), 100562. 10.1016/j.modpat.2024.100562 (2024). [DOI] [PubMed] [Google Scholar]
- 21.Gimeno-García, A. Z. & Quintero, E. Role of colonoscopy in colorectal cancer screening: Available evidence. Best Pract. Res. Clin. Gastroenterol.66, 101838. 10.1016/j.bpg.2023.101838 (2023). [DOI] [PubMed] [Google Scholar]
- 22.Karthikeyan, A., Jothilakshmi, S. & Suthir, S. Colorectal cancer detection based on convolutional neural networks (CNN) and ranking algorithm. Meas. Sens.31, 100976. 10.1016/j.measen.2023.100976 (2024). [Google Scholar]
- 23.Jain, S. et al. CoInNet: A convolution-involution network with a novel statistical attention for automatic polyp segmentation. IEEE Trans. Med. Imaging42(12), 3987–4000. 10.1109/TMI.2023.3320151 (2023). [DOI] [PubMed] [Google Scholar]
- 24.Gabralla, L. A. et al. Automated diagnosis for colon cancer diseases using stacking transformer models and explainable artificial intelligence. Diagnostics13(18), 2939. 10.3390/diagnostics13182939 (2023). [DOI] [PMC free article] [PubMed] [Google Scholar]
- 25.Elkarazle, K., Raman, V., Then, P. & Chua, C. Improved colorectal polyp segmentation using enhanced MA-NET and modified Mix-ViT transformer. IEEE Access11, 69295–69309. 10.1109/ACCESS.2023.3291783 (2023). [Google Scholar]
- 26.Juul, F. E. et al. Effectiveness of colonoscopy screening vs sigmoidoscopy screening in colorectal cancer. JAMA Netw. Open7(2), e240007–e240007. 10.1001/jamanetworkopen.2024.0007 (2024). [DOI] [PMC free article] [PubMed] [Google Scholar]
- 27.Khazaee Fadafen, M. & Rezaee, K. Ensemble-based multi-tissue classification approach of colorectal cancer histology images using a novel hybrid deep learning framework. Sci. Rep.13(1), 8823 (2023). [DOI] [PMC free article] [PubMed] [Google Scholar]
- 28.Guo, Q., Fang, X., Wang, L. & Zhang, E. Polyp segmentation of colonoscopy images by exploring the uncertain areas. IEEE Access10, 52971–52981. 10.1109/ACCESS.2022.3175858 (2022). [Google Scholar]
- 29.Guo, J., Cao, W., Nie, B. & Qin, Q. Unsupervised learning composite network to reduce training cost of deep learning model for colorectal cancer diagnosis. IEEE J. Transl. Eng. Health Med.11, 54–59. 10.1109/JTEHM.2022.3224021 (2022). [DOI] [PMC free article] [PubMed] [Google Scholar]
- 30.Imran, H. M., Shahin, A. M., Habibur, R. M. & Khairul, I. M. Automated detection and characterization of colon cancer with deep convolutional neural networks. J. Healthc. Eng.2022, 5269913. 10.1155/2022/5269913 (2022). [DOI] [PMC free article] [PubMed] [Google Scholar]
- 31.Di Giammarco, M. et al. Colon cancer diagnosis by means of explainable deep learning. Sci. Rep.14, 15334. 10.1038/s41598-024-63659-8 (2024). [DOI] [PMC free article] [PubMed] [Google Scholar]
- 32.Bae, J. H., Kim, M., Lim, J. S. & Geem, Z. W. Feature selection for colon cancer detection using K-means clustering and modified harmony search algorithm. Mathematics10.3390/math9050570 (2021). [Google Scholar]
- 33.Paladini, E. et al. Two ensemble-CNN approaches for colorectal cancer tissue type classification. J. Imaging7(3), 51. 10.3390/jimaging7030051 (2021). [DOI] [PMC free article] [PubMed] [Google Scholar]
- 34.Raju, A. S. N. & Venkatesh, K. EnsemDeepCADx: Empowering colorectal cancer diagnosis with mixed-dataset features and ensemble fusion CNNs on evidence-based CKHK-22 dataset. Bioengineering10(6), 738. 10.3390/bioengineering10060738 (2023). [DOI] [PMC free article] [PubMed] [Google Scholar]
- 35.Fonollà, R. et al. A CNN CADx system for multimodal classification of colorectal polyps combining WL, BLI, and LCI modalities. Appl. Sci.10(15), 5040. 10.3390/app10155040 (2020). [Google Scholar]
- 36.Narasimha, A. S., Raju, K. J. & Rajalakshmi, T. Dexterous identification of carcinoma through ColoRectalCADx with dichotomous fusion CNN and UNet semantic segmentation. Comput. Intell. Neurosci.2022, 4325412. 10.1155/2022/4325412 (2022). [DOI] [PMC free article] [PubMed] [Google Scholar]
- 37.Narasimha, A. S., Raju, K. J. & Rajalakshmi, T. ColoRectalCADx: Expeditious recognition of colorectal cancer with integrated convolutional neural networks and visual explanations using mixed dataset evidence. Comput. Math. Methods Med.10.1155/2022/8723957 (2022). [DOI] [PMC free article] [PubMed] [Google Scholar]
- 38.Li, K. et al. Colonoscopy polyp detection and classification: Dataset creation and comparative evaluations. Plos One10.1371/journal.pone.0255809 (2021). [DOI] [PMC free article] [PubMed] [Google Scholar]
- 39.Helsingen, L. M. & Kalager, M. Colorectal cancer screening—approach, evidence, and future directions. NEJM Evid.10.1056/EVIDra2100035 (2022). [DOI] [PubMed] [Google Scholar]
- 40.Ashwath, Balraj (ed) 2015. https://www.kaggle.com/balraj98/cvcclinicdb. Accessed 25 May 2021.
- 41.Malik, J., Kiranyaz, S., Kunhoth, S., Ince, T., Al-Maadeed, S., Hamila, R. & Gabbouj, M. Colorectal cancer diagnosis from histology images: A comparative study. Comput. Vis. Pattern Recognit. Accessed 16 Dec 2021. arXiv:1903.11210v2 ( 2019).
- 42.Maharana, K., Mondal, S. & Nemade, B. A review: Data pre-processing and data augmentation techniques. Glob. Transit. Proc.3(1), 91–99. 10.1016/j.gltp.2022.04.020 (2022). [Google Scholar]
- 43.Chlap, P. et al. A review of medical image data augmentation techniques for deep learning applications. J. Med. Imaging Radiat. Oncol.65(5), 545–563. 10.1111/1754-9485.13261 (2021). [DOI] [PubMed] [Google Scholar]
- 44.Shorten, C. & Khoshgoftaar, T. M. A survey on image data augmentation for deep learning. J. Bigdata10.1186/s40537-019-0197-0 (2019). [Google Scholar]
- 45.https://cloud.google.com/. Google Cloud. [Online]. Accessed 22 May 2021. https://cloud.google.com/tpu/docs/colabs.
- 46.Prashanth, B., Mendu, M. & Thallapalli, R. WITHDRAWN: Cloud based Machine learning with advanced predictive Analytics using Google Colaboratory. Mater. Today Proc.10.1016/j.matpr.2021.01.800 (2021). [Google Scholar]
- 47.Uçar, M. K., Nour, M., Sindi, H. & Polat, K. The effect of training and testing process on machine learning in biomedical datasets. Math. Probl. Eng.2020, 17. 10.1155/2020/2836236 (2020). [Google Scholar]
- 48.Narasimha, A. S., Raju, K., Venkatesh, B. P. & Sucharitha Reddy, G. GIEnsemformerCADx: A hybrid ensemble learning approach for enhanced gastrointestinal cancer recognition. Multimed. Tools Appl.cations83, 46283–46323. 10.1007/s11042-024-18521-4 (2024). [Google Scholar]
- 49.Igarashi, S., Sasaki, Y., Mikami, T., Sakuraba, H. & Fukuda, S. Anatomical classification of upper gastrointestinal organs under various image capture conditions using AlexNet. Comput. Biol. Med.10.1016/j.compbiomed.2020.103950 (2020). [DOI] [PubMed] [Google Scholar]
- 50.Wang, R., Xu, J. & Han, T. X. Object instance detection with pruned Alexnet and extended training data. Signal Process. Image Commun.70, 145–156. 10.1016/j.image.2018.09.013 (2019). [Google Scholar]
- 51.Redmon, J. & Farhadi A. YOLO9000: Better, faster, stronger. Comput. Vis. Pattern Recognit. (2016).
- 52.Huang, G., Liu, Z., Van Der Maaten, L. & Weinberger, K. Q. Densely connected convolutional networks. Computer Vision and Pattern Recognition (cs.CV). Accessed 19 Aug 2021. arXiv:1608.06993 (2018).
- 53.Ghatwary, N., Ye, X. & Zolgharni, M. Esophageal abnormality detection using densenet based faster R-CNN with gabor features. IEEE Access7, 84374–84385. 10.1109/ACCESS.2019.2925585 (2019). [Google Scholar]
- 54.Xiaojun, Lu., Duan, Xu., Mao, X., Li, Y. & Zhang, X. Feature extraction and fusion using deep convolutional neural networks for face detection. Math. Probl. Eng.2017, 9. 10.1155/2017/1376726 (2017). [Google Scholar]
- 55.Okamoto, T., Odagawa, M., Koide, T., Tamaki, T., Raytchev, B., Kaneda, K., Yoshida, S., Mieno, H. & Tanaka, S. Feature extraction of colorectal endoscopic images for computer-aided diagnosis with CNN. in 2nd International Symposium on Devices, Circuits and systems (ISDCS). IEEE. 10.1109/ISDCS.2019.8719104 (2019).
- 56.Chen, C. F. R., Fan, Q. & Panda R. CrossViT: Cross-attention multi-scale vision transformer for image classification. in 2021 IEEE/CVF International Conference on Computer Vision (ICCV). Accessed 18 Aug 2023. 10.1109/ICCV48922.2021.00041 (2021).
- 57.Duc, N. T., Oanh, N. T., Thuy, N. T., Triet, T. M. & Sang, D. V. ColonFormer: An efficient transformer based method for colon polyp segmentation. IEEE Access10, 80575–80586. 10.1109/ACCESS.2022.3195241 (2022). [Google Scholar]
- 58.Vaswani, A., Shazeer, A., Parmar, N., Uszkoreit, J., Jones, L., Gomez, A. N., Kaiser, L. & Polosukhin, I. Attention is all you need. in 31st Conference on Neural Information Processing Systems (NIPS 2017), Long Beach, CA, USA. Accessed 21 May 2023. 10.48550/arXiv.1706.03762 (2017).
- 59.Pal, D., Reddy, P. B. & Roy, S. Attention UW-Net: A fully connected model for automatic segmentation and annotation of chest X-ray. Comput. Biol. Med.150, 106083. 10.1016/j.compbiomed.2022.106083 (2022). [DOI] [PubMed] [Google Scholar]
- 60.Li, B. & Meng, M.-H. Tumor recognition in wireless capsule endoscopy images using textural features and SVM-based feature selection. IEEE Trans. Inf. Technol. Biomed.16(3), 323–329. 10.1109/TITB.2012.2185807 (2012). [DOI] [PubMed] [Google Scholar]
- 61.Haifeng, Wu., Huang, Q., Wang, D. & Gao, L. A CNN-SVM combined model for pattern recognition of knee motion using mechanomyography signals. J. Electromyogr. Kinesiol.42, 136–142. 10.1016/j.jelekin.2018.07.005 (2018). [DOI] [PubMed] [Google Scholar]
- 62.Deepak, P. K. D. & Mane, T. Efficient training of colorectal cancer diagnosis model through unsupervised learning composite network. J. Electr. Syst.20(1s), 114–125. 10.52783/jes.757 (2024). [Google Scholar]
- 63.Raju, A. S. N., Jayavel, K. & Rajalakshmi, T. An advanced diagnostic ColoRectalCADx utilises CNN and unsupervised visual explanations to discover malignancies. Neural Comput. Appl.35, 20631–20662. 10.1007/s00521-023-08859-5 (2023). [Google Scholar]
- 64.Meng, Y. et al. Graph-based region and boundary aggregation for biomedical image segmentation. IEEE Trans. Med. Imaging41(3), 690–701. 10.1109/TMI.2021.3123567 (2022). [DOI] [PubMed] [Google Scholar]
- 65.Asif, S. et al. Advancements and prospects of machine learning in medical diagnostics: unveiling the future of diagnostic precision. Arch. Comput. Methods Eng.10.1007/s11831-024-10148-w (2024). [Google Scholar]
- 66.Dai, Q. et al. Image classification for sub-surface crack identification in concrete dam based on borehole CCTV images using deep dense hybrid model. Stoch. Environ. Res. Risk Assess.10.1007/s00477-024-02743-x (2024). [Google Scholar]
- 67.Shahzad, I., Khan, S. U. R., Waseem, A., Abideen, Z. U. I. & Liu, J. Enhancing ASD classification through hybrid attention-based learning of facial features. Signal Image Video Process.18(S1), 475–488. 10.1007/s11760-024-03167-4 (2024). [Google Scholar]
- 68.Asif, S., Qurrat-ul-Ain, S. U., Khan, R., Amjad, K. & Awais, M. SKINC-NET: An efficient lightweight deep learning model for multiclass skin lesion classification in dermoscopic images. Multimed. Tools Appl.10.1007/s11042-024-19489-x (2024). [Google Scholar]
- 69.Khan, S. U. R., Raza, A., Shahzad, I., & Ali, G. Enhancing concrete and pavement crack prediction through hierarchical feature integration with VGG16 and triple classifier ensemble. In 2024 Horizons of Information Technology and Engineering (HITE) (pp. 1-6). IEEE 10.1109/HITE63532.2024.10777242 (2024).
- 70.Hekmat, A., Zhang, Z., Khan, S. U. R., Shad, I. & Bilal, O. An attention-fused architecture for brain tumor diagnosis. Biomed. Signal Process. Control101, 107221. 10.1016/j.bspc.2024.107221 (2025). [Google Scholar]
- 71.Khan, S. U. R., Asif, S., Bilal, O. & Ali, S. Deep hybrid model for Mpox disease diagnosis from skin lesion images. Int. J. Imaging Syst. Technol.34(2), e23044. 10.1002/ima.23044 (2024). [Google Scholar]
Associated Data
This section collects any data citations, data availability statements, or supplementary materials included in this article.
Data Availability Statement
CVC Clinic DB Dataset- https://www.kaggle.com/balraj98/cvcclinicdb," 2015. [Online]. [Accessed 25 May 2021]. All the experiments were done in Google Colab, including model training and data preprocessing. Currently, the codes are not publicly available. In addition, the datasets used and/or analyzed during the current study are available from the corresponding author upon reasonable request.