Abstract
In transport phloem, photoassimilates escaping from the sieve tubes are released into the apoplasmic space between sieve element (SE)/companion cell (CC) complexes (SE/CCs) and phloem parenchyma cells (PPCs). For uptake respective retrieval, PPCs and SE/CCs make use of plasma membrane translocators energized by the proton motive force (PMF). Their mutual competitiveness, which essentially determines the amount of photoassimilates translocated through the sieve tubes, therefore depends on the respective PMFs. We measured the components of the PMF, membrane potential and ΔpH, of SE/CCs and PPCs in transport phloem. Membrane potentials of SE/CCs and PPCs in tissue slices as well as in intact plants fell into two categories. In the first group including apoplasmically phloem-loading species (e.g. Vicia, Solanum), the membrane potentials of the SEs are more negative than those of the PPCs. In the second group including symplasmically phloem-loading species (e.g. Cucurbita, Ocimum), membrane potentials of SEs are equal to or slightly more positive than those of PPCs. Pure sieve tube sap collected from cut aphid stylets was measured with H+-selective microelectrodes. Under our experimental conditions, pH of the sieve tube saps was around 7.5, which is comparable to the pH of cytoplasmic compartments in parenchymatous cells. In conclusion, only the membrane potential appears to be relevant for the PMF-determined competition between SE/CCs and PPCs. The findings may imply that the axial sinks along the pathway withdraw more photoassimilates from the sieve tubes in symplasmically loading species than in apoplasmically loading species.
Sieve tubes are not hermetically sealed pipes, but “porous” canals along which photoassimilates and other solutes are released and retrieved continuously (van Bel, 2003b). There is some consensus that net escape from sieve tubes in transport phloem results from release/retrieval mechanisms along the pathway (Minchin and Thorpe, 1987). These exchange events influence mass flow rates of solutes through the sieve tubes: the higher the escape rate of a particular solute, the slower the longitudinal displacement in the sieve tubes (compare with Ayre et al., 2003).
Tight control of release/retrieval through the sieve element (SE)/companion cell (CC) plasma membrane requires a high degree of symplasmic disjunction of SE/CC complexes (SE/CCs) and adjacent phloem parenchyma cells (PPCs) in transport phloem (van Bel, 1996). In phloem tissue slices (van Bel and Kempers, 1991; Oparka et al., 1992; van Bel and van Rijen, 1994) and the few intact plants investigated (Oparka et al., 1994, 1995; Rhodes et al., 1996; Knoblauch and van Bel, 1998), the containment of membrane-impermeable fluorescent dyes to SE/CCs is indicative for such a symplasmic disjunction. The latter may not be permanent, since a symplasmic SE/CC-to-PPC pathway seems to be available under sink-limiting conditions (Patrick and Offler, 1996).
A symplasmic disjunction makes that solutes released from the SE/CCs arrive into an apoplasmic interface bordered by SE/CCs and PPCs (van Bel, 1996). The extent to which photoassimilates are retrieved by SE/CCs depends on the competitiveness between SE/CCs and PPCs. The proton motive force (PMF), which is essential for solute accumulation, is a major determinant for the uptake capacity and, hence, for the competitiveness of cells. As PPCs present the borderline of the axial sink domains, the mutual PMFs of SE/CCs and PPCs were postulated to determine the amount of photoassimilates distributed over axial (accumulated by PPCs) and terminal sinks (retrieved by SE/CCs; van Bel, 1996).
Competitiveness between SE/CCs and PPCs may differ between symplasmically and apoplasmically phloem-loading species given the disparate nature of their CCs (van Bel, 2003a). Strong dissimilarities in ultrastructure and physiology of CCs in collection phloem (Gamalei, 1989; van Bel et al., 1992, 1994)—with inherent consequences for the mode of phloem loading—seem to continue to a reduced extent in transport phloem (Kempers et al., 1998). On account of these observations, two different phloem frames with a potentially disparate carbohydrate management were proposed having profound consequences for the release/retrieval balance along the pathway and perhaps for allover photosynthate distribution (van Bel, 1996).
Despite the apparent importance for whole-plant carbohydrate processing, the basics of photoassimilate exchange mechanisms in transport phloem have not been studied in detail. A first assessment of the competitiveness between SE/CCs and PPCs in transport phloem has been made by measuring the PMF components (membrane potential and proton gradient) in apoplasmically and symplasmically phloem-loading species. Having addressed a symplasmic disjunction of SE/CCs under the ambient conditions, the PMF components of SE/CCs and PPCs were determined in phloem strips as well as in intact plants. Potential consequences for a differential photoassimilate distribution between the phloem-loading types are discussed.
RESULTS
Iontophoresis of Lucifer Yellow-CH into SEs and PPCs of Tissue Slices
The first objective of this study was to assess the degree of symplasmic disjunction between SE/CCs and PPCs in transport phloem. The membrane-impermeant fluorescent probe Lucifer Yellow-CH (LYCH) was injected into the SEs to test symplasmic discontinuity between SE/CCs and PPCs.
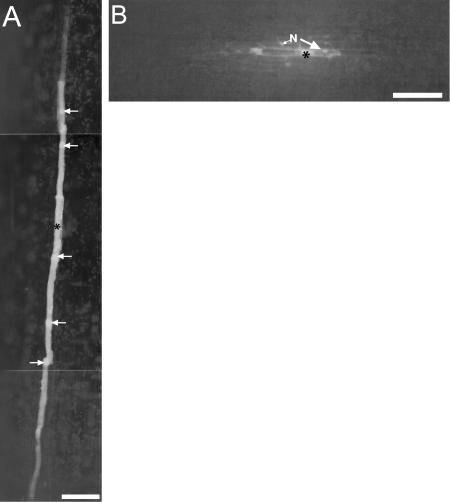
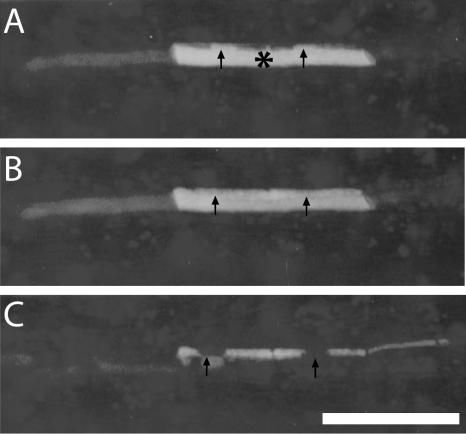
In Vicia stem phloem tissue slices, the fluorochrome moved longitudinally through the sieve pores to successive SEs after injection of LYCH into SEs. A few minutes after injection into a SE, fluorochrome arrival into CCs was observed (Fig. 1A). After LYCH injection into PPCs, the dye spread exclusively to adjacent PPCs but never to the neighboring SEs (Fig. 1B). Rapid movement of LYCH to neighboring PPCs, which is a matter of seconds, is indicative of an open state of plasmodesmata at the interface between PPCs. A time course of LYCH distribution in SEs of Vicia faba over a period of 17.5 h (Fig. 2, A–C) shows eventual LYCH accumulation in the CCs, in particular in their vacuoles, but not in the adjacent PPCs.
Figure 1.
A, Fluorescence dispersal pattern after iontophoresis of LYCH into a SE in the stem phloem of V. faba tissue slices; asterisk (*) marks point of injection. The fluorescent dye moves axially to several successive SEs. Remarkable are the strongly fluorescent spheres in the SEs (marked with arrows) due to unspecific coloring of forisomes with LYCH. Bar = 100 μm. B, Fluorescence dispersal pattern after iontophoresis of LYCH into a PPC in stem phloem of V. faba tissue slices with random transport to adjoining PPCs. Asterisk (*) marks point of injection. N, Nucleus of the PPCs marked with arrow.
Figure 2.
Time course of LYCH distribution after injection into a SE of the stem phloem in V. faba tissue slices. A to C, Immediately after injection into the SE, the dye accumulated in the nuclei of the CCs (A), after 0.5 h the dye was evenly distributed over the SE/CC compartments (B), and after 17.5 h LYCH was nearly completely accumulated by the vacuole of the CCs (C). No LYCH traffic into the adjoining PPCs was visible. Arrows point to the nuclei of the CCs. Bar = 100 μm.
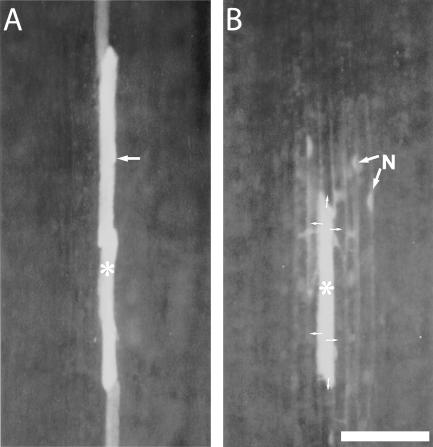
Similar observations as in V. faba were made for SE/CCs in Ocimum (Fig. 3A), Lupinus, Epilobium, and Lamium tissue slices (data not shown) and in PPCs of Ocimum (Fig. 3B), Lupinus, and Senecio tissue slices (data not shown).
Figure 3.
A, Fluorescence dispersal pattern after iontophoresis of LYCH into a SE in the stem phloem of O. basilicum tissue slices; asterisk (*) marks point of injection. The fluorochrome moved to several successive SEs. Arrow indicates nucleus of the CC. Bar = 100 μm. B, LYCH injection (* marks point of injection) into a PPC in the stem phloem of O. basilicum tissue slices with random transport to other PPCs (small arrows). Asterisk (*) marks point of injection. N with arrows, Nuclei of the PPCs.
CFDA Translocation in Phloem of Intact Plants
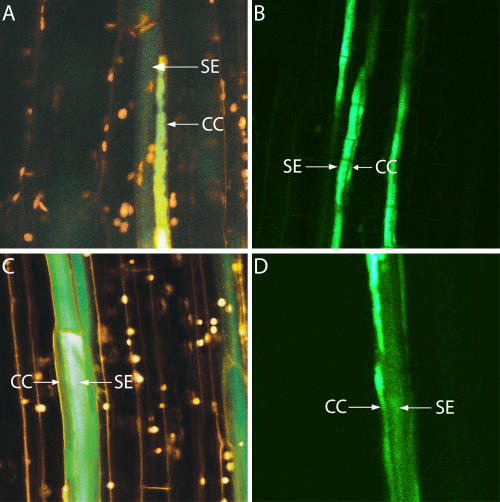
When 5-(and-6)-carboxyfluorescein diacetate (CFDA) was applied to the bare-lying phloem of a main leaf vein of intact V. faba cv Witkiem, Solanum lycopersicum, Cucurbita pepo, and Ocimum basilicum plants (Fig. 4), fluorescence remained restricted to SE/CCs. The dye was transported first in longitudinal direction, through arrays of SEs and then laterally to CCs, where CFDA finally accumulated into the vacuoles (Fig. 4). Under our experimental conditions, CFDA fluorescence was never observed in the adjoining PPCs.
Figure 4.
Confocal laser scanning microscopy of translocating SEs in intact V. faba (A), S. lycopersicum (B), C. pepo (C), and O. basilicum (D) plants. CFDA was applied to an apical transport window in the main leaf vein. Within a time range of 30 to 120 min depending on the distance to the observation window and on the plant species, fluorochrome translocation (green) through intact sieve tubes was observed. CFDA fluorescence is restricted to the SE/CCs, indicative of a symplasmic disjunction between SE/CCs and PPCs in transport phloem of the plant species tested. Double staining by fluorescent RH414 applied to the window at the site of observation provided a better demarcation of SEs and CCs (Knoblauch and van Bel, 1998).
All in all, fluorochrome behavior in tissue slices and intact plants indicates that SE/CCs and PPCs constitute two separate domains in transport phloem, at least under the present experimental conditions.
PMF of SE/CCs and PPCs as a Determinant for Intercellular Competition
We assume that competitiveness in photosynthate uptake by disjuncted but adjoining symplast domains depends on their relative driving forces sustaining cotransport. Therefore, the components of PMF were measured in SE/CCs and adjacent PPCs in the transport phloem of several plants. The PMF consists of two components, the transmembrane-voltage ΔΨm and pH gradient, according to a simplified formula:
 |
(1) |
Measurement of Membrane Potentials ΔΨm
In the first approach, ΔΨm of SE/CCs and PPCs was measured in tissue slices (Fig. 5A). Subsequently, membrane potentials were recorded in intact plants using a more elaborate approach (Fig. 5B). Prior to each intracellular measurement, the apoplasmic electrical potential was recorded (apoplast with respect to the bathing solution). Values were obtained in the range of −6 to −25 mV for tissue slices and −7 to −25 mV for intact plants and differ significantly from pipette potentials being the voltage offset in the bathing medium. Typical values for pipette potentials are in the range of −2 to −10 mV, depending on the shape and geometry of the microcapillaries. The apoplast voltage, determined for each individual cell, was subtracted from the voltage of the intracellular measurement to calculate the membrane potential.
Figure 5.
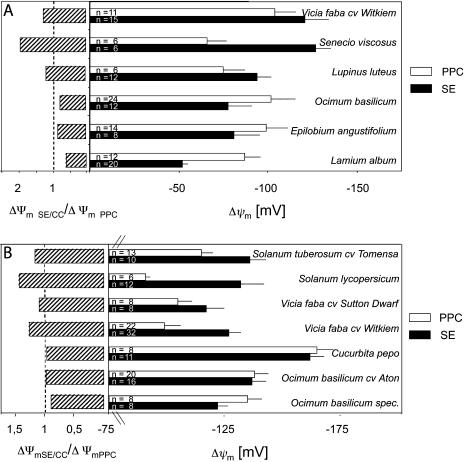
A, Resting potentials (±sd) of SE/CCs and adjoining PPCs in excised tissue slices of different species (right). The number of replicates is presented in the bars. Left, Membrane potential ratios defined as ΔΨm SE/CC/ΔΨm PPC (striped bars). B, Resting potentials of SE/CCs and adjoining PPCs in transport phloem in main veins of intact plants (right). The number of replicates is presented in the bars. Left, Membrane potential ratios defined as ΔΨm SE/CC/ΔΨm PPC (striped bars).
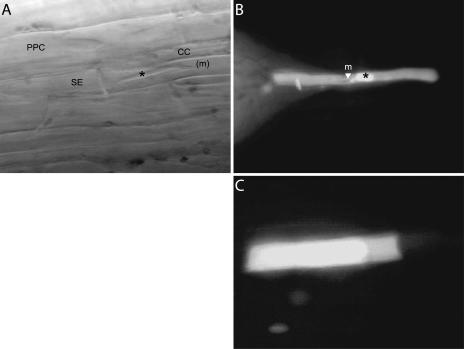
Localization of the microelectrode tip was monitored optically during impalement (Fig. 6A). Following membrane potential measurements, LYCH was injected to certify the nature of the cell type impaled (Fig. 6, B and C). Discrimination had to be made between impalement of the electrode into the cytosolic compartment or into the central vacuole, which occupies approximately 98% of the PPC volume. To this end, changes in membrane potentials were recorded during light/dark transitions. A slight hyperpolarization imposed by darkness followed by a depolarization is indicative of the presence of the microelectrode tip in the cytosolic PPC compartment (Roelfsema et al., 2001). Only cytosolic measurements were used for data analysis and evaluation of PPCs.
Figure 6.
A, Optical surveillance of microelectrode impalement. Microelectrode (m, microelectrode tip) impaled into a SE in a main vein of an intact V. faba plant is shown. *, Forisome. B, Postinjection of LYCH into a SE in a main vein of an intact V. faba plant as part of a verification procedure to identify the cell of which the membrane potential was measured. Note the tip of the microelectrode (arrowhead, m) and the forisome (*). C, Postinjection of LYCH into a PPC of an intact V. faba plant after membrane potential measurement.
In tissue slices (Fig. 5A), membrane potentials of the SEs vary between −130 mV (Senecio) and −50 mV (Lamium); those of the PPCs vary between −100 mV (Vicia) and −70 mV (Senecio). It appears therefore that the span of the PPC membrane potentials is smaller than that of the SEs. Dicotyledonous species seem to fall into two categories. In one group (Vicia, Senecio, Lupinus), the ratio ΔΨm SE/CC/ΔΨm PPC is larger than 1; the other group (Ocimum, Epilobium, Lamium) shows the reverse ratio. For whole-plant measurements (Fig. 5B), the situation is essentially similar. The membrane potentials of SEs vary between −170 mV (Cucurbita) and −117 mV (V. faba cv Sutton Dwarf), and those of the PPCs between −170 mV (Cucurbita) and −90 mV (S. lycopersicum). Again, the species fall into two categories, with ΔΨm SE/CC/ΔΨm PPC >1 and <1, respectively, although the differences are less distinct as with tissue slices.
Differences in membrane potential between SE/CCs and PPCs that vary between 10 mV and 80 mV are indicative of an electrical isolation (Fig. 5, A and B). These results corroborate the results acquired with LYCH injection in tissue slices and CFDA translocation experiments. Collectively, the data demonstrate nearly perfect symplasmic disjunction of SE/CCs and PPCs under the experimental conditions.
pH Measurements of the Sieve Tube Sap
Aphid stylet exudation enabled the collection of pure sieve tube sap (Fukumorita and Chino, 1982) from cut stylets impaled into Hordeum and Vicia sieve tubes. The pH of exuding droplets was measured using H+-selective microelectrodes. In order to prevent evaporation from the miniscule droplets that are in the nanoliter (Hordeum) or picoliter range (V. faba cv Witkiem), measurements were performed under water-saturated silicon oil. Sieve tube sap of Cucurbita and Cucumis was obtained according to the method of Ruiz-Medrano et al. (1999).
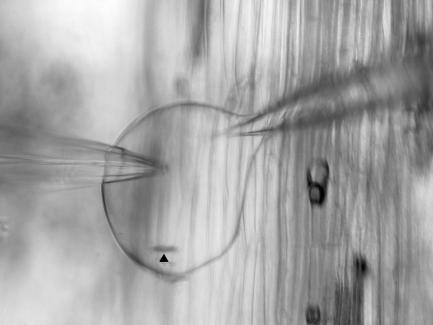
Silicon oil topping did not affect electrode characteristics and pH calibration remained stable. The calibration slopes of the microelectrodes under oil were in the range of 54 to 58 mV/pH unit, indicating a nearly perfect Nernst behavior. Figure 7 shows measurement of an approximately 100-pL droplet having exuded from the main vein of V. faba cv Witkiem. Aphid stylets impaled into sieve tubes of V. faba cv Witkiem exude for only a few minutes (up to 20 min), in contrast to those in Hordeum vulgare that exude over several hours, producing nanoliter amounts of sieve tube sap. The pH was recorded immediately after an initial exudation time of 20 min.
Figure 7.
Micro-pH measurement under silicon oil in a 100-pL droplet exuded from a stylet punctured into a SE in the main vein of an intact V. faba plant. On the left is an ion-selective electrode, on the right a KCl reference electrode inserted into the droplet. The aphid stylet is marked with a dark arrowhead.
In sieve tube drops collected from Cucurbita and Cucumis, the pH of high-purity samples was recorded immediately 2 min after bleeding. Doing so, time-dependent alkalinization of the sap was avoided. The pH of sieve tube exudate is remarkably similar between species and collecting methods: pH values of approximately 7.5 were measured for the species investigated (Table I).
Table I.
Summary of measured pH values (±sd) in sieve tube exudates of different plant species and the associated sap collection methods
| Species | Method | pHSE ± sd (n) |
|---|---|---|
| V. faba | Stylectomy/M. viciae | 7.41 ± 0.13 (10) |
| H. vulgare | Stylectomy/R. padi | 7.49 ± 0.13 (10) |
| C. sativa | Exudation | 7.62 ± 0.04 (10) |
| C. pepo | Exudation | 7.55 ± 0.08 (10) |
In cucurbits, pH shifts of 0.2 to 0.3 to more alkaline values were observed after approximately 10 to 15 min. Alkalinization of sieve tube sap from 7.5 to 8 (n = 4) was also observed for Hordeum within 2 h.
DISCUSSION
Arguments in Favor of Symplasmic Disjunction of SE/CCs and PPCs in Transport Phloem
Electron microscopy of transport phloem revealed low plasmodesmal frequencies at the interface between SEs and PPCs in symplasmically and apoplasmically phloem-loading species (Kempers et al., 1998). Under sink-limiting conditions, plasmodesmata at this interface may be open (Patrick and Offler, 1996). Under most experimental conditions, however, this apparent symplasmic bottleneck may be entirely closed (van Bel and Kempers, 1991; Kempers et al., 1998; Oparka et al., 1994, 1995; van Bel and van Rijen, 1994; Rhodes et al., 1996; Knoblauch and van Bel, 1998).
Differences in membrane potential between SE/CCs and PPCs are often so immense (Fig. 5, A and B) that SE/CCs and PPCs must operate as symplasmically disjuncted units (domains). In the case of symplasmic continuity, such differences in membrane potential (15 up to 80 mV) could not possibly be maintained. Where the membrane potential values are close (e.g. in Ocimum), LYCH injections into SE/CCs and PPCs and application of CFDA provide conclusive evidence in favor of symplasmic disjunction of both domains. Similarly, symplasmic isolation of SE/CCs and PPCs was demonstrated by intracellular injection of LYCH into transport phloem cells of Cucurbita (Kempers et al., 1998). One could argue that symplasmic isolation reported in previous publications is an artifact inherent to use of phloem tissue slices. CFDA containment in sieve tubes of intact V. faba, S. lycopersicum, C. pepo, and O. basilicum plants (Fig. 4, A–D), however, seems to invalidate this argument. The high electrical resistance at the interface between SE/CCs and PPCs in transport phloem of Lupinus could be invoked as a final support for a symplasmic disjunction (van Bel and van Rijen, 1994).
Transmembrane Potential (Ψm) of SE/CCs and PPCs in Transport Phloem of Tissue Slices and Intact Plants
Membrane potentials measured here (Fig. 5, A and B) are in line with those obtained in previous studies. Membrane potentials ascribed to SEs, obtained by so-called blind piercing into petioles of intact cucurbits, were in the range between −150 mV (Opritov and Pyatygin, 1989; Pyatygin et al., 1992) and −170 mV (Eschrich et al., 1988). Measuring membrane potentials through cut aphid stylets yielded membrane potentials of −155 mV in Salix (Wright and Fisher, 1981) and −160 mV in Mimosa (Fromm and Eschrich, 1988) sieve tubes. SE membrane potentials measured in slices of phloem tissue were in the order of −140 mV for S. lycopersicum (van der Schoot and van Bel, 1989).
Membrane potentials of the SEs range between −50 mV and −130 mV and between −117 mV and −162 mV in tissue slices and intact plants, respectively; those of PPCs lie between −66 mV and −104 mV and between −91 mV and −165 mV, respectively (Fig. 5, A and B). These values seem to favor intact plants as the most suitable system for membrane potential measurements in the phloem. At closer examination, however, the differences between slices and intact plants are negligible. The SE membrane potential in intact main veins of V. faba (−127 mV) is only slightly more negative than in excised tissue slices (−121 mV). A minor difference is also seen between SE membrane potentials in intact (−132 mV; Fig. 5B) and excised petiole tissue (−140 mV) of S. lycopersicum plants (van der Schoot and van Bel, 1989). It appears that the more amenable tissue slices provide an almost equally good experimental platform as the intact plant for assessment of membrane potentials of phloem cells. This is surprising taking into account the high sensitivity of SE physiology to any mechanistic disturbance. A disadvantage of phloem tissue slices, however, is the decrease in membrane potential with time (van Bel and van Rijen, 1994). Thus, with slices, only a narrow time window between acclimation and aging is available for reliable measurements.
Transmembrane Proton Gradient of SE/CCs and PPCs in Transport Phloem
In pure sieve tube sap exuding from cut stylets in V. faba and H. vulgare, and the sieve tube saps obtained from C. pepo and Cucumis sativa, pH values of around 7.5 were recorded using H+-selective microelectrodes. Hordeum, from which large amounts of pure sieve tube sap exude, was used as a control system. pH values of 7.48 ± 0.05 are in the same range of those of sieve tube bleeding sap of Ricinus communis (Vreugdenhil and Koot-Gronsveld, 1988).
After a sampling time of 100 min, pH values of about 8 were found in rice sieve tube exudates collected via aphid stylets (Fukumorita and Chino, 1982). We also found values of pH 8.0 after 1 to 2 h of sieve tube sap sampling in Hordeum, while the pH was 7.5 during initial sampling (Table I). Both observations indicate that sieve tube pH alkalizes in the course of sampling.
Impalement of H+-selective microelectrodes into PPCs embedded in tissues of intact plants was associated with insurmountable experimental difficulties. The electrode must pass several layers of cell without losing the H+-selective plug, and the layer of cytosol in PPCs is too thin to allow simultaneous placement of two electrodes. Therefore, a calculated guess on the cytosolic pH of PPCs was made based on the following considerations. The pH values of the sieve tube probes are similar to those of the cytosolic pH in a variety of cells (Table II). The homogeneity of data suggests a strict homeostatic control of a ubiquitous cytosolic pH needed to guarantee the operation of the cytosolic proteins. Hence, we assume that the pH of the PPCs is in the same range as that of other parenchymatous cells and SEs.
Table II.
Summary of cytosolic pH values measured in cytosolic compartments of various species
The cytosolic pH values, measured with two different methods, are around pH 7.5, indicative of a pH stat mechanism.
| Species | pHcyt | References |
|---|---|---|
| Zea mays coleoptile | 7.6a | Felle and Bertl (1986a) |
| Avena sativa coleoptile | 7.5a | Felle and Bertl (1986a) |
| V. faba guard cells | 7.4–7.5a | Frohmeyer et al. (1998) |
| Kalanchoë mesophyll | 7.5b | Hafke et al. (2001) |
| Alfalfa root hairs | 7.4a | Felle et al. (2000) |
| Ricia fluitans | 7.4–7.5a | Felle and Bertl (1986b) |
| Lemna gibba | 7.4a | Felle and Bertl (1986a) |
| Neurospora crassa | 7.5b | Sanders and Slayman (1982) |
| Chara corallina | 7.5b | Plieth et al. (1997) |
| Eremosphaera viridis | 7.35a | Bethman et al. (1998) |
pH microelectrode.
Fluorescent dye.
Competitiveness of SEs and CCs for Photoassimilates
Provided that SE/CCs and PPCs are uncoupled from each other, either cell type competes for photoassimilates in the apoplast by making use of its membrane transport capacity (Minchin and Thorpe, 1987). PMF is a major determinant of the membrane transport capacity of the respective cells. The difference in competitiveness (ΔC) can therefore be expressed as the difference in PMF between SE/CCs and PPCs:
 |
(2) |
As the transmembrane proton gradient seems approximately identical for SE/CCs and PPCs and the cells share the same homogeneous phloem apoplast (pH of the apoplast is generally around pH 5; Felle, 2001), ΔC equals:
 |
(3) |
Using the Nernst equation, substrate accumulation ratio (R) between SE/CCs and PPCs, defined as the quotient of substrate accumulation rates [SSE/CC]/[SPPC], were calculated according to the equation:
 |
(4) |
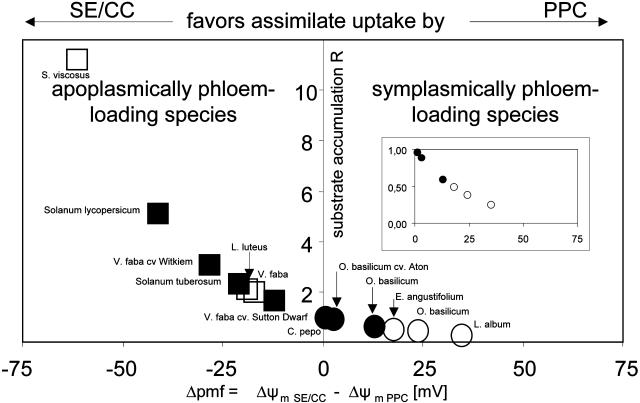
The R values (Fig. 8) varied from a factor 10 in favor of SE/CCs in Senecio viscosus to a factor 0.25 in favor of SEs in Lamium album. Thus, photoassimilate retrieval by SEs is presumably favored in species where R is higher than 1, whereas photoassimilate withdrawal by PPCs is expected to be favored when R is lower than 1.
Figure 8.
The difference in PMF (ΔPMF or ΔC) between SE/CCs and PPCs (ΔC = ΔΨm SE/CC − ΔΨm PPC) and the ratio (R) of theoretical substrate accumulation rates by SE/CCs versus PPCs in transport phloem of apoplasmically (□,▪) and symplasmically (○,•) phloem-loading species. R values were calculated from Nernst equation (Eq. 4). The open symbols represent the values for excised tissues, and the closed symbols those for intact plants. Photoassimilate retrieval by SE/CCs is presumed to be favored when R > 1, and photoassimilate accumulation by PPCs when R < 1. Inset, Magnification of the graph for R values <1.
Competitiveness fell into two categories. The species with a (Ψm SE/CC/Ψm PPC) ratio > 1 (S. lycopersicum, Solanum tuberosum, V. faba cv Witkiem and Sutton Dwarf, S. viscosus, and Lupinus luteus) all belong to the apoplasmically phloem-loading group. Those (O. basilicum, Epilobium angustifolium, L. album, and C. pepo) with a (Ψm SE/CC/Ψm PPC) ratio < 1 belong to the symplasmically phloem-loading group.
With all the emphasis put on the PMF, it should not be overlooked that an over simplified situation is presented here. This is only the first step in the analysis of the basic events in photoassimilate distribution that should lead eventually to an integrative model of carbohydrate processing.
As for SE/CCs in transport phloem, Km values were found to be clustered around a Km of 1 mm (StSUT1, 1 mm [Kühn et al., 1997]; AtSUC2, 0.77 mm [Stadler and Sauer, 1996]; PmSUC2, 1 mm [Stadler et al., 1995]) and a Km of 6 mm (PmSUC3, 5.5 mm [Barth et al., 2003]; StSUT4, 6 mm [Weise et al., 2000]) in molecular studies on Suc carriers. Preliminary data on depolarization responses evidence corresponding Km values of 1 mm and 6 to 8 mm in in situ SE/CCs (J.B. Hafke, T. Kornemann, and A.J.E. van Bel, unpublished data). To our knowledge, explicit data on Km values of PPCs in transport phloem are lacking. The same holds for Suc carriers in phloem tissues of symplasmically loading species. In the latter species, the situation is more complicated since raffinose-related sugars too are being translocated. Apart from the assessment of uptake parameters, in situ determination of Suc carrier frequencies on the respective phloem cell interfaces is also a principal issue in the competitiveness of cells.
First of all, the uptake parameters must be integrated.
Potential Consequences for Photoassimilate Distribution and Biomass Production
The common belief that carbohydrate distribution results from competition between terminal sinks neglects the role of axial sinks along the pathway (van Bel, 2003b). Their impact on photosynthate partitioning may be significant though, in particular during the vegetative stage. Early plant development requires a high photosynthate investment into the rapidly growing plant axis. At this stage, dry-weight biomass of the aboveground plant axis (stem + petioles + rachis) varies between 40% and 50% of shoot biomass (see Larcher, 2003, and refs. therein). At later stages of development, photosynthate supply to the axis is required for maintenance of mature heterotrophic axial tissues, cambial growth, and temporary storage in axial parenchyma, which plays a major role in seed filling (Patrick et al., 2003).
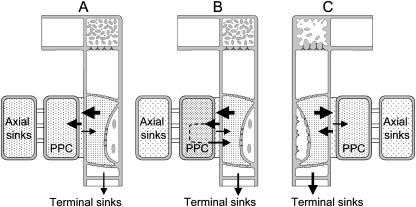
What do these results mean for the carbohydrate distribution and, in particular, the carbon flow to axial sinks? It is precarious to estimate the consequences of differential (Ψm SE/CC/Ψm PPC) ratios for the distribution events in a whole-plant frame. Essentially, a higher retrieval rate by SEs (Ψm SE/CC/Ψm PPC > 1) seems to favor transport to terminal sinks, whereas stronger accumulation by PPCs (Ψm SE/CC/Ψm PPC < 1), being the frontline of the axial sinks, would result in intensified transport to sinks around the translocation pathway (Fig. 5, A and B). However, escape and retrieval must be considered in a whole-plant framework with differences in pressure gradients, viscosity of the sieve-tube content, and functional diameter between the species; moreover, part of the solutes escaping from the SEs may never reach the PPCs because they are stored in the CCs (Ayre et al., 2003).
If the correlation between mode of phloem loading and relative strength of PPCs and the attached axial sinks turns out to be causal, terminal sinks may be nourished in apoplasmically phloem-loading species at the expense of the axial sinks (compare with van Bel, 1996; Fig. 9). The opposite would hold for symplasmically phloem-loading species. As a result, apoplasmically phloem-loading species are expected to invest more in terminal sinks (Fig. 9) and therefore exhibit larger relative growth rates than symplasmically phloem-loading species (van Bel, 1996). However, photosynthate accumulated by axial sinks may not only be used for immediate consumption (growth, maintenance) but also for temporary storage (Fig. 9). The stored material may be cycled back into the sieve tubes at another developmental stage (Fig. 9), and the differences in relative growth rate may be compensated; therefore, only a weak correlation between the (Ψm SE/CC/Ψm PPC) ratios, carbohydrate distribution, and relative growth rate is to be expected at best. A few data sets (see van Bel, 1996) provide some support for a relationship between (Ψm SE/CC/Ψm PPC) ratios in the transport phloem and relative growth rates.
Figure 9.
Hypothetical models for the impact of the difference in PMF between SE/CCs and PPCs in transport phloem (ΔC = ΔΨm SE/CC − ΔΨm PPC) on photoassimilate partitioning in symplasmically (A, B) and apoplasmically phloem-loading (C) species. The size of the horizontal arrows quantifies release from the SE/CCs and retrieval by SE/CCs and uptake by PPCs. In symplasmically phloem-loading species, more photoassimilates are accumulated by the PPCs and adjacent axial sinks, which are invested (A) or temporarily stored (B) in axial sinks. As a consequence, photoassimilates are invested to a lower degree (A) or invested with a delay (dashed line, B) into terminal sinks. The high retrieval by SE/CCs in apoplasmically loading species enables more direct photoassimilate investment into terminal sinks. The vertical arrows quantify the extent of investment in terminal sinks (A–C).
MATERIALS AND METHODS
Plant Material
Plants were grown in pots in a greenhouse at temperatures varying between 20°C and 30°C at 60% to 70% humidity and a 14/10-h light/dark period. Supplementary lamp light (model SONT Agro 400 W; Phillips, Eindhoven, The Netherlands) resulted in an irradiance level of 200 to 250 μmol m−2 s−1 at the plant apex. Test plants were all taken in the vegetative period just before flowering. Thus, species were used for experimentation at various times after germination.
Iontophoresis of LYCH into Tissue Slices
Microelectrodes for LYCH microinjections in excised phloem strips were pulled from borosilicate microcapillaries with an internal filament and an o.d. of 1 mm (GC100F-10, GC150F-10; Clark Electromedical Instruments, Reading, UK) on a vertical electrode puller (GETRA, Munich). The diameter of the microelectrode tips was approximately 1 μm.
Preparation of phloem tissue slices for iontophoresis and electrophysiological measurements has been described previously (van der Schoot and van Bel, 1990; van Bel and van Rijen, 1994). Tangential phloem-containing stem sections were excised from a fully stretched and mature internode with a fresh razor blade. Tissues were fixed in a Perspex chamber and bathed in a standard bathing medium containing 0.5 mol m−3 KCl, 0.5 mol m−3 CaCl2, 0.5 mol m−3 MgCl2, 125 mol m−3 mannitol, in a 10 mol m−3 MES/NaOH buffer, pH 5.7, for 1 h.
Microinjection was achieved by iontophoresis as described before (van Bel and van Rijen, 1994). Electrodes were backfilled with 2% (w/v) LYCH solution dissolved in bidistilled water, topped with a 3,000 mol m−3 LiCl solution, and connected to an amplifier (dual electrometer FD 233; WPI, Sarasota, FL). LYCH was iontophoretically injected by an intermittent (1 pulse s−1) current injection of −20 to −200 nA for 1 to 2 min produced by an extracellular preamplifier current pump (Dagan, Minneapolis). Injection and movement of LYCH were observed under blue light with an epifluorescence microscope (Olympus Optical, Tokyo) equipped with the appropriate filter set combination (excitation wavelength between 455 and 490 nm and a barrier filter of 495 nm). Photographs were taken with an Olympus OM-2 spot camera on Kodak Ektachrome 400 (Rochester, NY) daylight film.
Preparation of Intact Plants for Application of Phloem-Mobile CFDA and Electrophysiological Measurement
For application of CFDA (Molecular Probes, Europe BV, Leiden, The Netherlands) to the phloem of intact plants, two paradermal windows (5–15 mm apart) were cut according to Knoblauch and van Bel (1998). A few cortical cell layers were removed locally by cutting a window of 10 mm in length and 2 mm in width down to the phloem from the lower side of the main vein of a mature leaf. The cortical layer was removed by manual paradermal slicing with a fresh razor blade, while avoiding damage of the phloem tissue. The leaf was mounted on a microscope slide with a two-side adhesive tape, and the free-lying tissue was bathed in a weakly buffered standard bathing medium: 2 mol m−3 KCl, 1 mol m−3 CaCl2, 1 mol m−3 MgCl2, 100 mol m−3 mannitol, 2.5 mol m−3 MES/NaOH, pH 5.7. Immediately after preparation, the intactness of the phloem tissue was checked using a microscope (Leica DM-LB, fluorescence microscope) equipped with a special water immersion objective (HCX APO L40×/0.80 W UVI objective; Leica, Heidelberg), electrically shielded from electrophysiological devices. CFDA as a phloem mobile tracer was applied (incubation time: 30–120 min depending on the plant species) onto the apical cortical and observed through the basal cortical window using confocal laser scanning microscopy.
For electrophysiological measurements with intact plants, an identical procedure was used with the modification that only one window was excised for impalement of the electrode.
Electrophysiology
Microelectrodes for membrane potential measurements were pulled from borosilicate microcapillaries with an internal filament and an o.d. of 1 mm (GC100F-10, GC150F-10; Clark Electromedical Instruments) on a vertical electrode puller (GETRA). For membrane potential measurements in intact plant tissues, microcapillaries were fabricated from the more rigid aluminosilicate microcapillaries with an o.d. of 1 mm and an internal filament (SM100F-10; Harvard Apparatus LTD, Edenbridge, Kent, UK). The tip diameter of these electrodes was approximately 0.5 to 1 μm.
Pulled glass capillaries were back-filled with 500 mol m−3 KCl and clamped in an Ag/AgCl pellet electrode holder (WPI). The microelectrode was connected to the probe of the amplifier (DUO 773 high input impedance differential electrometer; WPI). The Ag/AgCl reference electrode was connected to the bathing medium by a 2% (w/v) agar bridge filled with 500 mol m−3 KCl solution.
Measurement of Membrane Potentials in Tissue Slices and Intact Plants
After incubation of the phloem tissues in standard bathing medium for 1 h, microelectrodes were impaled into the phloem cells under permanent optical surveillance. The microelectrode tip was maneuvered into the medium close to the phloem tissue by means of a LN SM-1-micromanipulator (Luigs & Neumann, Ratingen, Germany) and the electrode potential (tip potential + electrode diffusion) was recorded. Solely pipettes with electrode potentials less than −10 mV were used for measurements.
The electrode tip was carefully impaled through maximally two overlying cortical cell layers into the apoplast of the phloem cell to be measured. The voltage jump that differs significantly from the electrode potential is regarded as the potential difference between phloem apoplast and bathing medium (ΔΨapo). Following recording of the apoplasmic voltage difference on a chart recorder, the microelectrode was impaled into the cell for measurement of the membrane potential (ΔΨcyt).
Membrane potentials are given according to Bertl et al. (1992) with the extracellular (apoplasmic) side of the membrane as ground reference.
 |
(5) |
All measurements were performed at a room temperature of 23°C to 25°C. In plants containing both external and internal phloem, measurements were executed in the external phloem.
In initial membrane potential measurements, iontophoretic postinjection of LYCH was used as a standard procedure to identify the cells impaled for electrophysiology in excised tissue slices. In intact plants, LYCH was injected using a homemade multifunctional pressure device (Kempers et al., 1999) that enables recording of membrane potentials in combination with microinjection. Microelectrodes were backfilled with a small amount of LYCH dissolved in an electrolyte solution (1% [w/v] in 500 mol m−3 KCl) and inserted into a special microelectrode holder (Kempers et al., 1999). The electrolyte solution in the channel of the microelectrode holder was identical to the solution in the microelectrode and in direct contact with Ag/AgCl pellet and silicone fluid (200/20cS silicone fluid; BDH, Poole, Dorset, UK) of the pressure-generating part of the microinjector system (Kempers et al., 1999). The microelectrode holder was attached to the preamplifier of a DUO 773 intracellular amplifier (WPI) and mounted on a micromanipulator. After cell impalement and measurement of the membrane potential, pressure was applied to the microelectrode, which resulted in the expulsion of a small volume of LYCH. Pressure inside the injection system was permanently monitored during the injection to make sure that no local peak pressure values were reached that would damage the cell wall or plasma membrane directly around the site of impalement (Kempers and van Bel, 1997). The microinjection was monitored under a Leica DM-LB fluorescence microscope (40× HCX APO L40×/0.80 W UVI water immersion objective).
Micrographs were taken with a digital camera (Canon Power Shot S40; Tokyo) connected to a computer (Canon Digital Camera solutions disc version 8.0 software package).
H+-Selective Microelectrodes
H+-selective microelectrodes were manufactured as specified by Felle and Bertl (1986a). Microelectrodes for membrane H+-selective microelectrodes were fabricated from borosilicate microcapillaries (GC150F-10; Clark Electromedical Instruments) on a two-stage puller (L/M-3P-A puller; List Medical, Darmstadt, Germany) to give an inner tip diameter of typically 1.5 μm.
After heating at 200°C for 1 h, hot capillaries were back-dipped for 1 to 2 s into a silanization cocktail containing tributylchlorosilane (FLUKA 90794; Fluka, Milwaukee, WI) and chloroform in a 1:500 proportion, followed by a second heating period of 1 h at 200°C. The tips of the cooled-down microcapillaries were filled with the H+-selective cocktail (Fluka Hydrogen Ionophore II-Cocktail A) dissolved in a mixture of polyvinylchloride:tetrahydrofurane (40 mg/mL) at a proportion of 20/80 (v/v). After evaporation of the organic solvent, the remaining firm gel was topped up with undiluted sensor cocktail (Felle et al., 2000). Plugging of the tip was followed by back-filling with the reference solution (500 mol m−3 KCl, 100 mol m−3 MES/TRIS, pH 6) of the electrode.
After equilibration for 1 d, electrodes giving stable responses were selected. The micro-pH electrode (capillary filled with sensor + electrode holder Ag/AgCl half cell; WPI) was connected to the amplifier (DUO 773 high input impedance differential electrometer; WPI) via a high-impedance input (1015 Ohm).The reference electrodes containing a 500 mol m−3 KCl agar bridge in the tip were topped up with 500 mol m−3 unbuffered KCl solution. Calibration solutions were composed of 100 mol m−3 KCl/10 mol m−3 MES/TRIS buffers. The pH of the solutions were adjusted to values between 6.5 and 8.0 in steps of 0.5-pH units.
Collection of Sieve Tube Sap Probes pH Measurements
Aphid stylectomy (Fisher and Frame, 1984; Doering-Saad et al., 2002) was employed for collection of small sieve tube sap droplets from cut stylets. Homemade ring-like plastic cages (diameter 4–6 mm, height approximately 4 mm) were mounted on the main vein (petiole) of a mature leaf with a glue, free of any organic solvent (Doering-Saad et al., 2002). Four to six aphids (for Vicia faba, Megoura viciae; for Hordeum vulgare, Rhopalosiphum padi) were placed in the cage to settle for several hours or mostly overnight. The cages were sealed with perforated parafilm.
After stylectomy using radiofrequency microcautery (Downing and Unwin, 1977; Fisher and Frame, 1984), cages were flooded with water-saturated silicon oil or parafin oil to prevent evaporation from exuding droplets. For pH measurements, pH microelectrode and reference electrode were maneuvered into the droplet with the aid of micromanipulators.
Pure sieve tube sap of cucurbits was collected as described by Ruiz-Medrano et al. (1999).
Acknowledgments
We thank Prof. Dr. H.H. Felle (University of Giessen) for assistance in fabrication of pH microelectrodes and continuous helpful discussions. Werner Uhmann, Thomas Wagner, Andreas Reh, and Stefan Balser from the institute workshop are acknowledged for building excellent technical equipment. We thank Christian Gerken for skilful assistance in preparing the figures.
This work was supported by the Deutsche Forschungsgemeinschaft (in the frame of Schwerpunktprogramm 1108).
Article, publication date, and citation information can be found at www.plantphysiol.org/cgi/doi/10.1104/pp.104.058511.
References
- Ayre BG, Keller F, Turgeon R (2003) Symplastic continuity between companion cells and the translocation stream. Long-distance transport is controlled by retention and retrieval mechanisms in the phloem. Plant Physiol 131: 1518–1528 [DOI] [PMC free article] [PubMed] [Google Scholar]
- Barth I, Meyer S, Sauer N (2003) PmSUC3: characterization of a SUT2/SUC3-type sucrose transporter from Plantago major. Plant Cell 15: 1375–1385 [DOI] [PMC free article] [PubMed] [Google Scholar]
- Bertl A, Blumwald E, Coronado R, Eisenberg R, Findlay G, Gradmann D, Hille B, Kohler K, Kolb HA, MacRobbie E, et al (1992) Electrical measurements on endomembranes. Science 258: 873–874 [DOI] [PubMed] [Google Scholar]
- Bethman B, Simonis W, Schönknecht G (1998) Light induced changes of cytosolic pH in Eremosphaera viridis: recordings and kinetic analysis. J Exp Bot 49: 1129–1137 [Google Scholar]
- Doering-Saad C, Newbury HJ, Bale JS, Prichard J (2002) Use of aphid stylectomy and RT-PCR for the detection of transporter mRNAs in sieve elements. J Exp Bot 53: 631–637 [DOI] [PubMed] [Google Scholar]
- Downing N, Unwin DM (1977) A new method for cutting the mouthparts of feeding aphids. Physiol Entomol 2: 275–277 [Google Scholar]
- Eschrich W, Fromm J, Evert RF (1988) Transmission of electric signals in sieve tubes of zucchini plants. Bot Acta 101: 327–331 [Google Scholar]
- Felle H (2001) pH: signal and messenger in plant cells. Plant Biol 3: 577–591 [Google Scholar]
- Felle H, Bertl A (1986. a) The fabrication of H+-selective liquid membrane microelectrodes for use in plant cells. J Exp Bot 37: 1416–1428 [Google Scholar]
- Felle H, Bertl A (1986. b) Light-induced cytoplasmic pH changes and their interrelation to the activity of the electrogenic proton pump in Riccia fluitans. Biochim Biophys Acta 848: 176–182 [Google Scholar]
- Felle H, Kondorosi E, Kondorosi A, Schultze M (2000) How alfalfa root hairs discriminate between nod factors and oligochitin elicitors. Plant Physiol 124: 1373–1380 [DOI] [PMC free article] [PubMed] [Google Scholar]
- Fisher D, Frame JM (1984) A guide to the use of exuding stylet technique in phloem physiology. Planta 161: 385–393 [DOI] [PubMed] [Google Scholar]
- Frohmeyer H, Grabov A, Blatt MR (1998) A role for the vacuole in auxin-mediated control of cytosolic pH in Vicia mesophyll and guard cells. Plant J 13: 109–116 [Google Scholar]
- Fromm J, Eschrich W (1988) Transport processes in stimulated and non-stimulated leaves of Mimosa pudica. Trees (Berl) 2: 18–24 [Google Scholar]
- Fukumorita T, Chino M (1982) Sugar, amino acid and inorganic contents in rice phloem sap. Plant Cell Physiol 23: 273–283 [Google Scholar]
- Gamalei YV (1989) Structure and function of leaf minor veins in trees and herbs. Trees (Berl) 3: 96–110 [Google Scholar]
- Hafke JB, Neff R, Hütt M-T, Lüttge U, Thiel G (2001) Day-to-night variations of cytoplasmic pH in a crassulacean acid metabolism plant. Protoplasma 216: 164–170 [DOI] [PubMed] [Google Scholar]
- Kempers R, Ammerlaan A, van Bel AJE (1998) Symplasmic constriction and ultrastructural features of the sieve element/companion cell complex in the transport phloem of apoplasmically and symplasmically phloem loading species. Plant Physiol 116: 271–278 [PMC free article] [Google Scholar]
- Kempers R, Prior DAM, Oparka KJ, Knoblauch M, van Bel AJE (1999) Integration of controlled intracellular pressure microinjection, iontophoresis and membrane potential measurements. Plant Biol 1: 61–67 [Google Scholar]
- Kempers R, van Bel AJE (1997) Symplasmic connections between sieve element and companion cell in the stem phloem of Vicia faba L. have a molecular exclusion limit of at least 10kDa. Planta 201: 195–201 [Google Scholar]
- Knoblauch M, van Bel AJE (1998) Sieve tubes in action. Plant Cell 10: 35–50 [Google Scholar]
- Kühn C, Franceschi VR, Schulz A, Lemoine R, Frommer WB (1997) Macromolecular trafficking indicated by localization and turnover of sucrose transporters in enucleate sieve elements. Science 275: 1298–1300 [DOI] [PubMed] [Google Scholar]
- Larcher W (2003) Carbon utilization and dry matter production. In W Larcher, ed, Physiological Plant Ecology: Ecophysiology and Stress Physiology of Functional Groups, Ed 4. Springer Verlag, Berlin, pp 69–184
- Minchin PEH, Thorpe MR (1987) Measurement of unloading and reloading of photoassimilate within the stem of bean. J Exp Bot 38: 211–220 [Google Scholar]
- Oparka KJ, Duckett CM, Prior DAM, Fisher DB (1994) Real-time imaging of phloem unloading in the root tip of Arabidopsis. Plant J 6: 759–766 [Google Scholar]
- Oparka KJ, Prior DAM, Wright KM (1995) Symplastic communication between primary and developing lateral roots of Arabidopsis thaliana. J Exp Bot 46: 187–197 [Google Scholar]
- Oparka KJ, Viola R, Wright KM, Prior DAM (1992) Sugar transport and metabolism in the potato tuber. In CJ Pollock, JF Farrar, AJ Gordon, Carbon Partitioning Within and Between Organs. BIOS, Oxford, pp 91–114
- Opritov VA, Pyatygin SS (1989) Evidence for coupling of action potential generation with the electrogenic component of the resting potential in Cucurbita pepo L. stem excitable cells. Biochem Physiol Pflanz 184: 447–451 [Google Scholar]
- Patrick JW, Offler CE (1996) Post-sieve element transport of photoassimilates in sink regions. J Exp Bot 47: 1165–1177 [DOI] [PubMed] [Google Scholar]
- Patrick JW, Offler CE, van Bel AJE (2003) Nutrient loading of seeds. In B Thomas, D Murphy, B Murray, eds, Encyclopedia of Applied Plant Sciences. Academic Press, London, pp 1240–1249
- Plieth C, Sattelmacher B, Hansen U-P (1997) Cytoplasmic Ca2+-H+-exchange buffers in green algae. Protoplasma 198: 107–124 [Google Scholar]
- Pyatygin SS, Opritov VA, Khudyakov VA (1992) Sub-threshold changes in excitable membranes of Cucurbita pepo L. stem cells during cooling-induced action-potential generation. Planta 186: 161–165 [DOI] [PubMed] [Google Scholar]
- Rhodes J, Thain JF, Wildon DC (1996) The pathway for systemic electrical signal transduction in the wounded tomato plant. Planta 200: 50–57 [Google Scholar]
- Roelfsema MRG, Steinmeyer R, Staal M, Hedrich R (2001) Single guard cell recordings in intact plants: light-induced hyperpolarization of the plasma membrane. Plant J 26: 1–13 [DOI] [PubMed] [Google Scholar]
- Ruiz-Medrano R, Xoconostle-Cazares B, Lucas WJ (1999) Phloem long-distance transport of CmNACP-1 mRNA: implications for supracellular regulation in plants. Development 126: 4405–4419 [DOI] [PubMed] [Google Scholar]
- Sanders D, Slayman CL (1982) Control of intracellular pH. J Gen Physiol 80: 377–402 [DOI] [PMC free article] [PubMed] [Google Scholar]
- Stadler R, Brandner J, Schulz A, Gahrtz M, Sauer N (1995) Phloem loading by the PmSUC2 sucrose carrier from Plantago major occurs into companion cells. Plant Cell 7: 1545–1554 [DOI] [PMC free article] [PubMed] [Google Scholar]
- Stadler R, Sauer N (1996) The Arabidopsis thaliana AtSUC2 gene is specifically expressed in companion cells. Bot Acta 109: 261–340 [Google Scholar]
- van Bel AJE (1996) Interaction between sieve element and companion cell and the consequence for photoassimilate distribution: two structural hardware frames with associated physiological software packages in dicotyledons. J Exp Bot 47: 1129–1140 [DOI] [PubMed] [Google Scholar]
- van Bel AJE (2003. a) The phloem, a miracle of ingenuity. Plant Cell Environ 26: 125–149 [Google Scholar]
- van Bel AJE (2003. b) Transport phloem: low profile, high impact. Plant Physiol 131: 1509–1510 [PMC free article] [PubMed] [Google Scholar]
- van Bel AJE, Ammerlaan A, van Dijk AA (1994) A three-step screening procedure to identify the mode of phloem loading in intact leaves. Evidence for symplasmic and apoplasmic phloem loading associated with the type of companion cell. Planta 192: 31–39 [Google Scholar]
- van Bel AJE, Gamalei YV, Ammerlaan A, Bik LPM (1992) Dissimilar phloem loading in leaves with symplastic and apoplastic minor vein configurations. Planta 186: 518–525 [DOI] [PubMed] [Google Scholar]
- van Bel AJE, Kempers R (1991) Symplastic isolation of the sieve element-companion cell complex in the phloem of Ricinus communis and Salix alba. Planta 183: 69–76 [DOI] [PubMed] [Google Scholar]
- van Bel AJE, van Rijen HVM (1994) Microelectrode-recorded development of the symplasmic autonomy of the sieve element/companion cell complex in the stem phloem of Lupinus luteus L. Planta 192: 165–175 [Google Scholar]
- van der Schoot C, van Bel AJE (1989) Glass microelectrode measurements of sieve tube membrane potentials in internode discs and petiole strips of tomato (Solanum lycopersicum L.). Protoplasma 149: 144–154 [Google Scholar]
- van der Schoot C, van Bel AJE (1990) Mapping of membrane potential differences and dye coupling of internode tissues of tomato (Solanum lycopersicum L). Planta 182: 9–21 [DOI] [PubMed] [Google Scholar]
- Vreugdenhil D, Koot-Gronsveld EAM (1988) Characterization of phloem exudation from castor-bean cotyledons. Planta 174: 380–384 [DOI] [PubMed] [Google Scholar]
- Weise A, Barker L, Kuhn C, Lalonde S, Bushmann H, Frommer WB, Ward JM (2000) A new subfamily of sucrose transporters, SUT4, with low affinity/high capacity localized in enucleate sieve elements of plants. Plant Cell 12: 1345–1355 [DOI] [PMC free article] [PubMed] [Google Scholar]
- Wright JP, Fisher DB (1981) Measurement of sieve tube membrane potential. Plant Physiol 67: 845–848 [DOI] [PMC free article] [PubMed] [Google Scholar]


