

Abstract
Aims
Nutrition and inflammation status play a vital role in the prognosis of patients with heart failure (HF). This study aimed to investigate the association between the advanced lung cancer inflammation index (ALI), a novel composite indicator of inflammation and nutrition, and short‐term mortality among critically ill patients with HF.
Methods
This retrospective study included 548 critically ill patients with HF from the MIMIC‐IV database. ALI was computed using body mass index, serum albumin and neutrophil–lymphocyte ratio. The primary endpoint was all‐cause in‐hospital mortality, and the secondary endpoint was 90 day mortality. Kaplan–Meier survival curve analysis with long‐rank test and Cox proportional hazards regression models were employed to assess the relationship between baseline ALI and short‐term mortality risk. The incremental predictive ability of ALI was evaluated by C‐statistic, continuous net reclassification improvement (NRI) and integrated discrimination improvement (IDI).
Results
The average age of 548 patients was 72.2 (61.9, 82.1) years, with 60% being male. Sixty‐three patients (11.5%) died in the hospital, and 114 patients (20.8%) died within 90 days of intensive care unit admission. The Kaplan–Meier analysis revealed that the cumulative incidences of both in‐hospital and 90 day mortality were significantly higher in patients with lower ALI (log‐rank test, in‐hospital mortality: P < 0.001; 90 day mortality: P < 0.001). The adjusted Cox proportional hazard model revealed that ALI was inversely associated with both in‐hospital and 90 day mortality after adjusting for confounders [hazard ratio (HR) (95% confidence interval) (CI): 0.97 (0.94, 0.99), P = 0.035; HR (95% CI): 0.62 (0.39, 0.99), P = 0.046]. A linear relationship was observed between ALI and in‐hospital mortality (P for non‐linearity = 0.211). The addition of ALI significantly improved the prognostic ability of GWTG‐HF score in the in‐hospital mortality [C‐statistic improved from 0.62 to 0.68, P = 0.001; continuous NRI (95% CI): 0.44 (0.20, 0.67), P < 0.001; IDI (95% CI): 0.03 (0.01, 0.04), P < 0.001] and 90 day mortality [C‐statistic improved from 0.63 to 0.70, P < 0.001; continuous NRI (95% CI): 0.31 (0.11, 0.50), P = 0.002; IDI (95% CI): 0.01 (0.00, 0.02), P = 0.034]. Subgroup analysis revealed stronger correlations between ALI and in‐hospital mortality in males and patients aged over 65 years (interaction P = 0.031 and 0.010, respectively). The C‐statistic of in‐hospital mortality in patients over 65 years was 0.66 (95% CI: 0.58, 0.74).
Conclusions
ALI at baseline can independently predict the risk of short‐term mortality in critically ill patients with HF, with lower ALI significantly associated with higher mortality. Further large prospective research with extended follow‐up periods is necessary to validate the findings of this study.
Keywords: advanced lung cancer inflammation index, critically ill patients with heart failure, nutrition, inflammation, prognosis
Introduction
Heart failure (HF) is one of the most prevalent cardiovascular diseases and has emerged as one of the major global clinical and public health challenges due to high rehospitalization rates and mortality. 1 It is imperative to develop novel tools to predict the prognosis of critically ill patients with HF.
Studies have confirmed the intimate connection between inflammation and nutritional status and the prognosis of patients with HF. While inflammation may initially offer some short‐term protective effects on the heart, persistent inflammation responses can accelerate disease progression. 2 Several studies have underscored that the link between heightened inflammatory biomarkers, including neutrophil‐to‐lymphocyte ratio (NLR), monocyte‐to‐lymphocyte ratio and systemic inflammatory index, and adverse long‐term outcomes in the acute or chronic HF cases. 2 , 3 , 4 , 5 , 6 In addition, patients with HF frequently experience compromised nutrition status that significantly impacts their prognosis. However, at present, there is no universally accepted gold‐standard method for nutrition assessment of patients with HF. Body mass index (BMI) and serum albumin (Alb) are the most commonly used nutritional indicators, both of which have shown associations with unfavourable prognosis of HF. 7 , 8 , 9 , 10 , 11 , 12 , 13 , 14 , 15
Advanced lung cancer inflammation index (ALI), originally developed to gauge systemic inflammation in patients with metastatic non‐small cell lung cancer (NSCLC), has demonstrated its utility as a robust predictor of adverse events in various types of cancer, Crohn's disease and acute decompensated HF. 7 , 16 Nevertheless, previous studies on ALI primarily focused on evaluating the long‐term prognostic impact on acute or chronic HF patients. 6 , 7 , 17 , 18 , 19 , 20 However, for critically ill patients with HF facing more dire circumstances, the significance of short‐term outcomes should not be ignored. Up to now, the correlation between ALI and short‐term outcomes such as in‐hospital mortality and 90 day mortality remains unclear in critically ill patients with HF.
As such, the purpose of the current study is to investigate the value of ALI as a tool for predicting the short‐term prognosis of critically ill patients with heart HF.
Participants and methods
Data source
In this study, the open‐source Medical Information Mart for Intensive Care database (MIMIC‐IV) was selected. MIMIC‐IV is an updated version of MIMIC‐III with pre‐existing institutional review board approval. Currently, the MIMIC‐IV contains comprehensive and high‐quality data on patients admitted to intensive care units (ICUs) at the Beth Israel Deaconess Medical Center between 2008 and 2019 (inclusive). The database consists of comprehensive clinical data, including medical records, drug therapies, laboratory results, patient characteristics and disease codes of the International Classification of Diseases. 21 The author (Xinyu Zhang) completed the online course at the National Institutes of Health and passed the Examination for Protecting Human Research Participants (certification number: 10257950). The project was approved by the Institutional Review Board of the Massachusetts Institute of Technology and the Beth Israel Deaconess Medical Center, ensuring the privacy of patients by safeguarding their identity details.
Patient and public involvement
Patients and/or the public were not directly involved in this study.
Inclusion and exclusion criteria
The study specifically included adult patients with HF at their initial admission to ICU based on ICD‐9 and ICD‐10 disease codes. Given that HF might not always be the principal diagnosis, records were included if HF appeared in any of the first five diagnosis positions according to the sequence. Excluded from the study were patients with no ICU records and those lacking data on BMI, Alb and neutrophil and lymphocyte count. Figure S1 depicts the patients selection process, with a total of 548 adult patients meeting the criteria out of 15 233 patients diagnosed with HF.
Primary and secondary endpoints
The primary endpoint was all‐cause in‐hospital mortality, and the secondary endpoint was 90 day mortality.
Data collection
Baseline characteristic data, including demographics, medical history, disease severity score and laboratory tests, were collected. The medical history involved myocardial infarct, hypertension, atrial fibrillation, diabetes mellitus, iron deficiency anaemia, depression, hyperlipidaemia, liver disease, chronic renal insufficiency, chronic pulmonary disease, rheumatic disease, cerebrovascular disease, peripheral vascular disease and cancer. The disease severity score included the Charlson comorbidity index (CCI) and Sequential Organ Failure Assessment (SOFA) score. ALI upon admission was calculated using the following formula: ALI = BMI × Alb / NLR, in which BMI represents weight in kilogrammes divided by height in metres squared, Alb stands for serum albumin in grammes per decilitre and NLR is the ratio of absolute neutrophil count to absolute lymphocyte count. 21
Statistics analysis
Continuous variables were presented as mean ± standard deviation if normally distributed or as median with inter‐quartile range otherwise. Category variables were summarized as numbers and percentages. Differences among different ALI groups (tertile) were examined using the Kruskal–Wallis H test for skewed distribution and ANOVA for normal distribution. χ 2 was used for categorical variables. The Student's t‐test was employed to assess differences in ALI between groups with and without in‐hospital death. To evaluate the relationship between ALI and short‐term mortality, we also calculated the Kaplan–Meier curve using the event‐free survival curve and used the log‐rank test for comparison. In pursuit of prognostic predictors among critically ill patients with HF, univariate Cox regression analysis was performed. Multivariate Cox proportional hazards regression was carried out to investigate whether ALI could be considered an independent risk factor. Four univariate and multivariate Cox proportional hazard models were constructed. Model 1: no adjustment for covariates; Model 2: adjustment for age and gender only; Model 3: (1) in‐hospital mortality—Model 2 with SOFA score; (2) 90 day mortality—Model 2 with CCI; Model 4: (1) in‐hospital mortality—Model 3 with further adjustment for systolic blood pressure (SBP), glucose, smoking status and alcohol intake; (2) 90 day mortality—Model 3 with further adjustment for SBP, diastolic blood pressure, smoking status, alcohol intake, glucose, BUN, estimated glomerular filtration rate (eGFR) and total bilirubin. All covariates except gender and smoking status exhibited a significant level of P < 0.05 in the univariate Cox analysis. To assess the potential non‐linearity association of ALI with in‐hospital mortality, a Cox proportional‐hazard regression model was constructed using smooth curve fitting and cubic spline functions. The Get with the Guidelines‐Heart Failure (GWTG‐HF) score was computed. Receiver operating characteristic curve analysis was conducted to evaluate the discriminative power of ALI alone and combined with GWTG‐HF in distinguishing survivors and non‐survivors of in‐hospital patients. Harrell's concordance statistic (Harrell's C‐statistic) was used to evaluate model discrimination at the end of the follow‐up. Net reclassification improvement (NRI) and integrated discrimination improvement (IDI) were used to further evaluate the risk reclassification. Stratified Cox proportional hazard models were utilized for subgroup analysis. The continuous variables were converted into categorical variables based on clinical cut points or median values, followed by an interaction test. All data analysis were performed using SPSS version 27.0, GraphPad Prism version 9.5 and R version 4.4.0. A two‐tailed test indicated that P < 0.05 was considered statistically significant.
Results
Baseline characteristics
A total of 548 patients were included in the final data analysis. Sixty‐three patients (11.5%) died in the hospital, and 114 patients (20.8%) died within 90 days of intensive care unit admission. Patients were categorized into three groups based on the tertile of ALI as follows: T1 (ALI < 7.1; n = 181), T2 (7.1–15.2; n = 183) and T3 (ALI ≥ 15.2; n = 184). The baseline characteristics of these patients were shown in Table 1. In the overall population, age range was from 62 to 82 years, with males representing 60% of the cohort. Out of the total, 63 patients (11.5%) died in the hospital, and 20.8% died within 90 days of ICU admission. Patients with the lowest ALI (T1) exhibited lower values in BMI, urine output, lymphocyte count, eGFR, Alb and calcium. Additionally, T1 had higher values of age, SOFA score, leucocyte count, neutrophil count, NLR, glucose, BUN, creatinine, potassium, alanine aminotransferase (ALT), aspartate aminotransferase (AST), alkaline phosphatase (ALP), in‐hospital mortality and 90 day mortality. More patients in T1 had hyperlipidaemia. However, no statistically significant differences were observed among the three groups in terms of gender, heart rate, blood pressure, SpO2, smoking status, alcohol intake, medical history (except for hyperlipidaemia), haematocrit (HCT), haemoglobin (HGB), erythrocyte count, MHC, mean corpuscular haemoglobin concentration, mean corpuscular volume, red blood cell distribution width, platelet (PLT), prothrombin time, international normalized ratio, sodium, total bilirubin (TBIL), length of ICU stay and length of hospital stay (P > 0.05).
Table 1.
Baseline characteristics of patients, divided according to the advanced lung cancer inflammation index.
| Baseline characteristics | Total (N = 548) | T1 (N = 181) | T2 (N = 183) | T3 (N = 184) | P |
|---|---|---|---|---|---|
| Age, median (IQR), year | 72.2 (61.9, 82.1) | 73.9 (63.1, 84.1) | 72.8 (63.5, 81.8) | 69.3 (59.9, 81.2) | 0.034 |
| Male (n, %) | 329 (60.0) | 114 (62.3) | 107 (57.5) | 108 (60.3) | 0.643 |
| Body mass index, median (IQR), kg/m2 | 28.5 (24.4, 33.5) | 26.3 (23.1, 31.0) | 28.8 (24.8, 34.0) | 30.1 (25.6, 35.4) | <0.001 |
| Heart rate, median (IQR), bpm | 83.9 (73.9, 97.8) | 84.1 (74.4, 98.6) | 83.6 (74.0, 99.4) | 83.8 (73.7, 95.8) | 0.733 |
| SBP, median (IQR), mmHg | 111.9 (102.5, 122.4) | 110.5 (101.3, 122.1) | 112.4 (102.9, 122.1) | 112.3 (102.6, 123.9) | 0.615 |
| DBP, median (IQR), mmHg | 61.9 (55.0, 68.8) | 61.7(54.0, 68.1) | 61.1 (54.7, 69.2) | 62.9 (56.3, 69.3) | 0.259 |
| SpO2, median (IQR), % | 96.7 (95.0, 98.0) | 96.6 (94.8, 98.0) | 96.7 (95.1, 98.1) | 96.8 (95.2, 98.0) | 0.478 |
| Urine output (first 24 h), median (IQR), mL | 1602.5 (836.3, 2751.3) | 1500.0 (618.0, 2553.0) | 1530.0 (910.0, 2730.0) | 1840.0 (1004.0, 2916.0) | 0.025 |
| Smoking status (n, %) | 81 (14.8) | 22 (12.2) | 31 (16.9) | 28 (15.2) | 0.428 |
| Alcohol intake (n, %) | 130 (23.7) | 35 (19.3) | 48 (26.2) | 47 (25.5) | 0.235 |
| Medical history | |||||
| Myocardial infarct (n, %) | 214 (39.1) | 78 (42.6) | 67 (36.0) | 69 (38.5) | 0.424 |
| Hypertension (n, %) | 228 (41.6) | 68 (37.2) | 84 (45.2) | 76 (42.5) | 0.285 |
| Atrial fibrillation (n, %) | 316 (57.7) | 117 (63.9) | 102 (54.8) | 97 (54.2) | 0.109 |
| Diabetes mellitus (n, %) | 229 (41.8) | 71 (38.8) | 74 (39.8) | 84 (46.9) | 0.232 |
| Iron deficiency anaemia (n, %) | 109 (19.9) | 36 (19.7) | 38 (20.4) | 35 (19.6) | 0.974 |
| Depression (n, %) | 129 (23.5) | 40 (21.9) | 51 (27.4) | 38 (21.2) | 0.305 |
| Hyperlipidaemia (n, %) | 347 (63.3) | 102 (55.7) | 135 (72.6) | 110 (61.5) | 0.003 |
| Liver disease (n, %) | 42 (7.7) | 17 (9.3) | 11 (5.9) | 14 (7.8) | 0.474 |
| Chronic renal insufficiency (n, %) | 233 (42.5) | 86 (47.0) | 79 (42.5) | 68 (38.0) | 0.223 |
| Chronic pulmonary disease (n, %) | 188 (34.3) | 64 (35.0) | 63 (33.9) | 61 (34.1) | 0.972 |
| Rheumatic disease (n, %) | 23 (4.2) | 10 (5.5) | 8 (4.3) | 5 (2.8) | 0.446 |
| Cerebrovascular disease (n, %) | 69 (12.6) | 22 (12.0) | 18 (9.7) | 29 (16.2) | 0.165 |
| Peripheral vascular disease (n, %) | 88 (16.1) | 34 (18.6) | 34 (18.3) | 20 (11.2) | 0.095 |
| Cancer (n, %) | 44 (8.0) | 16 (8.7) | 15 (8.1) | 13 (7.3) | 0.874 |
| Disease severity score | |||||
| Charlson comorbidity index, median (IQR) | 7 (6, 9) | 8 (6, 9) | 7 (6, 9) | 7 (5, 9) | 0.152 |
| SOFA score, median (IQR) | 6 (4, 10) | 8 (5, 11) | 6 (4, 10) | 6 (3, 9) | <0.001 |
| Laboratory tests | |||||
| Haematocrit, median (IQR), % | 32.9 (28.0, 38.2) | 32.8 (28.3, 37.3) | 32.9 (27.9, 38.3) | 33.0 (27.9, 38.3) | 0.998 |
| Haemoglobin, median (IQR), g/dL | 10.6 (8.9, 12.4) | 10.6 (9.0, 12.2) | 10.6 (8.6, 12.5) | 10.7 (8.9, 12.6) | 0.957 |
| Erythrocyte, median (IQR), ×1012/L | 3.6 ± 0.8 | 3.7 ± 0.8 | 3.6 ± 0.8 | 3.6 ± 0.8 | 0.764 |
| MCH, median (IQR), pg | 30.0 (28.1, 31.7) | 29.7 (27.5, 31.5) | 30.0 (28.5, 31.8) | 30.1 (28.2, 31.7) | 0.227 |
| MCHC, median (IQR), % | 32.3 (31.2, 33.3) | 32.3 (31.1, 33.1) | 32.4 (31.2, 33.4) | 32.3 (31.3, 33.4) | 0.305 |
| MCV, median (IQR), fL | 92.0 (88.0, 96.0) | 92.0 (88.0, 96.0) | 93.0 (89.0, 97.0) | 92.0 (87.2, 96.0) | 0.477 |
| RDW, median (IQR), % | 14.8 (13.8, 16.4) | 15.0 (14.0, 17.0) | 14.6 (13.7, 16.0) | 14.7 (13.8, 16.3) | 0.082 |
| Leucocyte, median (IQR), ×109/L | 11.7 (8.1, 16.4) | 13.9 (10.6, 19.3) | 11.8 (8.5, 15.7) | 9.2 (7.0, 12.8) | <0.001 |
| Lymphocytes, median (IQR), ×109/L | 1.7 (0.8, 66.8) | 0.7 (0.4, 36.5) | 1.8 (0.9, 73.5) | 2.4 (1.3, 110.7) | <0.001 |
| Monocytes, median (IQR), ×109/L | 1.2 (0.7, 31.9) | 1.1 (0.6, 20.1) | 1.3 (0.7, 32.3) | 1.1 (0.7, 38.7) | 0.094 |
| Neutrophils, median (IQR), ×109/L | 14.7 (8.4, 618.6) | 17.3 (11.0, 783.6) | 14.8 (9.0, 712.8) | 10.1 (6.1, 464.6) | <0.001 |
| NLR | 9.0 (5.5, 17.6) | 22.9 (16.5, 31.8) | 9.1 (7.3, 11.6) | 4.4 (3.1, 5.7) | <0.001 |
| Platelet, median (IQR), ×109/L | 192.0 (142.3, 250.8) | 190.0 (140.5, 247.5) | 196.0 (147.0, 256.0) | 190.0 (139.3, 251.5) | 0.899 |
| PT, median (IQR), s | 15.3 (13.2, 21.1) | 16.2 (13.3, 24.2) | 15.3 (13.4, 22.4) | 15.0 (12.9, 18.1) | 0.065 |
| INR, median (IQR) | 1.4 (1.2, 1.9) | 1.5 (1.2, 2.3) | 1.4 (1.2, 2.1) | 1.4 (1.2, 1.7) | 0.060 |
| Glucose, median (IQR), mEq/L | 137.6 (115.6, 176.3) | 142.0 (117.9, 190.8) | 142.0 (120.3, 177.7) | 128.8 (111.3, 160.9) | 0.005 |
| BUN, mEq/L | 33.0 (21.0, 54.0) | 39.0 (25.0, 60.5) | 31.0 (20.0, 50.0) | 28.0 (19.0, 48.5) | <0.001 |
| Creatinine, median (IQR), mg/dL | 1.6 (1.0, 2.6) | 1.7 (1.1, 3.0) | 1.6 (1.1, 2.5) | 1.3 (0.9, 2.2) | 0.010 |
| eGFR, median (IQR), mL/(min*1.73 m2) | 42.3 (22.9, 69.8) | 37.1 (18.0, 60.3) | 42.2 (23.7, 66.1) | 51.2 (27.0, 78.4) | 0.002 |
| Albumin, g/dL | 3.4 (3.0, 3.7) | 3.2 (2.8, 3.6) | 3.4 (3.0, 3.7) | 3.5 (3.1, 3.8) | <0.001 |
| ALI | 10.5 (5.4, 18.7) | 3.9 (2.5, 5.4) | 10.5 (8.7, 12.7) | 22.7 (18.6, 32.9) | <0.001 |
| Sodium, median (IQR), mEq/L | 140.0 (137.0, 143.0) | 141.0 (137.0, 143.0) | 140.0 (137.0, 143.0) | 140.0 (137.3, 143.0) | 0.553 |
| Potassium, median (IQR), mEq/L | 4.6 (4.2, 5.2) | 4.8 (4.3, 5.4) | 4.6 (4.1, 5.2) | 4.5 (4.2, 5.2) | 0.006 |
| Calcium, total, median (IQR), mg/dL | 8.7 (8.2, 9.0) | 8.5 (8.1, 9.0) | 8.6 (8.2, 9.0) | 8.8 (8.4, 9.2) | 0.003 |
| Alanine aminotransferase, U/L | 35.5 (18.0, 101.0) | 41.0 (21.5, 122.0) | 38.0 (18.0, 114.0) | 27.0 (17.0, 65.8) | 0.009 |
| Aspartate aminotransferase, U/L | 51.5 (28.0, 152.0) | 65.0 (31.0, 206.5) | 52.0 (28.0, 234.0) | 40.5 (26.0, 97.5) | 0.003 |
| Alkaline phosphatase, U/L | 90.5 (65.0, 128.8) | 101.0 (73.0, 135.0) | 86.0 (62.0, 121.0) | 85.5 (66.0, 122.8) | 0.005 |
| Total bilirubin, mg/dL | 0.7 (0.5, 1.4) | 0.8 (0.5, 1.4) | 0.7 (0.5, 1.4) | 0.7 (0.4, 1.3) | 0.257 |
| Outcome | |||||
| Length of ICU stay, mean ± SD, days | 3.5 (1.9, 6.3) | 4.0 (2.0, 9.0) | 4.7 (2.5, 6.8) | 4.1 (2.0, 6.7) | 0.496 |
| Length of hospital stay, mean ± SD, days | 9.2 (5.8, 14.9) | 10.9 (5.8, 17.8) | 8.7 (5.7, 13.9) | 8.7 (5.8, 14.3) | 0.260 |
| In‐hospital mortality (n, %) | 63 (11.5) | 37 (20.2) | 15 (8.1) | 11 (6.1) | <0.001 |
| 90 day mortality (n, %) | 114 (20.8) | 56 (30.6) | 31 (16.7) | 27 (15.1) | <0.001 |
Abbreviations: ALI, advanced lung cancer inflammation index; BMI, body mass index; BUN, blood urea nitrogen; DBP, diastolic blood pressure; eGFR, estimated glomerular filtration rate; ICU, intensive care unit; INR, international normalized ratio; MCH, mean corpuscular haemoglobin; MCHC, mean corpuscular haemoglobin concentration; MCV, mean corpuscular volume; NLR, neutrophil‐to‐lymphocyte ratio; PT, prothrombin time; RDW, red blood cell distribution width; SBP, systolic blood pressure; SOFA, Sequential Organ Failure Assessment; SpO2, pulse oxygen saturation.
Association between ALI and in‐hospital mortality
Differences in ALI between the two groups, those with and without in‐hospital mortality, are visually depicted in Figure S2. The analysis results revealed that participants who experienced in‐hospital death exhibited a significantly lower ALI compared with survivors (P < 0.001).
To assess the prognostic significance of ALI, an unadjusted Kaplan–Meier analysis was performed. Kaplan–Meier analysis indicated that the cumulative incidence of in‐hospital mortality was significantly higher in critically ill HF patients with lower ALI (log‐rank test P < 0.001; Figure 1).
Figure 1.
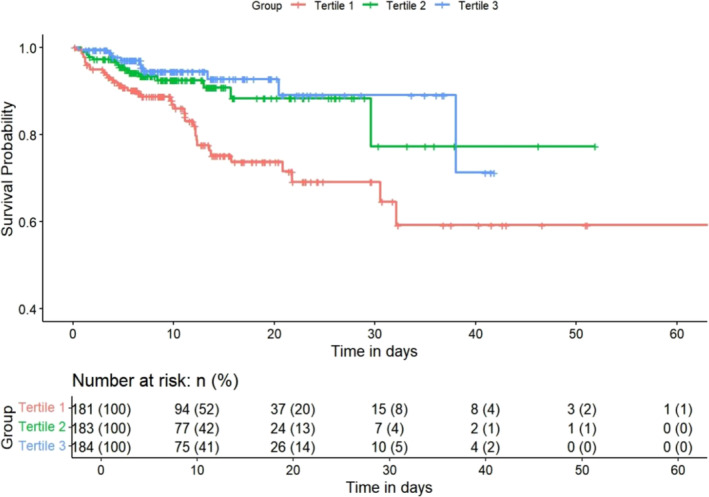
Kaplan–Meier survival curves for in‐hospital mortality across the ALI tertiles. ALI, advanced lung cancer inflammation index.
Results of the univariable analysis of covariates and mortality can be found in Table S1. Four models were constructed in this study to investigate how ALI independently affects in‐hospital mortality. Ninety‐five per cent confidence intervals and effect sizes [hazard ratio (HR)] are presented in Table 2. In the minimally adjusted model, where age and gender were considered, ALI was negatively associated with in‐hospital mortality (P = 0.005). Even after adjusting all potential covariates (Model 4, as shown in Table 2), these associations remained significant when considering ALI as a continuous variable (P = 0.035).
Table 2.
Association between ALI and in‐hospital mortality.
| ALI tertiles | ||||||
|---|---|---|---|---|---|---|
| ALI | T1 | T2 | T3 | P for trend | ||
| Model 1 | HR (95% CI) | 0.95 (0.92, 0.98) | Reference | 0.45 (0.25, 0.83) | 0.33 (0.17, 0.65) | 0.001 |
| P | 0.002 | 0.010 | 0.001 | |||
| Model 2 | HR (95% CI) | 0.95 (0.92, 0.99) | Reference | 0.45 (0.25, 0.82) | 0.36 (0.19, 0.72) | 0.002 |
| P | 0.005 | 0.009 | 0.003 | |||
| Model 3 | HR (95% CI) | 0.96 (0.94, 0.99) | Reference | 0.53 (0.29, 0.98) | 0.45 (0.23, 0.89) | 0.019 |
| P | 0.022 | 0.042 | 0.021 | |||
| Model 4 | HR (95% CI) | 0.97 (0.94, 0.99) | Reference | 0.51 (0.28, 0.93) | 0.47 (0.24, 0.93) | 0.026 |
| P | 0.035 | 0.029 | 0.031 | |||
Abbreviations: ALI, Advanced Lung Cancer Inflammation Index; CI, confidence interval; HR, hazard ratio.
In terms of sensitivity analysis, ALI was converted to a categorical variable from a continuous variable. In comparison with the lowest tertile of ALI, subjects in the highest tertile had a significantly lower risk of in‐hospital mortality (P = 0.026), while adjusting for all the potential covariates in Model 4.
Dose–response relationship between ALI and in‐hospital mortality
The smooth curve and the result of Cox proportional hazards regression model with cubic spline functions indicated a linear relationship between ALI and in‐hospital mortality after adjusting for all variables (Model 4). The P value for non‐linearity was 0.211, as illustrated in Figure 2. In this relationship, in‐hospital mortality showed a gradual decrease as ALI increased.
Figure 2.
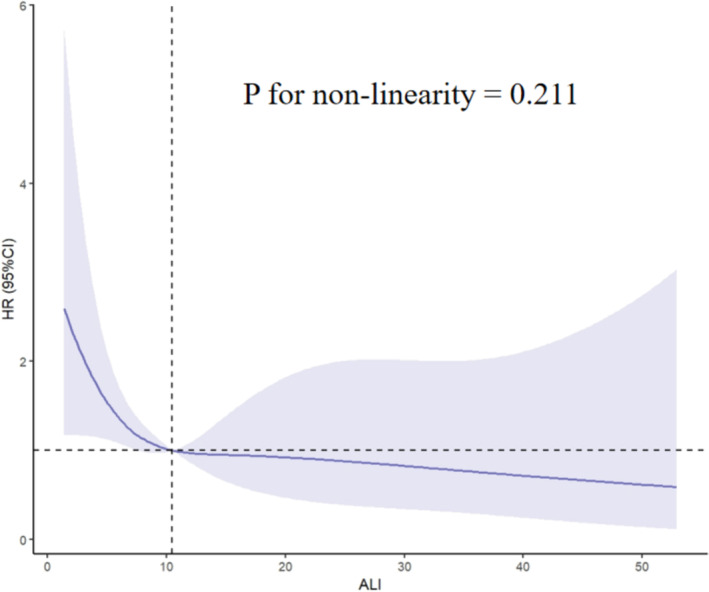
Non‐linear dose–response relationship between ALI and in‐hospital mortality. Adjusted for age, gender, SOFA score, systolic blood pressure, smoking status, alcohol intake and glucose. The solid line and light purple area represent the estimated values and their corresponding 95% confidence intervals. ALI, advanced lung cancer inflammation index; CI, confidence interval; HR, hazard ratio; SOFA, Sequential Organ Failure Assessment.
The incremental predictive value of ALI for in‐hospital mortality
The GWTG‐HF score system has been established as an effective predictor of in‐hospital death in patients with HF. 22 , 23 , 24 As shown in Table 3, we calculated C‐statistic, NRI and IDI to evaluate the incremental predictive value of ALI for in‐hospital mortality. After adding ALI, the predictive value of GWTG‐HF score on in‐hospital mortality was improved. The C‐statistic significantly improved from 0.62 to 0.68 (P = 0.001). NRI and IDI were statistically increased by adding ALI [continuous NRI (95% CI): 0.44 (0.20, 0.67), P < 0.001; IDI (95% CI): 0.03 (0.01, 0.04), P < 0.001].
Table 3.
The incremental prognostic ability of ALI for in‐hospital mortality.
| GWTG | GWTG + ALI | P | |
|---|---|---|---|
| C‐statistic (95% CI) | 0.62 (0.54, 0.69) | 0.68 (0.61, 0.75) | 0.001 |
| Continuous NRI (95% CI) | Reference | 0.44 (0.20, 0.67) | <0.001 |
| IDI (95% CI) | Reference | 0.03 (0.01, 0.04) | <0.001 |
Abbreviations: ALI, advanced lung cancer inflammation index; GWTG‐HF, Get with the Guidelines‐Heart Failure; IDI, integrated discrimination improvement; NRI, net reclassification improvement.
Subgroup analysis
Categorical variables, such as age, gender, BMI, smoking status, alcohol intake, hypertension, diabetes and atrial fibrillation, were used to examine effect size trends and generate forest plots. Subgroup analysis showed that the association between ALI and risk of in‐hospital mortality was consistent across subgroups stratified by BMI, smoking status, alcohol intake, hypertension, diabetes and atrial fibrillation (interaction P > 0.05). Furthermore, ALI exhibited a more pronounced impact on the risk of in‐hospital mortality in subgroups of patients aged over 65 years and males (interaction P = 0.031 and 0.010, respectively; Figure 3).
Figure 3.
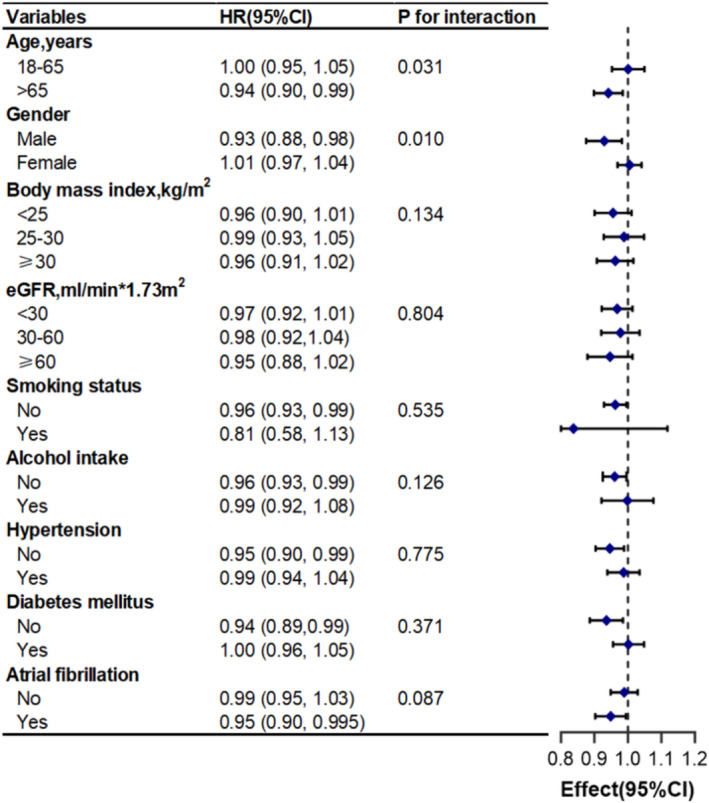
Association between ALI and in‐hospital mortality according to baseline characteristics. Each stratification adjusted for all covariates in Model 4. CI, confidence interval; eGFR, estimated glomerular filtration rate; HR, hazard ratio.
Meanwhile, we calculated that the median ALI for critically ill patients with HF aged over 65 years was 9.54. Furthermore, the C‐statistic of in‐hospital mortality in this subgroup was 0.66 (95% CI: 0.58, 0.74).
ALI and 90 day mortality
We further analysed the association between ALI and 90 day mortality. Kaplan–Meier analysis, univariable and multivariable Cox regression analysis were respectively presented in Figure S3 and Tables S2 and S3. The results revealed an inverse correlation between ALI and 90 day mortality (P < 0.05). Compared with the lowest tertile of ALI, the risk of 90 day mortality in the highest tertile decreased by 40% after adjusting for all the potential covariates in model 4 [HR (95% CI): 0.60 (0.37, 0.97), P = 0.036]. The incremental predictive value of ALI for 90 day mortality was also statistically significant (P < 0.05, Table S4).
Discussion
In this retrospective study, we leveraged the open‐source MIMIC‐IV database to evaluate the capacity of ALI in predicting short‐term outcomes among critically ill patients with HF. We found that, even after adjusting for other covariates, ALI at admission stands out as an independent predictor of both in‐hospital and 90 day mortality in critically ill patients with HF. Moreover, ALI exhibited an inverse association with in‐hospital and 90 day mortality. In addition, when contrasted with the GWTG‐HF score, ALI demonstrated an incremental predictive ability for all‐cause in‐hospital and 90 day mortality. Subgroup analysis illuminated the relationship between ALI and in‐hospital mortality in different populations, especially those aged over 65 years and male patients.
The occurrence and development of HF are intricately linked to the nutritional and inflammation status of patients. Malnutrition can arise from factors like intestinal oedema, liver dysfunction, cytokine‐induced hypercatabolic metabolism, insulin resistance and other mechanisms, resulting in fluid retention, inflammation and activation of neurohormones, and ultimately worsening of nutritional status, and forming a vicious loop known as ‘malnutrition, inflammation, cachexia’. 25 , 26 , 27 These will impact the prognosis of patients with HF. Serum albumin, a traditional nutritional assessment marker, has evolved into an independent prognostic indicator for many cardiovascular diseases, including HF, even after adjusting for common influencing factors and prognostic markers. 8 , 9 In addition, a high BMI is a risk factor for developing HF while a low BMI—another traditional marker of nutritional status—is associated with poorer outcomes, a phenomenon recognized as the ‘obesity paradox’. 28 Elevated NLR, a marker of inflammation and immune deficiency, has also been shown to be associated with adverse prognosis in patients with HF. 2 , 5 Nevertheless, the assessment of ALI, calculated by the three indicators mentioned, remains a promising tool for predicting prognosis in patients with HF. Sugai et al. conducted a study involving 319 patients with HF, tracking them over a median period of 452 days, and demonstrated that ALI effectively predicts cardiac events in patients with HF. 18 Additionally, in patients with acute decompensated HF, changes in ALI at discharge and post‐discharge have also been validated as predictors of 1 or 5 year risks of all‐cause or cardiovascular mortality. 7 , 19 , 20 A recent study by Kurkiewicz et al. highlighted the inverse correlation between lower ALI levels and 1 year mortality in patients with advanced HF. 6 While all these studies focused on the long‐term prognosis of patients with HF, it is essential to consider short‐term outcomes such as in‐hospital and 90 day mortality, particularly for critically ill patients with HF. The present study added valuable insights into the short‐term prognosis for such patients. In critically ill patients with HF, a lower ALI is associated with a higher risk of both in‐hospital and 90 day mortality. Subgroup analysis consistently supported the primary findings, revealing a particularly pronounced correlation observed, especially in males and individuals aged over 65 years. Notably, the HRs in these two subgroups were lower compared with their counterparts in the corresponding subgroups. Yuan et al. also identified ALI at admission as an independent predictor of all‐cause and cardiovascular deaths at 2 years for elderly patients with HF (aged over 65 years). 16 Patients with lower ALI in the current study had a higher proportion of males and elderly individuals, aligning with previous studies that had demonstrated an inverse relationship between age and ALI. This inverse relationship could be attributed to the prevalence of malnutrition in elderly patients and the impact of aging itself on cardiovascular function, which may lead to excessive oxidative stress and chronic low‐grade inflammation. 29 These factors potentially influence the survival of patients and might modify the impact of ALI on in‐hospital mortality.
In terms of predicting in‐hospital mortality, the GWTG‐HF score system established by Peterson et al. in 2010 has been widely used nowadays. This score system consists of seven key factors: age, blood urea nitrogen, sodium, heart rate, SBP, race and the history of chronic obstructive pulmonary disease. 24 However, ALI offered a more straightforward computational approach, thus laying the groundwork for its broader future application. More importantly, by adding ALI, the predictive efficiency of the GWTG‐HF score for short‐term mortality in critically ill patients with HF was enhanced. This improvement might stem from ALI's ability to more directly reflect the nutritional and inflammatory status of patients, thus addressing the limitations of the original score system. Furthermore, ALI showed a superior predictive value for in‐hospital mortality, particularly in the subgroup of patients aged over 65 years. This finding bolstered the potential for future research in developing short‐term mortality prediction models.
The present study has certain limitations. First, being a retrospective observational study, it lacks the capacity to establish a causal relationship, necessitating validation through extensive prospective studies. Second, this study solely evaluated the initial value of ALI at admission, excluding the assessment of how changes in ALI might impact survival outcomes. Third, the predictive value of ALI at admission is relatively low, which might constrain its practical applicability. Fourth, it is essential to acknowledge that all subjects in the current study are critically ill patients with HF, which may limit the generalization of the findings. Finally, the absence of certain data, including New York Heart Association classification and cardiac ultrasound data, introduces limitations to the analysis.
Conclusions
The present study revealed a significant association between lower ALI and higher short‐term mortality in critically ill patients with HF, independent of other clinical variables. ALI at admission proves valuable as an index of nutrition–inflammation status and an independent predictor of short‐term mortality, offering insights for clinical treatment decisions. However, additional large‐scale prospective research and extended follow‐up periods are necessary to corroborate the findings of this study.
Conflict of interest statement
None declared.
Funding
This work was supported by the National Natural Science Foundation of China (82170463), Qingdao Key Clinical Specialty Elite Discipline (QDZDZK‐2022008) and the National Key Research and Development Program of China (2021YFF0501403 and 2021YFF0501404).
Supporting information
Table S1. Univariate Cox Regression Analysis.
Table S2. Univariate Cox Regression Analysis.
Table S3. Association between ALI and 90‐day mortality.
Table S4. The incremental prognostic ability of ALI for 90‐day mortality.
Figure S1. Flow chart of the screening and enrolment of study participants.
Figure S2. Comparison of ALI between patients with and without short‐term mortality. (A) In‐hospital mortality; (B) 90‐day mortality ALI, advanced lung cancer inflammation index.
Figure S3. Kaplan–Meier survival curves for 90‐day mortality across the ALI tertiles. ALI, advanced lung cancer inflammation index.
Sun, X. , Zhang, X. , Tang, R. , Tian, J. , Li, Y. , Hu, X. , Sun, Z. , Wu, A. , Xiao, J. , Dong, M. , Yao, G. , and Lu, H. (2025) Advanced lung cancer inflammation index is associated with mortality in critically ill patients with heart failure. ESC Heart Failure, 12: 508–516. 10.1002/ehf2.15098.
Xiaoqian Sun and Xinyu Zhang contributed equally to this work.
Contributor Information
Guihua Yao, Email: yaogh6969@163.com.
Huixia Lu, Email: luhuixia@sdu.edu.cn.
References
- 1. Wang R, Wu J, Ye H, Zhang X, Wang L. Application value of systemic inflammatory indexes in the clinical evaluation of patients with heart failure with preserved ejection fraction (HFpEF). Medicina 2022;58:1473. doi: 10.3390/medicina58101473 [DOI] [PMC free article] [PubMed] [Google Scholar]
- 2. Curran FM, Bhalraam U, Mohan M, Singh JS, Anker SD, Dickstein K, et al. Neutrophil‐to‐lymphocyte ratio and outcomes in patients with new‐onset or worsening heart failure with reduced and preserved ejection fraction. ESC Heart Fail 2021;8:3168–3179. doi: 10.1002/ehf2.13424 [DOI] [PMC free article] [PubMed] [Google Scholar]
- 3. Emine MD, Mustafa EC, Nurdan A, Selda M, Yuksel C. The relationship between heart failure and systemic immune inflammation index in ED. J Emerg Med 2023;64:423–424. doi: 10.1016/j.jemermed.2023.03.022 [DOI] [Google Scholar]
- 4. Kim S, Eliot M, Koestler DC, Wu WC, Kelsey KT. Association of neutrophil‐to‐lymphocyte ratio with mortality and cardiovascular disease in the Jackson Heart Study and modification by the Duffy antigen variant. JAMA Cardiol 2018;3:455–462. doi: 10.1001/jamacardio.2018.1042 [DOI] [PMC free article] [PubMed] [Google Scholar]
- 5. Kone A, Doumbouya A, Kapche D, Soukaina S, Khaddi S, Moukhliss A, et al. The predictive value of neutrophil–lymphocyte ratio in patient with heart failure in Morocco: a retrospective cross‐sectional study. Arch Cardiovasc Dis Suppl 2019;11:41. doi: 10.1016/j.acvdsp.2018.10.088 [DOI] [Google Scholar]
- 6. Kurkiewicz K, Gąsior M, Szyguła‐Jurkiewicz BE. Markers of malnutrition, inflammation, and tissue remodeling are associated with 1‐year outcomes in patients with advanced heart failure. Pol Arch Intern Med 2023;133:16411. doi: 10.20452/pamw.16411 [DOI] [PubMed] [Google Scholar]
- 7. Maeda D, Kanzaki Y, Sakane K, Ito T, Sohmiya K, Hoshiga M. Prognostic impact of a novel index of nutrition and inflammation for patients with acute decompensated heart failure. Heart Vessels 2020;35:1201–1208. doi: 10.1007/s00380-020-01590-4 [DOI] [PubMed] [Google Scholar]
- 8. Li Z, Ling Y, Yuan X, Liu X, Huang W, Chen Q, et al. Impact of albumin infusion on prognosis of intensive care unit patients with congestive heart failure–hypoalbuminemia overlap: a retrospective cohort study. J Thorac Dis 2022;14:2235–2246. doi: 10.21037/jtd-22-648 [DOI] [PMC free article] [PubMed] [Google Scholar]
- 9. Larsson SC, Bäck M, Rees JMB, Mason AM, Burgess S. Body mass index and body composition in relation to 14 cardiovascular conditions in UK Biobank: a Mendelian randomization study. Eur Heart J 2020;41:221–226. doi: 10.1093/eurheartj/ehz388 [DOI] [PMC free article] [PubMed] [Google Scholar]
- 10. Sciomer S, Moscucci F, Salvioni E, Marchese G, Bussotti M, Corrà U, et al. Role of gender, age and BMI in prognosis of heart failure. Eur J Prev Cardiol 2020;27:46–51. doi: 10.1177/2047487320961980 [DOI] [PMC free article] [PubMed] [Google Scholar]
- 11. Koutroumpakis E, Kaur R, Taegtmeyer H, Deswal A. Obesity and heart failure with preserved ejection fraction. Heart Fail Clin 2021;17:345–356. doi: 10.1016/j.hfc.2021.02.003 [DOI] [PubMed] [Google Scholar]
- 12. Chien SC, Chandramouli C, Lo CI, Lin CF, Sung KT, Huang WH, et al. Associations of obesity and malnutrition with cardiac remodeling and cardiovascular outcomes in Asian adults: a cohort study. PLoS Med 2021;18:e1003661. doi: 10.1371/journal.pmed.1003661 [DOI] [PMC free article] [PubMed] [Google Scholar]
- 13. Ancion A, Allepaerts S, Oury C, Gori AS, Piérard LA, Lancellotti P. Serum albumin level and hospital mortality in acute non‐ischemic heart failure. ESC Heart Fail 2017;4:138–145. doi: 10.1002/ehf2.12128 [DOI] [PMC free article] [PubMed] [Google Scholar]
- 14. Arques S. Human serum albumin in cardiovascular diseases. Eur J Intern Med 2018;52:8–12. doi: 10.1016/j.ejim.2018.04.014 [DOI] [PubMed] [Google Scholar]
- 15. Yatsu S, Kasai T, Matsumoto H, Shitara J, Shimizu M, Murata A, et al. Relationship between hypoalbuminemia on admission and long‐term mortality in patients with acute decompensated heart failure. Intern Med 2019;58:1695–1702. doi: 10.2169/internalmedicine.1716-18 [DOI] [PMC free article] [PubMed] [Google Scholar]
- 16. Yuan X, Huang B, Wang R, Tie H, Luo S. The prognostic value of advanced lung cancer inflammation index (ALI) in elderly patients with heart failure. Front Cardiovasc Med 2022;9:934551. doi: 10.3389/fcvm.2022.934551 [DOI] [PMC free article] [PubMed] [Google Scholar]
- 17. Seo M, Yamada T, Morita T, Furukawa Y, Tamaki S, Iwasaki Y, et al. Prognostic value of advanced lung cancer inflammation index in patients with chronic heart failure: a prospective comparative study with cardiac I‐123 metaiodobenzylguanidine imaging. Eur Heart J 2018;39: doi: 10.1093/eurheartj/ehy566.P6215 [DOI] [Google Scholar]
- 18. Sugai T, Shishido T, Watanabe K, Toshima T, Takahashi T, Watanabe T, et al. Advanced lung cancer inflammation index (ALI) is a feasible prognostic marker in patients with heart failure. J Card Fail 2017;23:S70. doi: 10.1016/j.cardfail.2017.08.351 [DOI] [Google Scholar]
- 19. Yamada T, Watanabe T, Morita T, Kawasaki M, Kikuchi A, Kawai T, et al. Prognostic value of a new systemic inflammation‐nutrition index in patients admitted with acute decompensated heart failure; a comparison with malnutrition. Eur Heart J 2021;42: ehab724.1037. doi: 10.1093/eurheartj/ehab724.1037 [DOI] [Google Scholar]
- 20. Sakamoto D, Seo M, Yamada T, Yano M, Hayashi T, Yasumura Y, et al. Prognostic impact of the serial change of a systemic inflammation‐nutrition index in patients with heart failure with preserved ejection fraction: insights from pursuit‐hfpef registry. Eur Heart J 2022;43: doi: 10.1093/eurheartj/ehac544.876 [DOI] [Google Scholar]
- 21. Johnson AE, Pollard TJ, Shen L, Lehman LW, Feng M, Ghassemi M, et al. MIMIC‐III, a freely accessible critical care database. Sci Data 2016;3:160035. doi: 10.1038/sdata.2016.35 [DOI] [PMC free article] [PubMed] [Google Scholar]
- 22. Han S, Wang C, Tong F, Li Y, Li Z, Sun Z, et al. Value of the neutrophils/prealbumin ratio and its combination with the GWTG‐HF score in predicting in‐hospital mortality in patients with heart failure. Am J Cardiol 2022;172:62–67. doi: 10.1016/j.amjcard.2022.02.027 [DOI] [PubMed] [Google Scholar]
- 23. Han S, Wang C, Tong F, Li Y, Li Z, Sun Z, et al. Triglyceride glucose index and its combination with the Get with the Guidelines‐Heart Failure score in predicting the prognosis in patients with heart failure. Front Nutr 2022;9:950338. doi: 10.3389/fnut.2022.950338 [DOI] [PMC free article] [PubMed] [Google Scholar]
- 24. Peterson PN, Rumsfeld JS, Liang L, Albert NM, Hernandez AF, Peterson ED, et al. A validated risk score for in‐hospital mortality in patients with heart failure from the American Heart Association get with the guidelines program. Circ Cardiovasc Qual Outcomes 2010;3:25–32. doi: 10.1161/CIRCOUTCOMES.109.854877 [DOI] [PubMed] [Google Scholar]
- 25. Lin H, Zhang H, Lin Z, Li X, Kong X, Sun G. Review of nutritional screening and assessment tools and clinical outcomes in heart failure. Heart Fail Rev 2016;21:549–565. doi: 10.1007/s10741-016-9540-0 [DOI] [PubMed] [Google Scholar]
- 26. Kalantar‐Zadeh K, Anker SD, Horwich TB, Fonarow GC. Nutritional and anti‐inflammatory interventions in chronic heart failure. Am J Cardiol 2008;101:89E–103E. doi: 10.1016/j.amjcard.2008.03.007 [DOI] [PMC free article] [PubMed] [Google Scholar]
- 27. Kalantar‐Zadeh K. Recent advances in understanding the malnutrition–inflammation–cachexia syndrome in chronic kidney disease patients: what is next? Semin Dial 2005;18:365–369. doi: 10.1111/j.1525-139X.2005.00074.x [DOI] [PubMed] [Google Scholar]
- 28. Guo W, Zhao L, Zhao H, Zeng F, Peng C, Guo W, et al. The value of lactate/albumin ratio for predicting the clinical outcomes of critically ill patients with heart failure. Ann Transl Med 2021;9:118. doi: 10.21037/atm-20-4519 [DOI] [PMC free article] [PubMed] [Google Scholar]
- 29. Triposkiadis F, Xanthopoulos A, Butler J. Cardiovascular aging and heart failure: JACC review topic of the week. J Am Coll Cardiol 2019;74:804–813. doi: 10.1016/j.jacc.2019.06.053 [DOI] [PubMed] [Google Scholar]
Associated Data
This section collects any data citations, data availability statements, or supplementary materials included in this article.
Supplementary Materials
Table S1. Univariate Cox Regression Analysis.
Table S2. Univariate Cox Regression Analysis.
Table S3. Association between ALI and 90‐day mortality.
Table S4. The incremental prognostic ability of ALI for 90‐day mortality.
Figure S1. Flow chart of the screening and enrolment of study participants.
Figure S2. Comparison of ALI between patients with and without short‐term mortality. (A) In‐hospital mortality; (B) 90‐day mortality ALI, advanced lung cancer inflammation index.
Figure S3. Kaplan–Meier survival curves for 90‐day mortality across the ALI tertiles. ALI, advanced lung cancer inflammation index.