

Abstract
Background
Large‐scale trials evaluating a multicomponent lifestyle intervention aimed at weight loss on kidney function are lacking.
Methods
This was a post hoc analysis of the “PREvención con DIeta MEDiterránea‐Plus” (PREDIMED‐Plus) randomized controlled trial, including patients with overweight/obesity and metabolic syndrome, measured cystatin C and creatinine. Participants were randomly assigned (1:1) to an intensive weight loss lifestyle intervention (intervention group [IG]) consisting of an energy‐restricted Mediterranean diet (MedDiet), physical activity promotion and behavioral support, or a control group (CG) receiving ad libitum MedDiet recommendations. The primary outcome was between‐group differences in cystatin C–based kidney function (cystatin C–based estimated glomerular filtration rate—eGFRcys—and combined cystatin C–creatinine‐based eGFR—eGFRcr‐cys) change from baseline to 12 and 36 months. Secondary outcomes included between‐group differences in creatinine‐based eGFR (eGFRcr) and urinary albumin‐to‐creatinine ratio (UACR) change and the predictive capacity of these formulas at baseline for new‐onset chronic kidney disease (CKD).
Results
A total of 1909 participants (65 ± 5 years, 54% men) were included. Twelve‐month decline in eGFRcys, eGFRcr‐cys, and eGFRcr was greater in the CG compared to the IG, with between‐group differences of −1.77 mL/min/1.73 m2 [95% confidence interval −2.92 to −0.63], −1.37 [−2.22 to −0.53], and −0.91 [−1.74 to −0.71], respectively. At 36 months, the decline in eGFRcr‐cys and eGFRcr was greater in the CG. No between‐group differences in UACR were found. Significant adjusted areas under the curve for baseline eGFRcys and eGFRcr‐cys were observed for incident CKD at 36 months, which were similar to those for eGFRcr and UACR.
Conclusions
In older adults with overweight/obesity and metabolic syndrome, the PREDIMED‐Plus intervention may be an optimal approach to preserve kidney function.
Keywords: cystatin C, lifestyle intervention, Mediterranean diet, obesity, kidney function

Introduction
The prevalence of chronic kidney disease (CKD) is increasing worldwide and has become one of the leading causes of morbidity and mortality in the last decades [1, 2]. This heterogeneous condition marked by a decline in estimated glomerular filtration rate (eGFR) and/or albuminuria‐characterized kidney damage is more prevalent in the population over 60 years old because kidney function physiologically declines with aging and/or in populations with an increasing prevalence of comorbid conditions, such as obesity, type 2 diabetes (T2D), and metabolic syndrome. The coexistence of these factors not only further increases the risk of CKD onset and progression but also the risk of cardiovascular disease (CVD), the main cause of morbimortality among this population [3]. Therefore, effective strategies focused on the prevention of CKD development and progression are needed. This requires a multidisciplinary, lifestyle change–focused approach, including weight loss strategies supported by solid scientific evidence, such as using healthy dietary recommendations and physical activity promotion.
Weight loss has been considered essential in the prevention of CKD and also in delaying its progression in individuals with obesity and T2D [4, 5, 6]. Moreover, there is increasing evidence that supports the efficacy of lifestyle interventions involving changes to dietary habits or exercise promotion in CKD prevention and management [7, 8, 9, 10, 11, 12]. In this regard, the recent 2020 KDOQI guidelines recommend the Mediterranean diet (MedDiet) as one of the existing healthy dietary patterns of choice in any stage of CKD (stages 1–5) [13] due to its demonstrated renal‐protective effects against CKD progression and its ability to modulate associated cardiovascular risk factors [14]. However, few well‐powered randomized clinical trials (RCTs) have evaluated the long‐term effect of a MedDiet‐based dietary intervention on parameters associated with kidney function [15, 16, 17]. Our group has been at the forefront and has contributed top‐level evidence in this field [15, 18]. To our knowledge, only our large‐scale PREvención con DIeta MEDiterránea‐Plus (PREDIMED‐Plus) multicentric trial has explored the benefits on kidney function of a multicomponent lifestyle intervention aimed at weight loss in CVD primary prevention [19]. We recently found that, compared to individuals in the control group (CG), an intensive weight loss lifestyle intervention using an energy‐restricted MedDiet (erMedDiet) and physical activity over 1 year resulted in a lower risk of CKD incidence and, at the same time, reversed CKD [19].
The evaluation and interpretation of kidney function in clinical trials on dietary interventions aimed at weight loss may be challenging when GFR is not directly measured because the limitations of different endogenous biomarkers used, especially creatinine, may impact some outcomes. Although other markers, such as cystatin C, are not influenced by muscle mass, protein intake, or physical activity, they might also be affected by important changes in body weight and other non‐GFR‐related factors [20]. It should be noted that in all previous studies, including the PREDIMED‐Plus trial, kidney function was estimated by creatinine‐based formulas (eGFRcr) [15, 16, 17, 19]. Although not yet widely used, the current guidelines recommended the use of equations combining creatinine and cystatin C (eGFRcr‐cys) because these equations are more accurate than those using only creatinine or cystatin C [21]. However, it should be pointed out that, in older adults with overweight/obesity at high cardiovascular risk, it is not well established which is the best eGFR formula or biomarker to estimate GFR or incident CKD. The use of cystatin C–based estimated glomerular filtration rate (eGFRcys) or eGFRcr‐cys may improve the accuracy of CKD diagnosis and GFR staging, with effects on clinical decision‐making, particularly in adult populations with obesity without serious coexisting conditions.
In this study, we aimed to assess the 12‐ and 36‐month effects of an intensive lifestyle intervention (aiming at weight loss based on an erMedDiet together with the promotion of physical activity and behavioral intervention) on creatinine‐based and cystatin C–based eGFR estimates in older adults with overweight or obesity and metabolic syndrome. We also aimed to compare the ability of these GFR estimating equations using cystatin C and creatinine in predicting incident CKD.
Methods
Study design and participants
This work was conducted within the framework of the PREDIMED‐Plus study (ISRCTN89898870), an ongoing 6‐year, multicenter randomized, parallel‐group, primary prevention trial aiming to evaluate the effects of an intensive lifestyle intervention (including an erMedDiet, physical activity, and behavioral support) on incident cardiovascular events and weight loss, compared to usual care and ad libitum MedDiet recommendations. Participants were randomly allocated in a 1:1 ratio to one of the two study arms, using a computer‐based system with stratification (center, sex, and age) in blocks of six participants. Detailed information regarding the design and methods of this study can be found elsewhere [22].
The PREDIMED‐Plus trial enrolled 6874 community‐dwelling participants who were recruited from 23 Spanish centers between September 2013 and December 2016. Eligibility criteria comprised age 55–75 for men and 60–75 for women, a body mass index (BMI) ≥27 and <40 kg/m2, and the presence of at least three criteria for the diagnosis of metabolic syndrome [23]. Participants were also free of established CVD at the time of enrollment. In the current study, we analyzed data from the LIKIDI subproject, performed in 5 out of the 23 PREDIMED‐Plus recruiting centers, where serum cystatin C levels were determined in a subsample of 1909, 1645, and 1445 participants at baseline, 1 year, and 3 years of follow‐up, respectively.
Intervention
Participants in the intensive lifestyle intervention group (IG) followed an erMedDiet plus physical activity promotion and behavioral support, with specific weight loss goals. The follow‐up of the IG included individual and group interview sessions three times per month for the first year and twice per month from the second year. Participants in this group were provided for free extra‐virgin olive oil (1 L per month). On the other hand, participants in the CG received the usual healthcare recommendations of ad libitum MedDiet used in the PREDIMED study [24]. Participants in the CG were invited to group sessions every 6 months and were also provided extra‐virgin olive oil (6 L every 6 months) in each session. Further details of the PREDIMED‐Plus intervention can be found in the study protocol (available at https://www.predimedplus.com/en/project/) and our previous publication [25].
Outcome assessments
The primary outcome of this post hoc analysis of the PREDIMED‐Plus trial was to evaluate the effect of an intensive lifestyle intervention (based on erMedDiet, physical activity promotion, and behavioral support) on changes in cystatin C–based kidney function (i.e., eGFRcys and eGFRcr‐cys) at 12 and 36 months compared to usual care and MedDiet recommendations (CG). Secondary outcomes included the assessment of between‐group differences in changes in kidney function based on eGFRcr and urinary albumin‐to‐creatinine ratio (UACR) and the predictive capacity of these formulas and UACR at baseline for new‐onset CKD.
Serum creatinine and cystatin C concentrations were measured in fasting conditions at baseline, 12 months, and 36 months of follow‐up. Serum creatinine was measured by routine enzymatic methods, and serum cystatin C was measured by nephelomery assay (Atellica NEPH 630, BN II and BN ProSpec, Siemens Healthcare Headquarters) using the Atellica CH CYSC_2 (Siemens Healthcare GmbH), with a limit of quantitation of 0.25 mg/L and an intra‐ and inter‐assay coefficient of variation <10%. The kidney function was assessed by eGFR indirectly estimated from both endogenous filtration markers, creatinine (eGFRcr), cystatin C (eGFRcys), or creatinine–cystatin C (eGFRcr‐cys) using the Chronic Kidney Disease Epidemiology Collaboration (CKD‐EPI) equation [21]. At the same time points, urinary creatinine and albumin concentrations were determined from spot morning urine samples, and the UACR was calculated (mg/g). New‐onset CKD at 12 and 36 months of follow‐up was defined as progression to CKD stage 3 or greater (eGFRcr <60 mL/min/1.73 m2 of body‐surface area) and/or progression of albuminuria (UACR ≥30 mg/g) in participants free of both conditions (eGFRcr <60 mL/min/1.73 m2 of body‐surface area and UACR ≥30 mg/g) at baseline [21].
Other relevant measurements
Sociodemographic and clinical variables, including age, sex, lifestyle factors, educational achievement, history of illnesses, medication use, a 17‐item questionnaire to assess the degree to the erMedDiet [26], and a validated REGICOR Short Physical Activity Questionnaire [27], were collected for this PREDIMED‐Plus trial subpopulation. At each visit (baseline, 12 and 36 months), weight, height, BMI (calculated as weight in kg divided by the square of height in meters), waist circumference, and blood pressure were measured. At the same time points, fasting blood samples were obtained, and serum was separated and immediately frozen at −80°. Biochemical parameters, including glucose, HbA1c, triglycerides, total cholesterol, and high‐density lipoprotein cholesterol, were determined by standardized methods. Low‐density lipoprotein cholesterol was calculated using Friedewald's formula [28].
Statistical analysis
The current analysis was conducted using the PREDIMED‐plus database updated to February 2, 2024. Statistical analyses were primarily performed using the SPSS program (version 22.0.0 for Windows, SPSS Iberica). Analysis of descriptive baseline characteristics was carried out and reported as means ± SD and percentages (number) for continuous and categorical variables, respectively. The normal distribution of variables was evaluated by the Kolmogorov–Smirnov test. Baseline differences among groups were evaluated using the Student's t‐test for independent samples, and categorical variables were compared using the Chi‐squared test. Longitudinal within‐group changes were analyzed using paired Student's t‐test, and longitudinal between‐group changes were analyzed using unpaired Student's t‐test. The association between creatinine‐based and cystatin C–based equations (continuous exposure variable) with incident CKD was analyzed with logistic regression models to calculate the odds ratio (OR) and 95% confidence interval (CI). Stratified analyses by sex, age, and decrease in GFR (eGFRcr <60 mL/min/1.73 m2) were also performed. An adjusted model was also fitted, including baseline age, sex, BMI, diabetes mellitus, hypertension, dyslipidemia, current smoking, treatment with angiotensin‐converting enzyme (ACE) inhibitors, treatment with angiotensin II receptor blockers (ARBs), IG, and weight loss as covariates.
As a secondary analysis, receiver‐operating characteristic (ROC) curves, area under the ROC curve (AUC), sensitivity, specificity, and likelihood ratios were calculated to determine biochemical parameters predicting 12‐ and 36‐month incident CKD. The optimal cut‐off points for each biochemical parameter of kidney function measurement were determined by the point of convergence for the highest sensitivity and specificity. ROC analysis and their comparison were performed using the MedCalc program (version 22.020—32 bits for Windows, MedCalc Software Ltd). Statistical significance was set at p‐value <0.05.
Results
Baseline characteristics of the study population
The flow chart of participants included in the present analysis is shown in Fig. S1. The baseline clinical and biochemical characteristics of the study participants according to the two trial arms are shown in Table 1. A total of 1909 participants (964 in the CG and 945 in the IG) were included in this analysis. No differences among groups were observed in the studied variables, except for higher use of ACE inhibitors and a small but significant difference in physical activity in the CG. The prevalence of CKD estimated through eGFRcr and albuminuria at baseline was similar among the groups.
Table 1.
Baseline characteristics of the study population.
| All (n = 1909) | Control group (n = 964) | Intervention group (n = 945) | p‐value | |
|---|---|---|---|---|
| Age, years | 65.0 (5) | 65.2 (5) | 64.9 (5) | 0.272 |
| Men, n (%) | 1032 (54.1) | 522 (54.1) | 510 (54) | 0.963 |
| Weight, kg | 86.9 (12.6) | 86.4 (12.5) | 87.5 (12.6) | 0.070 |
| BMI, kg/m2 | 32.5 (3.4) | 32.4 (3.4) | 32.6 (3.4) | 0.130 |
| Waist circumference, cm | ||||
| Men | 111.0 (8.6) | 111.1 (8.6) | 110.9 (8.7) | 0.801 |
| Women | 104.9 (9.7) | 104.5 (9.6) | 105.2 (9.7) | 0.313 |
| Systolic blood pressure, mm Hg | 145.1 (18.8) | 145.3 (18.7) | 144.9 (18.8) | 0.655 |
| Diastolic blood pressure, mm Hg | 83.9 (10.9) | 83.8 (10.9) | 84.0 (10.8) | 0.767 |
| Comorbidities | ||||
| Obesity (BMI ≥ 30 kg/m2), n (%) | 1396 (73.1) | 692 (71.8) | 704 (74.5) | 0.197 |
| Type 2 diabetes mellitus, n (%) | 469 (24.6) | 222 (23) | 247 (26.1) | 0.236 |
| Hypertension, n (%) | 1616 (84.5) | 812 (84.2) | 801 (84.8) | 0.833 |
| Dyslipidemia, n (%) | 1248 (65.4) | 646 (67.0) | 602 (63.7) | 0.136 |
| Chronic kidney disease (CKD) | ||||
| eGFRcr < 60 mL/min/1.73 m2 and/or UACR ≥ 30 mg/g, n (%) | 230 (12.1) | 120 (12.5) | 110 (11.7) | 0.594 |
| eGFRcr < 60 mL/min/1.73 m2, n (%) | 87 (4.6) | 44 (4.6) | 43 (4.6) | 0.985 |
| UACR > 30 mg/g, n (%) | 168 (9.8) | 90 (10.4) | 78 (9.2) | 0.392 |
| Educational level | 0.921 | |||
|
Higher education High school Primary school |
380 (19.9) 586 (30.7) 943 (49.4) |
194 (20.1) 292 (30.3) 478 (49.6) |
186 (19.7) 294 (31.1) 465 (49.2) |
|
| Current smokers, n (%) | 58 (4.3) | 25 (3.6) | 33 (4.9) | 0.263 |
| erMedDiet, 0–17 items | 8.5 (2.6) | 8.5 (2.7) | 8.4 (2.6) | 0.489 |
| Physical activity, MET‐min/week | 2563 (2318) | 2672 (2379) | 2451 (2249) | 0.038 |
| Medications, n (%) | ||||
|
Glucose‐lowering drugs Metformin SGLT2is GLP‐1 RAs Insulin |
444 (24.3) 43 (2.4) 29 (1.6) 95 (5.2) |
211 (22.9) 24 (2.6) 13 (1.4) 52 (5.6) |
233 (25.7) 19 (2.1) 16 (1.8) 43 (4.8) |
0.236 0.478 0.540 0.392 |
|
Antihypertensive drugs ACEis ARBs Thiazides |
651 (35.7) 626 (34.4) 704 (38.7) |
360 (39.3) 300 (32.7) 364 (39.7) |
291 (32.2) 326 (36.1) 340 (37.6) |
0.002 0.133 0.361 |
| Lipid‐lowering drugs | 913 (50) | 466 (51.0) | 447 (49.4) | 0.623 |
| eGFRcr, mL/min/1.73 m2 | 85.02 (13.0) | 84.92 (13.0) | 85.13 (12.9) | 0.719 |
| eGFRcys, mL/min/1.73 m2 | 72.71 (18.3) | 72.52 (18.4) | 72.91 (18.3) | 0.642 |
| eGFRcr‐cys, mL/min/1.73 m2 | 78.59 (15.0) | 78.44 (15.1) | 78.74 (15.0) | 0.658 |
| UACR, mg/g | 17.87 (48.6) | 17.54 (44.7) | 18.21 (52.3) | 0.777 |
| Fasting glucose, mg/dL | 114.0 (28.8) | 113.2 (28.8) | 114.9 (28.8) | 0.182 |
| HbA1c, % | 6.1 (0.9) | 6.01 (0.9) | 6.01 (0.9) | 0.376 |
| Total cholesterol, mg/dL | 199.0 (37.9) | 199.1 (39.0) | 198.8 (36.7) | 0.878 |
| HDL cholesterol, mg/dL | 47.4 (11.5) | 47.6 (11.1) | 47.2 (11.8) | 0.430 |
| LDL cholesterol, mg/dL | 121.8 (33.4) | 122.1 (34.1) | 121.4 (32.7) | 0.652 |
| Triglycerides, mg/dL | 154.5 (82.1) | 154.3 (83.3) | 154.7 (80.9) | 0.908 |
Note: Continuous variables are expressed as mean (standard deviation, SD). Qualitative variables are expressed as n (%). Differences between groups assessed by unpaired samples tests (Student's t‐test or Chi‐squared test).
Abbreviations: ACEis, angiotensin‐converting enzyme inhibitors; ARBs, angiotensin II receptor blockers; BMI, body mass index; eGFRcr, creatinine‐based estimated glomerular filtration rate; eGFRcys, cystatin C–based estimated glomerular filtration rate; eGFRcr‐cys, creatinine‐based and cystatin C–based estimated glomerular filtration rate; erMedDiet, energy‐restricted Mediterranean diet; GLP‐1 RAS, glucagon‐like peptide receptor agonists; HDL, high‐density lipoprotein; HbA1c, glycated hemoglobin; LDL, low‐density lipoprotein; SGLT2is, sodium‐glucose cotransporter 2 inhibitors; UACR, urinary albumin‐to‐creatinine ratio.
Adherence to the lifestyle intervention
Changes in the 17‐item erMedDiet score, dietary and energy intake, and physical activity are shown in Table S1. An overall improvement in the general pattern of food consumption was found in both the CG and IG. As expected, we found that the increase in adherence to the erMedDiet was higher in participants in the IG compared to those in the CG (p < 0.001).
In addition, compared to participants in the CG, those in the IG showed a higher reduction in energy intake and a higher increase in physical activity at 12 and 36 months of follow‐up (p < 0.001).
Weight loss
Greater body weight losses were achieved by participants in the intensive lifestyle intervention compared to those in the CG. Mean weight loss differences were −0.4 kg (3.4) in the CG and −3.9 kg (3.8) in the IG (between‐group differences, −3.44 kg [95% CI −3.77 to −3.11; p < 0.001]) at 12 months. From baseline to 36 months, mean weight loss differences were −0.7 kg (4.6) in the CG, and −3.3 kg (3.2) in the IG (between‐group differences, −2.69 kg [95% CI −3.11 to −2.26; p < 0.001]).
Effect of a lifestyle intervention on kidney function assessed by cystatin C–based formulas
Changes in kidney function according to the study groups are shown in Table 2. Notably, participants in the CG showed a 12‐month increase in serum cystatin C levels, whereas no significant changes in serum cystatin C concentrations were observed in the IG. However, between‐group differences regarding changes in this biomarker did not remain significant after 36 months. Twelve‐month kidney function decline based on eGFRcr, eGFRcys, and eGFRcr‐cys equations was greater in the CG compared to the IG, with between‐group differences of −0.91 mL/min/1.73 m2 [95% CI −1.74 to −0.71; p = 0.034], −1.77 [95% CI −2.92 to −0.63; p = 0.002], and −1.37 [95% CI −2.22 to −0.53; p = 0.001], respectively. Indeed, as opposed to the CG, no significant changes were observed in eGFRcr or eGFRcr‐cys from baseline to 12 months in the IG. At 36 months, the decline in eGFRcr‐cys and eGFRcr was greater in the CG, compared to the IG, with between‐group differences of −1.14 mL/min/1.73 m2 [95% CI −2.10 to −0.18; p = 0.020] and −0.99 [95% CI −1.87 to −0.11; p = 0.028], respectively. No between‐group differences regarding UACR were found at 12 or 36 months. Changes in eGFRcr, eGFRcys, eGFRcr‐cys, and UACR across specific subgroups (i.e., sex, age, and baseline eGFR) at 12 and 36 months are shown in Table S2. No differences were found across these subgroups (all p‐values for interaction >0.05).
Table 2.
Changes in anthropometric and kidney function parameters according to the study groups.
| A | Control group (n = 964) | Intervention group (n = 945) | Control versus intervention between‐groups difference | |||||||||||
|---|---|---|---|---|---|---|---|---|---|---|---|---|---|---|
| Baseline | 12 months | p^a | 36 months | p^b | Baseline | 12 months | p^c | 36 months | p^d | Δ Baseline—12 months | p¨e | Δ Baseline—36 months | p¨f | |
| Weight, kg | 86.43 (12.5) | 86.06 (12.9) | <0.001 | 85.66 (13.1) | <0.001 | 87.47 (12.6) | 83.57 (12.5) | <0.001 | 83.78 (13.0) | <0.001 | −0.420 (3.4) vs. −3.858 (3.8) | <0.001 | −0.661 (4.6) vs. −3.347 (3.2) | <0.001 |
| BMI, kg/m2 | 32.35 (3.4) | 32.26 (3.6) | 0.005 | 32.23 (3.8) | 0.008 | 32.59 (3.4) | 31.21 (3.5) | <0.001 | 31.36 (3.7) | <0.001 | −0.116 (1.3) vs. −1.411 (1.4) | <0.001 | −0.156 (1.7) vs. −1.168 (1.7) | <0.001 |
| Waist circumference, cm | 108.07 (9.6) | 107.49 (9.9) | <0.001 | 107.79 (10.3) | 0.150 | 108.27 (9.6) | 103.77 (9.8) | <0.001 | 104.34 (10.1) | <0.001 | −0.652 (4.4) vs. −4.552 (5.1) vs. | <0.001 | −0.267 (5.4) vs. −3.608 (5.8) | <0.001 |
| Creatinine, mg/L | 0.84 (0.2) | 0.84 (0.2) | 0.543 | 0.86 (0.2) | <0.001 | 0.83 (0.2) | 0.83 (0.2) | 0.076 | 0.85 (0.2) | 0.001 | 0.003 (0.12) vs. −0.007 (0.12) | 0.094 | 0.026 (0.12) vs. 0.016 (0.14) | 0.109 |
| Cystatin C, mg/L | 1.06 (0.2) | 1.08 (0.2) | <0.001 | 1.12 (0.3) | <0.001 | 1.05 (0.2) | 1.05 (0.2) | 0.152 | 1.09 (0.2) | <0.001 | 0.026 (0.16) vs. 0.008 (0.15) | 0.018 | 0.062 (0.18) vs. 0.047 (0.16) | 0.095 |
| eGFRcr, mL/min/1.73 m2 | 84.92 (13.0) | 83.96 (13.2) | 0.005 | 81.75 (13.7) | <0.001 | 85.13 (12.9) | 85.25 (12.6) | 0.817 | 82.81 (13.3) | <0.001 | −0.836 (9.0) vs. 0.070 (8.9) | 0.034 | −3.181 (8.7) vs. −2.193 (9.8) | 0.028 |
| eGFRcys, mL/min/1.73 m2 | 72.52 (18.4) | 69.99 (17.2) | <0.001 | 67.13 (17.1) | <0.001 | 72.91 (18.3) | 72.26 (17.6) | 0.042 | 68.83 (16.8) | <0.001 | −2.620 (11.9) vs. −0.849 (11.8) | 0.002 | −5.585 (12.5) vs. −4.447 (12.9) | 0.088 |
| eGFRcr‐cys, mL/min/1.73 m2 | 78.44 (15.1) | 76.70 (14.7) | <0.001 | 73.93 (14.7) | <0.001 | 78.74 (15.0) | 78.61 (14.6) | 0.305 | 75.48 (14.4) | <0.001 | −1.692 (8.6) vs. −0.320 (8.8) | 0.001 | −4.549 (9.0) vs. −3.406 (9.5) | 0.020 |
| UACR, mg/g | 17.54 (44.7) | 23.40 (54.8) | <0.001 | 25.70 (58.29) | 0.001 | 18.21 (52.3) | 21.68 (59.2) | <0.001 | 24.37 (63.25) | <0.001 | 6.337 (41.1) vs. 4.978 (37.5) | 0.507 | 7.918 (50.5) vs. 8.019 (51.2) | 0.972 |
Note: Data are represented as mean (standard deviation). Differences assessed by paired (^) and unpaired (¨) samples Student's t‐test.
Abbreviations: BMI, body mass index; eGFRcr, creatinine‐based estimated glomerular filtration rate; eGFRcr‐cys, creatinine‐ and cystatin C‐based estimated glomerular filtration rate; eGFRcys, cystatin C‐based estimated glomerular filtration rate; UACR, urinary albumin‐to‐creatinine ratio.
Kidney function and anthropometric parameters are compared in the control group at baseline and 12 months.
Kidney function and anthropometric parameters are compared in the control group at baseline and 36 months.
Kidney function and anthropometric parameters are compared in the intervention group at baseline and 12 months.
Kidney function and anthropometric parameters are compared in the intervention group at baseline and 36 months.
Difference (Δ) baseline‐12 months in kidney function and anthropometric parameters between groups.
Difference (Δ) baseline‐36 months in kidney function and anthropometric parameters between groups.
Association between creatinine‐based and cystatin C–based equations and incident CKD
Incident CKD (defined as eGFRcr <60 mL/min/1.73 m2 and/or UACR ≥30 mg/g in participants without CKD at baseline) was 10.3% at 12 months and 15.7% at 36 months in the study population.
ORs for incident CKD according to baseline creatinine‐ and cystatin C–based equations and UACR are shown in Table 3. In the adjusted models, we observed an OR for estimating the risk of 12‐month incident CKD of 0.979 (95% CI 0.963–0.995, p = 0.009), 0.982 (95% CI 0.971–0.993, p = 0.001), 0.977 (95% CI 0.963–0.990, p = 0.001), and 1.121 (95% CI 1.091–1.152, p < 0.001) for eGFRcr, eGFRcys, eGFRcr‐cys, and UACR, respectively.
Table 3.
Odds ratio for the predictive capacity of baseline kidney function parameters and equations for 12‐ and 36‐month incident chronic kidney disease (CKD).
| Kidney function parameters and equations | OR for incident CKD at 12 months a | 95% CI | p | OR for incident CKD at 36 months b | 95% CI | p |
|---|---|---|---|---|---|---|
| eGFRcr crude model | 0.973 | 0.959–0.988 | <0.001 | 0.963 | 0.951–0.975 | <0.001 |
| eGFRcr‐adjusted model c | 0.979 | 0.963–0.995 | 0.009 | 0.968 | 0.954–0.981 | <0.001 |
| eGFRcys crude model | 0.978 | 0.968–0.988 | <0.001 | 0.979 | 0.971–0.987 | <0.001 |
| eGFRcys‐adjusted model c | 0.982 | 0.971–0.993 | 0.001 | 0.983 | 0.974–0.992 | <0.001 |
| eGFRcr‐cys crude model | 0.972 | 0.960–0.984 | <0.001 | 0.969 | 0.959–0.979 | <0.001 |
| eGFRcr‐cys‐adjusted model c | 0.977 | 0.963–0.990 | 0.001 | 0.973 | 0.962–0.985 | <0.001 |
| UACR crude model | 1.128 | 1.101–1.156 | <0.001 | 1.110 | 1.086–1.135 | <0.001 |
| UACR‐adjusted model c | 1.121 | 1.091–1.152 | <0.001 | 1.102 | 1.076–1.129 | <0.001 |
Abbreviations: CI, confidence interval; eGFRcr, creatinine‐based estimated glomerular filtration rate; eGFRcys, cystatin C–based estimated glomerular filtration rate; eGFRcr‐cys, creatinine‐ and cystatin C–based estimated glomerular filtration rate; OR, odds ratio; UACR, urinary albumin‐to‐creatinine ratio.
12‐Month incidence of CKD was defined when eGFRcr < 60 mL/min/1.73 m2 and/or UACR ≥ 30 mg/g in participants without CKD at baseline.
36‐Month incidence of CKD was defined when eGFRcr < 60 mL/min/1.73 m2 and/or UACR ≥ 30 mg/g in participants without CKD at baseline.
Adjusted model for age, sex, body mass index, diabetes mellitus, hypertension, dyslipidemia, current smoker, treatment with angiotensin‐converting enzyme inhibitors, treatment with angiotensin II receptor blockers, intervention group, and weight loss.
On the other hand, ORs for estimating the risk of 36‐month incident CKD were 0.968 (95% CI 0.954–0.981, p < 0.001), 0.983 (95% CI 0.974–0.992, p < 0.001), 0.973 (95% CI 0.962–0.985, p < 0.001), and 1.102 (95% CI 1.076–1.129, p < 0.001) for eGRFcr, eGFRcys, eGFRcr‐cys, and UACR, respectively.
Predictive capacity of GFR estimating equations using cystatin C and creatinine, and UACR for 12‐ and 36‐month incident CKD
The predictive capacity of baseline eGFRcr, eGFRcys, eGFRcr‐cys, and UACR for incident CKD was evaluated (Table 4, Fig. 1). We observed statistically significant adjusted AUC for baseline eGFRcys (0.699, p < 0.001) and eGFRcr‐cys (0.702, p < 0.001) for predicting incident CKD at 12 months. Although eGFRcr is commonly used for the categorization of CKD, we did not observe an increase in the ability of eGFRcr (AUC) to predict 12‐month CKD, as compared to eGFRcys or eGFRcr‐cys.
Table 4.
Predictive capacity of baseline creatinine‐ and cystatin C–based kidney function for 12‐ and 36‐month incident chronic kidney disease, according to different kidney injury parameters and equations.
| Incident CKD 12 months | AUC * | 95% CI | Cut‐off value | Sensitivity% | Specificity% | p | p a | p b | p c |
|---|---|---|---|---|---|---|---|---|---|
| eGFRcr | 0.577 | 0.552–0.601 | ≤79.32 | 40.37 | 77.38 | 0.0029 | – | ||
| eGFRcr adjusted d | 0.693 | 0.668–0.716 | >0.139 | 51.28 | 79.16 | <0.001 | – | ||
| eGFRcys | 0.609 | 0.584–0.633 | ≤67.43 | 58.02 | 62.61 | <0.001 | 0.2431 | – | |
| eGFRcys adjusted d | 0.699 | 0.675–0.722 | >0.196 | 66.88 | 67.04 | <0.001 | 0.3122 | – | |
| eGFRcr‐cys | 0.609 | 0.584–0.633 | ≤73.73 | 50.31 | 68.28 | <0.001 | 0.0988 | 0.8751 | – |
| eGFRcr‐cys adjusted d | 0.702 | 0.678–0.725 | >0.108 | 64.10 | 69.00 | <0.001 | 0.1989 | 0.7752 | – |
| UACR | 0.712 | 0.687–0.735 | >8.25 | 61.49 | 75.26 | <0.001 | 0.0004 | 0.0035 | 0.0046 |
| UACR adjusted d | 0.771 | 0.747–0.793 | >0.107 | 68.53 | 73.76 | <0.001 | 0.0003 | 0.0034 | 0.0027 |
| Incident CKD 36 months | AUC ** | 95% CI | Cut‐off value | Sensitivity% | Specificity% | p | p a | p b | p c |
|---|---|---|---|---|---|---|---|---|---|
| eGFRcr | 0.602 | 0.578–0.626 | ≤79.32 | 41.90 | 78.84 | <0.001 | – | ||
| eGFRcr adjusted d | 0.678 | 0.653–0.702 | >0.198 | 52.30 | 75.04 | <0.001 | – | ||
| eGFRcys | 0.608 | 0.584–0.632 | ≤67.61 | 58.43 | 63.76 | <0.001 | 0.4441 | – | |
| eGFRcys adjusted d | 0.670 | 0.646–0.695 | >0.171 | 61.00 | 66.25 | <0.001 | 0.9461 | – | |
| eGFRcr‐cys | 0.621 | 0.597–0.645 | ≤73.73 | 51.78 | 69.80 | <0.001 | 0.1020 | 0.1706 | – |
| eGFRcr‐cys adjusted d | 0.679 | 0.654–0.703 | >0.192 | 54.81 | 73.38 | <0.001 | 0.6207 | 0.2359 | – |
| UACR | 0.667 | 0.641–0.691 | >8.21 | 54.15 | 76.41 | <0.001 | 0.0517 | 0.1207 | 0.2265 |
| UACR adjusted d | 0.720 | 0.695–0.745 | >0.165 | 64.81 | 68.82 | <0.001 | 0.0711 | 0.0515 | 0.1174 |
Abbreviations: AUC, area under the ROC curve; CI, confidence interval; eGFRcr, creatinine‐based estimated glomerular filtration rate; eGFRcys, cystatin C‐based estimated glomerular filtration rate; eGFRcr‐cys, creatinine‐ and cystatin C‐based estimated glomerular filtration rate; UACR, urinary albumin‐to‐creatinine ratio.
Comparison of ROC curves vs. eGFRcr ROC curve.
Comparison of ROC curves vs. eGFRcys ROC curve.
Comparison of ROC curves vs. eGFRcr‐cys ROC curve.
Adjusted model for age, sex, body mass index, diabetes mellitus, hypertension, dyslipidemia, current smoker, treatment with angiotensin‐converting enzyme, treatment with angiotensin II receptor blockers, intervention group and weight loss.
12‐month incidence of chronic kidney disease was defined by eGFRcr < 60 mL/min/1.73 m2 and/or UACR ≥ 30 mg/g in participants without CKD at baseline.
36‐month cumulative incidence of chronic kidney disease was defined by eGFRcr < 60 mL/min/1.73 m2 and/or UACR ≥ 30 mg/g at 12 months and/or 36 months in participants without CKD at baseline.
Fig. 1.
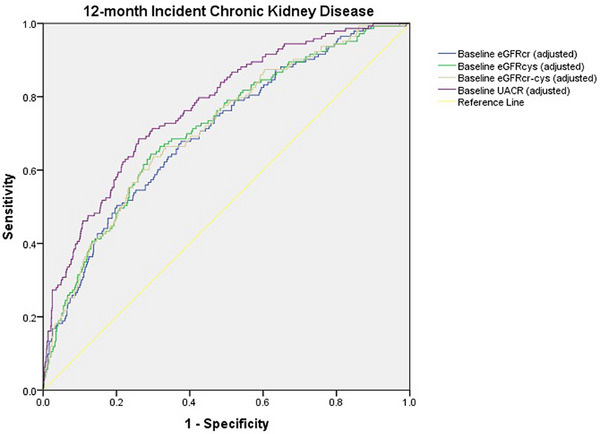
Receiver‐operating characteristic analysis for the evaluation of the predictive capacity of baseline creatinine‐based and cystatin C–based kidney function for 12‐month incident chronic kidney disease. eGFRcr‐cys, creatinine‐based and cystatin C–based estimated glomerular filtration rate; eGFRcr, creatinine‐based estimated glomerular filtration rate; eGFRcys, cystatin C–based estimated glomerular filtration rate; UACR, urinary albumin‐to‐creatinine ratio.
Similarly, for predicting incident CKD at 36 months, we found significant AUCs for baseline eGFRcys (0.670, p < 0.001) and eGFRcr‐cys (0.679, p < 0.001). No significant differences among the adjusted AUC of eGFRcys, eGFRcr‐cys, eGFRcr, and UACR were detected (Table 4, Fig. 2). Thus, cystatin C–based equations were better predictors of long‐term incident CKD (with respect to 12‐month incident CKD), as no differences between the AUC for these formulas and baseline UACR were found for the prediction of incident CKD at 36 months. In contrast, for 12‐month incident CKD, the AUC for baseline UACR was significantly greater than the AUCs for baseline eGFRcys and eGFRcr‐cys.
Fig. 2.
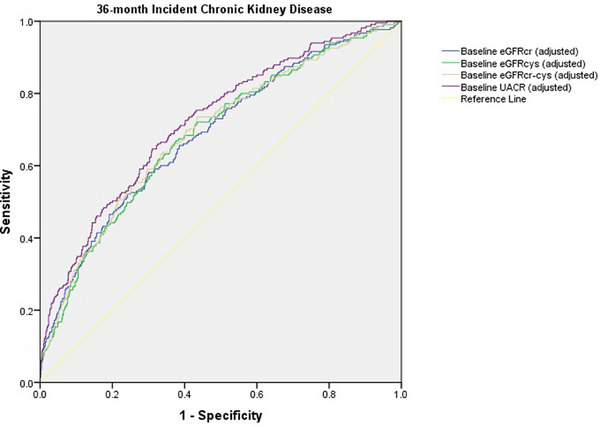
Receiver‐operating characteristic analysis for the evaluation of the predictive capacity of baseline creatinine‐based and cystatin C–based kidney function for 36‐month incident chronic kidney disease. eGFRcr‐cys, creatinine‐based and cystatin C–based estimated glomerular filtration rate; eGFRcr, creatinine‐based estimated glomerular filtration rate; eGFRcys, cystatin C–based estimated glomerular filtration rate; UACR, urinary albumin‐to‐creatinine ratio.
Discussion
The novel results of our RCT indicate that a 3‐year weight loss intensive lifestyle intervention based on an erMedDiet and physical activity, compared with advice to follow an ad libitum MedDiet without weight loss goals, resulted in a lower decline in eGFRcr‐cys in adults with overweight/obesity and metabolic syndrome. We also found that cystatin C–based eGFR equations were precise for predicting 12‐ and 36‐month incident CKDs, with accuracy similar to that of eGFRcr at 12 months and comparable to UACR and eGFRcr at 36 months. Therefore, they may have a relevant role in the prediction of CKD, alongside the parameters that are commonly used for the categorization of CKD.
These results are in line with our earlier findings regarding the effects of a 1‐year PREDIMED‐Plus intervention on kidney function assessed by a creatinine‐based eGFR equation [19]. Direct measurement of GFR using plasma or urinary clearance of exogenous filtration markers is more precise than eGFR, although its use is limited in clinical practice due to the complexity of this procedure [21]. However, it should be noted that the assessment and interpretation of kidney function in dietary interventions aimed at weight loss is challenging when GFR is not directly measured, as both diet and changes in body composition may impact especially creatinine but also cystatin C levels. Therefore, using an additional marker that is less affected by the potential changes in muscle mass induced by a lifestyle intervention [29], together with creatinine, strengthens our results, suggesting that the PREDIMED‐Plus lifestyle intervention preserves kidney function in adults with overweight and obesity after 3 years of follow‐up. Indeed, the use of two biomarkers (i.e., cystatin C and creatinine) for the estimation of GFR increases the accuracy, given that each has its benefits and limitations as filtration markers [21]. On the other hand, changes in weight loss may also have an impact on body‐surface area, although this influence may be less pronounced in the context of modest weight loss, as occurred in the present study.
In line with our findings, results from the CORDIOPREV study showed that a dietary intervention fostering the adherence to a MedDiet in patients with coronary heart disease resulted in a lower decline of eGFRcr, especially in those with mildly impaired eGFRcr, compared to a low‐fat diet [17]. However, this intervention did not aim at weight loss [17]. In the PREDIMED study, a primary prevention study conducted in patients at high cardiovascular risk, an improvement in kidney function (evaluated by eGFRcr) was reported in both group arms of participants following a MedDiet enriched either with virgin olive oil or nuts or low‐fat diet recommendations [15]. On the other hand, a recent ancillary analysis of the LIFE RCT showed that a physical activity and exercise intervention in sedentary older adults slowed the decline in eGFRcys after 2 years, compared to a health education control intervention [30]. However, to our knowledge, this is the first RCT exploring the effect of a multicomponent lifestyle intervention aimed at weight loss in primary prevention of CVD on cystatin C–based kidney function.
Normal aging is associated with a decline in eGFR of approximately 1 mL/min/1.73 m2 per year (although it can be slightly different in the presence of risk factors, such as obesity, T2D, or hypertension) [31, 32]. In our study, a mean decline of <1 mL/min/1.73 m2 in the IG according to all formulas was shown at 12 months. However, greater between‐group differences were found regarding 12‐month changes in eGFRcys and eGFRcr‐cys, compared to eGFRcr. In fact, in contrast to the CG, no significant changes were observed in eGFRcr or eGFRcr‐cys from baseline to 12 months in the IG. However, as expected, even the IG presented a significant decline in eGFR measured by the different formulas at 36 months, although it was smaller than the decline observed in the CG.
On the other hand, between‐group differences at 36 months remained for changes in eGFRcr from baseline. These differences were slightly attenuated for eGFRcr‐cys and did not remain significant for eGFRcys. These results may be influenced, in part by the attenuation of between‐group differences regarding weight loss, and show that some divergencies may be found among creatinine‐based and cystatin C–based formulas. Therefore, these findings point out the need to use formulas including both creatinine and cystatin C, that is, eGFRcr‐cys, to assess kidney function.
Some additional differences between the estimation of GFR by creatinine‐based and cystatin C–based equations were detected in our population. Therefore, the overall mean values of eGFRcys were lower than eGFRcr. It is known that obesity is associated with increased levels of serum cystatin C, which can lead to an underestimation of GFR using eGFRcys formula [20]. Moreover, although the influence of diet on cystatin C is thought to be minimal [20], it cannot be ruled out that the consumption of olive oil or other components of the MedDiet, due to its anti‐inflammatory properties, may have had an effect on cystatin C. Therefore, the use of both creatinine and cystatin C by the eGFRcr‐cys may provide the most accurate measure of GFR for most community‐dwelling patients, including people with overweight or obesity [20], especially in weight loss conditions as in the PREDIMED‐Plus trial. Moreover, this estimation has been reported to improve creatine–based formulas in patients with CKD or in the elderly population [33, 34, 35].
Notably, a significant increase in serum cystatin C was observed in the CG, whereas cystatin C values remained unchanged after the intensive lifestyle intervention at 12 months. Previous studies reported independent associations between CVD risk and circulating cystatin C levels [36]. Moreover, cystatin C–based estimates of kidney function have been shown to better predict CVD compared to eGFRcr [37, 38, 39, 40]. Additionally, some studies have shown an improved prediction of mortality by the use of cystatin C in eGFR formulas [41, 42]. Therefore, our results may add valuable information to previous studies that assessed the effects of dietary interventions on creatinine‐based kidney function, although further research is needed.
Improvements in UACR were observed for both the IG and CG. However, no between‐group differences regarding this parameter were detected. Similar to our findings, results from the CORDIOPREV RCT reported a lack of significant effects of the interventions on UACR [17]. Moreover, in our previous analysis at 1 year of follow‐up, we did not find between‐group differences in UACR [19]. These results may be explained, in part, by the widespread use of renoprotective medications in our study population, with blood pressure‐lowering and antiproteiunuric effects, including ACE inhibitors and ARBs [43]. In fact, a higher proportion of subjects in the CG were on ACE inhibitors compared to the IG within this subpopulation of the PREDIMED‐Plus trial. In addition, this difference might also have influenced baseline eGFR, as this type of hypertensive medication can have an initial hemodynamic effect (i.e., reduction of eGFR due to the induced vasodilatation in efferent arterioles and decrease in intraglomerular pressure, followed by a stabilization of eGFR over time) [44].
On the other hand, we found a significant and relevant accuracy of eGFRcys and eGFRcr‐cys for predicting incident CKD without significant differences compared to eGFRcr at 12 months and to UACR and eGFRcr at 36 months. Similarly, the OR for incident CKD was significant according to baseline UACR and creatinine‐based and cystatin C–based equations at 12 and 36 months. Considering that the definition of new‐onset CKD was based solely on eGFRcr and UACR (and not on equations using cystatin C), our results suggest that baseline GFR estimated using cystatin C equations may also serve as a useful and accurate marker for the estimation of the risk of long‐term new‐onset CKD. It should be noted that only a limited number of previous studies have evaluated the accuracy of cystatin C–based formulas for predicting CKD. In this regard, a prospective study, including 5422 participants with a mean follow‐up of 4.7 years, showed that serum cystatin C, together with microalbuminuria, was an independent risk factor for the development of incident CKD [45]. Moreover, the estimation of cystatin C–based kidney function may provide a more precise prediction of end‐stage CKD than formulas based solely on creatinine [41]. In fact, eGFRcys has been reported to be more sensitive than eGFRcr for predicting microalbuminuria [46]. On the other hand, other studies found that eGFRcr‐cys was more appropriate than eGFRcr to predict hard outcomes (i.e., combination of death, need for renal replacement therapy, or halving of eGFR) but not declines in GFR without these events [47]. However, these exploratory findings of our study should be cautiously interpreted, and larger, dedicated studies with a longer follow‐up are needed to evaluate the predictive capacity of cystatin C–based equations for new‐onset CKD in older patients with obesity/overweight and metabolic syndrome.
Strengths and limitations
We acknowledge that this study has some limitations. First, it was conducted in participants with overweight and obesity, with a mean age of 65 years; therefore, our results may show a limited generalizability to other populations. Second, GFR was not directly measured but calculated indirectly by the clearance of serum cystatin C and creatinine. Third, it should be noted that this was a post hoc analysis from the PREDIMED‐Plus trial, and dedicated, long‐term clinical trials that primarily evaluate the effects of lifestyle interventions on cystatin C‐based kidney function are needed to confirm these results. Finally, the design of our study does not allow us to distinguish the effects of each component of the lifestyle intervention (weight loss, erMedDiet, or physical activity) on changes in renal function, although because of mechanistic plausibility, probably all components may have influenced our findings. On the other hand, this study has also important strengths. Thus, this trial included a large population with close long‐term follow‐up (36 months). In fact, to our knowledge, this is the first large RCT demonstrating that a multicomponent lifestyle intervention aimed at weight loss using a healthy energy‐reduced diet and physical activity recommendations preserves kidney function in the long term. Moreover, unlike most previous studies, we used the GFR estimating equation that uses the combination of creatinine and cystatin C (eGFRcr‐cys), which has been recently recommended to be used, when available, by the KDIGO 2024 Clinical Practice Guideline for the Evaluation and Management of CKD, as it is more accurate than eGFRcr.
Conclusion
In older adults with overweight or obesity and metabolic syndrome, sustained weight loss through an intensive lifestyle program combining an erMedDiet and physical activity might be an optimal approach to preserve kidney function in the long term. In this population, cystatin C–based equations presented significant and relevant predictive values, which were similar to eGFRcr and UACR in predicting 36‐month incident CKD.
Author Contributions
José Ignacio Martínez‐Montoro: Writing—original draft; conceptualization; review and editing. Isabel Cornejo‐Pareja: Writing—original draft; conceptualization; formal analysis; review and editing. Andrés Díaz‐López: Formal analysis; writing—review and editing. Antoni Sureda: Visualization—review and editing. Estefania Toledo: Visualization—review and editing. Itziar Abete: Visualization—review and editing. Nancy Babio: Visualization. Josep A. Tur: Visualization. Miguel A. Martinez‐Gonzalez: Visualization. J. Alfredo Martínez: Visualization. Montse Fitó: Visualization. Jordi Salas‐Salvadó: Review and editing; funding acquisition; supervision. Francisco J. Tinahones: Review and editing; funding acquisition; conceptualization; supervision.
Conflict of interest statement
The authors declare no conflicts of interest.
Funding information
J.I.M.‐M. was supported by a Rio Hortega grant from Instituto de Salud Carlos III, Madrid, Spain (CM22/00217). I.C.‐P. was the recipient of a postdoctoral grant (Rio Hortega CM 17/00169) and is now the recipient of a postdoctoral grant (Juan Rodes JR 19/00054) from the Instituto de Salud Carlos III and cofounded by Fondo Europeo de Desarrollo Regional‐FEDER. This work was supported by funds from CIBER Fisiopatología de la Obesidad y Nutrición (CIBEROBN) and Instituto de Salud Carlos III (ISCIII): OBN20PI01/2020 (LIKIDI project). This work was also supported by the official Spanish Institutions for funding scientific biomedical research, CIBER Fisiopatología de la Obesidad y Nutrición (CIBEROBN) and Instituto de Salud Carlos III (ISCIII), through the Fondo de Investigación para la Salud (FIS), which is co‐funded by the European Regional Development Fund (six coordinated FIS projects leaded by JS‐S and JVi, including the following projects: PI13/00673, PI13/00492, PI13/00272, PI13/01123, PI13/00462, PI13/00233, PI13/02184, PI13/00728, PI13/01090, PI13/01056, PI14/01722, PI14/00636, PI14/00618, PI14/00696, PI14/01206, PI14/01919, PI14/00853, PI14/01374, PI14/00972, PI14/00728, PI14/01471, PI16/00473, PI16/00662, PI16/01873, PI16/01094, PI16/00501, PI16/00533, PI16/00381, PI16/00366, PI16/01522, PI16/01120, PI17/00764, PI17/01183, PI17/00855, PI17/01347, PI17/00525, PI17/01827, PI17/00532, PI17/00215, PI17/01441, PI17/00508, PI17/01732, PI17/00926, PI19/00957, PI19/00386, PI19/00309, PI19/01032, PI19/00576, PI19/00017, PI19/01226, PI19/00781, PI19/01560, PI19/01332, PI20/01802, PI20/00138, PI20/01532, PI20/00456, PI20/00339, PI20/00557, PI20/00886, PI20/01158); the Special Action Project entitled: Implementación y evaluación de una intervención intensiva sobre la actividad física Cohorte PREDIMED‐Plus grant to JS‐S. Funding for open access charge: Universidad de Málaga/CBUA.
Ethics statement
This study was approved by the Research Ethics Committees of all PREDIMED‐Plus participant centers and was conducted according to the principles of the Declaration of Helsinki. All participants gave their signed informed consent prior to the study inclusion. Trial Registration: ISRCTN89898870.
Supporting information
Supplemental Table S1: 12‐ and 36‐month changes in energy expenditure in leisure‐time physical activity, 17‐point Mediterranean diet score, energy and dietary intake by treatment group.
Supplemental Table S2. Changes in kidney function parameters across specific subgroups (sex, age, and eGFR at baseline).
Supplemental Figure S1. Flowchart of the study participants.
Martínez‐Montoro JI, Cornejo‐Pareja I, Díaz‐López A, Sureda A, Toledo E, Abete I, et al. Effect of an intensive lifestyle intervention on cystatin C–based kidney function in adults with overweight and obesity: From the PREDIMED‐Plus trial. J Intern Med. 2025;297:141–155.
José Ignacio Martínez‐Montoro and Isabel Cornejo‐Pareja have contributed equally to this work and share first authorship.
Jordi Salas‐Salvadó and Francisco J. Tinahones have contributed equally to this work and share co‐senior authorship.
Contributor Information
Isabel Cornejo‐Pareja, Email: isabelmaria.cornejo@gmail.com.
Andrés Díaz‐López, Email: andres.diaz@urv.cat.
Data availability statement
The data that support the findings of this study are available on request from the corresponding author. The data are not publicly available due to privacy or ethical restrictions.
References
- 1. Bikbov B, Purcell CA, Levey AS, Smith M, Abdoli A, Abebe M, et al. Global, regional, and national burden of chronic kidney disease, 1990–2017: a systematic analysis for the global burden of disease study 2017. Lancet. 2020;395(10225):709–733. 10.1016/S0140-6736(20)30045-3 [DOI] [PMC free article] [PubMed] [Google Scholar]
- 2. Rhee CM, Kovesdy CP. Spotlight on CKD deaths—increasing mortality worldwide. Nat Rev Nephrol. 2015;11(4):199–200. 10.1038/nrneph.2015.25 [DOI] [PMC free article] [PubMed] [Google Scholar]
- 3. Kuma A, Kato A. Lifestyle‐related risk factors for the incidence and progression of chronic kidney disease in the healthy young and middle‐aged population. Nutrients. 2022;14(18):3787. 10.3390/nu14183787 [DOI] [PMC free article] [PubMed] [Google Scholar]
- 4. Navaneethan SD, Yehnert H, Moustarah F, Schreiber MJ, Schauer PR, Beddhu S. Weight loss interventions in chronic kidney disease: a systematic review and meta‐analysis. Clin J Am Soc Nephrol. 2009;4(10):1565–1574. 10.2215/CJN.02250409 [DOI] [PMC free article] [PubMed] [Google Scholar]
- 5. Gong X, Zeng X, Fu P. The impact of weight loss on renal function in individuals with obesity and type 2 diabetes: a comprehensive review. Front Endocrinol (Lausanne). 2024;15:1320627. 10.3389/fendo.2024.1320627 [DOI] [PMC free article] [PubMed] [Google Scholar]
- 6. Conley MM, McFarlane CM, Johnson DW, Kelly JT, Campbell KL, MacLaughlin HL. Interventions for weight loss in people with chronic kidney disease who are overweight or obese. Cochrane Database Syst Rev. 2021;3(3):CD013119. 10.1002/14651858.CD013119.pub2 [DOI] [PMC free article] [PubMed] [Google Scholar]
- 7. Alkhatib L, Velez Diaz LA, Varma S, Chowdhary A, Bapat P, Pan H, et al. Lifestyle modifications and nutritional and therapeutic interventions in delaying the progression of chronic kidney disease: a review. Cureus. 2023;15(2):e34572. 10.7759/cureus.34572 [DOI] [PMC free article] [PubMed] [Google Scholar]
- 8. Quintela BCSF, Carioca AAF, de Oliveira JGR, Fraser SDS, Junior GBDS. Dietary patterns and chronic kidney disease outcomes: a systematic review. Nephrology (Carlton). 2021;26(7):603–612. 10.1111/nep.13883 [DOI] [PubMed] [Google Scholar]
- 9. Kelly JT, Su G, Zhang L, Qin X, Marshall S, González‐Ortiz A, et al. Modifiable lifestyle factors for primary prevention of CKD: a systematic review and meta‐analysis. J Am Soc Nephrol. 2021;32(1):239–253. 10.1681/ASN.2020030384 [DOI] [PMC free article] [PubMed] [Google Scholar]
- 10. Valenzuela PL, Castillo‐García A, Saco‐Ledo G, Santos‐Lozano A, Lucia A. Physical exercise: a polypill against chronic kidney disease. Nephrol Dial Transplant. 2024;39:1384–1391. 10.1093/ndt/gfae062 [DOI] [PubMed] [Google Scholar]
- 11. Kanbay M, Copur S, Yildiz AB, Tanriover C, Mallamaci F, Zoccali C. Physical exercise in kidney disease: a commonly undervalued treatment modality. Eur J Clin Invest. 2024;54(2):e14105. 10.1111/eci.14105 [DOI] [PubMed] [Google Scholar]
- 12. Evangelidis N, Craig J, Bauman A, Manera K, Saglimbene V, Tong A. Lifestyle behaviour change for preventing the progression of chronic kidney disease: a systematic review. BMJ Open. 2019;9(10):e031625. 10.1136/bmjopen-2019-031625 [DOI] [PMC free article] [PubMed] [Google Scholar]
- 13. Ikizler TA, Burrowes JD, Byham‐Gray LD, Campbell KL, Carrero J‐J, Chan W, et al. KDOQI clinical practice guideline for nutrition in CKD: 2020 update. Am J Kidney Dis. 2020;76(3 Suppl 1):S1–S107. 10.1053/j.ajkd.2020.05.006 [DOI] [PubMed] [Google Scholar]
- 14. Caldiroli L, Molinari P, Abinti M, Rusconi C, Castellano G, Vettoretti S. Can Mediterranean diet have a positive impact on kidney health? A pending answer to a long‐time question. Nutrients. 2022;14(20):4366. 10.3390/nu14204366 [DOI] [PMC free article] [PubMed] [Google Scholar]
- 15. Díaz‐López A, Bulló M, Martínez‐González MÁ, Guasch‐Ferré M, Ros E, Basora J, et al. Effects of Mediterranean diets on kidney function: a report from the PREDIMED trial. Am J Kidney Dis. 2012;60(3):380–389. 10.1053/j.ajkd.2012.02.334 [DOI] [PubMed] [Google Scholar]
- 16. Tirosh A, Golan R, Harman‐Boehm I, Henkin Y, Schwarzfuchs D, Rudich A, et al. Renal function following three distinct weight loss dietary strategies during 2 years of a randomized controlled trial. Diabetes Care. 2013;36(8):2225–2232. 10.2337/dc12-1846 [DOI] [PMC free article] [PubMed] [Google Scholar]
- 17. Podadera‐Herreros A, Alcala‐Diaz JF, Gutierrez‐Mariscal FM, Jimenez‐Torres J, Cruz‐Ares Sdl, Arenas‐de Larriva AP, et al. Long‐term consumption of a Mediterranean diet or a low‐fat diet on kidney function in coronary heart disease patients: the CORDIOPREV randomized controlled trial. Clin Nutr. 2022;41(2):552–559. 10.1016/j.clnu.2021.12.041 [DOI] [PubMed] [Google Scholar]
- 18. Díaz‐López A, Babio N, Martínez‐González MA, Corella D, Amor AJ, Fitó M, et al. Mediterranean diet, retinopathy, nephropathy, and microvascular diabetes complications: a post hoc analysis of a randomized trial. Diabetes Care. 2015;38(11):2134–2141. 10.2337/dc15-1117 [DOI] [PubMed] [Google Scholar]
- 19. Díaz‐López A, Becerra‐Tomás N, Ruiz V, Toledo E, Babio N, Corella D, et al. Effect of an intensive weight‐loss lifestyle intervention on kidney function: a randomized controlled trial. Am J Nephrol. 2021;52(1):45–58. 10.1159/000513664 [DOI] [PubMed] [Google Scholar]
- 20. Inker LA, Titan S. Measurement and estimation of GFR for use in clinical practice: core curriculum 2021. Am J Kidney Dis. 2021;78(5):736–749. 10.1053/j.ajkd.2021.04.016 [DOI] [PubMed] [Google Scholar]
- 21. Stevens PE, Ahmed SB, Carrero JJ, Foster B, Francis A, Hall RK, et al. KDIGO 2024 clinical practice guideline for the evaluation and management of chronic kidney disease. Kidney Int. 2024;105(4):S117–314. 10.1016/j.kint.2023.10.018 [DOI] [PubMed] [Google Scholar]
- 22. Martínez‐González MA, Buil‐Cosiales P, Corella D, Bulló M, Fitó M, Vioque J, et al. Cohort profile: design and methods of the PREDIMED‐Plus randomized trial. Int J Epidemiol. 2019;48(2):387–388o. 10.1093/ije/dyy225 [DOI] [PubMed] [Google Scholar]
- 23. Alberti KGMM, Eckel RH, Grundy SM, Zimmet PZ, Cleeman JI, Donato KA, et al. Harmonizing the metabolic syndrome. Circulation. 2009;120(16):1640–1645. 10.1161/CIRCULATIONAHA.109.192644 [DOI] [PubMed] [Google Scholar]
- 24. Estruch R, Ros E, Salas‐Salvadó J, Covas M‐I, Corella D, Arós F, et al. Primary prevention of cardiovascular disease with a Mediterranean diet supplemented with extra‐virgin olive oil or nuts. N Engl J Med. 2018;378(25):e34. 10.1056/NEJMoa1800389 [DOI] [PubMed] [Google Scholar]
- 25. Salas‐Salvadó J, Díaz‐López A, Ruiz‐Canela M, Basora J, Fitó M, Corella D, et al. Effect of a lifestyle intervention program with energy‐restricted Mediterranean diet and exercise on weight loss and cardiovascular risk factors: one‐year results of the PREDIMED‐Plus trial. Diabetes Care. 2019;42(5):777–788. 10.2337/dc18-0836 [DOI] [PubMed] [Google Scholar]
- 26. Schröder H, Zomeño MD, Martínez‐González MA, Salas‐Salvadó J, Corella D, Vioque J, et al. Validity of the energy‐restricted Mediterranean diet adherence screener. Clin Nutr. 2021;40(8):4971–4979. 10.1016/j.clnu.2021.06.030 [DOI] [PubMed] [Google Scholar]
- 27. Molina L, Sarmiento M, Peñafiel J, Donaire D, Garcia‐Aymerich J, Gomez M, et al. Validation of the Regicor Short Physical Activity Questionnaire for the adult population. PLoS ONE. 2017;12(1):e0168148. 10.1371/journal.pone.0168148 [DOI] [PMC free article] [PubMed] [Google Scholar]
- 28. Friedewald WT, Levy RI, Fredrickson DS. Estimation of the concentration of low‐density lipoprotein cholesterol in plasma, without use of the preparative ultracentrifuge. Clin Chem. 1972;18(6):499–502. [PubMed] [Google Scholar]
- 29. Dharnidharka VR, Kwon C, Stevens G. Serum cystatin C is superior to serum creatinine as a marker of kidney function: ameta‐analysis. Am J Kidney Dis. 2002;40(2):221–226. 10.1053/ajkd.2002.34487 [DOI] [PubMed] [Google Scholar]
- 30. Shlipak MG, Sheshadri A, Hsu F‐C, Chen S‐H, Jotwani V, Tranah G, et al. Effect of structured, moderate exercise on kidney function decline in sedentary older adults: an ancillary analysis of the LIFE study randomized clinical trial. JAMA Intern Med. 2022;182(6):650–659. 10.1001/jamainternmed.2022.1449 [DOI] [PMC free article] [PubMed] [Google Scholar]
- 31. Waas T, Schulz A, Lotz J, Rossmann H, Pfeiffer N, Beutel ME, et al. Distribution of estimated glomerular filtration rate and determinants of its age dependent loss in a German population‐based study. Sci Rep. 2021;11(1):10165. 10.1038/s41598-021-89442-7 [DOI] [PMC free article] [PubMed] [Google Scholar]
- 32. Kazancioğlu R. Risk factors for chronic kidney disease: an update. Kidney Int Suppl (2011). 2013;3(4):368–371. 10.1038/kisup.2013.79 [DOI] [PMC free article] [PubMed] [Google Scholar]
- 33. Lemoine S, Panaye M, Pelletier C, Bon C, Juillard L, Dubourg L, et al. Cystatin C‐creatinine based glomerular filtration rate equation in obese chronic kidney disease patients: impact of deindexation and gender. Am J Nephrol. 2016;44(1):63–70. 10.1159/000447365 [DOI] [PubMed] [Google Scholar]
- 34. Björk J, Grubb A, Gudnason V, Indridason OS, Levey AS, Palsson R, et al. Comparison of glomerular filtration rate estimating equations derived from creatinine and cystatin C: validation in the age, gene/environment susceptibility‐Reykjavik elderly cohort. Nephrol Dialysis Transplant. 2018;33(8):1380–1388. 10.1093/ndt/gfx272 [DOI] [PMC free article] [PubMed] [Google Scholar]
- 35. Fan L, Levey AS, Gudnason V, Eiriksdottir G, Andresdottir MB, Gudmundsdottir H, et al. Comparing GFR estimating equations using cystatin C and creatinine in elderly individuals. J Am Soc Nephrol. 2015;26(8):1982–1989. 10.1681/ASN.2014060607 [DOI] [PMC free article] [PubMed] [Google Scholar]
- 36. West M, Kirby A, Stewart RA, Blankenberg S, Sullivan D, White HD, et al. Circulating cystatin C is an independent risk marker for cardiovascular outcomes, development of renal impairment, and long‐term mortality in patients with stable coronary heart disease: the LIPID study. J Am Heart Assoc. 2022;11(5):e020745. 10.1161/JAHA.121.020745 [DOI] [PMC free article] [PubMed] [Google Scholar]
- 37. Svensson‐Färbom P, Ohlson Andersson M, Almgren P, Hedblad B, Engström G, Persson M, et al. Cystatin C identifies cardiovascular risk better than creatinine‐based estimates of glomerular filtration in middle‐aged individuals without a history of cardiovascular disease. J Intern Med. 2014;275(5):506–521. 10.1111/joim.12169 [DOI] [PubMed] [Google Scholar]
- 38. Chen DC, Lees JS, Lu K, Scherzer R, Rutherford E, Mark PB, et al. Differential associations of cystatin C versus creatinine‐based kidney function with risks of cardiovascular event and mortality among South Asian individuals in the UK Biobank. J Am Heart Assoc. 2023;12(3):e027079. 10.1161/JAHA.122.027079 [DOI] [PMC free article] [PubMed] [Google Scholar]
- 39. Lees JS, Welsh CE, Celis‐Morales CA, Mackay D, Lewsey J, Gray SR, et al. Glomerular filtration rate by differing measures, albuminuria and prediction of cardiovascular disease, mortality and end‐stage kidney disease. Nat Med. 2019;25(11):1753–1760. 10.1038/s41591-019-0627-8 [DOI] [PMC free article] [PubMed] [Google Scholar]
- 40. Schöttker B, Herder C, Müller H, Brenner H, Rothenbacher D. Clinical utility of creatinine‐ and cystatin C‐based definition of renal function for risk prediction of primary cardiovascular events in patients with diabetes. Diabetes Care. 2012;35(4):879–886. 10.2337/dc11-1998 [DOI] [PMC free article] [PubMed] [Google Scholar]
- 41. Shlipak MG, Matsushita K, Ärnlöv J, Inker LA, Katz R, Polkinghorne KR, et al. Cystatin C versus creatinine in determining risk based on kidney function. New Engl J Med. 2013;369(10):932–943. 10.1056/NEJMoa1214234 [DOI] [PMC free article] [PubMed] [Google Scholar]
- 42. Hojs Fabjan T, Penko M, Hojs R. Newer glomerular filtration rate estimating equations for the full age spectrum based on serum creatinine and cystatin C in predicting mortality in patients with ischemic stroke. Eur J Intern Med. 2018;52:67–72. 10.1016/j.ejim.2018.02.005 [DOI] [PubMed] [Google Scholar]
- 43. Kunz R, Friedrich C, Wolbers M, Mann JFE. Meta‐analysis: effect of monotherapy and combination therapy with inhibitors of the renin‐angiotensin system on proteinuria in renal disease. Ann Intern Med. 2008;148(1):30–48. 10.7326/0003-4819-148-1-200801010-00190 [DOI] [PubMed] [Google Scholar]
- 44. Schoolwerth AC, Sica DA, Ballermann BJ, Wilcox CS. Renal considerations in angiotensin converting enzyme inhibitor therapy. Circulation. 2001;104(16):1985–1991. 10.1161/hc4101.096153 [DOI] [PubMed] [Google Scholar]
- 45. Shastri S, Katz R, Shlipak MG, Kestenbaum B, Peralta CA, Kramer H, et al. Cystatin C and albuminuria as risk factors for development of CKD stage 3: the multi‐ethnic study of atherosclerosis (MESA). Am J Kidney Dis. 2011;57(6):832–840. 10.1053/j.ajkd.2010.11.021 [DOI] [PMC free article] [PubMed] [Google Scholar]
- 46. Palatini P, Benetti E, Zanier A, Santonastaso M, Mazzer A, Cozzio S, et al. Cystatin C as predictor of microalbuminuria in the early stage of hypertension. Nephron Clin Pract. 2009;113(4):c309–314. 10.1159/000235949 [DOI] [PubMed] [Google Scholar]
- 47. Rogacev KS, Pickering JW, Seiler S, Zawada AM, Emrich I, Fliser D, et al. The chronic kidney disease epidemiology collaboration (CKD‐EPI) equation incorporating both cystatin C and creatinine best predicts individual risk: a cohort study in 444 patients with chronic kidney disease. Nephrol Dialysis Transplant. 2014;29(2):348–355. 10.1093/ndt/gft422 [DOI] [PubMed] [Google Scholar]
Associated Data
This section collects any data citations, data availability statements, or supplementary materials included in this article.
Supplementary Materials
Supplemental Table S1: 12‐ and 36‐month changes in energy expenditure in leisure‐time physical activity, 17‐point Mediterranean diet score, energy and dietary intake by treatment group.
Supplemental Table S2. Changes in kidney function parameters across specific subgroups (sex, age, and eGFR at baseline).
Supplemental Figure S1. Flowchart of the study participants.
Data Availability Statement
The data that support the findings of this study are available on request from the corresponding author. The data are not publicly available due to privacy or ethical restrictions.