

ABSTRACT
Dyslipidemia, abnormal levels of lipids in the bloodstream, is associated with cardiovascular disease risk (CVD). The purpose of this study was to evaluate the effects of dyslipidemia on cardiometabolic health in relatively young, healthy adults. Participants were 54 healthy males and females aged 18–60 years. Participants were assessed for anthropometrics, body composition, blood pressure and vascular stiffness indicators, microvascular health, and glucose and lipid levels. Using a cross‐sectional approach, participants were characterized and grouped as having dyslipidemia or not, and then statistically assessed to determine whether differences in other cardiometabolic health measures existed between the groups. There were significant differences between groups for body weight and composition (total mass, muscle mass, visceral fat, bone mass, and body mass index, all, p < 0.027, Cohen's d > 0.605) with the dyslipidemia group being higher. There were significant differences between groups for peripheral and central blood pressures (all, p < 0.003, Cohen's d > 0.899), as well as for vascular stiffness indicators (pulse pressure, augmentation pressure, augmentation index, augmentation index 75) (all, p < 0.022, Cohen's d > 0.672) with elevations noted in the dyslipidemia group. Ten‐year CVD risk was significantly different between groups, with an average risk of 0.8% in the normal lipids group and a risk of 5.4% in the dyslipidemia group (p < 0.001, Cohen's d = 1.260). However, there were no significant differences in macro‐ or micronutrient intake between groups (all, p > 0.166, Cohen's d < 0.412). There is a significant impact on cardiometabolic health in individuals with dyslipidemia who are otherwise healthy, which may increase individual risk for CVD.
Trial Registration: ClinicalTrials.gov identifier: NCT06544915.
Keywords: hypercholesterolemia, lipid profile, microvascular function, vascular stiffness
1. Introduction
Dyslipidemia is characterized by abnormal levels of lipids in the bloodstream [1]. The prevalence and global burden of dyslipidemia have increased in the past 30 years along with increases in morbidity, mortality, and economic costs associated with cardiometabolic disease [2, 3]. Worldwide it is estimated by the World Health Organization (WHO) that over 4 million deaths per year are associated with dyslipidemia [4]. In the United States, the American Heart Association (AHA) estimates that over 100 million Americans have high total cholesterol levels, which would categorize them as having dyslipidemia [3]. Dyslipidemia poses a significant risk for cardiovascular diseases (CVD), as dysregulated lipid levels are one of the major risk factors for coronary heart disease, which is the leading cause of death in the United States [1, 3].
Despite these overwhelming estimates of the incidence of dyslipidemia, these values are still likely an underestimation of the prevalence of dyslipidemia. Dyslipidemia without the presence of other CVD risk factors does not usually result in any symptoms that would notify an individual of its presence. Therefore, it is a “silent” risk factor and most often goes undiagnosed in young, otherwise healthy populations, as screening rates in the 20–45‐year age group have been reported as <50%, despite roughly half of the 20–39‐year age group meeting National Cholesterol Education Program (NCEP) guidelines for lipids [5]. Knowing if young, healthy individuals have dyslipidemia is essential in helping clinicians identify CVD risk early and prescribe lifestyle changes early to help patients improve their health.
Lipid profiles are composed of total cholesterol, low‐density lipoprotein (LDL), high‐density lipoprotein (HDL), and triglycerides (TRG). These lipids are used to categorize dyslipidemia and having abnormal levels of any one of these lipid types indicates a person as having dyslipidemia [1]. The cutoff values for identification of dyslipidemia are ≥130 mg/dL for LDL, <40 mg/dL for HDL, ≥150 mg/dL for triglycerides, and ≥200 mg/dL for total cholesterol [6]. However, an individual's age, sex, and other risk factors need to be considered to determine appropriate lipid ranges.
Dyslipidemia has been widely studied for its relation to CVD in advancing age among many diseased and at‐risk populations [7, 8, 9, 10]. However, there are limited studies investigating dyslipidemia in young, healthy individuals, and how this dyslipidemia may negatively impact other indicators of cardiometabolic health. To our knowledge, the impact of dyslipidemia on emerging markers of cardiovascular health, such as central blood pressure, vascular reactivity, and heart rate (HR) variability, has not yet been studied in young and healthy populations. Accordingly, the purpose of this study was to investigate the effects of dyslipidemia on cardiometabolic health in relatively young and healthy adults using a cross‐sectional approach. It was hypothesized that participants with dyslipidemia would have additional positive indicators of CVD, such as high blood pressure and unfavorable body composition, as well as impaired emerging markers of cardiovascular health, namely, central blood pressure and microvascular reactivity.
2. Methods
2.1. Subjects and General Procedures
Fifty‐four healthy males and females were recruited via email from Skidmore College and the surrounding community. Participants were between the ages of 18 and 60 years and were screened for uncontrolled chronic diseases (e.g., cardiovascular, metabolic, pulmonary) and CVD risk factors by a survey of the participants self‐reporting in a health‐history form. Participants with two or more CVD risk factors (including significant history of cigarette smoking) were excluded, as well as those with uncontrolled cardiovascular, metabolic, or pulmonary diseases [11]. Participants were excluded if they: (1) recently (<8 weeks) donated blood, (2) had cancer or were receiving current cancer treatment, (3) were women who were pregnant, breastfeeding, attempting to conceive, or amenorrheic, (4) were receiving treatment of hypothyroid with levothyroxine, (5) had severe illness or compromised/suppressed immune systems [12], (6) had eating disorders, and/or (7) were a current smoker. Familial dyslipidemias were not excluded, although no participants enrolled met the criteria or reported such history. Participants were told not to participate in strenuous exercise for 24 h and to avoid caffeine and alcohol intake 12 h before baseline and post‐testing measurements. Participants were told to arrive well hydrated (i.e., consumption of 8–12 oz of water before bed and before arrival) for all laboratory visits. Participants provided written informed consent prior to participation. The study was approved by the Institutional Review Board of Skidmore College (IRB#2209‐1044). This research was done in accordance with the most recent Declaration of Helsinki revisions. This study was registered with clinicaltrials.gov (NCT06544915).
2.2. Procedures
This study was a retrospective cross‐sectional single‐visit study. The measurement protocols are outlined below (Figure 1).
FIGURE 1.
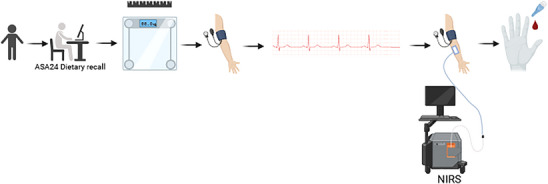
Overview of study visit. Created with BioRender.com.
The current study used a cross‐sectional approach. After all testing was conducted, the participants were grouped into those with dyslipidemia (total cholesterol > 200mg/dL, triglycerides >150 mg/dL, HDL cholesterol <40 mg/dL, or LDL cholesterol > 130mg/dL) or those without [6]. Thus, until blood testing was performed, the team was blinded to lipid profile and therefore grouping.
2.3. Nutrition and Physical Activity
Upon arrival at the laboratory, physical activity was assessed using the International Physical Activity Questionnaire (IPAQ) via an online survey software (QualtricsXM, Boston, MA, USA) [13]. The surveys were administered on a tablet device (iPad, Apple, Cupertino, CA, USA). Participants documented their diet by using the Automated Self‐Administered 24‐h dietary recall (ASA24‐2022) [14]. The ASA24 website utilizes an extensive database of questions that allows respondents to note specific portion sizes and food preparations and has been documented to be valid and reliable [15, 16]. All the participant recalls were reviewed by a registered dietitian to detect abnormalities, such as extremely low or high energy intake, in the recalls that may have prompted a follow‐up with the participant.
2.4. Body Composition
Afterward, height, body mass, waist, and hip circumference (waist at level of umbilicus and hip at widest portion of buttocks) [17], and total body composition (fat and lean mass, body water) were assessed using a stadiometer (Seca, Mt. Pleasant, SC, USA), Gulick tape measure (Gulick II Plus), and bioelectric impedance analysis (BIA) scale (RD‐545, Tanita, Arlington Heights, IL, USA) [18], respectively.
2.5. Blood Pressure
Participants were then positioned supine while they were instrumented. Blood pressure (BP) was measured using the oscillometric cuff technique, providing peripheral blood pressures, and with subsequent generalized transfer function central blood pressure was estimated (Sphygmocor Xcel, Atcor, Naperville, IL, USA) [19]. Pulse wave analysis (PWA) was performed on the derived central pressure waveforms providing measures of arterial stiffness, namely, augmentation pressure (AP), augmentation index (AIx), and AIx normalized to 75 beats/min HR (Aix@75). HR and HR variability (HRV), important indicators of CV health [20, 21], were measured using an HR monitor (H7, Polar, Lake Success, NY, USA) strapped around the chest that transmitted data to a mobile device via Bluetooth to an automated application that performs artifact correction (Elite HRV) [22, 23, 24].
2.6. NIRS‐VOT
Next, the near‐infrared vascular occlusion test (NIRS‐VOT) was conducted to assess microvascular reactivity [25, 26, 27]. The right medial forearm was cleaned using an alcohol swab and then shaved to ensure good optical transmission. A near‐infrared spectroscopy device (MOXY, Fortiori Design LLC, Hutchinson, MN) was attached to the forearm of the participants, wrapped with an opaque bandage to secure it in place, and connected to a mobile device via Bluetooth and application for data acquisition [28]. An occlusion cuff was placed proximal to the NIRS device on the bicep of the same arm and set to 220 mm Hg (E20, Hokanson, Bellevue, Washington). After 10 min of rest, baseline tissue oxygen saturation was captured for 1 min. The cuff was then occluded for 5 min to capture the desaturation slope after cuff inflation (slope 1) which was quantified 30–150 s after cuff inflation. The cuff was then released, and an additional 1‐min of data were recorded. The reoxygenation slope (slope 2) was captured in the first 10 s after the cuff was deflated.
2.7. Lipids Profile
Using the standard capillary fingerstick technique, about 40 uL of blood was collected using a pressure‐activated lancet in the fingertip of the participant's preferred hand. The blood was then transferred into a single‐use cassette and analyzed for lipid and glucose values by a Cholestech LDX analyzer (Abbott, Lake Forest, IL, USA), which has been validated against standard clinical testing [29].
2.8. Framingham Risk Score
Framingham risk score was calculated using an online calculator linked on the Framingham Heart Study website which required input of participant sex, age, use of certain medications, systolic blood pressure, HDL cholesterol, and total cholesterol [30]. These parameters were input into the calculator for each participant and their individual 10‐year CVD risk and vascular age were output.
2.9. Statistical Analysis
All data were entered by two members of the research team and cross‐referenced for accuracy. All statistical analyses were carried out using open‐source software (JASP, v 0.18, Amsterdam, Netherlands). In an independent sample one‐tailed t‐test model (congruent with our directional hypothesis), using an assumed effect size of 0.8, alpha of 0.05, to achieve an adequate power of 0.8, an estimated total sample size of 42 (n = 21/group) would be needed. Independent samples t‐tests were used to determine whether significant differences in body composition, BP, HR, vascular reactivity, and lipid measurements existed between participants with dyslipidemia and those without. Cohen's d was calculated to determine the effect size between the two groups, using conventional cutoffs of 0.2, 0.5, and 0.8 to indicate small, medium, and large effect sizes, respectively. The Shapiro–Wilk test for normality was used to evaluate whether the data were normally distributed, and Levene's test for equality of variance was used to determine if the assumptions for the statistical test were met. If not, a non‐parametric alternative, Welch's test, was used. Tests of proportion were conducted using the Chi‐squared test. Lastly, we used logistic regression to determine whether participant factors, namely, age, sex, and BMI predicted the classification of dyslipidemia status. Alpha was set at 0.05. Data are presented as means ± standard deviation, unless specified otherwise.
3. Results
3.1. Participant Characteristics
Descriptive statistics of all participants are displayed in Table 1. In terms of characteristics, there was a disproportionate frequency of males in the dyslipidemia group (70% male) as compared to the control group (32% male, p = 0.007, Table 1).
TABLE 1.
Participant characteristics.
| Lipid categorization | Significance | |||
|---|---|---|---|---|
| Condition | Normal lipids (n = 34) | Dyslipidemia (n = 20) | p value | Cohen's d |
| Sex (male/female) | 11/23 (32% M) | 14/6 (70% M) | 0.007 b | N/A |
| Age (years) | 24.7 ± 10.9 | 38.5 ± 16.1 | 0.002 a | 1.004 |
| Height (cm) | 168.5 ± 10.5 | 175.1 ± 11.9 | 0.039 a | 0.605 |
| Weight (kg) | 66.6 ± 11.1 | 88.0 ± 23.4 | 0.001 a | 1.171 |
| BMI (kg/m2) | 23.4 ± 3.2 | 28.4 ± 5.2 | <0.001 a | 1.158 |
| Body fat (%) | 24.7 ± 8.5 | 28.4 ± 8.2 | 0.128 | 0.442 |
| Vigorous PA (min/week) | 180.6 ± 203.1 | 170.0 ± 187.4 | 0.848 | 0.054 |
| Moderate PA (min/week) | 103.9 ± 131.4 | 140.1 ± 150.5 | 0.383 | 0.257 |
Note: Data are presented as mean ± SD.
Denotes significance.
A Chi‐squared proportions test was run to assess differences in proportions.
3.2. Dietary Analysis and Physical Activity
Surprisingly, dietary intakes of macro and micronutrients were not significantly different between groups. There were no significant differences in energy intake, or macronutrients (carbohydrates, fat, and protein), saturated fat, or fiber intake between groups (all, p > 0.166, Cohen's d < 0.412, Table 2). There were also no significant differences in micronutrient intakes (sodium, calcium, folate, iron, magnesium, potassium, vitamin A, vitamin B‐12, and Vitamins C, D, and E) intake between groups (all, p > 0.217, Cohen's d < 0.366, Table 2). Alcohol consumption was assessed by the dietary recall completed by participants. Only four participants consumed alcohol according to these dietary recalls, each having only one drink. There was not a significant difference in alcohol intake between the individuals with dyslipidemia and those without (p = 0.720, Cohen's d = 0.078). In terms of physical activity, there were no significant differences between groups in time spent doing vigorous physical activity per week (p = 0.848, Cohen's d = 0.054, Table 1) or in time spent doing moderate physical activity per week (p = 0.383, Cohen's d = 0.257, Table 1).
TABLE 2.
Average energy, fiber, and micro‐ and macronutrient intake for individuals in both lipid categories.
| Lipid categorization | Significance | |||
|---|---|---|---|---|
| Condition | Normal lipids (n = 26) | Dyslipidemia (n = 17) | p value | Cohen's d |
| Kcal | 2288.2 ± 1363.3 | 2082.1 ± 830.9 | 0.542 | 0.183 |
| Carbs (g) | 238.5 ± 156.1 | 221.7 ± 113.4 | 0.685 | 0.123 |
| Fat (g) | 99.3 ± 61.2 | 89.6 ± 32.8 | 0.502 | 0.199 |
| Protein (g) | 109.3 ± 78.4 | 95.8 ± 46.5 | 0.480 | 0.211 |
| Saturated fat (g) | 30.6 ± 19.9 | 28.5 ± 16.0 | 0.695 | 0.117 |
| Fiber (g) | 23.0 ± 16.7 | 17.5 ± 8.4 | 0.166 | 0.412 |
| Sodium (mg) | 3658.7 ± 2486.3 | 3506.1 ± 1601.9 | 0.808 | 0.073 |
| Calcium (mg) | 995.2 ± 678.0 | 1061.3 ± 600.4 | 0.739 | −0.103 |
| Folate (mcg) | 585.3 ± 451.6 | 612.1 ± 372.6 | 0.833 | −0.065 |
| Iron (mg) | 16.4 ± 10.6 | 15.5 ± 6.9 | 0.733 | 0.103 |
| Magnesium (mg) | 372.3 ± 208.6 | 322.2 ± 129.3 | 0.337 | 0.289 |
| Potassium (mg) | 3024.4 ± 1800.3 | 2504.3 ± 891.9 | 0.217 | 0.366 |
| Vitamin A (mcg) | 832.6 ± 577.9 | 824.3 ± 277.4 | 0.950 | 0.018 |
| Vitamin B12 (mcg) | 44.1 ± 195.2 | 5.5 ± 3.5 | 0.323 | 0.280 |
| Vitamin C (mg) | 90.4 ± 72.7 | 81.3 ± 85.0 | 0.720 | 0.115 |
| Vitamin D (IU) | 367.2 ± 668.1 | 249.2 ± 308.3 | 0.439 | 0.227 |
| Vitamin E (mg) | 11.3 ± 7.6 | 10.5 ± 5.9 | 0.723 | 0.108 |
Note: Data are presented as mean ± SD.
3.3. Anthropometrics and Body Composition
There were several significant differences in measures of body composition between the participants with normal lipids and those with dyslipidemia. Body weight and BMI were significantly higher in the dyslipidemia group as compared to controls (both, p ≤ 0.001, d = 1.2, Table 1). Hip and waist circumference were significantly higher in the dyslipidemia group than the normal lipids group (both, p < 0.001, Cohen's d > 1.316, Figure 3A,B). The dyslipidemia group had significantly higher muscle mass than the normal lipids group (p = 0.001, Cohen's d = 0.985, Figure 3C). There was no significant difference between groups for total body fat percentage (p = 0.128, Cohen's d = 0.442, Table 1), but there was in visceral fat with the dyslipidemia group having higher levels (p = 0.001, Cohen's d = 1.385, Figure 3D). Additionally, the dyslipidemia group had significantly higher bone mass (both, p < 0.022, Cohen's d > 0.806, Figure 3E) than the normal lipid group. The normal lipids group had a significantly higher body water percentage (p = 0.015, Cohen's d = 0.718, Figure 3F).
FIGURE 3.
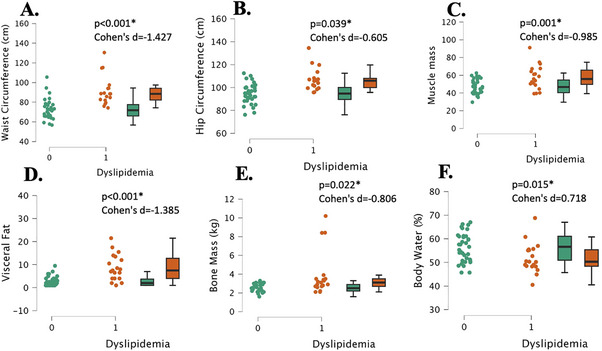
Body composition measurements in young, healthy individuals with dyslipidemia (“1”, n = 17) and individuals with normal lipids (“0”, n = 26). Waist circumference (Panel A), hip circumference (Panel B), muscle mass (Panel C), visceral fat (Panel D), bone mass (Panel E), and body water (Panel F). Data are individual plots and box and whisker (median and IQR). The p values and Cohens d are for the group comparison using independent samples t‐test.
3.4. Lipid and Glucose Panel
As expected, the normal lipids group had significantly lower total cholesterol and LDL cholesterol than the dyslipidemia group (both, p < 0.006, Cohen's d > 0.954, Figure 2A, C). Also expectedly, the normal lipids group had significantly higher HDL cholesterol (p < 0.001, Cohen's d = 1.16, Figure 2B) and lower non‐HDL cholesterol and TC/HDL ratio than the dyslipidemia group (both, p < 0.001, Cohen's d > 1.532, Figure 2E, F). Glucose was significantly greater in the dyslipidemia group, although within the normal range (90.4 ± 9.1 mg/dL vs. 84.9 ± 6.3 mg/dL, p = 0.014, Cohen's d = 0.732). There was, however, no significant difference between groups for triglyceride levels (p = 0.166, Cohen's d = 0.486, Figure 2D). Logistic regression using age, sex, and BMI, revealed a significant model fit (r 2 = 0.45, p < 0.001), but only sex (p = 0.04) and BMI (p = 0.01) were significant predictors of dyslipidemia status, and not age (p = 0.08).
FIGURE 2.
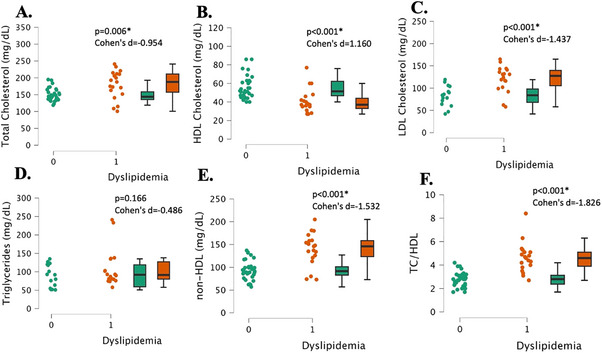
Lipid panel measurements in young, healthy individuals with dyslipidemia (“1”, n = 17) and individuals with normal lipids (“0”, n = 26). Total cholesterol (Panel A), HDL cholesterol (Panel B), LDL cholesterol (Panel C), triglycerides (Panel D), non‐HDL cholesterol (Panel E), total cholesterol to HDL cholesterol ratio (TC/HDL) (Panel F). Data are individual plots and box and whisker (median and IQR). The p values and Cohen's d are for the group comparison using independent samples t‐test.
3.5. Blood Pressure
The dyslipidemia group had significantly higher peripheral systolic and diastolic blood pressures than the normal lipids group (both, p < 0.003, Cohen's d > 0.899, Figure 4A,B). Additionally, the dyslipidemia group had significantly higher central systolic and diastolic blood pressures (both, p < 0.003, Cohen's d > 0.905, Figure 4C,D).
FIGURE 4.
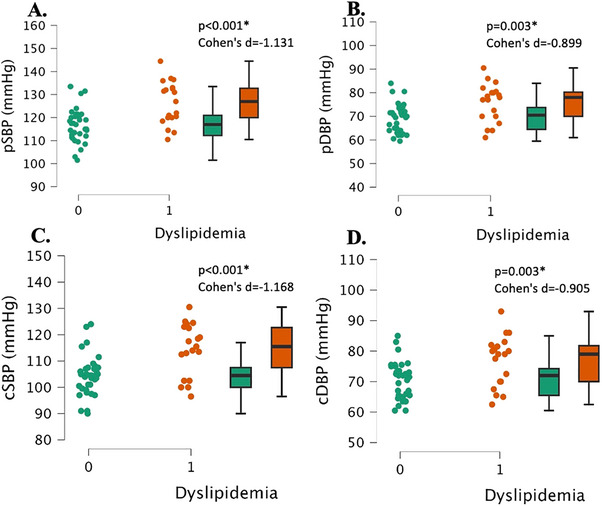
Central and peripheral blood pressure measurements in young, healthy individuals with dyslipidemia (“1”, n = 17) and individuals with normal lipids (“0”, n = 26). Peripheral systolic blood pressure (pSBP, Panel A), peripheral diastolic blood pressure (pDBP, Panel B), central systolic blood pressure (cSBP, Panel C), central diastolic blood pressure (cDBP, Panel D). Data are individual plots and box and whisker (median and IQR). The p values and Cohens d are for the group comparison using independent samples t‐test.
3.6. Vascular Stiffness
The dyslipidemia group had significantly higher pulse pressure and AP than the normal lipids group (both, p < 0.022, Cohen's d > 0.672, Figure 5A,B). The dyslipidemia group also had a significantly higher AIx and AIx normalized to 75 beats/min HR than the normal lipids group (both, p < 0.017, Cohen's d > 0.705, Figure 5C,D).
FIGURE 5.
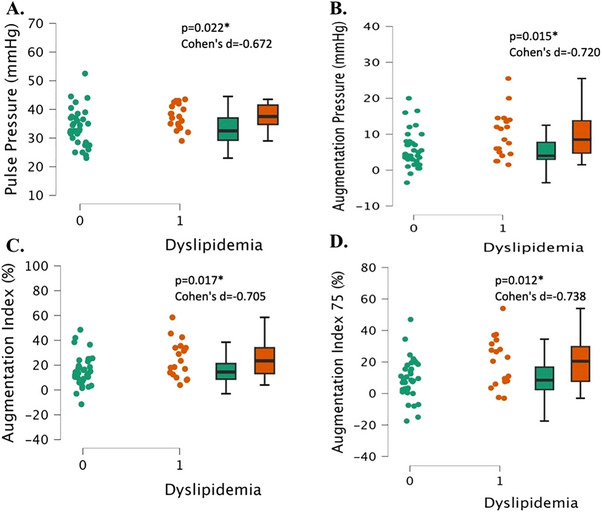
Vascular stiffness measurements in young, healthy individuals with dyslipidemia (“1”, n = 17) and individuals with normal lipids (“0”, n = 26). Pulse pressure (Panel A), augmentation pressure (panel B), augmentation index (Panel C), and augmentation index 75 (Panel D). Data are individual plots and box and whisker (median and IQR). The p values and Cohen's d are for the group comparison using independent samples t‐test.
3.7. HRV
The groups were not significantly different in any of the time–domain‐based HRV metrics besides pNN50. First, there were no significant differences between groups for HR (p = 0.195, Cohen's d = 0.338, Figure 6A). There were no significant differences between groups for the root mean square of the successive differences (RMSSD) or the log‐transformed RMSSD (lnRMSSD) (both, p > 0.066, Cohen's d < 0.517, Figure 6B,C). There were no significant differences between groups for RR‐intervals or the standard deviation of the R‐R intervals (SDNN) (both, p > 0.084, Cohen's d < 0.485, Figure 6D,E). The proportion of NN50 divided by the total number of NN intervals (pNN50) was significantly lower in the dyslipidemia group than in the normal lipids group (p = 0.037, Cohen's d = 0.619, Figure 6F).
FIGURE 6.
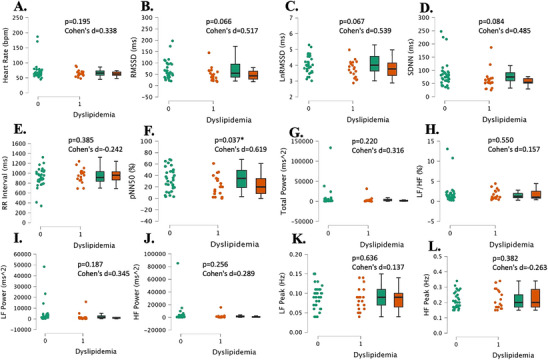
Heart rate variability measurements in young, healthy individuals with dyslipidemia (“1”, n = 17) and individuals with normal lipids (“0”, n = 26). Heart rate (Panel A), the root mean square of successive RR interval differences (Panel B), log‐transformed root mean square of successive RR interval differences (Panel C), the standard deviation of NN intervals (Panel D), time between two QRS complexes (RR Interval) (Panel E), percentage of successive RR intervals that differ by more than 50 ms (Panel F), total power (Panel G), ratio of LF to HF power (Panel H), low‐frequency power (Panel I), high‐frequency power (Panel J), low‐frequency peak (Panel K), and high‐frequency peak (Panel L). Data are individual plots and box and whisker (median and IQR). The p values and Cohen's d are for the group comparison using independent samples t‐test.
In terms of the frequency–domain HRV parameters, the low‐frequency to high‐frequency ratio (LF/HF) was not significantly different between groups (p = 0.550, Cohen's d = 0.157, Figure 6H). Total power, low‐frequency power (LF power), and high‐frequency power (HF power) were not significantly different between groups (all, p > 0.187, Cohen's d < 0.345, Figure 6G,I,J). Low‐frequency peak (LF peak) and high‐frequency peak (HF peak) were not significantly different between groups (both, p > 0.382, Cohen's d > 0.137, Figure 6K,L).
3.8. Microvascular Reactivity Using the NIRS‐VOT
There were no significant differences in Slope 1, the deoxygenation slope, between the two groups (p = 0.372, Cohen's d = 0.284, Figure 7A). There were also no significant differences in Slope 2, reperfusion slope, between groups (p = 0.139, Cohen's d = 0.434, Figure 7B).
FIGURE 7.
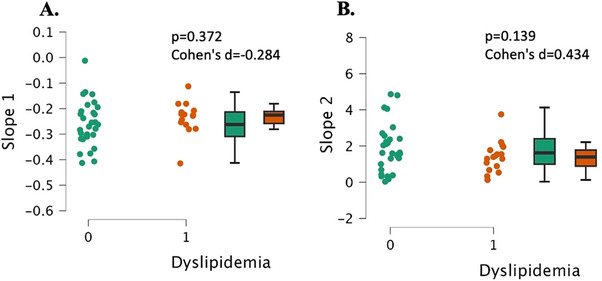
Microvascular health measurements as assessed by the NIRS‐VOT in young, healthy individuals with dyslipidemia (“1”, n = 17) and individuals with normal lipids (“0”, n = 26). Slope 1 is the deoxygenation slope representing muscle metabolism (Panel A) and slope 2 represents the reperfusion rate and microvascular reactivity (Panel B). Data are individual plots and box and whisker (median and IQR). The p values and Cohen's d are for the group comparison using independent samples t‐test.
3.9. Framingham Risk Score
The dyslipidemia group had a significantly higher 10‐year atherosclerotic cardiovascular disease (ASCVD) risk percentage than the normal lipids group (p < 0.001, Cohen's d = 1.257, Figure 8A). The dyslipidemia group also had a significantly higher vascular/heart age than the normal lipids group (p < 0.001, Cohen's d = 1.464, Figure 8B).
FIGURE 8.
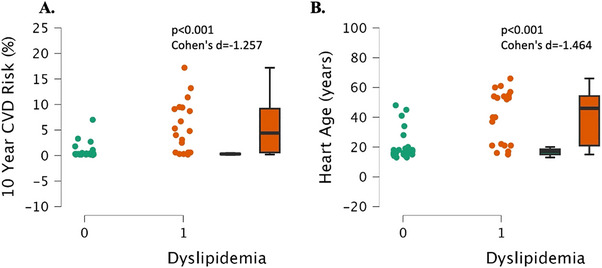
Framingham atherosclerotic cardiovascular disease risk (ASCVD) and vascular age in individuals with dyslipidemia (“1“, n = 17) and individuals with normal lipids (“0“, n = 26). Data are individual plots and box and whisker (median and IQR). The p values and Cohen's d are for the group comparison using independent samples t‐test.
4. Discussion
The purpose of this study was to investigate the effects of dyslipidemia on cardiometabolic health in relatively young healthy adults. It was hypothesized that participants with dyslipidemia would have additional positive indicators of CVD, such as high blood pressure and unfavorable body composition. There were significant differences in several measures of body composition between (hip and waist circumference, body mass, muscle mass, body water %, visceral fat, and BMI) the individuals with dyslipidemia and those with normal lipid levels. Furthermore, there were significant differences in peripheral and central blood pressures as well as vascular stiffness indicators (pulse pressure, mean arterial pressure, AP, AIx, and AIx @75) with the dyslipidemia group having less favorable metrics than the normal lipids group. There were also significant differences between groups for 10‐year ASCVD risk as well as vascular age. However, surprisingly, there were no significant differences between groups for microvascular health, HRV, or intake of macro‐ or micronutrients. These results indicate an increased CVD risk for relatively young and otherwise healthy individuals with dyslipidemia compared to individuals with healthy lipid levels, many of whom may not have met the age recommendation for routine monitoring.
4.1. Body Composition
Obesity has been strongly associated with dyslipidemia and is related to several body composition metrics such as BMI, waist circumference, and body fat %, but few studies have examined how body composition metrics may be impacted by dyslipidemia in healthy, young individuals [31]. Although, a 2004 study published by Ito et al. examined how excess accumulation of body fat is related to dyslipidemia in normal‐weight, healthy Japanese subjects [32]. This study assessed individuals who were apparently healthy and how their total cholesterol, HDL‐c, LDL‐c, and triglycerides correlated with metrics of body composition. The researchers found that dyslipidemia was present in 40% of the 1006 normal‐weight subjects and was related to excess accumulation of fat mass [32]. This aligns with the results of the present study, as 37% of the participants in this study had dyslipidemia despite being at a normal, healthy body mass with significantly higher fat mass than those with normal lipid levels. Since dyslipidemia is a risk factor for CVD, identifying unfavorable body composition metrics and how they relate to dyslipidemia at a younger age may allow individuals to take action to prevent disease development.
A more recent study published in 2023 by Weeks et al. explored associations between anthropometric and body composition metrics with lipid panel values in 199 individuals of a normative population [33]. Body fat percentage and visceral fat levels were significantly associated with lipid levels (total cholesterol, HDL, LDL, TRG) in this study [33]. Although body fat % was not significantly different between those with dyslipidemia and those with normal lipid levels in the current study, visceral fat was. Collectively, body composition tends to be negatively impacted by dyslipidemia, or perhaps the other way around, which highlights the importance of not just measuring body mass, but also body composition.
4.2. Lipids
According to data from the National Health and Nutrition Examination Survey from 2003 to 2006, dyslipidemia was found to affect 53% of US adults [34]. A study examining the prevalence of dyslipidemia of 7859 young adults aged 18–45 in the Southeastern coast of China found a prevalence of 7.1%, 15.0%, 22.9%, and 4.0% high total cholesterol, high triglycerides, low HDL‐c, and high LDL‐c, respectively [35]. However, in studies conducted in international populations dyslipidemia prevalence widely varies and it is difficult to know whether these values may translate to the US population. In the present study, 20 of the total 54 randomly sampled individuals met at least one of the criteria for dyslipidemia. Thus, although guidelines exist that suggest an age to start lipid profile monitoring, it is not overly clear the degree to which those guidelines are being followed and is an area deserved of further study.
4.3. Peripheral and Central Blood Pressures
Hypertension, or elevated blood pressure, is one of the main comorbidities associated with dyslipidemia [1]. This is well established for older individuals and those with multiple CVD risk factors; however, the relationship is less known for younger people. The current study found significantly higher peripheral blood pressures in individuals with dyslipidemia. Otsuka et al. conducted a study analyzing data from 14 215 non‐hypertensive working‐age males and had follow‐up visits with them once a year for 4 years to determine associations between hypertension development and dyslipidemia. Elevated total cholesterol, LDL‐c, and non‐HDL‐c levels were associated with an increased risk of hypertension as well as both low and high levels of HDL‐c in Japanese working‐class men [36]. Another study from Halperin et al. followed 3110 men free of hypertension for 14 years and found that dyslipidemia may lead to the subsequent development of hypertension [37]. Refer to the studies above to see each of their respective definitions and diagnostic criteria for hypertension. The results from these studies align with those of the current study as the group with dyslipidemia had significantly higher blood pressure than the normal lipids group.
Recent evidence suggests central blood pressure is better related to future cardiovascular events than brachial pressure, therefore it is important to include it in assessments [38]. The current study found individuals with dyslipidemia had significantly higher central blood pressure than those with normal lipids. There are limited studies examining the association between central blood pressure and dyslipidemia in young, healthy people. Yadav et al. examined central blood pressure and lipid parameters in a young Korean population with and without hypertension and found central blood pressure was significantly correlated to lipid parameters in both the hypertensive and non‐hypertensive participants [39]. The current study provides novel data on the impact of dyslipidemia on central blood pressure in young, otherwise healthy people in the United States, but more study is needed to determine whether central BP will be more prognostic in such relatively young otherwise healthy individuals.
4.4. Arterial Stiffness
Indicators of arterial stiffness including AP, mean arterial pressure, pulse pressure, and AIx are important predictors of CVD because they provide insight into the ease of blood flow in the body [40]. A study from 1994 published by Pannier et al. investigated the relationship between abnormalities of lipid parameters and arterial rigidity in borderline hypertensive men and found that lipid abnormalities were associated with increased stiffness of the arterial wall [41]. However, besides the previous study, there is a paucity of data examining the effects of dyslipidemia on vascular and arterial stiffness in young, healthy adults, so the current study offers a novel perspective on the potential impact of dyslipidemia on arterial stiffness, as it is an independent predictor of coronary heart disease [42]. In the current study, individuals with dyslipidemia had significantly higher parameters of arterial stiffness, indicating less ease of blood flow in the body, and likely greater CVD risk.
4.5. HRV
Several studies have demonstrated an association between dyslipidemia and decreased/depressed HRV in healthy adults [43, 44, 45]. Although this effect seems established in the literature, the current study did not find any significant differences, besides pNN50, in HRV between dyslipidemia and the normal lipid groups. One reason for this may be because possible changes in HRV are likely to be seen within an individual over time, but are harder to detect between individuals. However, the lower RMSSD, lnRMSSD, and SDNN, with moderate effect sizes, coupled with statistically lower pNN50 would suggest lower parasympathetic activity in the dyslipidemia group. As HRV is an estimate of cardiac autonomic nervous system activity [46], this might be a contributing factor to the elevated blood pressure in the dyslipidemia group [47]. Assessing individual changes over time might provide better insight into the relation between HRV and BP in those with dyslipidemia.
4.6. Microvascular Function
Previous studies have examined differences in vascular function between those with dyslipidemia versus healthy controls, mostly in clinical populations [48], but in adolescents as well [49]. However, to our knowledge, there have not been any studies addressing the impact of dyslipidemia on microvascular health, like the flow‐mediated dilation technique, as assessed by the NIRS‐VOT in relatively young otherwise healthy individuals [49]. Therefore, this paper offers the novel finding that microvascular health, indicated by Slope 2, was not different depending on whether individuals had dyslipidemia phenotype or not. Again, as far as we can tell, no study has investigated the impact of dyslipidemia on the NIRS‐VOT, and thus the slope 1 dimension of the test, indicative of muscle metabolism [27] was not different between groups and represents a novel finding. However, future studies with larger sample sizes should continue to investigate this topic to determine if this finding is consistent.
4.7. Experimental Considerations
A consideration of this study is the relatively large range of ages (18–60 years), and the statistically significant difference in ages, although neither group would meet the classification of aged (>65 years old). Interesting logistic regression using age, sex, and BMI to predict dyslipidemia status, the model was significant, but only sex and BMI, and not age, were identified as significant predictors. Future studies could examine solely younger participants (18–30 years) and determine whether the results are consistent. Furthermore, the cross‐sectional or observational nature of the study does not allow us to understand the progression of the condition to be observed. A longitudinal study on dyslipidemia in seemingly young and healthy individuals could provide more insight into the progression of risk factors for CVD. Another limitation is the self‐reported nature of the health histories, while this does represent an approach with ecological validity, medically determined health histories would be stronger.
A key strength of this study is the comprehensive set of measures that complement one another in understanding how these independent measures may coalesce directionally in understanding how dyslipidemia alters CVD risk. Critically, diet and physical activity were assessed in the current study and were not different between groups, suggesting that these critical factors are not likely playing a role in the current findings. The main strength of this study is the focus on relatively young, otherwise healthy individuals, who have not received significant attention. Understanding how dyslipidemia affects and relates to additional CVD risk factors in young people may have future clinical significance for identifying CVD risk and taking preventative measures early. Furthermore, this study includes several novel measures that have not been studied extensively in relation to dyslipidemia in relatively young, healthy individuals before. These measures include central blood pressure, indicators of vascular stiffness, and microvascular health. These independent measures are important in determining CVD risk and outcomes, so this data are valuable for spurring future research in this field, including those with familial hypercholesterolemia (FH) who were not represented in the current study. Future studies may also want to consider the potential interplay between dyslipidemia, insulin resistance, and/or fatty liver.
5. Conclusion
Dyslipidemia in relatively young and healthy individuals was associated with increased peripheral and central blood pressures, worse body composition metrics, more vascular stiffness, and a higher percentage of 10‐year ASCVD risk and vascular age than individuals with normal lipid levels, despite no significant differences in macro‐ or micronutrients.
Ethics Statement
The study was approved by the Institutional Review Board of Skidmore College (IRB#2209‐1044).
Consent
Participants provided written informed consent prior to participation.
Conflicts of Interest
The authors report no conflicts of interest
Acknowledgments
The authors would like to thank the participants for partaking in the study.
Funding: Funding was provided, in part, by Plexus Worldwide LLC (2209‐1044 to Stephen J. Ives, Justin A. DeBlauw, and Christopher J. Kotarsky). The American Heart Association (AHA) has provided support to Stephen J. Ives (https://doi.org/10.58275/AHA.24AIREA1247045.pc.gr.189804).
Data Availability Statement
Data will be made available upon reasonable request to the corresponding author.
References
- 1. Pappan N., Awosika A. O., and Rehman A., “Dyslipidemia,” 2024 Mar 4. In: StatPearls [Internet]. StatPearls Treasure: Island (FL): StatPearls Publishing LLC; (2024) Jan. PMID: 32809726. [Google Scholar]
- 2. Pirillo A., Casula M., Olmastroni E., Norata G. D., and Catapano A. L., “Global Epidemiology of Dyslipidaemias,” Nature Reviews Cardiology 18, no. 10 (2021): 689–700, 10.1038/s41569-021-00541. [DOI] [PubMed] [Google Scholar]
- 3. Smith D. G., “Epidemiology of Dyslipidemia and Economic Burden on the Healthcare System,” The American Journal of Managed Care 13, no. S3 (2007): S68–S71, https://www.ncbi.nlm.nih.gov/pubmed/17596114. [PubMed] [Google Scholar]
- 4. World Health Organization . Quantifying Selected Major Risks to Health. World Health Report 2002 (2002): 47–97. [Google Scholar]
- 5. Chou R., Dana T., Blazina I., Daeges M., Bougatsos C., and Jeanne T. L., “Screening for Dyslipidemia in Younger Adults: A Systematic Review for the U.S. Preventive Services Task Force,” Annals of Internal Medicine 165, no. 8 (2016): 560–564, 10.7326/M16-0946. [DOI] [PubMed] [Google Scholar]
- 6. Expert Panel on Detection, Evaluation, and Treatment of High Blood Cholesterol in Adults . Executive Summary of the Third Report of the National Cholesterol Education Program (NCEP) Expert Panel on Detection, Evaluation, and Treatment of High Blood Cholesterol in Adults (Adult Treatment Panel III). Jama 285, no. 19 (2001): 2486–2497, 10.1001/jama.285.19.2486. [DOI] [PubMed] [Google Scholar]
- 7. Khoja A., Andraweera P. H., Lassi Z. S., et al., “Modifiable and Non‐Modifiable Risk Factors for Premature Coronary Heart Disease (PCHD): Systematic Review and Meta‐Analysis,” Heart, Lung and Circulation 33, no. 3 (2024): 265–280, 10.1016/j.hlc.2023.12.012. [DOI] [PubMed] [Google Scholar]
- 8. Yu Chen H., Dina C., Small A. M., et al., “Dyslipidemia, Inflammation, Calcification, and Adiposity in Aortic Stenosis: A Genome‐Wide Study,” European Heart Journal 44, no. 21 (2023): 1927–1939, 10.1093/eurheartj/ehad142. [DOI] [PMC free article] [PubMed] [Google Scholar]
- 9. Zhao X., Wang D., and Qin L., “Lipid Profile and Prognosis in Patients With Coronary Heart Disease: A Meta‐Analysis of Prospective Cohort Studies,” BMC Cardiovascular Disorders 21, no. 1 (2021): 69, 10.1186/s12872-020-01835-0. [DOI] [PMC free article] [PubMed] [Google Scholar]
- 10. Jin X., Chen H., Shi H., et al., “Lipid Levels and the Risk of Hemorrhagic Stroke: A Dose–Response Meta‐Analysis,” Nutrition, Metabolism, and Cardiovascular Diseases 31, no. 1 (2021): 23–35, 10.1016/j.numecd.2020.10.014. [DOI] [PubMed] [Google Scholar]
- 11. Mohr A. E., Pugh J., O'Sullivan O., et al., “Best Practices for Probiotic Research in Athletic and Physically Active Populations: Guidance for Future Randomized Controlled Trials,” Frontiers in Nutrition 9 (2022): 809983, 10.3389/fnut.2022.809983. [DOI] [PMC free article] [PubMed] [Google Scholar]
- 12. Costa R. L., Moreira J., Lorenzo A., and Lamas C. C., “Infectious Complications Following Probiotic Ingestion: A Potentially Underestimated Problem? A Systematic Review of Reports and Case Series,” BMC Complementary and Alternative Medicine 18, no. 1 (2018): 329–333, 10.1186/s12906-018-2394-3. [DOI] [PMC free article] [PubMed] [Google Scholar]
- 13. Hagströmer M., Oja P., and Sjöström M., “The International Physical Activity Questionnaire (IPAQ): A Study of Concurrent and Construct Validity,” Public Health Nutrition 9, no. 6 (2006): 755–762, 10.1079/phn2005898. [DOI] [PubMed] [Google Scholar]
- 14. Subar A. F., Kirkpatrick S. I., Mittl B., et al., “The Automated Self‐Administered 24‐Hour Dietary Recall (ASA24): A Resource for Researchers, Clinicians, and Educators From the National Cancer Institute,” Journal of the Academy of Nutrition and Dietetics 112, no. 8 (2012): 1134–1137, 10.1016/j.jand.2012.04.016. [DOI] [PMC free article] [PubMed] [Google Scholar]
- 15. Thompson F. E., Dixit‐Joshi S., Potischman N., et al., “Comparison of Interviewer‐Administered and Automated Self‐Administered 24‐Hour Dietary Recalls in 3 Diverse Integrated Health Systems,” American Journal of Epidemiology 181, no. 12 (2015): 970–978, 10.1093/aje/kwu467. [DOI] [PMC free article] [PubMed] [Google Scholar]
- 16. Kirkpatrick S. I., Subar A. F., Douglass D., et al., “Performance of the Automated Self‐Administered 24‐Hour Recall Relative to a Measure of True Intakes and to an Interviewer‐Administered 24‐h Recall,” American Journal of Clinical Nutrition 100, no. 1 (2014): 233–240, 10.3945/ajcn.114.083238. [DOI] [PMC free article] [PubMed] [Google Scholar]
- 17. Brown R. E., Randhawa A. K., Canning K. L., et al., “Waist Circumference at Five Common Measurement Sites in Normal Weight and Overweight Adults: Which Site Is Most Optimal?,” Clinical Obesity 8, no. 1 (2018): 21–29, 10.1111/cob.12231. [DOI] [PubMed] [Google Scholar]
- 18. Vasold K. L., Parks A. C., Phelan D. M. L., Pontifex M. B., and Pivarnik J. M., “Reliability and Validity of Commercially Available Low‐Cost Bioelectrical Impedance Analysis,” International Journal of Sport Nutrition and Exercise Metabolism 29, no. 4 (2019): 406–410, 10.1123/ijsnem.2018-0283. [DOI] [PubMed] [Google Scholar]
- 19. Shoji T., Nakagomi A., Okada S., Ohno Y., and Kobayashi Y., “Invasive Validation of a Novel Brachial Cuff‐Based Oscillometric Device (SphygmoCor XCEL) for Measuring Central Blood Pressure,” Journal of Hypertension 35, no. 1 (2017): 69–75, 10.1097/HJH.0000000000001135. [DOI] [PubMed] [Google Scholar]
- 20. Heart Rate Variability: Standards of Measurement, Physiological Interpretation and Clinical Use. Task Force of the European Society of Cardiology and the North American Society of Pacing and Electrophysiology. Circulation 93, no. 5 (1996): 1043–1065. [PubMed] [Google Scholar]
- 21. Schroeder E. B., Liao D., Chambless L. E., Prineas R. J., Evans G. W., and Heiss G., “Hypertension, Blood Pressure, and Heart Rate Variability: The Atherosclerosis Risk in Communities (ARIC) Study,” Hypertension 42, no. 6 (2003): 1106–1111, 10.1161/01.HYP.0000100444.71069.73. [DOI] [PubMed] [Google Scholar]
- 22. Egan‐Shuttler J. D., Edmonds R., and Ives S. J., “The Efficacy of Heart Rate Variability in Tracking Travel and Training Stress in Youth Female Rowers: A Preliminary Study,” Journal of Strength and Conditioning Research 34, no. 11 (2020): 3293–3300, 10.1519/JSC.0000000000002499. [DOI] [PubMed] [Google Scholar]
- 23. Zaleski K. S., Gyampo A. O., Lora B., et al., “Sex Differences in Estimates of Cardiac Autonomic Function Using Heart Rate Variability: Effects of Dietary Capsaicin,” European Journal of Applied Physiology 123, no. 5 (2023): 1041–1050, 10.1007/s00421-023-05136-0. [DOI] [PubMed] [Google Scholar]
- 24. Matias A. A., Albin I. F., Glickman L., et al., “Impact of High Intensity Interval Exercise With and Without Heat Stress on Cardiovascular and Aerobic Performance: A Pilot Study,” BMC Sports Science, Medicine, and Rehabilitation 15, no. 1 (2023): 83, 10.1186/s13102-023-00682-8. [DOI] [PMC free article] [PubMed] [Google Scholar]
- 25. Keller J. L., Traylor M. K., Gray S. M., Hill E. C., and Weir J. P., “Sex Differences in NIRS‐Derived Values of Reactive Hyperemia Persist After Experimentally Controlling for the Ischemic Vasodilatory Stimulus,” Journal of Applied Physiology (1985) 135, no. 1 (2023): 3–14, 10.1152/japplphysiol.00174.2023. [DOI] [PubMed] [Google Scholar]
- 26. Zaleski K., Matias A., Gyampo A., et al., “Does Sex Influence Near‐Infrared Spectroscopy‐Derived Indicators of Microvascular Reactivity and the Response to Acute Dietary Capsaicin,” Microvascular Research 145 (2023): 104436, 10.1016/j.mvr.2022.104436. [DOI] [PubMed] [Google Scholar]
- 27. Greaves L. M., Zaleski K. S., Matias A. A., et al., “Limb, Sex, But Not Acute Dietary Capsaicin, Modulate the Near‐Infrared Spectroscopy‐Vascular Occlusion Test Estimate of Muscle Metabolism,” Physiological Reports 12, no. 6 (2024): e15988, 10.14814/phy2.15988. [DOI] [PMC free article] [PubMed] [Google Scholar]
- 28. Crum E. M., O'Connor W. J., Van Loo L., Valckx M., and Stannard S. R., “Validity and Reliability of the Moxy Oxygen Monitor During Incremental Cycling Exercise,” European Journal of Sport Science 17, no. 8 (2017): 1037–1043, 10.1080/17461391.2017.1330899. [DOI] [PubMed] [Google Scholar]
- 29. Carey M., Markham C., Gaffney P., Boran C., and Maher V., “Validation of a Point of Care Lipid Analyser Using a Hospital Based Reference Laboratory,” Irish Journal of Medical Science 175, no. 4 (2006): 30–35, 10.1007/BF03167964. [DOI] [PubMed] [Google Scholar]
- 30. D'Agostino R. B. S., Vasan R. S., Pencina M. J., et al., “General Cardiovascular Risk Profile for Use in Primary Care: The Framingham Heart study,” Circulation 117, no. 6 (2008): 743–753, 10.1161/CIRCULATIONAHA.107.699579. [DOI] [PubMed] [Google Scholar]
- 31. Yudin R., Aman A. M., Rasyid H., et al., “Risk of Dyslipidemia in Obese Young Adult Subjects as Measured by Various Obesity Indices,” Journal of Endocrinology and Metabolism 12, no. 3 (2022): 102–106, 10.14740/jem819. [DOI] [Google Scholar]
- 32. Ito H., Nakasuga K., Ohshima A., et al., “Excess Accumulation of Body Fat Is Related to Dyslipidemia in Normal‐Weight Subjects,” International Journal of Obesity 28, no. 2 (2004): 242–247, 10.1038/sj.ijo.0802528. [DOI] [PubMed] [Google Scholar]
- 33. Weeks M., Delgado A. D., Wood J., et al., “Relationships Between Body Composition, Anthropometrics, and Standard Lipid Panels in a Normative Population,” Frontiers in Cardiovascular Medicine 10 (2023): 1280179, 10.3389/fcvm.2023.1280179. [DOI] [PMC free article] [PubMed] [Google Scholar]
- 34. Tóth P. P., Potter D., and Ming E. E., “Prevalence of Lipid Abnormalities in the United States: The National Health and Nutrition Examination Survey 2003–2006,” Journal of Clinical Lipidology 6, no. 4 (2012): 325–330, 10.1016/j.jacl.2012.05.002. [DOI] [PubMed] [Google Scholar]
- 35. Zhang H., Kwapong W. R., Shao M., et al., “Predictors of the Prevalence of Dyslipidemia and Influencing Factors for Young Health Examination Cohort: A Cross‐Sectional Survey,” Frontiers in Public Health 8 (2020): 400, 10.3389/fpubh.2020.00400. [DOI] [PMC free article] [PubMed] [Google Scholar]
- 36. Otsuka T., Takada H., Nishiyama Y., et al., “Dyslipidemia and the Risk of Developing Hypertension in a Working‐Age Male Population,” Journal of the American Heart Association 5, no. 3 (2016): e003053, 10.1161/JAHA.115.003053. [DOI] [PMC free article] [PubMed] [Google Scholar]
- 37. Halperin R. O., Sesso H. D., Ma J., Buring J. E., Stampfer M. J., and Gaziano J. M., “Dyslipidemia and the Risk of Incident Hypertension in Men,” Hypertension 47, no. 1 (2006): 45–50, 10.1161/01.HYP.0000196306.42418.0e. [DOI] [PubMed] [Google Scholar]
- 38. McEniery C. M., Cockcroft J. R., Roman M. J., Franklin S. S., and Wilkinson I. B., “Central Blood Pressure: Current Evidence and Clinical Importance,” European Heart Journal 35, no. 26 (2014): 1719–1725, 10.1093/eurheartj/eht565. [DOI] [PMC free article] [PubMed] [Google Scholar]
- 39. Yadav D., Kim S., Kim J., and Cho K., “Correlation Among Lipid Parameters, Pulse Wave Velocity and Central Blood Pressure in Young Korean Population,” Clinical and Experimental Hypertension 41, no. 1 (2019): 20–27, 10.1080/10641963.2018.1441856. [DOI] [PubMed] [Google Scholar]
- 40. Boutouyrie P. and Bruno R., “The Clinical Significance and Application of Vascular Stiffness Measurements,” American Journal of Hypertension 32, no. 1 (2019): 4–11, 10.1093/ajh/hpy145. [DOI] [PubMed] [Google Scholar]
- 41. Pannier B. M., Cambillau M. S., Vellaud V., Atger V., Moatti N., and Safar M. E., “Abnormalities of Lipid Metabolism and Arterial Rigidity in Young Subjects With Borderline Hypertension,” Clinical and Investigative Medicine 17, no. 1 (1994): 42–51. [PubMed] [Google Scholar]
- 42. Bonarjee V. V. S., “Arterial Stiffness: A Prognostic Marker in Coronary Heart Disease. Available Methods and Clinical Application,” Frontiers in Cardiovascular Medicine 5 (2018): 64, 10.3389/fcvm.2018.00064. [DOI] [PMC free article] [PubMed] [Google Scholar]
- 43. Thayer J. F. and Fischer J. E., “Heart Rate Variability, Overnight Urinary Norepinephrine, and Plasma Cholesterol in Apparently Healthy Human Adults,” International Journal of Cardiology 162, no. 3 (2013): 240–244, 10.1016/j.ijcard.2011.05.058. [DOI] [PubMed] [Google Scholar]
- 44. Danev S., Nikolova R., Kerekovska M., and Svetoslavov S., “Relationship Between Heart Rate Variability and Hypercholesterolaemia,” Central European Journal of Public Health 5, no. 3 (1997): 143–146. [PubMed] [Google Scholar]
- 45. Doncheva N. I., Nikolova R. I., and Danev S. G., “Overweight, Dyslipoproteinemia, and Heart Rate Variability Measures,” Folia Medica 45, no. 1 (2003): 8–12. [PubMed] [Google Scholar]
- 46. Shaffer F. and Ginsberg J. P., “An Overview of Heart Rate Variability Metrics and Norms,” Frontiers in Public Health 5 (2017): 258, 10.3389/fpubh.2017.00258. [DOI] [PMC free article] [PubMed] [Google Scholar]
- 47. Singh J. P., Larson M. G., Tsuji H., Evans J. C., O'Donnell C. J., and Levy D., “Reduced Heart Rate Variability and New‐Onset Hypertension: Insights Into Pathogenesis of Hypertension: The Framingham Heart Study,” Hypertension 32, no. 2 (1998): 293–297, 10.1161/01.hyp.32.2.293. [DOI] [PubMed] [Google Scholar]
- 48. Carrizzo A., Puca A., Damato A., et al., “Resveratrol Improves Vascular Function in Patients With Hypertension and Dyslipidemia by Modulating NO Metabolism,” Hypertension 62, no. 2 (2013): 359–366, 10.1161/HYPERTENSIONAHA.111.01009. [DOI] [PubMed] [Google Scholar]
- 49. Kosmeri C., Milionis H., Vlahos A. P., et al., “The Impact of Dyslipidemia on Early Markers of Endothelial and Renal Dysfunction in Children,” Journal of Clinical Lipidology 15, no. 2 (2021): 292–300, 10.1016/j.jacl.2020.12.003. [DOI] [PubMed] [Google Scholar]
Associated Data
This section collects any data citations, data availability statements, or supplementary materials included in this article.
Data Availability Statement
Data will be made available upon reasonable request to the corresponding author.