

Abstract
Background
Patients with vertebral compression fractures may experience unpredictable residual pain following vertebral augmentation. Clinical prediction models have shown potential for early prevention and intervention of such residual pain. However, studies focusing on the quality and accuracy of these prediction models are lacking. Therefore, we systematically reviewed and critically evaluated prediction models for residual pain following vertebral augmentation.
Methods
We systematically searched eight databases (PubMed, Embase, Web of Science, CNKI, WanFang, VIP, and SinoMed) for studies that developed and/or validated risk prediction models for residual pain after vertebral augmentation. The limitations of existing models were critically assessed using the PROBAST tool. We performed a descriptive analysis of the models' characteristics and predictors. Extracted C-statistics were combined using a weighted approach based on the Restricted Maximum Likelihood (REML) method to represent the models' average performance. All statistical analyses were performed using R 4.3.1 and STATA 17 software.
Results
Fifteen models were evaluated, involving 4802 patients with vertebral compression fractures post-vertebral augmentation. The overall pooled C-statistic was 0.87, with a 95% CI of 0.83 to 0.89 and a prediction interval ranging from 0.72 to 0.94. The models included 35 different predictors, with posterior fascia injury (PFI), bone mineral density (BMD), and intravertebral vacuum cleft (IVC) being the most common. Most models were rated high risk due to concerns about population selection and modeling methodology, yet their clinical applicability remains promising.
Conclusion
The development and validation of current models exhibit a certain risk of bias, and our study highlights these existing flaws and limitations. Although these models demonstrate satisfactory predictive performance and clinical applicability, further external validation is needed to confirm their accuracy in clinical practice. Clinicians can utilize these models alongside relevant risk factors to predict and prevent residual pain after vertebral augmentation, or to formulate personalized treatment plans.
Supplementary Information
The online version contains supplementary material available at 10.1186/s12891-025-08338-z.
Keywords: Residual pain, Prediction model, Vertebral augmentation, Vertebral compression fractures, Systematic review
Introduction
Vertebral compression fractures (VCFs), typically caused by osteoporosis, are the most common complication in osteoporotic patients [1–3]. These fractures can cause acute pain and even disability, closely associated with increased mortality risk in the elderly [4, 5]. Approximately 700,000 cases of VCFs are reported annually in the United States [6], and this number is expected to rise with the aging population. Similarly, recent clinical epidemiological data [7, 8] from China shows that VCFs are particularly prevalent among elderly patients. The incidence of compression fractures in individuals over the age of 60 is 24.7%, and this rate increases with age. The most commonly affected segments are T11, T12, and L1, which are the primary sites for vertebral compression fractures [7, 9]. Due to the limited benefits of conservative treatments, vertebral augmentation is recommended as the optimal treatment for patients with VCFs [10, 11]. Unfortunately, some patients continue to experience intercostal and back pain despite undergoing vertebral augmentation [12, 13]. These residual pains necessitate extensive postoperative rehabilitation, significantly affecting patients' quality of life and increasing economic burdens. However, these residual pains can be somewhat prevented if high-risk individuals are accurately identified and timely interventions are applied.
Prediction models quantify the risk of outcomes by combining multiple predictive variables [14, 15]. These models are essential tools in personalized diagnosis and treatment, particularly in preventive medicine. For post-vertebral augmentation patients, early identification of high-risk individuals for residual pain could potentially avoid long-term pain management and rehabilitation. This is especially crucial for elderly patients with a high incidence of fragility fractures. Although current risk prediction models have identified several highly correlated predictive factors, such as bone mineral density (BMD), paraspinal muscle injury, and bone cement distribution, their clinical applicability remains limited due to variations in selected risk factors across different models. Furthermore, existing prediction models often lack consideration of population heterogeneity, such as pain type and pain duration, which can lead to prediction biases. Additionally, while some models show good discrimination with concordance (C) statistics exceeding 0.8, they often lack external validation and clinical applicability analysis, increasing uncertainty and bias. Therefore, rigorous evaluation of these models regarding development methodology, predictive performance, and bias risk is necessary to ensure their effectiveness in practical applications.
To our knowledge, no studies have critically evaluated and systematically reviewed these models, leaving their overall performance unclear. Thus, this study aims to conduct both quantitative and qualitative analyses of prediction models for residual pain after vertebral augmentation. By comprehensively assessing the models' quality, applicability, and accuracy, this study seeks to identify high-quality risk prediction models, providing references for clinical practice and future research.
Methods
Study design
This systematic review adheres to the Preferred Reporting Items for Systematic Review and Meta-Analysis (PRISMA 2020) statement [16] (Additional file 1) and follows the framework provided by Debray et al. [17]. The study protocol was registered in the International Prospective Register of Systematic Reviews (PROSPERO) on April 29, 2024 (CRD42024537369).
Search strategy
We conducted a comprehensive search using a pre-defined strategy across eight databases: PubMed, Web of Science, Cochrane Library, EMBASE, China National Knowledge Infrastructure (CNKI), Wanfang, VIP, and the China Biomedical Literature Service System (SinoMed). The search period covered from the inception of each database until May 1, 2024. We employed a combination of subject headings and free-text terms, including "fractures, compression," "compression fractures," "residual pain", "pain", "back pain", "residual back pain", "postoperative residual", "intercostal", "intercostal nerve", "intercostal pain", "prediction model", "risk assessment", "risk prediction", "prediction tool", "predictive risk model", "ROC Curve", "Discrimination", "C-statistic", "c statistic", "Area under the curve", "AUC", "Calibration" and "Decision Curve Analysis". The search strategy was tailored for each database, with details provided in Additional file 2. To broaden the search scope, we did not impose any restrictions on the surgical methods; additionally, the reference lists of included studies were reviewed to identify any additional relevant articles.
Eligibility criteria
We included studies that described the development and/or validation of prediction models for estimating the risk of residual pain in patients with vertebral compression fractures after vertebral augmentation. Studies of any design were considered, with no restrictions on publication year. The target population was defined as patients at high risk of residual pain following vertebral augmentation. Patients with tumors, infections, or significant cardiovascular diseases were excluded; residual pain was defined as pain exacerbation or poor relief postoperatively.
Published original studies fulfilling the following criteria were included: (1) described the development and/or validation of risk prediction models for residual pain following vertebral augmentation in vertebral compression fracture patients, using modeling methods such as logistic regression, random forest, neural networks, or decision trees; (2) compression fractures caused by tumors, infections, tuberculosis, or other prior spinal surgeries, but including individuals with osteoporosis due to metabolic diseases such as diabetes; (3) included prospective or retrospective studies, including case–control studies and cohort studies; (4) reported the predictive ability of the models, including Area Under the Curve (AUC) or C-statistics; (5) published in English or Chinese. Studies were excluded if they were animal experiments, reviews, duplicates, focused on non-vertebral pain causes, or unavailable in full text.
Study selection
After removing duplicate records using NoteExpress software, two reviewers (Xue Zhou and MH) independently screened the titles, abstracts, and full texts of the studies. Disagreements between the two reviewers were resolved by a third reviewer (Xianshuai Zhang). To ensure a comprehensive search, the reference lists of included studies were also reviewed.
Data extraction and quality assessment
Two reviewers (Xue Zhou and JY) extracted data from the included studies using a pre-specified standardized form. In cases of discrepancies, a senior reviewer (ZL) cross-checked the data. The extracted data on study characteristics included: first author, publication year, region, timeline, validation population, sample size, study design (prospective or retrospective), type of surgery, outcome (type of pain), pain assessment tool, diagnostic criteria, and follow-up period.
The Newcastle–Ottawa Scale (NOS) [18] was used to assess the risk of bias in cohort studies and case–control studies, with scores of 7 or higher indicating high-quality studies, scores between 4 and 6 reflecting moderate quality, and scores below 3 classified as low quality. The assessments were conducted independently by two reviewers (MH and Xue Zhou), and any discrepancies were resolved by ZL.
The predictive models were classified based on the TRIPOD statement [19]. We used the CHARMS checklist [20] for critical appraisal and data extraction for systematic reviews of prediction modeling studies. The Prediction Model Risk of Bias Assessment Tool (PROBAST) [14] was utilized to evaluate the quality of risk models. The PROBAST consists of 4 domains and 20 signaling questions and can evaluate prognosis prediction models regardless of the outcome or modeling method. Following the identification of the systematic review question, we assessed the risk of bias and applicability of the models based on their classification. Each study was assigned an overall risk of bias judgment (low, high, or unclear). The assessments were independently performed by two reviewers (MH and JY), with discrepancies resolved by ZL.
Statistical analysis
We evaluated the included models using the PROBAST assessment. Descriptive analysis summarized the risk prediction models, focusing on differences in predictive factors, model performance, and participant characteristics. For models reporting C-statistics and 95% prediction intervals, the standard error (SE) of the logit C-statistic was derived from the confidence intervals (CIs) [17]. Following Debray et al.'s recommendations [21], we logit-transformed the C-statistics and SEs before pooling. Using a random-effects model with the Restricted Maximum Likelihood (REML) method, we combined the C-statistics to present the effect size and 95% CI, generating a forest plot [17]. The pooled effect size and CI represented the average performance of the models. C-statistics range from 0 to 1, with values > 0.75 indicating good discrimination and < 0.5 indicating poor discrimination. All statistical analyses were performed using R version 4.3.1 and STATA version 17.
Results
Study selection
The initial database search yielded 733 records. After removing duplicates, 630 records remained. Screening of titles and abstracts led to the exclusion of 612 records, leaving 18 for full-text review. After further evaluation, 3 studies were excluded, resulting in 15 studies [22–36] included in the systematic review (Fig. 1).
Fig. 1.

Flowchart of study selection
Characteristics of the included studies
This systematic review included risk prediction models from 12 cities across China (Zhangjiagang, Yinchuan, Urumqi, Tianjin, Suzhou, Shangrao, Shanghai, Nanjing, Langzhong, Jilin, Dalian, and Changzhou), involving a total of 4802 vertebral compression fracture patients treated with vertebral augmentation across 14 hospitals. Data collection spanned from January 2015 to March 2023.
Two studies [26, 33] used a prospective cohort design, while the other 13 studies [22–25, 27–32, 34–36] were retrospective. Three studies [22, 29, 36] included both percutaneous vertebroplasty (PVP) and percutaneous kyphoplasty (PKP) patients; seven studies [23, 25, 26, 31–34] focused on PKP, and five studies [24, 27, 28, 30, 35] on PVP. Eleven studies [22–27, 29, 33–36] used back pain as the predictive outcome, one study [32] focused on intercostal neuralgia, and three studies assessed residual pain associated with vertebral augmentation, all using the Visual Analogue Scale (VAS). Most defined residual pain as a VAS score of 4 + at follow-ups, while two [31, 35] used the degree of pain relief as a reference. We found that five studies [23, 26, 28, 29, 34] focused on long-term pain (> 6 months), with the longest follow-up at 12 months; others examined short-term pain (< 3 months). Although all studies used the VAS for pain measurement, providing a common framework for comparison, there were differences in the definitions of residual pain and follow-up periods.
According to TRIPOD Levels, five studies [24, 25, 32–34] developed and validated models using a random split sample method, one study [23] used a non-random split sample method, and four studies [27, 30, 35, 36] developed models without validation (Table 1).
Table 1.
General characteristics of the included studies
| Study | Region | Validation Population |
Timeline | No. of Participants | Study Design | Surgery Type | Outcome Considered |
Pain assessment tool | Diagnostic criteria | Follow-up Period | TRIPOD Levelsa |
|---|---|---|---|---|---|---|---|---|---|---|---|
| Li 2021 [22] | Yinchuan, China | Peoples Hospital of Ningxia Hui Autonomous Region | January 2017 to April 2019 (Training and validation set) | 268 | Retrospective study | PVP/PKP | Residual back pain | Visual Analogue Scale |
VAS score ≥ 4 at both 3 and 30 days following surgery: residual pain; VAS score < 4: favorable prognosis |
30 days | 1b |
| Lin 2023 [23] | Dalian, China | Affiliated Zhongshan Hospital of Dalian University |
July 2019 to July 2020 (Training set) January 2021 to October 2021 (Validation set) |
407 | Retrospective study | PKP | Residual low back pain | Visual Analogue Scale |
VAS score ≥ 4 at both 1 and 30 days following surgery: residual pain; VAS score < 4: favorable prognosis |
6 months | 2b |
| Liu 2022 [24] | Jilin, China | Affiliated Hospital of Beihua University | January 1st to December 30th, 2019 | 296 | Retrospective study | PVP | Short‑term recurrent back pain | Visual Analogue Scale |
VAS score ≥ 4 within 48 h after surgery: short‑term recurrent pain; VAS score < 4: Good prognosis |
2 days | 2a |
| Tu 2024 [25] | Suzhou, China | Second Affiliated Hospital of Soochow University | July 2021 to December 2022 (Training and validation set) | 267 | Retrospective study | PKP | Residual low back pain | Visual Analogue Scale |
VAS score ≥ 4 on the first day following surgery: residual pain; VAS score < 4: favorable prognosis |
3 months | 2a |
| Yu 2023 [26] | Tianjin, China | Tianjin Union Medical Centre |
May 2019 to June 2021 (Training and validation set) |
236 | Prospective study | PKP | Residual low back pain | Visual Analogue Scale |
VAS score ≥ 3.5 at 12 months following surgery: residual pain; VAS score < 3.5: favorable prognosis |
12 months | 1b |
| Cheng 2023 [27] | Nanjing, China | Nanjing Lishui District People's Hospital | September 2020 to September 2022 | 302 | Retrospective study | PVP | Residual back pain | Visual Analogue Scale |
VAS score ≥ 4 at 1 month following surgery: residual pain; VAS score < 4: favorable prognosis |
30 days | 1a |
| Liao 2023 [28] | Shangrao, China | Guangxin District People's Hospital | January 2019 to January 2022 | 114 | Retrospective study | PVP | Residual pain | Visual Analogue Scale |
VAS scores ≥ 4 at 1 week, 4 weeks, 3 months, and 6 months following surgery: residual pain; VAS score < 4: favorable prognosis |
6 months | 1b |
| Lin 2022 [29] | Dalian, China | Affiliated Zhongshan Hospital Dalian University | December 2016 to February 2021 | 377 | Retrospective study | PVP/PKP | Residual back pain | Visual Analogue Scale |
VAS score ≥ 4 on the first day following surgery: residual pain; VAS score < 4: favorable prognosis |
6 months | 1b |
| Qiu 2023 [30] | Nanjing, China | First Affiliated Hospital of Nanjing Medical University | July 2019 to June 2022 | 136 | Retrospective study | PVP | Residual pain | Visual Analogue Scale |
VAS score > 3 on the first day following surgery: residual pain; VAS score ≤ 3: favorable prognosis |
1 day | 1a |
| Tian 2023 [31] | Langzhong, China | Langzhong People's Hospital | January 2020 to April 2022 | 228 | Retrospective study | PKP | Residual pain | Visual Analogue Scale |
Pain relief < 70% was defined as residual pain; > 70% was defined as favorable prognosis |
30 days | 1b |
| Wu 2023 [32] | Zhangjiagang, China | Zhangjiagang Traditional Chinese Medicine Hospital | March 2018 to March 2023 | 342 | Retrospective study | PKP | Residual intercostal pain | Visual Analogue Scale |
VAS score ≥ 4 on the first day following surgery: residual pain; VAS score < 4: favorable prognosis |
1 day | 2a |
| Ge 2022 [33] | Shanghai, China | Ruijin Hospital, Shanghai Jiao Tong University School of Medicine | January 2015 to January 2022 (Training and validation set) | 731 | Prospective study | PKP | Residual back pain | Visual Analogue Scale |
VAS score ≥ 4 at both 3 and 30 days following surgery: residual pain; VAS score < 4: favorable prognosis |
30 days | 2a |
| Deng 2023 [34] | Urumqi, China | Affiliated Hospital of Xinjiang Medical University | January 2017 to December 2021 (Training and validation set) | 792 | Retrospective study | PKP | Residual chronic low back pain | Visual Analogue Scale |
VAS score at 6 months following surgery > 4: residual pain; VAS score ≤ 4: favorable prognosis |
6 months | 2a |
| Xu 2024 [35] | Changzhou, China | Wujin Traditional Chinese Medicine Hospital | July 2019 to June 2022 | 136 | Retrospective study | PVP | Inadequate back pain relief | Visual Analogue Scale |
Inadequate pain relief was defined as a VAS score difference < 4 between one day before surgery and one month after surgery; Pain relief was defined as satisfactory if the difference in VAS scores between one day before surgery and one month after surgery was ≥ 4 |
30 days | 1a |
| Zhou 2024 [36] | Nanjing, China | Nanjing Tongren Hospital Affiliated to Southeast University School of Medicine | September 2019 to September 2022 | 170 | Retrospective study | PVP/PKP | Residual low back pain | Visual Analogue Scale |
VAS scores ≥ 4 at 1 month following surgery: residual pain; VAS score < 4: favorable prognosis |
30 days | 1a |
aTransparent Reporting of a multivariable prediction model for Individual Prognosis Or Diagnosis (TRIPOD) levels: 1a = development only; 1b = development and validation using resampling; 2a = random split sample development and validation; 2b = non-random split sample development and validation; 3 = development and validation using separate data; 4 = validation only
PVP Percutaneous Vertebroplasty, PKP Percutaneous Kyphoplasty, VAS Visual analogue scale
Characteristics of risk prediction models
All included risk prediction models were developed using logistic regression methods (Table 2). In the model cohorts, most studies exhibited a gender bias (more females than males), with the mean age of most populations being over 60 years. Eleven studies [22–26, 28, 29, 31–34] employed internal validation methods, including random split and bootstrap samples. Only one study [23] underwent external validation. The training set sizes ranged from 136 to 556 participants, while the validation set sizes ranged from 81 to 236 participants. In the retrospective cohorts, the incidence of residual pain was above 10%, with the highest being 42.6% (58/136). Fourteen studies [22–35] provided nomograms, and one study [36] offered a formula for risk prediction.
Table 2.
Development and performance characteristics of prediction models
| Study | Predictive factors | Development methodology |
Gender | Age (Years) | Sample size | Validation Methodology |
Model presentation | |
|---|---|---|---|---|---|---|---|---|
| Modeling (Positive Events) |
Validation (Positive Events) |
|||||||
| Li 2021 [22] | 4 factors: Intravertebral vacuum cleft, posterior fascia oedema, paraspinal muscle degeneration, and bone cement distribution | Logistic regression |
Male: 53 patients Female: 215 patients |
< 60: 14 patients 60∼70 years: 100 patients 70∼80 years: 108 patients > 80 years: 46 patients |
268 (37) | – | Internal validation with 1000 bootstrap samples | Nomogram |
| Lin 2023 [23] |
4 factors: Preoperative bone mineral density, thoracolumbar fascia injury, facet joint injury, and incomplete cementing of the fracture line |
Logistic regression |
Male: 69 patients Female: 338 patients |
Training set: 74.00 (Mean) Validation set: 74.50 (Mean) |
281 (47) | 162 (22) |
Internal validation with 1000 bootstrap samples; External validation |
Nomogram |
| Liu 2022 [24] | 3 factors: fracture segment, the number of surgical vertebrae, and smoking | Logistic regression |
Male: 49 patients Female: 247 patients |
208 (64) | 88 (19) |
Internal validation (Random split Validation: 7:3) |
Nomogram | |
| Tu 2024 [25] | 5 factors: Posterior fascia oedema, intravertebral vacuum cleft, time from fracture to surgery, sarcopenia, and interspinous ligament degeneration | Logistic regression |
Male: 46 patients Female: 221 patients |
Training set: 71.5 (Mean) Validation set: 71.0 (Mean) |
186 | 81 |
Internal validation (Random split Validation: 7:3) |
Nomogram |
| Yu 2023 [26] | 5 factors: Depression, intravertebral vacuum cleft, no anti-osteoporosis treatment, cement volume, and bone cement distribution | Logistic regression |
Male: 43 patients Female: 193 patients |
Training set: ≤ 75: 157 patients > 75: 49 patients Validation set: ≤ 75: 20 patients > 75: 10 patients |
236 (30) | – | Internal validation with 1000 bootstrap samples | Nomogram |
| Cheng 2023 [27] | 4 factors: Intravertebral vacuum cleft, posterior fascia oedema, paravertebral muscle degeneration, and bone cement distribution | Logistic regression |
Male: 178 patients Female: 124 patients |
No residual pain group: 68.5 ± 6.3 (Mean ± SD) Residual pain group: 70.2 ± 7.4 (Mean ± SD) |
302 (43) | – | – | Nomogram |
| Liao 2023 [28] | 4 factors: Intravertebral vacuum cleft, thoracolumbar fascia injury, bone mineral density, and incomplete cementing of the fracture line | Logistic regression |
Male: 48 patients Female: 66 patients |
No residual pain group: 64.95 ± 4.27 (Mean ± SD) Residual pain group: 65.76 ± 4.32 (Mean ± SD) |
114 (41) | – | Internal validation with bootstrap samples | Nomogram |
| Lin 2022 [29] | 5 factors: Thoracolumbar fascia injury, bone mineral density, minor joint injury, lumbar disc herniation, and incomplete cementing of the fracture line | Logistic regression |
Male: 52 patients Female: 325 patients |
No residual pain group: 75.00 (Mean) Residual pain group: 74.00 (Mean) |
377 (64) | – | Internal validation with 200 bootstrap samples | Nomogram |
| Qiu 2023 [30] | 8 factors: Age, bone mineral density, educational level, smoking, psychological disorders, ASA grading, amount of bone cement injected, and bone cement leakage | Logistic regression |
Male: 62 patients Female: 74 patients |
No residual pain group: 63.85 ± 1.71 (Mean ± SD) Residual pain group: 66.17 ± 2.56 (Mean ± SD) |
136 (58) | – | – | Nomogram |
| Tian 2023 [31] | 7 factors: Previous history of low back injury, fracture severity, cortical rupture, percentage of bone cement vertebral body, recovery of anterior edge height of vertebral body, bone cement leakage, and bone cement distribution | Logistic regression |
Male: 94 patients Female: 134 patients |
No residual pain group: 66.17 ± 10.74 (Mean ± SD) Residual pain group: 65.45 ± 11.29 (Mean ± SD) |
228 (35) | – | Internal validation with 1000 bootstrap samples | Nomogram |
| Wu 2023 [32] | 4 factors: intervertebral foramen reduction rate (%), fracture severity, thoracolumbar intervertebral injury, and fracture type | Logistic regression | Training set: 51 male and 206 female |
Training set: 1) no residual pain group: 72.64 ± 12.38 (Mean ± SD); 2) residual pain group: 73.71 ± 11.59 (Mean ± SD) Validation set: – |
257 (48) | 85 (17) |
Internal validation (Random split Validation: 3:1) |
Nomogram |
| Ge 2022 [33] | 4 factors: Bone mineral density, intravertebral cleft, thoracolumbar fascia injury, and radiomics score | Logistic regression | – | All patients > 55 years | 548 (59) | 183 (22) |
Internal validation (Random split Validation: 3:1) |
Nomogram |
| Deng 2023 [34] | 5 factors: Diabetes, preoperative T value, number of fractured vertebrae, lumbar compression rate, and bone cement leakage | Logistic regression |
Male: 238 patients Female: 338 patients |
< 60: 165 patients ≥ 60: 391 patients |
556 (–) | 236 (–) |
Internal validation (Random split Validation: 7:3) |
Nomogram |
| Xu 2024 [35] | 7 factors: Age, bone mineral density, smoking, ASA grading, thoracolumbar fascia injury, amount of bone cement injected, and bone cement leakage | Logistic regression |
Male: 61 patients Female: 75 patients |
No residual pain group: 62.63 ± 5.71 (Mean ± SD) Residual pain group: 67.79 ± 7.56 (Mean ± SD) |
136 (58) | – | – | Nomogram |
| Zhou 2024 [36] | 6 factors: Thoracolumbar fascia injury, bone mineral density, bone cement distribution, short term complications, implementing early rehabilitation interventions, and compliance with rehabilitation interventions | Logistic regression |
Male: 29 patients Female: 141 patients |
No residual pain group: 68.20 ± 6.86 (Mean ± SD) Residual pain group: 72.75 ± 7.85 (Mean ± SD) |
170 (85) | – | – | Formula |
SD Standard Deviation
Assessment of calibration accuracy
All studies assessed calibration (Additional file 3), with nine studies [22, 24, 26–30, 34, 35] using calibration curves and five studies [23, 25, 31, 33, 36] employing the Hosmer–Lemeshow (HL) test for goodness-of-fit evaluation. The results suggest that while the initial calibration of the models is promising, further optimization is required to enhance their broader applicability. For instance, the models by Tu et al. [25], Lin et al. [23] and Ge et al. [33] showed good calibration in training sets (HL P-values > 0.5), but performed less well in validation sets, highlighting the need for adjustments before they can be reliably used in diverse clinical settings. Similarly, the HL tests by Tian et al. [31] and Zhou et al. [36] indicated a good fit in their training sets (P > 0.05), but caution is warranted when applying these models to validation cohorts. Overall, the results indicate that the models exhibit promising initial calibration, but require further refinement to improve consistency across different datasets.
Assessment of the decision curve analysis
Decision Curve Analysis (DCA) was employed as a visual tool to assess the clinical utility of the prediction models in 13 studies [22–27, 29–35]. The majority of models showed good clinical applicability, although their performance varied across different threshold probabilities (Additional file 3). Specifically, the models by Li et al. [22] and Lin et al. [23] demonstrated optimal net benefits within threshold ranges of 0.06–0.66, 0.01–0.75, and 0.01–0.53, respectively. Another model [29] also showed the best clinical applicability with thresholds from 0.01 to 0.53. The models by Xu et al. [35] and Qiu et al. [30] offered the highest clinical net benefits at thresholds above 0.08 and 0.19. These findings underscore the importance of carefully selecting model thresholds to maximize clinical net benefit. Despite the generally favorable clinical applicability, variability in performance across thresholds suggests that tailored threshold adjustments for specific patient populations could improve outcomes. Therefore, optimization of thresholds based on clinical context remains critical for enhancing predictive accuracy.
Assessment of discrimination accuracy
All studies measured discrimination accuracy, involving 25 C-statistics values presented in a forest plot (Fig. 2). Training set C-statistics ranged from from 0.77 [22] to 0.94 [33], showing good performance (> 0.75). Nine models provided validation set data, with C-statistics from 0.752 [22] to 0.954 [32]. Wu et al.'s model [32] had the highest predictive accuracy (C-statistic = 0.94) for short-term residual intercostal pain, and strong generalization (C-statistic = 0.95) in the training set. On the other hand, Li et al.'s model [22] had the lowest predictive ability, estimating the risk of residual back pain. Overall, the results from both training and validation sets generally indicate good discrimination accuracy across the models.
Fig. 2.
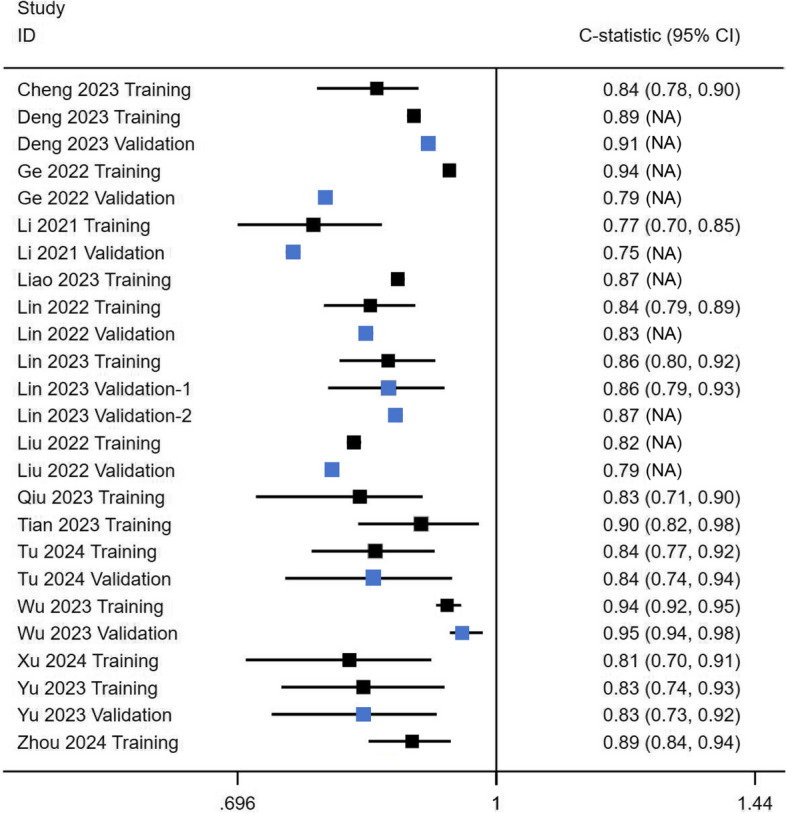
The forest plot of 25 C-statistics. Blue represents the validation set, and black represents the training set
We pooled the C-statistics based on the available data and provided the 95% CIs (Fig. 3 A). The individual point estimates ranged from 0.77 to 0.95, with none of the confidence intervals crossing 0.5. The pooled C-statistics was 0.87 (95% CI [0.83, 0.89]), with a prediction interval range of 0.72 to 0.94, indicating good average performance. Additionally, the pooled C-statistics of the 11 training sets was 0.86 (95% CI [0.82, 0.89]), with a prediction interval range of 0.71 to 0.94 (Fig. 3 B). These results demonstrate the models’ consistent performance across various datasets, though the variability within the prediction intervals highlights the need for careful consideration when applying them to different clinical scenarios.
Fig. 3.

The pooled C-statistics. A, C-statistic for all datasets. B, C-statistic for training datasets
Key predictors of risk prediction models
The included models comprised a total of 35 different predictors (Fig. 4). The three most common predictors were posterior fascia injury (PFI), bone mineral density (BMD), and intravertebral vacuum cleft (IVC), each used in 6 to 9 models (representing 40% to 60% of all models). Bone cement leakage and Bone cement distribution were also frequently used (> 3).
Fig. 4.

Frequency of predictors used in the development models
Posterior fascia injury
PFI was the most frequently used predictor, appearing in 9 out of 15 models (60%). One study [33] indicated that PFI was the most significant independent risk factor, surpassing BMD and IVC, with an Odds Ratio (OR) value of 11.38. Liao et al. [28] also found PFI to be the most critical factor, with an OR of 4.375. However, Zhou et al.'s case–control study [36] showed that PFI was less significant than BMD. Li et al. [22] ranked PFI as the second most important factor after paraspinal muscle degeneration (PMD), with an OR of 3.965. Lin et al.'s study [23] revealed that PFI, as an independent risk factor, ranked below smoking and facet joint injury, with an OR of 5.36; in another study [29], PFI was second to facet joint injury, with an OR of 6.87. Tu et al.'s multivariate analysis [25] indicated that PFI, with an HR of 9.1, was only surpassed by sarcopenia. Similarly, Cheng et al.'s study [27] showed that PFI, with an OR of 2.86, was second only to paraspinal muscle degeneration. However, in Xu et al.'s cohort of 136 cases [35], PFI was not the primary risk factor for residual pain and had poor predictive ability as a single factor (AUC = 0.62). Overall, PFI was frequently identified as a risk predictor across multiple studies, though its significance varied considerably.
Bone mineral density
BMD was the second most common predictor, used in 53% of models (8 out of 15). Deng et al.'s retrospective cohort study of 556 cases [34] indicated that BMD was an independent risk factor, second only to bone cement leakage, with an OR of 2.899. Similarly, three other studies [28, 30, 36] also identified BMD as a primary risk factor. However, Ge et al.'s prospective cohort study of 548 cases [33] showed that, BMD was the weakest independent risk factor, with an OR of 0.082. Likewise, other two studies [23, 29] also indicated that BMD was a relatively weak independent risk factor in their prediction models. These discrepancies in BMD’s predictive strength likely stem from different approaches to handling continuous variables, highlighting the importance of considering statistical methods and study designs when using BMD as a model predictor. Further investigation is needed to clarify BMD’s role in reliable risk prediction models.
Intravertebral vacuum cleft
Intravertebral Vacuum Cleft (IVC) was used in 6 models (40%, 6/15). Ge et al.'s multivariate analysis [33] showed that IVC was a significant risk factor for residual back pain, with an OR of 3.22. Similarly, multivariate analyses from four studies [22, 26–28] reported OR values of 3.70, 4.41, 2.68, and 3.25, respectively. Tu et al.'s study [25] reported an HR value of 8.67 for IVC. These findings highlight the significance of IVC as a critical risk factor for residual back pain following vertebral augmentation.
Critical appraisal of bias risk in observational studies
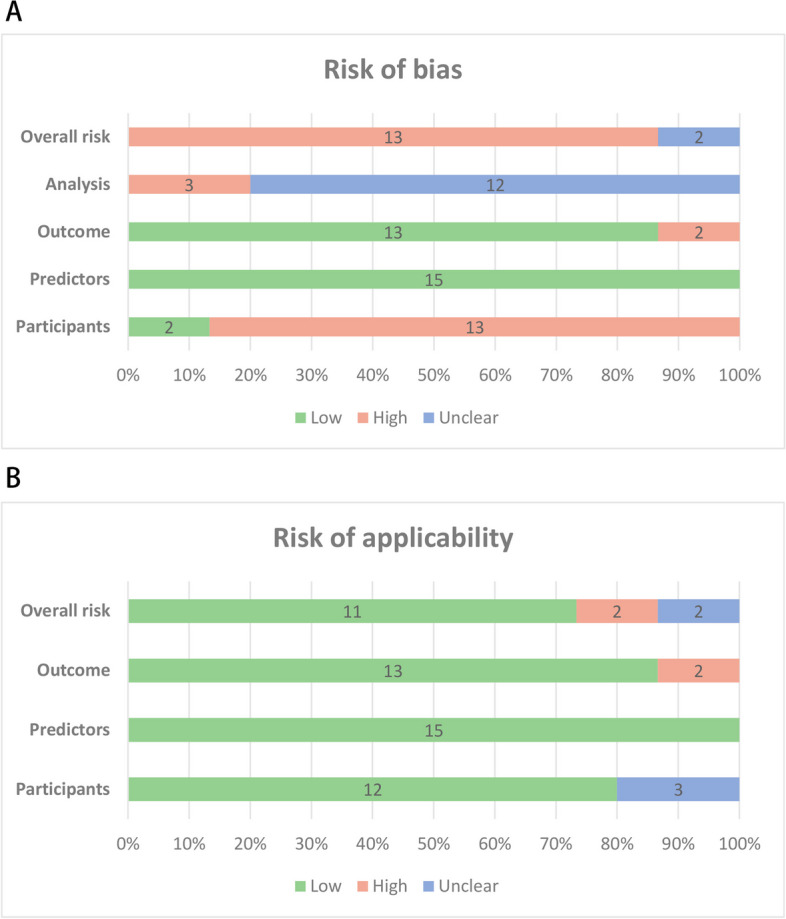
The Newcastle–Ottawa Scale (NOS) assessment showed that four studies [25, 28, 30, 33] received a score of 8, while eleven studies [22–24, 26, 27, 29, 31, 32, 34–36] scored 7 (Table 3 and Additional file 4). All cohort and case–control studies were classified as high quality. These studies demonstrated a low risk of bias in the "Selection" domain, reflected in the rationality and representativeness of the population sampling. However, in the "Comparability" domain, most studies did not sufficiently consider the differences between the observation and control groups, which could introduce bias. Furthermore, only two studies [25, 33] (2/15, 13.3%) reported using blinding to assess exposure and outcomes, with the majority not mentioning blinding procedures. Overall, while the quality of these studies is acceptable, future research should adopt more rigorous study designs and reporting practices to reduce bias. This includes better matching between observation and control groups, controlling for confounding factors, and improving outcome measurement accuracy.
Table 3.
Newcastle—Ottawa Scale for Included Studies
| Study ID | Three domains of the Newcastle–Ottawa Scale (NOS) | Total scorea | ||
|---|---|---|---|---|
| Selection | Comparability | Outcome / Exposure | ||
| Li 2021 [22] | ★★★★ | ★○ | ○★★ | 7 |
| Lin 2023 [23] | ★★★★ | ★○ | ○★★ | 7 |
| Liu 2022 [24] | ★★★★ | ★○ | ○★★ | 7 |
| Tu 2024 [25] | ★★★★ | ★○ | ★★★ | 8 |
| Yu 2023 [26] | ★★★★ | ★○ | ○★★ | 7 |
| Cheng 2023 [27] | ★★★★ | ★○ | ○★★ | 7 |
| Liao 2023 [28] | ★★★★ | ★★ | ○★★ | 8 |
| Lin 2022 [29] | ★★★★ | ★○ | ○★★ | 7 |
| Qiu 2023 [30] | ★★★★ | ★★ | ○★★ | 8 |
| Tian 2023 [31] | ★★★★ | ★○ | ○★★ | 7 |
| Wu 2023 [32] | ★★★★ | ★○ | ○★★ | 7 |
| Ge 2022 [33] | ★★★★ | ★○ | ★★★ | 8 |
| Deng 2023 [34] | ★★★★ | ★○ | ○★★ | 7 |
| Xu 2024 [35] | ★★★★ | ★○ | ○★★ | 7 |
| Zhou 2024 [36] | ★★★★ | ★○ | ○★★ | 7 |
★ represents good quality in the relevant domain, while ○ represents poor quality. aTotal score refers to the number of ★ across all domains. A total score of ≤ 3 reflects low-quality study, a score between 4–6 reflects moderate-quality study, and a score of ≥ 7 reflects high-quality study
Critical appraisal of bias risk in prediction models
Despite all models focusing on residual pain following vertebroplasty, the target populations of these models vary. This variation is reflected in the short-term or long-term nature of residual pain and the different pain sites considered. We categorized the models based on these criteria before assessing their risk of bias and applicability. Seven models [22, 24, 25, 27, 33, 35, 36] focused on short-term (≤ 3 months) residual back pain. One model [32] focused on short-term residual intercostal pain. Four models [23, 26, 29, 34] addressed long-term (> 3 months) residual back pain. The summary of the risk of bias assessment is presented in Table 4 and Fig. 5A, with detailed results available in Additional file 5. Out of the 15 models, 13 [22–25, 27–32, 34–36] were assessed as high risk of bias, while 2 [26, 33] were evaluated as unclear risk.
Table 4.
Evaluations of the bias risk and applicability of the included models
| Study | Risk of bias | Risk of applicability | Overall risk | ||||||
|---|---|---|---|---|---|---|---|---|---|
| Participants | Predictors | Outcome | Analysis | Participants | Predictors | Outcome | Risk of bias | Risk of applicability | |
| Li 2021 [22] | High | Low | Low | Unclear | Low | Low | Low | High | Low |
| Lin 2023 [23] | High | Low | Low | Unclear | Low | Low | Low | High | Low |
| Liu 2022 [24] | High | Low | Low | High | Low | Low | Low | High | Low |
| Tu 2024 [25] | High | Low | Low | High | Low | Low | Low | High | Low |
| Yu 2023 [26] | Low | Low | Low | Unclear | Low | Low | Low | Unclear | Low |
| Cheng 2023 [27] | High | Low | Low | Unclear | Low | Low | Low | High | Low |
| Liao 2023 [28] | High | Low | Low | Unclear | Unclear | Low | Low | High | Unclear |
| Lin 2022 [29] | High | Low | Low | Unclear | Low | Low | Low | High | Low |
| Qiu 2023 [30] | High | Low | High | Unclear | Unclear | Low | High | High | High |
| Tian 2023 [31] | High | Low | Low | Unclear | Unclear | Low | Low | High | Unclear |
| Wu 2023 [32] | High | Low | High | High | Low | Low | High | High | High |
| Ge 2022 [33] | Low | Low | Low | Unclear | Low | Low | Low | Unclear | Low |
| Deng 2023 [34] | High | Low | Low | Unclear | Low | Low | Low | High | Low |
| Xu 2024 [35] | High | Low | Low | Unclear | Low | Low | Low | High | Low |
| Zhou 2024 [36] | High | Low | Low | Unclear | Low | Low | Low | High | Low |
High high risk of bias or high applicability concern, Low low risk of bias or low applicability concern, Unclear unclear risk of bias or unclear applicability concern
Fig. 5.
Graphical summary presenting the percentage of risk prediction studies rated by level of concern. A, Risk of bias (ROB). B, Risk of Applicability
In the "participants" domain, the studies by Ge et al. [33] and Yu et al. [26] used prospective cohort designs, which were considered low risk. Twelve studies [22–25, 27–32, 34, 35] employed retrospective cohort designs, while one [36] utilized a case–control design. All of these studies were evaluated and found to be high risk. No studies were assessed as high risk due to inclusion and exclusion criteria, indicating good representativeness of the included populations. All models exhibited low risk in defining and assessing predictor variables, with the included predictors effectively predicting outcomes, as confirmed by multivariate logistic regression analyses. The low risk in the predictor domain suggests that the predictors included in these models are effective in real-world settings. However, the studies by Qiu et al. [30] and Wu et al. [32] were rated high risk in the outcome domain due to the short interval (< 24 h) between predictor assessment and outcome determination, which likely reflects immediate surgical trauma response [12]. Most models demonstrated certain limitations in outcome analysis. None of the included studies mentioned handling missing data or considering data complexity, which may introduce potential bias. Inadequate handling of missing data could affect model accuracy and reliability. Moreover, neglecting data complexity (e.g., relationships between variables, multicollinearity) might impair the model's generalizability across different datasets. Deng et al.'s study [34] did not mention events per variable (EPV), resulting in an unclear risk assessment. Models by Liu et al. [24], Tu et al. [25], and Wu et al. [32] had validation cohort sample sizes of less than 100, which were considered high risk. Additionally, six studies [22, 23, 26, 28, 29, 31] used bootstrapping for internal validation, but none employed cross-validation to test for model overfitting, preventing a thorough evaluation of the model's generalizability. Only Lin et al. [23] conducted external validation, while most studies failed to validate their models on completely independent datasets.
Concerns regarding applicability are presented in Table 3 and Fig. 5 B. In the "participants" domain, 13 studies [22–27, 29, 31–36] were rated as low risk, while studies by Liao et al. [28] and Qiu et al. [30] showed unclear applicability risk. All studies were rated as low risk in the "predictors" domain. Two [30, 32] of the 15 studies revealed high applicability concerns in the "Outcome" domain. Ultimately, Ultimately, 11 studies [22–27, 30, 33–36] had low overall applicability concerns, 2 studies [30, 32] had high concerns, and 2 studies [28, 31] had unclear concerns.
Discussion
This systematic review summarizes 15 published prediction model studies [22–36] from 12 cities in China, highlighting variations in predictor variables, demographic characteristics, sample sizes, and validation methods. However, as mentioned above, all of these studies are from China, which may introduce regional bias. In fact, most prediction models in many medical fields can be effectively applied across different racial groups, especially when the model variables (such as age, gender, and exposure factors) are universal. While there may be some physiological and sociocultural differences between racial groups, prediction models for residual pain following PVA surgery hold potential for cross-racial application. This is because many key physiological factors and medical backgrounds influencing pain, such as osteoporosis, surgical methods (PKP and PVP), and postoperative care, are common across different racial groups. With appropriate adjustments and validation, we believe these prediction models can be optimistically applied to Caucasian populations and other racial groups, providing valuable support for improving postoperative pain management.
Overall, these models demonstrated satisfactory predictive capabilities for forecasting residual pain after vertebral augmentation, despite differences in target populations. Our findings show that the models performed well in terms of overall discrimination. The combined C-statistic, using the REML method, was 0.87 with a narrow 95% CI from 0.83 to 0.89, consistent with the results in the training sets (C-statistic = 0.86, 95% CI [0.82, 0.89]). These results suggest that these models have significant potential for clinical application in predicting residual pain post-vertebroplasty. Notably, Wu et al.'s study [32] focused specifically on residual intercostal pain, achieving a C-statistic of 0.94, while Deng et al.'s model [34], focused on long-term outcomes, showed advantages in predicting chronic back pain (C-statistics of 0.89 and 0.91).
An interesting issue is that most of the studies included in our analysis show that age is not strongly correlated with residual pain after PVA. Generally, with increasing age, factors such as soft tissue degeneration, changes in bone density, and alterations in bone metabolism lead to a decline in fracture healing capacity, which likely exacerbates the persistence of residual pain post-surgery. However, in our study, only two models [30, 35] found a significant correlation between age and residual pain after vertebral augmentation. This may be attributed to several reasons: 1) In recent years, PVA surgical techniques and postoperative individualized treatments have become more refined [37, 38], which may have reduced the expected impact of age on residual pain; 2) Older patients often have more comorbidities, such as diabetes and cardiovascular diseases, which can affect pain perception. Effective management of chronic conditions reduces the influence of these comorbidities on the recovery process after PVA [39–41], potentially leading to a reduced association with residual pain; 3) Finally, the balance of age groups in the samples and patient selection may also contribute to the lack of a strong age-related correlation in most studies. As one study [42] showed, age only affects recovery after vertebral kyphoplasty when it exceeds 75 years. Overall, the factors influencing postoperative recovery in elderly patients are complex, and future research should further evaluate the clinical significance of PVA surgery in different age groups.
We critically evaluated the bias risks in observational studies. The NOS assessment showed that all studies were of high quality. While these high-quality studies provide a solid foundation for the models, the generalizability of the models still requires further external validation. We also assessed the prediction models using PROBAST. Although most models did not meet the expected standards, many showed low clinical applicability concerns, indicating good predictive ability in different settings and populations. Nonetheless, several limitations persist: 1) Most models were classified as high-risk for participant selection due to retrospective designs, leading to incomplete or inaccurate data collection. 2) Small sample sizes in some studies resulted in unstable predictive performance and increased risk of overfitting. 3) Although most models underwent internal validation, only one study [23] employed external validation. The lack of independent dataset validation hinders effective assessment of model robustness and generalizability [43]. 4) None of the studies clearly reported how they handled missing data. Researchers could use multiple imputation methods to handle missing data [44, 45], preserving data integrity and randomness, and reducing bias compared to the missing indicator method. 5) Some studies did not provide the standard error and 95% confidence intervals for the C-statistics. For example, Deng et al.'s study [34] only provided C-statistic estimates of 0.89 and 0.91, lacking information on overall parameter variability, leading to insufficient interpretation of the results.
A total of 35 predictor variables were included in the risk prediction models, with the most commonly used being PFI, BMD, and IVC. Low bone mineral density is a strong risk factor for residual pain after vertebroplasty, confirmed in a large sample of 1316 cases [46]. Thus, increasing bone density with zoledronic acid and calcium supplements preoperatively and during recovery is crucial for preventing residual pain [47–49]. Additionally, low BMD is also associated with the risk of recurrent vertebral compression fractures. For instance, studies by Nie et al. [50] and Zhang et al. [51] both identified BMD as an important predictor of recurrent fractures. Thus, increasing bone density preoperatively can help prevent both residual pain and recurrent fractures postoperatively.
Notably, the severity and instability of fractures, including factors like PFI, IVC, and other indicators of fracture instability, are crucial to the outcomes after PVA. Most vertebral compression fractures (VCFs) occur at the thoracolumbar junction (T10–L2) [52], which aligns with our findings. In these models, posterior fascia was identified as the primary predictor of VCFs risk and a key factor in fracture instability. Biomechanically, flexion at this junction contributes not only to VCFs occurrence but also influences lumbar muscle support, impacting prognosis. For instance, paraspinal muscle degeneration effectively identifies populations at risk for VCFs [53]. Posterior fascia injuries, often accompanied by damage to spinal structures like the supraspinous and interspinous ligaments and facet joints, undermine posterior spinal support and complicate fracture healing. Vertebroplasty seeks to restore vertebral alignment and relieve pain, but many patients with posterior fascia injuries report limited pain relief post-procedure. Recent studies provide further evidence of this issue; for instance, a study of 675 cases reported that PFI (OR = 4.08) is an independent risk factor for residual back pain post-percutaneous vertebroplasty, with facet joint invasion and depression (OR = 11.204) showing an even stronger association with residual pain [54].
Additionally, certain instability factors are directly related to the severity of fractures. Elements such as intravertebral vacuum cleft, kyphotic deformity, and multi-level compression fractures can increase the volume of bone cement injection. This heightened cement volume may lead to cement leakage, which poses a risk for adjacent vertebral fractures and persistent residual pain. According to the VCFs Appropriateness Criteria guideline [37], the presence of an intravertebral vacuum cleft (IVC) is considered a critical instability factor, and its complete filling is essential for effective pain relief and vertebral stability. IVC is the third most frequently used predictive factor and is a typical radiographic feature of Kümmell's Disease, classified as a delayed vertebral compression fracture [55]. Studies have shown that IVC can significantly impact the effectiveness of vertebroplasty and lead to poor outcomes [56–58]. Consequently, preoperative imaging to assess the presence of IVC is essential for developing personalized treatment plans. According to the AOSpine classification [59], PFI and IVC are most commonly observed in B-type, OF4, and OF5 fractures. While these fracture types are sometimes considered for vertebral augmentation in certain clinical contexts, our study identifies IVC and PFI as the most significant predictors of persistent pain following vertebral augmentation. These findings suggest that fractures with substantial PFI and IVC involvement are better treated with fixation rather than vertebral augmentation. Fixation stabilizes these fractures, potentially providing better long-term pain relief and functional recovery. Consequently, our results highlight the need to reconsider the role of vertebral augmentation in these cases and emphasize the importance of treatment decisions based on a comprehensive evaluation of fracture characteristics.
For future research, several important directions should be considered: 1) For high-risk patients with potential postoperative residual pain, adopting a cautious approach when selecting PVA strategies and re-evaluating surgical indications may improve clinical outcomes. Conservative treatment remains the standard approach prior to considering minimally invasive procedures; 2) These models primarily focus on individuals over 55 with fragility fractures, potentially overlooking younger patients who experience vertebral compression fractures from simple accidents. Therefore, more targeted models should be developed in the future; 3) Preventing cement leakage and optimizing cement distribution should remain a priority, as these factors contribute to residual pain, spinal stenosis, spinal cord injury, and even pulmonary embolism due to cement migration; 4) Integrating fracture severity classifications into prediction models could enhance the precision of residual pain risk assessments.
To our knowledge, this is the first systematic review assessing risk prediction models for residual pain after vertebroplasty. Through critical appraisal, we found that most models are still at high or unclear risk, but they all exhibit good clinical applicability. In addition to meta-analysis, we provided a descriptive summary of predictor variables. Clinicians can use these predictors and the evaluated models to make better clinical judgments for different populations. While current models demonstrate good discrimination ability, future research should focus on multicenter, large-sample external validation to enhance model generalizability. Furthermore, during model development and validation, careful attention should be paid to the staging and severity of residual pain to provide more accurate predictive models for clinical decision-makers and stakeholders.
Limitations
Our review has several limitations. First, despite our detailed search strategy, some studies might have been missed, such as gray literature or studies published in other languages. Additionally, both Chinese and English studies included in our review are from China, potentially introducing regional bias. Finally, due to the lack of validation studies among the included models, direct comparison of the implementation effectiveness of existing models is not possible. Nonetheless, our study provides important insights and directions for future improvements in risk prediction models.
Conclusion
This systematic review summarizes predictive models for residual pain risk after vertebral augmentation, highlighting the deficiencies and limitations of current models. Although these models show satisfactorily in overall performance (C-statistic = 0.87) and clinical applicability, improvements in model development and validation are still needed. Nevertheless, these models provide valuable tools for clinicians to assess residual pain risk preoperatively, aiding in pain prevention and the development of personalized treatment plans.
Supplementary Information
Acknowledgements
Not applicable.
Abbreviations
- VCF
Vertebral compression fracture
- PVP
Percutaneous vertebroplasty
- PKP
Percutaneous kyphoplasty
- AUC
Area under the curve
- CI
Confidence interval
- VAS
Visual Analogue Scale
- OR
Odds ratio
- HL
Hosmer-Lemeshow
- KS
Kolmogorov-Smirnov
- DCA
Decision curve analysis
- PFI
Posterior fascia injury
- BMD
Bone mineral density
- IVC
Intravertebral vacuum cleft
- EPV
Events per variable
Authors’ contributions
Conceptualization: Siyi Wang, Zhenhua Li and Xinhua Chen. Methodology: Xianshuai Zhang and Mingpeng Shi. Writing of original draft: Siyi Wang. Data curation: Xue Zhou, Mingze Han, Xianshuai Zhang, Zhenhua Li and Jianan Yu. Formal analysis and visualization: Mingpeng Shi. Revision and editing: Xinhua Chen and Zhenhua Li. All authors reviewed the manuscript.
Funding
This research did not receive any specific grant from any departmental funding institutions.
Data availability
No datasets were generated or analysed during the current study.
Declarations
Ethics approval and consent to participate
Not applicable.
Consent for publication
Not applicable.
Competing interests
The authors declare no competing interests.
Footnotes
Publisher’s Note
Springer Nature remains neutral with regard to jurisdictional claims in published maps and institutional affiliations.
Contributor Information
Zhenhua Li, Email: lizhenhua1972@163.com.
Xinhua Chen, Email: 187098190@qq.com.
References
- 1.Parreira PCS, Maher CG, Megale RZ, March L, Ferreira ML. An overview of clinical guidelines for the management of vertebral compression fracture: a systematic review. Spine J. 2017;17(12):1932–8. [DOI] [PubMed] [Google Scholar]
- 2.Wen B, Zhang Y, He J, Tan L, Xiao G, Wang Z, et al. Causal impact of DNA methylation on refracture in elderly individuals with osteoporosis - a prospective cohort study. BMC Musculoskelet Disord. 2024;25(1):432. [DOI] [PMC free article] [PubMed] [Google Scholar]
- 3.Glaser DL, Kaplan FS. Osteoporosis. Definition and clinical presentation. Spine (Phila Pa 1976). 1997;22(24 Suppl):12s–6s. [DOI] [PubMed] [Google Scholar]
- 4.Gold LS, Suri P, O’Reilly MK, Kallmes DF, Heagerty PJ, Jarvik JG. Mortality among older adults with osteoporotic vertebral fracture. Osteoporos Int. 2023;34(9):1561–75. [DOI] [PMC free article] [PubMed] [Google Scholar]
- 5.Kim JE, Koh SY, Swan H, Kazmi SZ, Kim HJ, Ahn HS, et al. Incidence and Mortality of Vertebral Compression Fracture Among All Age Groups: A Nationwide, Population-based Study in the Republic of Korea. Pain Physician. 2023;26(3):E203–e11. [PubMed] [Google Scholar]
- 6.Alsoof D, Anderson G, McDonald CL, Basques B, Kuris E, Daniels AH. Diagnosis and Management of Vertebral Compression Fracture. Am J Med. 2022;135(7):815–21. [DOI] [PubMed] [Google Scholar]
- 7.Li Q, Yang Z, Zhu M, Li J, Lu C, Li Z, et al. Prevalence and risk factors of osteoporotic fracture among the elderly population in China: a multicenter cross-sectional study. Int Orthop. 2024;48(5):1323–30. [DOI] [PubMed] [Google Scholar]
- 8.Danyang B, Yangyang F, Yonghong S. Research hotspots and frontier analysis of postoperative rehabilitation of osteoporotic spinal compression fractures based on CiteSpace. Chinese Evidence-Based Nursing. 2024;10(17):3129–34. [Google Scholar]
- 9.Shihuai Z, Hanbin O, Zhen L, Chengshuo H, Zhenhu W, Zeyu Z, et al. Advances in vertebroplasty for the treatment of osteoporotic vertebral compression fractures. Orthopaedic Biomechanics Materials and Clinical Study. 2024;21(01):71–4. [Google Scholar]
- 10.McCarthy J, Davis A. Diagnosis and Management of Vertebral Compression Fractures. Am Fam Physician. 2016;94(1):44–50. [PubMed] [Google Scholar]
- 11.Long Y, Yi W, Yang D. Advances in Vertebral Augmentation Systems for Osteoporotic Vertebral Compression Fractures. Pain Res Manag. 2020;2020:3947368. [DOI] [PMC free article] [PubMed] [Google Scholar]
- 12.Kamalian S, Bordia R, Ortiz AO. Post-vertebral augmentation back pain: evaluation and management. AJNR Am J Neuroradiol. 2012;33(2):370–5. [DOI] [PMC free article] [PubMed] [Google Scholar]
- 13.Wang E, Yi H, Wang M, Huang C. Treatment of osteoporotic vertebral compression fractures with percutaneous kyphoplasty: a report of 196 cases. Eur J Orthop Surg Traumatol. 2013;23(Suppl 1):S71–5. [DOI] [PubMed] [Google Scholar]
- 14.Moons KGM, Wolff RF, Riley RD, Whiting PF, Westwood M, Collins GS, et al. PROBAST: A Tool to Assess Risk of Bias and Applicability of Prediction Model Studies: Explanation and Elaboration. Ann Intern Med. 2019;170(1):W1–w33. [DOI] [PubMed] [Google Scholar]
- 15.Steyerberg EW, Vergouwe Y. Towards better clinical prediction models: seven steps for development and an ABCD for validation. Eur Heart J. 2014;35(29):1925–31. [DOI] [PMC free article] [PubMed] [Google Scholar]
- 16.Page MJ, McKenzie JE, Bossuyt PM, Boutron I, Hoffmann TC, Mulrow CD, et al. The PRISMA 2020 statement: an updated guideline for reporting systematic reviews. BMJ. 2021;372: n71. [DOI] [PMC free article] [PubMed] [Google Scholar]
- 17.Debray TP, Damen JA, Snell KI, Ensor J, Hooft L, Reitsma JB, et al. A guide to systematic review and meta-analysis of prediction model performance. BMJ. 2017;356: i6460. [DOI] [PubMed] [Google Scholar]
- 18.Lo CK, Mertz D, Loeb M. Newcastle-Ottawa Scale: comparing reviewers’ to authors’ assessments. BMC Med Res Methodol. 2014;14:45. [DOI] [PMC free article] [PubMed] [Google Scholar]
- 19.Collins GS, Reitsma JB, Altman DG, Moons KG. Transparent reporting of a multivariable prediction model for individual prognosis or diagnosis (TRIPOD): the TRIPOD statement. BMJ. 2015;350: g7594. [DOI] [PubMed] [Google Scholar]
- 20.Moons KG, de Groot JA, Bouwmeester W, Vergouwe Y, Mallett S, Altman DG, et al. Critical appraisal and data extraction for systematic reviews of prediction modelling studies: the CHARMS checklist. PLoS Med. 2014;11(10): e1001744. [DOI] [PMC free article] [PubMed] [Google Scholar]
- 21.Debray TP, Damen JA, Riley RD, Snell K, Reitsma JB, Hooft L, et al. A framework for meta-analysis of prediction model studies with binary and time-to-event outcomes. Stat Methods Med Res. 2019;28(9):2768–86. [DOI] [PMC free article] [PubMed] [Google Scholar]
- 22.Li Q, Shi L, Wang Y, Guan T, Jiang X, Guo D, et al. A Nomogram for Predicting the Residual Back Pain after Percutaneous Vertebroplasty for Osteoporotic Vertebral Compression Fractures. Pain Res Manag. 2021;2021:3624614. [DOI] [PMC free article] [PubMed] [Google Scholar]
- 23.Lin M, Wen X, Huang Z, Huang W, Zhang H, Huang X, et al. A nomogram for predicting residual low back pain after percutaneous kyphoplasty in osteoporotic vertebral compression fractures. Osteoporos Int. 2023;34(4):749–62. [DOI] [PubMed] [Google Scholar]
- 24.Liu Z, Zhang X, Liu H, Wang D. A nomogram for short-term recurrent pain after percutaneous vertebroplasty for osteoporotic vertebral compression fractures. Osteoporos Int. 2022;33(4):851–60. [DOI] [PubMed] [Google Scholar]
- 25.Tu W, Niu Y, Su P, Liu D, Lin F, Sun Y. Establishment of a risk prediction model for residual low back pain in thoracolumbar osteoporotic vertebral compression fractures after percutaneous kyphoplasty. J Orthop Surg Res. 2024;19(1):41. [DOI] [PMC free article] [PubMed] [Google Scholar]
- 26.Yu H, Luo G, Wang Z, Yu B, Sun T, Tang Q. Predictors of residual low back pain in patients with osteoporotic vertebral fractures following percutaneous kyphoplasty. Front Surg. 2023;10:1119393. [DOI] [PMC free article] [PubMed] [Google Scholar]
- 27.Changgui C, Zengxin G, Youmin C, Linhui Y, Zhanpo W, Fuhua W, et al. Establishment and validation of a risk nomograph model of residual back pain after percutaneous vertebroplasty for osteoporotic vertebral compression fractures. Journal of Clinical Medicine in Practice. 2023;27(12):38–43. [Google Scholar]
- 28.Bangqiang L, Fangkuan C, Yi Z, Lu C. Prediction Model of Residual Pain in Patients with Osteoporotic Compression Fracture After PVP Based on Nomogram. Journal of Medical Information. 2023;36(13):19–23. [Google Scholar]
- 29.Miaoman L, Xuemei W, Zongwei H, Xiaobing Y. Development and validation of a prediction model for the risk of residual low back pain after vertebral augmentation for osteoporotic vertebral compression fractures. Chinese Journal of Spine and Spinal Cord. 2022;32(08):720–8. [Google Scholar]
- 30.Xiaokang Q, Ping J, Yanling Y, Xiuquan Q. Analysis of the influencing factors for postoperative pain in patients with osteoporotic thoracolumbar fracture and construction of its predictive model. The Journal of Practical Medicine. 2023;39(18):2312–6. [Google Scholar]
- 31.Long T, Meng H, Junsong L, Junren L. Construction of nomogram model for poor early pain relief of thoracolumbar osteoporotic vertebral compression fractures treated with vertebral augmentation. Journal of Spinal Surgery. 2023;21(05):331–7. [Google Scholar]
- 32.Yu W, Yiyin L. Establishment and application evaluation of risk model of intercostal pain after operation of osteoporotic thoracic compression fracture. The Journal of Cervicodynia and Lumbodynia. 2023;45(02):320–4. [Google Scholar]
- 33.Ge C, Chen Z, Lin Y, Zheng Y, Cao P, Chen X. Preoperative prediction of residual back pain after vertebral augmentation for osteoporotic vertebral compression fractures: Initial application of a radiomics score based nomogram. Front Endocrinol (Lausanne). 2022;13:1093508. [DOI] [PMC free article] [PubMed] [Google Scholar]
- 34.Deng GH. Construction and validation of a nomogram prediction model for chronic low back pain after PKP for lumbar compression fractures. Medicine (Baltimore). 2023;102(43): e34752. [DOI] [PMC free article] [PubMed] [Google Scholar]
- 35.Yao X, Zhipeng Q, Yanhong Y, Yaqiang P. Construction of nomogram of the risk of poor postoperative pain relief in patients with osteoporotic compression fractures. Chinese Journal of Bone and Joint. 2024;13(01):28–32. [Google Scholar]
- 36.Yuanyuan Z, Ling-min Z, Zhi-mu Y. Influencing factors for postoperative residual low back pain in elderly patients with osteoporotic thoracolumbar vertebral compression fracture and construction of prediction model. The Journal of Cervicodynia and Lumbodynia. 2024;45(01):101–6. [Google Scholar]
- 37.Khan MA, Jennings JW, Baker JC, Smolock AR, Shah LM, Pinchot JW, et al. ACR Appropriateness Criteria® Management of Vertebral Compression Fractures: 2022 Update. J Am Coll Radiol. 2023;20(5s):S102–s24. [DOI] [PubMed] [Google Scholar]
- 38.Weber A, Vercoulen TFG, Jacobs E, Buizer AT, Bours SPG, van den Bergh JP, et al. Disparities in management of symptomatic osteoporotic vertebral compression fractures: a nationwide multidisciplinary survey. Arch Osteoporos. 2024;19(1):101. [DOI] [PMC free article] [PubMed] [Google Scholar]
- 39.Spross C, Aghayev E, Kocher R, Röder C, Forster T, Kuelling FA. Incidence and risk factors for early adjacent vertebral fractures after balloon kyphoplasty for osteoporotic fractures: analysis of the SWISSspine registry. Eur Spine J. 2014;23(6):1332–8. [DOI] [PubMed] [Google Scholar]
- 40.Liu Y, Gao L, Li M, Zhang W, Wang Y, Zhao J. High-Risk Analysis of Vertebral Compression Fractures With Type 2 Diabetes Mellitus: Site-Specific Volumetric Bone Mineral Density. Int J Endocrinol. 2024;2024:7150482. [DOI] [PMC free article] [PubMed] [Google Scholar]
- 41.Lin YH, Lin YT, Wu YC, Wang WC, Chen KH, Pan CC, et al. Relationship between preoperative glucose level and all-cause mortality in patients with osteoporotic vertebral compression fracture who underwent percutaneous vertebroplasty. Sci Rep. 2024;14(1):20265. [DOI] [PMC free article] [PubMed] [Google Scholar]
- 42.Xu Y, Li D, Zhang Q, Tong L. Efficacy of lumbar and abdominal muscle rehabilitation training on degree of osteoporosis, pain and anxiety in elderly patients with osteoporotic vertebral compression fracture after PKP and compliance analysis. Front Med (Lausanne). 2024;11:1364497. [DOI] [PMC free article] [PubMed] [Google Scholar]
- 43.Venema E, Wessler BS, Paulus JK, Salah R, Raman G, Leung LY, et al. Large-scale validation of the prediction model risk of bias assessment Tool (PROBAST) using a short form: high risk of bias models show poorer discrimination. J Clin Epidemiol. 2021;138:32–9. [DOI] [PubMed] [Google Scholar]
- 44.Blazek K, van Zwieten A, Saglimbene V, Teixeira-Pinto A. A practical guide to multiple imputation of missing data in nephrology. Kidney Int. 2021;99(1):68–74. [DOI] [PubMed] [Google Scholar]
- 45.Jonsdottir SD, Thordardottir EB, Valdimarsdottir UA, Halldorsdottir T, Gudnadottir SA, Jakobsdottir J, et al. Sexual violence in the workplace and associated health outcomes: a nationwide, cross-sectional analysis of women in Iceland. Lancet Public Health. 2024;9(6):e365–75. [DOI] [PMC free article] [PubMed] [Google Scholar]
- 46.Yang JS, Liu JJ, Chu L, Li J, Chen C, Chen H, et al. Causes of Residual Back Pain at Early Stage After Percutaneous Vertebroplasty: A Retrospective Analysis of 1,316 Cases. Pain Physician. 2019;22(5):E495–e503. [PubMed] [Google Scholar]
- 47.Chen Z, Xu L, Shi L, Cao H, Nie M. Long-term outcome of percutaneous vertebroplasty versus conservative treatment for osteoporotic vertebral compression fractures: a retrospective cohort study with three-year follow-up. Front Med (Lausanne). 2024;11:1391243. [DOI] [PMC free article] [PubMed] [Google Scholar]
- 48.Hu W, Wang H, Shi X, Song Y, Zhang G, Xing S, et al. Effect of Preoperative Zoledronic Acid Administration on Pain Intensity after Percutaneous Vertebroplasty for Osteoporotic Vertebral Compression Fractures. Pain Res Manag. 2020;2020:8039671. [DOI] [PMC free article] [PubMed] [Google Scholar]
- 49.Wu XG, Zhang DY, Zhu BQ, Li AM. Efficacy of zoledronic acid with percutaneous kyphoplasty/vertebroplasty in the treatment of osteoporotic vertebral compression fractures: a systematic review and meta-analysis. Eur Rev Med Pharmacol Sci. 2020;24(23):12358–67. [DOI] [PubMed] [Google Scholar]
- 50.Nie M, Chen Z, Shi L, Cao H, Xu L. Prediction of new vertebral compression fracture within 3 years after percutaneous vertebroplasty for osteoporotic vertebral compression fracture: Establishment and validation of a nomogram prediction model. PLoS ONE. 2024;19(5): e0303385. [DOI] [PMC free article] [PubMed] [Google Scholar]
- 51.Zhang A, Lin Y, Kong M, Chen J, Gao W, Fan J, et al. A nomogram for predicting the risk of new vertebral compression fracture after percutaneous kyphoplasty. Eur J Med Res. 2023;28(1):280. [DOI] [PMC free article] [PubMed] [Google Scholar]
- 52.Gozel T, Ortiz AO. Vertebral Augmentation for Osteoporotic Vertebral Compression Fractures: What is the Current Evidence Pro and Con? Radiol Clin North Am. 2024;62(6):979–91. [DOI] [PubMed] [Google Scholar]
- 53.Chen Z, Shi T, Li W, Sun J, Yao Z, Liu W. Role of paraspinal muscle degeneration in the occurrence and recurrence of osteoporotic vertebral fracture: A meta-analysis. Front Endocrinol (Lausanne). 2022;13:1073013. [DOI] [PMC free article] [PubMed] [Google Scholar]
- 54.Wang ZW, Wang GY, Liu DK, Zhang DZ, Zhao C. Risk Factors for Residual Back Pain After PVP Treatment for osteoporotic Thoracolumbar Compression Fractures: A Retrospective Cohort Study. World Neurosurg. 2023;180:e484–93. [DOI] [PubMed] [Google Scholar]
- 55.Wang R, Hao Y, Chen M, Jia P, Zhou F. Comparison of the Clinical Outcomes of Vesselplasty vs. Percutaneous Vertebroplasty for the Treatment of Neurologically Intact Osteoporotic Kümmell’s Disease: A Retrospective Study. Calcif Tissue Int. 2024;114(4):360–7. [DOI] [PubMed] [Google Scholar]
- 56.Li Q, Long X, Wang Y, Guan T, Fang X, Guo D, et al. Clinical observation of two bone cement distribution modes after percutaneous vertebroplasty for osteoporotic vertebral compression fractures. BMC Musculoskelet Disord. 2021;22(1):577. [DOI] [PMC free article] [PubMed] [Google Scholar]
- 57.He W, Zhou Q, Lv J, Shen Y, Liu H, Yang H, et al. Effects of Percutaneous Kyphoplasty for the Treatment of Thoracic Osteoporotic Vertebral Compression Fractures with or without Intravertebral Cleft in Elderly Patients. Int J Gen Med. 2024;17:193–203. [DOI] [PMC free article] [PubMed] [Google Scholar]
- 58.Qi J, Hu Y, Yang Z, Dong Y, Zhang X, Hou G, et al. Incidence, risk factors, and outcomes of symptomatic bone cement displacement following percutaneous kyphoplasty for osteoporotic vertebral compression fracture: a single center study. J Clin Med. 2022;11(24):7530. [DOI] [PMC free article] [PubMed] [Google Scholar]
- 59.Greiner-Perth AK, Wilke HJ, Liebsch C. Which spinal fixation technique achieves which degree of stability after thoracolumbar trauma? A systematic quantitative review. Spine J. 2024;S1529-9430(24)01095-7. [DOI] [PubMed]
Associated Data
This section collects any data citations, data availability statements, or supplementary materials included in this article.
Supplementary Materials
Data Availability Statement
No datasets were generated or analysed during the current study.