

ABSTRACT
Background and Purpose
This study aims to assess the disease burden and care quality along with cross‐country inequalities for stroke at global, regional, and national levels from 1990 to 2021.
Methods
Data on stroke were extracted from the Global Burden of Disease (GBD) study 2021 for the globe, five sociodemographic index (SDI) regions, 21 GBD regions, and 204 countries/territories. The disease burden was quantified using the age‐standardized disability‐adjusted life years rate (ASDR). Quality of care (QoC) was evaluated through the age‐standardized QoC index (QCI). To assess cross‐country disparities in both disease burden and age‐standardized QCI, the slope index of inequality (SII) and the concentration index were utilized.
Results
From 1990 to 2021, the global ASDR of stroke decreased from 3078.95 (95% uncertainty interval [UI]: 2893.58, 3237.34) to 1886.20 (95% UI: 1738.99, 2017.90) per 100,000 population, while the age‐standardized QCI improved from 50.79 to 64.61. However, the results of inequalities showed worsening inequalities in both ASDR and QCI, with lower SDI countries shouldering a disproportionate burden and higher SDI countries maintaining higher QoC. The SII and concentration index for ASDR indicated a worsening inequality among lower SDI countries, with SII increasing to −2616.44 and the concentration index increasing to −0.1119 in 2021. Meanwhile, the SII and concentration index for age‐standardized QCI showed a worsening inequality among higher SDI countries, with SII of 27.48 and concentration index of 0.0922 in 2021.
Conclusions
Despite notable global advancements, significant disparities in stroke still exist, particularly in lower SDI regions facing high disease burdens and substandard care.
Keywords: disability‐adjusted life years, global burden of disease, inequality, quality of care, stroke
1. Introduction
Stroke, an acute focal neurological deficit caused by vascular abnormalities, is the second leading cause of death globally, following ischemic heart disease [1, 2]. Between 1990 and 2021, stroke‐related deaths increased by 43.0%, and disability‐adjusted life years (DALYs) rose by 32.17% [2]. Patients affected by stroke encounter unfavorable physical, psychological, and social impacts, which also create a considerable burden on their families and society [3, 4, 5]. Additionally, various neurological complications triggered by stroke, including cerebral edema and epilepsy, would further lead to increased recurrence, disability, and mortality rates [6, 7].
Previous studies have quantified stroke burden at global, regional, and national levels [2, 8]. To effectively utilize this evidence and improve healthcare services, a mediator indicator is needed as a measure of the quality of care (QoC) [9]. The World Health Organization (WHO) describes QoC as how well health services improve desired health outcomes. In line with the Sustainable Development Goals (SDGs), there is an increased focus on enhancing QoC by prioritizing safety, effectiveness, patient‐centeredness, timeliness, efficiency, and equity [10, 11]. A comprehensive investigation of QoC for stroke at global, regional, and national levels can help implement strategies that reduce stroke incidence and its associated risks of mortality and disability. To the best of our knowledge, only a limited number of studies specifically focused on the QoC for stroke. Additionally, the distribution of burden and the QoC for stroke vary across different sociodemographic index (SDI) regions, which are classified based on income, education, and fertility rates, reflecting socioeconomic factors that influence health outcomes [2, 12]. By exploring the QoC for stroke across different regions and countries, and further conducting inequality analysis—an approach recommended by the WHO to assess differences in health outcomes [13]—we can assess disparities in healthcare services for stroke treatment and prevention. This approach could help better resource allocation and attenuate regional inequities and gaps in healthcare system performance, thereby improving stroke‐related burden control.
Based on the above context, this study aims to: (1) describe the disease burden and QoC for stroke at global, regional, and national levels; (2) assess cross‐country inequalities in the burden and QoC for stroke at global and regional levels; and (3) quantify the temporal trends of the burden and QoC for stroke and their inequalities from 1990 to 2021.
2. Methods
2.1. Data Collection
The primary materials in this study were obtained from the GBD 2021, publicly available on the Institute for Health Metrics and Evaluation (IHME) website (https://vizhub.healthdata.org/gbd‐results/). In the GBD framework, stroke is defined as a rapidly developing clinical syndrome of (usually focal) disturbance of cerebral function lasting more than 24 h or leading to death [2]. We extracted six measures for stroke from the GBD 2021 dataset, including age‐standardized incidence, prevalence, deaths, DALYs, years of life lost (YLLs), and years lived with disability (YLDs) rates, stratified by sex, region, and country/territory, from 1990 to 2021. The detailed methodology for the GBD study has been reported in previous studies [14].
2.2. Socio‐Demographic Index
The SDI is a composite indicator used to assess sociodemographic development level, calculated based on the geometric mean of three factors: fertility rates for individuals under 25, educational attainment for those over 15, and income per capita [14, 15]. The SDI is normalized on a scale from zero to one, where zero represents minimal and one represents maximal development relevant to health. Countries are classified into five categories (low, low‐middle, middle, high‐middle, and high) based on their SDI, with the boundaries set at 0, 0.47, 0.62, 0.71, 0.81, and 1.
2.3. Statistical Analysis
2.3.1. Burden Description
The age‐standardized DALYs rate (ASDR) per 100,000 population was described for both sexes across five SDI regions, 21 GBD regions, and 204 countries/territories. The association between SDI and burden/QoC for stroke among 21 GBD regions and 204 countries/territories from 1990 to 2021 was demonstrated through a locally weighted regression model, which elucidated the disparities of stroke burden and healthcare related to socioeconomic development [16].
2.3.2. Quality of Care Index
The QoC index (QCI) was constructed to evaluate the QoC for stroke, which has been validated by previous studies [17, 18]. Utilizing age‐standardized primary measures (incidence, prevalence, deaths, DALYs, YLLs, and YLDs) from the GBD 2021, we generated four secondary indices that indirectly assess the quality of healthcare systems. These indices serve as proxies for evaluating how effectively healthcare systems address the burden of diseases, including (1) prevalence to incidence ratio, (2) mortality‐to‐incidence ratio (MIR), (3) DALY‐to‐prevalence ratio, and (4) YLL‐to‐YLD ratio. The calculation formulas are as follows:
| (1) |
It measures the effectiveness of prevention efforts, with higher values indicating more effective disease management.
| (2) |
It reflects healthcare quality by comparing deaths to new cases. A higher MIR indicates poorer outcomes and underscores the need for improved care [19].
| (3) |
It assesses disease burden relative to the number of cases. Higher ratios show a greater burden per individual.
| (4) |
It compares the fatal impact versus the disabling impact of a disease. A higher ratio suggests more deaths compared to disabilities, where is the name of a region or a country.
Principal component analysis (PCA) was employed to condense four key indices into a single, comprehensive measure, namely QCI. PCA, a technique for reducing data dimensionality, synthesizes a linear combination of datasets into orthogonal components, with the first component capturing the maximum variance [20, 21]. This first component was designated as the QCI, which quantifies QoC on a scale from zero to 100, where higher scores indicate superior care quality. The calculation formula of QCI is as follows:
In this study, we calculated sex‐specific QCI across five SDI regions, 21 GBD regions, and 204 countries/territories.
2.3.3. Cross‐Country Inequality
We utilized the slope index of inequality (SII) and the concentration index to measure the distributive inequality of the burden and QCI for stroke globally and regionally, which are two standard metrics of absolute and relative gradient inequality recommended by WHO [13]. The SII is calculated through a regression model on national rates based on an SDI‐associated scale, representing the midpoint of the cumulative population ranked by SDI. The heteroskedasticity was addressed using a weighted regression model. The concentration index is determined by integrating the area under the Lorenz curve, which is constructed from the cumulative distribution of rates and population by SDI ranking [22]. These indices assess absolute and relative inequalities, respectively, where values further from zero indicate greater inequality. Positive SII and concentration index indicate that the burden/QoC is higher in countries with a higher SDI; if negative, it is higher in lower SDI countries.
2.3.4. Trend Analysis
The estimated annual percentage change (EAPC) was utilized to highlight trends in burden and QCI of stroke, along with inequalities at global and regional levels. EAPC represents the yearly rate of change over a specific period, calculated using a linear regression model [23]. Ranking graphs for QCI showcased the top 20 countries for QoC in 1990 and 2021. Additionally, ranking graphs for the SII and concentration index displayed the rise and fall in rankings, as well as the EAPC for the GBD regions, from 1990 to 2021, revealing the changing patterns of health inequalities among regions. The changing patterns were classified into six categories: worsening inequality among lower SDI countries, improving inequality among lower SDI countries, worsening inequality among higher SDI countries, improving inequality among higher SDI countries, shift to higher burden/QCI among higher SDI countries, and shift to higher burden/QCI among lower SDI countries, with their implications detailed in Table 1.
TABLE 1.
The changing patterns of inequalities from 1990 to 2021 and their implications.
| Pattern | Inequality values | Implication | ||
|---|---|---|---|---|
| 1990 | 2021 | Trend | ||
| Worsening inequality among lower SDI countries | Negative | Negative | Relative increasing | The disease burden or QCI was consistently higher among countries with lower SDI, and this inequality has widened over time |
| Improving inequality among lower SDI countries | Negative | Negative | Relative decreasing | The disease burden or QCI was consistently higher among countries with lower SDI, but this inequality has narrowed over time |
| Worsening inequality among higher SDI countries | Positive | Positive | Relative increasing | The disease burden or QCI was higher among countries with higher SDI, and this inequality has widened over time |
| Improving inequality among higher SDI countries | Positive | Positive | Relative decreasing | The disease burden or QCI was higher among countries with higher SDI, but this inequality has narrowed over time |
| Shift to higher burden/QCI among higher SDI countries | Negative | Positive | / | Initially, the disease burden or QCI was higher among countries with lower SDI, but shifted to being higher among countries with higher SDI by 2021 |
| Shift to higher burden/QCI among lower SDI countries | Positive | Negative | / | Initially, the disease burden or QCI was higher among countries with higher SDI, but shifted to being higher among countries with lower SDI by 2021 |
Abbreviations: QCI, quality of care index; SDI, sociodemographic index.
All statistical analyses were performed in R version 4.3.3 and Stata 17.0. The values of primary indices were reported with 95% uncertainty intervals (UIs), while the SII, concentration index, and EAPC were all presented with their respective 95% confidence intervals (CIs). It signifies statistical significance if the 95% CI excludes zero.
3. Results
3.1. Disease Burden and QoC for Stroke and Their Trends, 1990–2021
3.1.1. ASDR
From 1990 to 2021, the global ASDR decreased from 3078.95 (95% UI: 2893.58, 3237.34) per 100,000 population to 1886.20 (95% UI: 1738.99, 2017.90) per 100,000 population, with an EAPC of −1.77 (95% CI: −1.86, −1.67). This decrease was more pronounced in females than in males, although the ASDR of males in 2021 was higher than that of females (Table 2). Among the five SDI regions, the highest reduction was observed in the high SDI region, which also recorded the lowest ASDR in 2021, at 730.56 (95% UI: 665.87, 786.87) per 100,000 population. In contrast, the low SDI region had the highest ASDR in 2021, at 2463.45 (95% UI: 2198.34, 2736.75) per 100,000 population. Among the 21 GBD regions, high‐income Asia Pacific saw the largest decrease. In 2021, Oceania had the highest ASDR (3657.45 [95% UI: 3015.67, 4394.91]), while Australasia had the lowest (449.31 [95% UI: 402.92, 491.86]). Western Europe also showed a significant decline, with an ASDR of 526.69 (95% UI: 476.82, 568.60) in 2021. In 1990, the five countries with the highest ASDR were the Lao People's Democratic Republic, Nauru, Myanmar, Rwanda, and Tuvalu. By 2021, the top five countries were Nauru, Solomon Islands, Mozambique, Guinea‐Bissau, and Marshall Islands. European countries such as Ireland, France, and Luxembourg showed relatively low ASDR in 2021, with details available in Figure 1 and Table S1.
TABLE 2.
ASDR and QCI of stroke in 2021 with percentage changes from 1990, by sex, SDI regions, and GBD regions.
| ASDR | QCI | |||||
|---|---|---|---|---|---|---|
| 1990 | 2021 | 1990–2021 EAPC (95% CI) | 1990 | 2021 | 1990–2021 EAPC (95% CI) | |
| Global | 3078.95 (2893.58, 3237.34) | 1886.20 (1738.99, 2017.90) | −1.77 (−1.86, −1.67) | 50.79 | 64.61 | 0.87 (0.82, 0.92) |
| Sex | ||||||
| Female | 2789.07 (2599.33, 2980.22) | 1578.38 (1435.01, 1709.24) | −2.07 (−2.17, −1.96) | 55.03 | 69.16 | 0.82 (0.78, 0.87) |
| Male | 3404.17 (3164.83, 3634.12) | 2232.46 (2037.16, 2451.16) | −1.51 (−1.60, −1.41) | 45.41 | 58.64 | 0.92 (0.87, 0.98) |
| SDI regions | ||||||
| High SDI | 1606.41 (1501.94, 1680.51) | 730.56 (665.87, 786.87) | −2.76 (−2.85, −2.66) | 71.09 | 88.31 | 0.76 (0.70, 0.81) |
| High‐middle SDI | 3722.31 (3484.09, 3923.96) | 1985.61 (1793.42, 2184.58) | −2.41 (−2.64, −2.17) | 44.40 | 63.27 | 1.44 (1.27, 1.61) |
| Middle SDI | 3792.42 (3478.33, 4138.17) | 2302.80 (2067.17, 2510.46) | −1.70 (−1.79, −1.62) | 40.60 | 58.62 | 1.24 (1.18, 1.30) |
| Low‐middle SDI | 3182.21 (2942.82, 3402.48) | 2340.82 (2158.25, 2525.62) | −1.03 (−1.06, −0.99) | 43.63 | 52.69 | 0.61 (0.58, 0.63) |
| Low SDI | 3492.28 (3149.77, 3851.99) | 2463.45 (2198.34, 2736.75) | −1.23 (−1.30, −1.17) | 45.86 | 53.49 | 0.52 (0.48, 0.57) |
| GBD regions | ||||||
| High‐income Asia Pacific | 2097.93 (1952.58, 2206.74) | 724.07 (647.55, 792.21) | −3.64 (−3.76, −3.51) | 70.88 | 90.70 | 0.87 (0.82, 0.92) |
| High‐income North America | 961.50 (889.45, 1023.03) | 671.62 (615.66, 726.03) | −1.44 (−1.59, −1.29) | 83.82 | 97.48 | 0.51 (0.41, 0.60) |
| Western Europe | 1509.84 (1411.08, 1575.17) | 526.69 (476.82, 568.60) | −3.52 (−3.63, −3.42) | 65.63 | 85.26 | 0.89 (0.84, 0.94) |
| Australasia | 1146.99 (1067.79, 1216.10) | 449.31 (402.92, 491.86) | −3.17 (−3.28, −3.06) | 70.69 | 86.70 | 0.70 (0.66, 0.74) |
| Andean Latin America | 1796.50 (1635.77, 2022.41) | 901.51 (761.65, 1066.71) | −2.45 (−2.64, −2.26) | 60.22 | 75.18 | 0.78 (0.68, 0.87) |
| Tropical Latin America | 2973.85 (2839.54, 3056.75) | 1147.68 (1077.40, 1198.95) | −3.14 (−3.20, −3.08) | 45.23 | 66.31 | 1.12 (1.05, 1.19) |
| Central Latin America | 1444.17 (1392.61, 1486.62) | 823.56 (744.02, 916.08) | −2.10 (−2.24, −1.96) | 67.18 | 76.63 | 0.49 (0.44, 0.55) |
| Southern Latin America | 2397.98 (2297.07, 2494.57) | 897.56 (840.47, 955.11) | −3.08 (−3.19, −2.96) | 62.93 | 79.99 | 0.71 (0.65, 0.76) |
| Caribbean | 2428.98 (2260.97, 2609.36) | 1687.54 (1466.10, 1939.67) | −1.13 (−1.23, −1.04) | 47.06 | 58.20 | 0.62 (0.55, 0.69) |
| Central Europe | 3743.89 (3610.50, 3859.37) | 1664.84 (1536.84, 1781.27) | −3.05 (−3.22, −2.88) | 42.61 | 61.98 | 1.53 (1.43, 1.63) |
| Eastern Europe | 3897.96 (3753.16, 4003.43) | 2360.72 (2187.08, 2542.05) | −2.42 (−2.90, −1.93) | 42.95 | 57.56 | 1.94 (1.42, 2.47) |
| Central Asia | 3504.49 (3351.69, 3657.22) | 2565.92 (2336.68, 2798.30) | −1.46 (−1.78, −1.14) | 54.65 | 59.64 | 0.58 (0.39, 0.77) |
| North Africa and Middle East | 3644.70 (3293.62, 3988.87) | 2026.61 (1789.98, 2259.62) | −1.97 (−2.04, −1.90) | 42.00 | 59.52 | 1.10 (1.01, 1.19) |
| South Asia | 2453.29 (2190.11, 2684.71) | 1805.10 (1659.80, 1973.10) | −1.05 (−1.12, −0.99) | 46.24 | 54.12 | 0.55 (0.50, 0.60) |
| Southeast Asia | 4434.54 (4050.49, 4818.86) | 3425.26 (3081.41, 3736.56) | −0.82 (−0.92, −0.72) | 44.47 | 51.68 | 0.44 (0.35, 0.52) |
| East Asia | 4794.23 (4224.54, 5361.08) | 2635.43 (2251.83, 3049.73) | −2.04 (−2.22, −1.86) | 32.09 | 58.97 | 2.05 (1.89, 2.22) |
| Oceania | 4714.85 (3878.84, 5643.57) | 3657.45 (3015.67, 4394.91) | −0.86 (−0.89, −0.84) | 37.29 | 43.49 | 0.49 (0.46, 0.53) |
| Western sub‐Saharan Africa | 3706.53 (3259.29, 4166.50) | 2709.30 (2361.64, 3096.34) | −1.07 (−1.15, −0.99) | 52.16 | 59.84 | 0.45 (0.42, 0.49) |
| Eastern sub‐Saharan Africa | 4045.40 (3644.17, 4542.68) | 2665.04 (2331.50, 3012.87) | −1.53 (−1.60, −1.46) | 47.95 | 57.76 | 0.69 (0.65, 0.73) |
| Central sub‐Saharan Africa | 3758.75 (3062.37, 4571.91) | 2947.99 (2291.26, 3714.28) | −0.90 (−0.95, −0.85) | 50.58 | 53.51 | 0.23 (0.19, 0.26) |
| Southern sub‐Saharan Africa | 2263.19 (1972.41, 2498.80) | 2367.24 (2197.24, 2542.20) | 0.29 (−0.15, 0.74) | 70.15 | 62.64 | −0.51 (−0.72, −0.30) |
Abbreviations: ASDR, age‐standardized DALY rate; CI, confidence interval; DALYs, disability‐adjusted life years; EAPC, estimated annual percentage change; GBD, global burden of disease; QCI, quality of care index; SDI, sociodemographic index.
FIGURE 1.
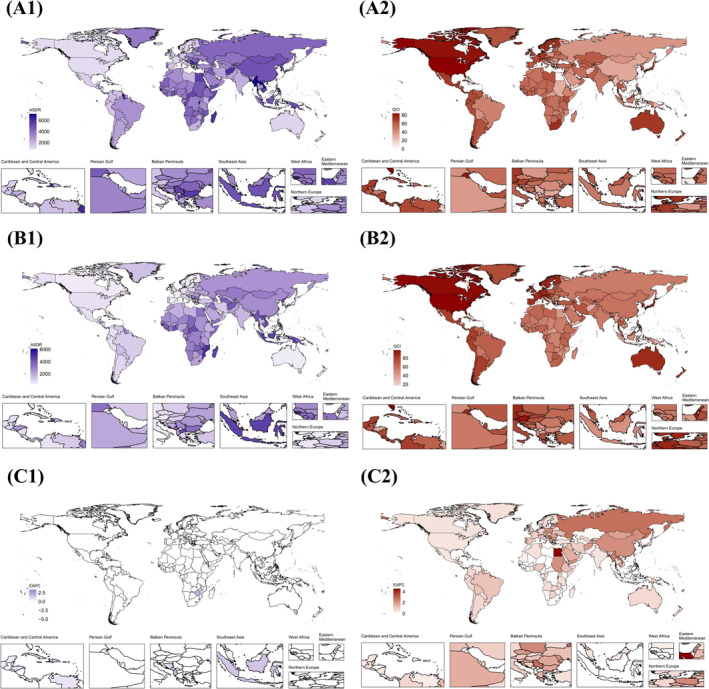
Global maps of ASDR and QCI of stroke from 1990 to 2021. (A1) Global map of ASDR in 1990. (B1) Global map of ASDR in 2021. (C1) Global map of EAPC for ASDR from 1990 to 2021. (A2) Global map of QCI in 1990. (B2) Global map of QCI in 2021. (C2) Global map of EAPC for QCI from 1990 to 2021. Abbreviations: ASDR, age‐standardized DALYs rate; DALYs, disability‐adjusted life years; QCI, quality of care index; EAPC, estimated annual percentage change.
Globally, the ASDR generally decreased with increasing SDI, though regional variations existed. For instance, in Eastern Europe and Central Asia, the ASDR initially rose with increasing SDI, reaching a peak before rapidly declining (Figures 2 and S1).
FIGURE 2.
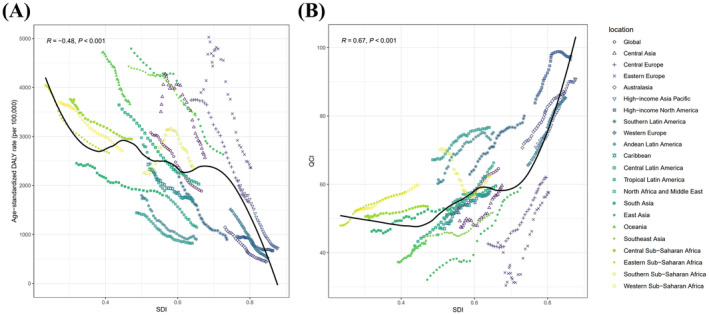
The relation between ASDR and QCI of stroke versus SDI for both sexes, by GBD region, 1990–2021. (A) The relation between ASDR of stroke versus SDI. (B) The relation between QCI of stroke versus SDI. Abbreviations: ASDR, age‐standardized DALYs rate; DALYs, disability‐adjusted life years; QCI, quality of care index; SDI, sociodemographic index; GBD, global burden of disease.
3.1.2. Age‐Standardized QCI
Between 1990 and 2021, the global age‐standardized QCI increased from 50.79 to 64.61, with an EAPC of 0.87 (95% CI: 0.82, 0.92). Although females exhibited a lower increase compared to males, females recorded a higher age‐standardized QCI than males (Table 2). Among the five SDI regions, the high‐middle SDI region showed the most significant increase. In 2021, the high SDI region reported the highest age‐standardized QCI at 88.31, while the low‐middle SDI region recorded the lowest age‐standardized QCI at 52.69. Among the 21 GBD regions, East Asia experienced the most substantial increase. High‐income North America had the highest age‐standardized QCI at 97.48 in 2021, whereas Oceania had the lowest at 43.49 in the same year. Western Europe presented a slight increase in age‐standardized QCI, with a value of 85.26 in 2021. In 1990, the five countries with the highest age‐standardized QCI were the United States, Canada, Kuwait, Singapore, and Andorra, while by 2021, it had changed to the United States, Singapore, Canada, Austria, and Japan. Countries in Europe such as France, Spain, and Denmark showed a high age‐standardized QCI, most of which were greater than 80, with further details provided in Figure 1 and Table S2.
Overall, the global age‐standardized QCI tended to rise with increasing SDI, although variations existed across regions. For example, high‐income North America initially saw a rise with increasing SDI, followed by a sharp decline (Figures 2 and S1).
3.2. Cross‐Country Inequality of Disease Burden and QoC for Stroke and Their Trends, 1990–2021
3.2.1. ASDR
Between 1990 and 2021, the global ASDR exhibited significant absolute and relative cross‐country inequalities, with countries having lower SDIs shouldering a disproportionate burden. Both the SII and the concentration index showed a worsening inequality among lower SDI countries. The SII expanded from −2329.47 (95% CI: −2857.50, −1801.43) in 1990 to −2616.44 (95% CI: −2987.33, −2245.56) in 2021, with an EAPC of −0.22 (95% CI: −0.27, −0.16). The concentration index widened from −0.0819 (95% CI: −0.1143, −0.0495) in 1990 to −0.1119 (95% CI: −0.1478, −0.0759) in 2021, with an EAPC of −0.09 (95% CI: −0.12, −0.06) (Table 3, Figure 3). The worsening trend of the SII was more pronounced in males than in females, but the worsening trend of the concentration index was greater in females than in males. By 2021, the SII of males exceeded that of females, while the concentration index of females exceeded that of males (Table 3, Figure S2).
TABLE 3.
Slope index of inequality and concentration index in global ASDR and QCI of stroke in 2021 and percentage changes from 1990, by sex.
| Sex | Health inequality metrics | Year | ASDR | QCI | ||
|---|---|---|---|---|---|---|
| Value | EAPC (95% CI) | Value | EAPC (95% CI) | |||
| Both | Slope index of inequality | 1990 | −2329.47 (−2857.50, −1801.43) | −0.22 (−0.27, −0.16) | 15.36 (9.73, 20.98) | 0.58 (0.54, 0.61) |
| 2021 | −2616.44 (−2987.33, −2245.56) | 27.48 (22.38, 32.58) | ||||
| Concentration index | 1990 | −0.0819 (−0.1143, −0.0495) | −0.09 (−0.12, −0.06) | 0.0717 (0.0532, 0.0902) | 0.08 (0.07, 0.09) | |
| 2021 | −0.1119 (−0.1478, −0.0759) | 0.0922 (0.0780, 0.1064) | ||||
| Female | Slope index of inequality | 1990 | −2339.71 (−2810.77, −1868.66) | −0.18 (−0.23, −0.13) | 12.06 (6.79, 17.32) | 0.60 (0.56, 0.64) |
| 2021 | −2527.24 (−2866.28, −2188.19) | 23.82 (19.05, 28.59) | ||||
| Concentration index | 1990 | −0.0964 (−0.1286, −0.0641) | −0.16 (−0.20, −0.13) | 0.0688 (0.0510, 0.0865) | 0.07 (0.06, 0.09) | |
| 2021 | −0.1433 (−0.1798, −0.1068) | 0.0850 (0.0711, 0.0990) | ||||
| Male | Slope index of inequality | 1990 | −2203.18 (−2823.55, −1582.81) | −0.30 (−0.38, −0.21) | 18.88 (12.65, 25.11) | 0.59 (0.56, 0.63) |
| 2021 | −2673.70 (−3100.46, −2246.95) | 31.89 (26.31, 37.47) | ||||
| Concentration index | 1990 | −0.0618 (−0.0962, −0.0275) | −0.04 (−0.08, −0.01) | 0.0769 (0.0556, 0.0983) | 0.10 (0.08, 0.11) | |
| 2021 | −0.0819 (−0.1207, −0.0430) | 0.1046 (0.0883, 0.1210) | ||||
Abbreviations: ASDR, age‐standardized DALY rate; DALYs, disability‐adjusted life years; EAPC, estimated annual percentage change; QCI, quality of care index.
FIGURE 3.
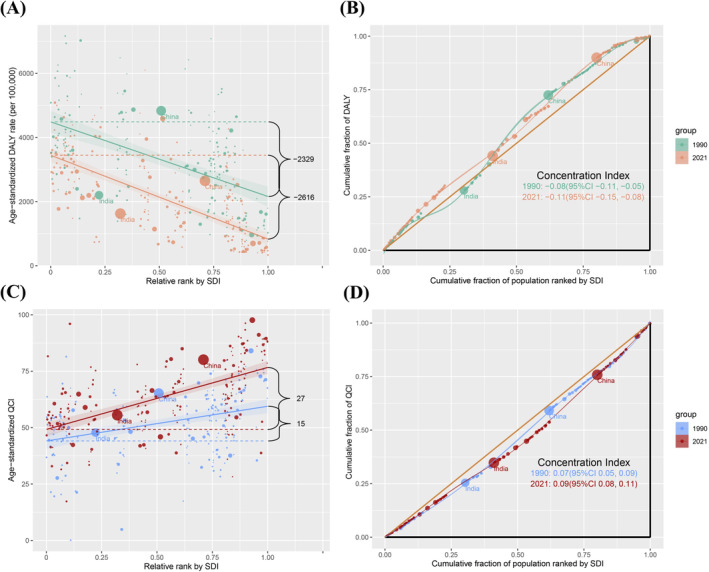
Absolute and relative cross‐country inequality in ASDR and QCI of stroke for both sexes, 1990–2021. (A) Health inequality regression curves for ASDR of stroke. (B) Concentration curves for ASDR of stroke. (C) Health inequality regression curves for QCI of stroke. (D) Concentration curves for QCI of stroke. Abbreviations: ASDR, age‐standardized DALYs rate; DALYs, disability‐adjusted life years; QCI, quality of care index; SDI, sociodemographic index.
Among the five SDI regions, the high, high‐middle, and middle SDI regions displayed an improving inequality among lower SDI countries, with the high SDI region showing the most significant improving trend in SII and concentration index. The low SDI region exhibited a shift to higher burden among lower SDI countries for both SII and concentration index. The low‐middle SDI region's SII showed a shift to higher burden among lower SDI countries, and its concentration index exhibited a worsening inequality among lower SDI countries. It is worth noting that the absolute values of concentration index in 2021 are smaller than in 1990 in all SDI regions except low‐middle and low SDI regions. By 2021, the middle SDI region had the largest SII and concentration index, recorded at −547.28 (95% CI: −1333.87, 239.31) and − 0.0987 (95% CI: −0.2047, 0.0073), respectively (Figure 4, Table S3). In the GBD regions, changing patterns varied widely, but most regions exhibited a worsening inequality among lower SDI countries in both SII and concentration index. In 2021, Oceania had the largest absolute inequality (SII: −3605.30 [95% CI: −8109.66, 899.05]), and the Caribbean had the greatest relative inequality (concentration index: −0.2941 [95% CI: −0.3732, −0.2150]). In contrast, Western Europe showed an improving inequality among lower SDI countries in both SII and concentration index (Figure 5, Table S3).
FIGURE 4.
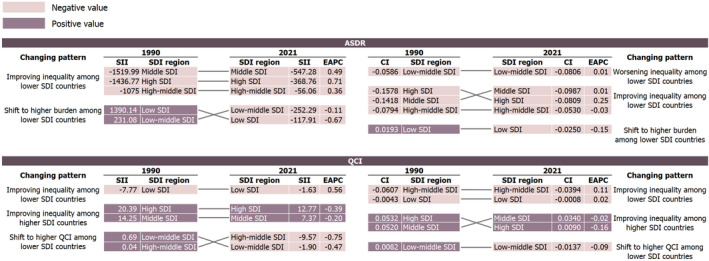
Ranking graphs and changing patterns for SII and concentration index in ASDR and QCI of stroke among SDI regions for both sexes, 1990–2021. Abbreviations: ASDR, age‐standardized DALYs rate; DALYs, disability‐adjusted life years; QCI, quality of care index; SDI, sociodemographic index; SII, slope index of inequality; CI, concentration index; EAPC, estimated annual percentage change.
FIGURE 5.
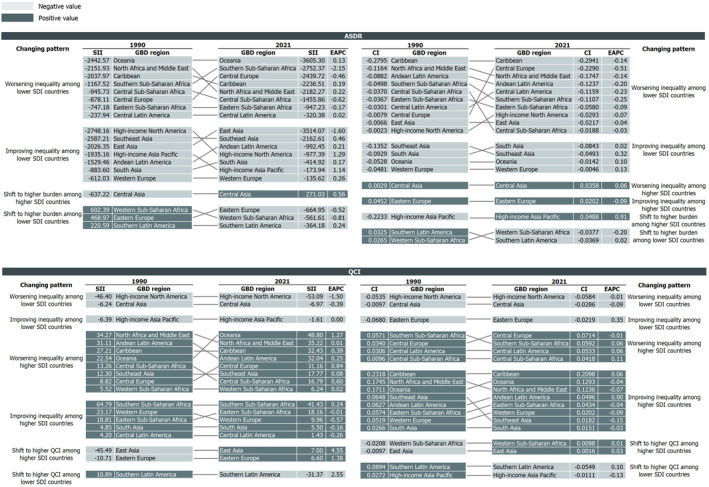
Ranking graphs and changing patterns for SII and concentration index in ASDR and QCI of stroke among GBD regions for both sexes, 1990–2021. Abbreviations: ASDR, age‐standardized DALYs rate; DALYs, disability‐adjusted life years; QCI, quality of care index; GBD, global burden of disease; SII, slope index of inequality; CI, concentration index; EAPC, estimated annual percentage change.
3.2.2. Age‐Standardized QCI
Globally, the age‐standardized QCI demonstrated clear absolute and relative cross‐country inequalities, with higher SDI countries holding a higher care quality. The global SII and concentration index both exhibited a worsening inequality among higher SDI countries. The SII expanded from 15.36 (95% CI: 9.73, 20.98) in 1990 to 27.48 (95% CI: 22.38, 32.58) in 2021, with an EAPC of 0.58 (95% CI: 0.54, 0.61). The concentration index increased from 0.0717 (95% CI: 0.0532, 0.0902) in 1990 to 0.0922 (95% CI: 0.0780, 0.1064) in 2021, with an EAPC of 0.08 (95% CI: 0.07, 0.09) (Table 3, Figure 3). The expansion trend of the SII was more pronounced in males than in females, and the increase in the concentration index was greater in males than in females. By 2021, the SII of males exceeded that of females, and the concentration index of males also surpassed that of females (Table 3, Figure S2).
In the five SDI regions, the high SDI and middle SDI regions demonstrated improving inequalities among higher SDI countries in both SII and concentration index, with the most significant improvement observed in the high region. The high‐middle SDI regions exhibited a shift to higher QCI among lower SDI countries in SII while improving inequality among lower SDI countries in concentration index. The low‐middle SDI region exhibited a shift to higher QCI among lower SDI countries for both SII and concentration index. The low SDI region showed an improving inequality among lower SDI countries in SII and concentration index. As seen from Figure 4 and Table S4, the high and high‐middle SDI regions had the highest SII and concentration index in 2021, respectively, at 12.77 (95% CI: 3.61, 21.94) and −0.0394 (95% CI: −0.0504, −0.0284). Within the GBD regions, changing patterns varied widely, but most regions exhibited a worsening inequality among higher SDI countries in SII and improving inequality among higher SDI countries in the concentration index. In 2021, High‐income North America exhibited the greatest absolute inequality (SII: −53.09 [95% CI: −168.31, 62.12]), and the Caribbean showed the largest relative inequality (concentration index: 0.2098 [95% CI: 0.1439, 0.2757]). On the contrary, Western Europe exhibited an improving inequality among higher SDI countries in both SII and concentration index as shown in Figure 5 and Table S4.
4. Discussion
To the best of our knowledge, this study is the first to simultaneously assess the QoC and burden for stroke at global, regional, and national levels using the GBD 2021 dataset across global, regional, and national scales. By applying WHO‐recommended inequality analysis methods, it not only delineates the distribution of stroke burden disparities but also explores variations in QoC across different socioeconomic and geographic contexts.
Our study documented substantial global improvements in stroke management from 1990 to 2021, evidenced by a significant decrease in the ASDR by 38.73% and an increase in the QCI by 27.21%. These advancements are thought to be largely attributable to the widespread implementation of evidence‐based guidelines for stroke prevention and management, including enhanced use of statins and antihypertensives, as promoted by global health organizations like the WHO [24, 25]. Furthermore, enhancements in healthcare infrastructure, such as the expansion of specialized stroke units and integration of advanced technologies, have significantly improved stroke management and patients' prognosis [26, 27]. Additionally, public health initiatives aimed at increasing awareness about the urgency of stroke symptoms have further contributed to these positive trends [28, 29]. Regionally, substantial reductions in ASDR and significant increases in QCI predominantly occurred in high and high‐middle SDI regions, whereas low SDI regions continued to grapple with high disease burdens and poorer healthcare quality, reflecting persistent regional disparities. Western European countries, most of which are high or high‐middle SDI nations, exhibited a low ASDR and high QCI with an improving trend, highlighting the impact of socioeconomic development on stroke care [30]. In contrast, Oceania exhibited a higher burden and lower QoC. These disparities are exacerbated by inequalities in healthcare access and quality, economic constraints, and insufficient public health infrastructure [31, 32].
Despite the global improvements in stroke management, our analysis revealed persistent and significant cross‐country inequalities, particularly in lower SDI countries, which bore a disproportionate burden. The ASDR showed a worsening inequality among lower SDI countries, with both the SII and concentration index expanding. Additionally, the QCI showed a worsening inequality among higher SDI countries according to the SII and concentration index. Lower SDI countries often encounter challenges like underfunded healthcare systems, a limited number of medical professionals, and restricted access to advanced technologies, which may exacerbate the stroke burden [33].
In terms of regions, our analysis reveals significant disparities in stroke outcomes across SDI and GBD regions. While higher SDI regions have seen improvements and reduced inequalities in ASDR and QCI, low and low‐middle SDI regions faced worsening trends and increasing disparities. Notably, the reduction in the absolute values of the SII and concentration index across most regions indicated the effectiveness of targeted interventions such as increased healthcare funding, enhanced training, and infrastructure development, primarily in higher SDI regions [34]. For instance, in Europe, the Stroke Action Plan for Europe (SAP‐E) 2018–2030 aims to improve stroke care by enhancing access to specialized stroke units and promoting national stroke plans [35]. Similarly, the Paul Coverdell National Acute Stroke Program (PCNASR) in the United States, initiated by the CDC in 2001, aims to improve stroke care through standardized treatment protocols and state‐level stroke registries, which are supported by global health initiatives and international cooperation [36, 37]. However, the continuing gaps in low SDI regions highlight the critical need for sustained, focused interventions to ensure equitable improvements in stroke care worldwide. To address these challenges, it is essential to increase international health funding and expand community‐based awareness programs while implementing policies that ensure equitable resource distribution [38, 39].
The strengths of this study lie in its pioneering approach to assess the QoC for stroke across global, regional, and national levels using the comprehensive and detailed GBD 2021 dataset. The application of inequality analysis methods allows for a nuanced exploration of stroke burden disparities and variations in QoC across diverse socioeconomic contexts. Additionally, the use of GBD data ensures a high level of reliability and comparability across different regions due to its standardized methodology for data collection and analysis. While this study employs robust data and innovative methods, it still has several limitations. First, the reliance on GBD data may introduce inconsistencies due to potential instabilities and revisions in data collection methods over time [9, 11]. Second, the inequality analysis is limited to 19 GBD regions due to the small number of countries in regions like Australasia and Tropical Latin America. Lastly, the generalizability of findings is constrained, as conclusions drawn from GBD data may not fully apply to specific local or regional contexts due to the undetailed variations in healthcare systems, cultural influences, and socioeconomic conditions at finer dimensions. These limitations necessitate a cautious interpretation of the results and underscore the need for further research to refine methodologies and expand the analysis scopes.
In summary, this study systematically analyzed cross‐country inequalities in disease burden and care quality of stroke from 1990 to 2021. Despite notable global advancements, significant disparities persist, particularly in lower SDI regions bearing high disease burdens and substandard care. These discrepancies stem from variations in healthcare access, infrastructure quality, and policy implementation. Addressing these challenges requires targeted interventions to improve resource allocation, healthcare training, and infrastructure, especially in under‐resourced areas.
Author Contributions
Zeyu Luo: software, data curation, writing – original draft, methodology, validation. Denan Jiang: writing – review and editing. Shiyi Shan: writing – review and editing. Jiali Zhou: writing – review and editing. Weidi Sun: writing – review and editing. Jing Wu: writing – review and editing. Jiayao Ying: writing – review and editing. Liying Zhou: writing – review and editing. Yajie Zhu: writing – review and editing. Peige Song: conceptualization, supervision, resources, writing – review and editing, methodology, validation. Kazem Rahimi: writing – review and editing.
Ethics Statement
Data were obtained from GBD. This study did not involve any personal or sensitive information. Consequently, no ethical approval was required for the execution of this study.
Conflicts of Interest
The authors declare no conflicts of interest.
Supporting information
Data S1.
Funding: The authors received no specific funding for this work.
Data Availability Statement
Data used for the analyses of this study are available from the GBD 2021 online database (https://vizhub.healthdata.org/gbd‐results/).
References
- 1. World Health Organization , “Guidelines for Management of Stroke,” 2012.
- 2. GBD 2021 Stroke Risk Factor Collaborators , “Global, Regional, and National Burden of Stroke and Its Risk Factors, 1990–2021: A Systematic Analysis for the Global Burden of Disease Study 2021,” Lancet Neurology 23, no. 10 (2024): 973–1003, 10.1016/s1474-4422(24)00369-7. [DOI] [PubMed] [Google Scholar]
- 3. Bucki B., Spitz E., and Baumann M., “Emotional and Social Repercussions of Stroke on Patient‐Family Caregiver Dyads: Analysis of Diverging Attitudes and Profiles of the Differing Dyads,” PLoS One 14, no. 4 (2019): e0215425, 10.1371/journal.pone.0215425. [DOI] [PMC free article] [PubMed] [Google Scholar]
- 4. Kusec A., Milosevich E., Williams O. A., et al., “Long‐Term Psychological Outcomes Following Stroke: The OX‐CHRONIC Study,” BMC Neurology 23, no. 1 (2023): 426, 10.1186/s12883-023-03463-5. [DOI] [PMC free article] [PubMed] [Google Scholar]
- 5. Tang E., Moran N., Cadman M., Hill S., Sloan C., and Warburton E., “Stroke Rehabilitation in Adults: Summary of Updated NICE Guidance,” BMJ (Clinical Research Ed.) 384 (2024): q498, 10.1136/bmj.q498. [DOI] [PubMed] [Google Scholar]
- 6. Gu Y., Zhou C., Piao Z., et al., “Cerebral Edema After Ischemic Stroke: Pathophysiology and Underlying Mechanisms,” Frontiers in Neuroscience 16 (2022): 988283, 10.3389/fnins.2022.988283. [DOI] [PMC free article] [PubMed] [Google Scholar]
- 7. Zöllner J. P., Schmitt F. C., Rosenow F., et al., “Seizures and Epilepsy in Patients With Ischaemic Stroke,” Neurological Research and Practice 3, no. 1 (2021): 63, 10.1186/s42466-021-00161-w. [DOI] [PMC free article] [PubMed] [Google Scholar]
- 8. Ma Q., Li R., Wang L., et al., “Temporal Trend and Attributable Risk Factors of Stroke Burden in China, 1990–2019: An Analysis for the Global Burden of Disease Study 2019,” Lancet Public Health 6, no. 12 (2021): e897–e906, 10.1016/s2468-2667(21)00228-0. [DOI] [PMC free article] [PubMed] [Google Scholar]
- 9. Aghababaie‐Babaki P., Malekpour M. R., Mohammadi E., et al., “Global, Regional, and National Burden and Quality of Care Index (QCI) of Bipolar Disorder: A Systematic Analysis of the Global Burden of Disease Study 1990–2019,” International Journal of Social Psychiatry 69, no. 8 (2023): 1958–1970, 10.1177/00207640231182358. [DOI] [PubMed] [Google Scholar]
- 10. Agency for HealthcareResearch and Quality , “Six Domains of Healthcare Quality,” accessed January 7, 2025, https://www.ahrq.gov/talkingquality/measures/six‐domains.html.
- 11. Geng J., Zhao J., Fan R., et al., “Global, Regional, and National Burden and Quality of Care of Multiple Myeloma, 1990–2019,” Journal of Global Health 14 (2024): 04033, 10.7189/jogh.14.04033. [DOI] [PMC free article] [PubMed] [Google Scholar]
- 12. Prust M. L., Forman R., and Ovbiagele B., “Addressing Disparities in the Global Epidemiology of Stroke,” Nature Reviews. Neurology, no. 4 (2024): 207–221), 10.1038/s41582-023-00921-z. [DOI] [PubMed] [Google Scholar]
- 13. World Health Organization , Handbook on Health Inequality Monitoring With a Special Focus on Low‐ and Middle‐Income Countries (Geneva, Switzerland: World Health Organization, 2013). [Google Scholar]
- 14. GBD 2021 Diseases and Injuries Collaborators , “Global Incidence, Prevalence, Years Lived With Disability (YLDs), Disability‐Adjusted Life‐Years (DALYs), and Healthy Life Expectancy (HALE) for 371 Diseases and Injuries in 204 Countries and Territories and 811 Subnational Locations, 1990–2021: A Systematic Analysis for the Global Burden of Disease Study 2021,” Lancet 403, no. 10440 (2024): 2133–2161, 10.1016/s0140-6736(24)00757-8. [DOI] [PMC free article] [PubMed] [Google Scholar]
- 15. IHME|GHDx , Global Burden of Disease Study 2021 (GBD 2021) Socio‐Demographic Index (SDI) 1950–2021 (Seattle, CA: Institute for Health Metrics and Evaluation (IHME), 2024), https://ghdx.healthdata.org/record/global‐burden‐disease‐study‐2021‐gbd‐2021‐socio‐demographic‐index‐sdi‐1950%E2%80%932021. [Google Scholar]
- 16. Leong Y. Y. and Yue J. C., “A Modification to Geographically Weighted Regression,” International Journal of Health Geographics 16, no. 1 (2017): 11, 10.1186/s12942-017-0085-9. [DOI] [PMC free article] [PubMed] [Google Scholar]
- 17. Mohammadi E., Ghasemi E., Azadnajafabad S., et al., “A Global, Regional, and National Survey on Burden and Quality of Care Index (QCI) of Brain and Other Central Nervous System Cancers; Global Burden of Disease Systematic Analysis 1990–2017,” PLoS One 16, no. 2 (2021): e0247120, 10.1371/journal.pone.0247120. [DOI] [PMC free article] [PubMed] [Google Scholar]
- 18. Keykhaei M., Masinaei M., Mohammadi E., et al., “A Global, Regional, and National Survey on Burden and Quality of Care Index (QCI) of Hematologic Malignancies; Global Burden of Disease Systematic Analysis 1990–2017,” Experimental Hematology & Oncology 10, no. 1 (2021): 11, 10.1186/s40164-021-00198-2. [DOI] [PMC free article] [PubMed] [Google Scholar]
- 19. Asadzadeh Vostakolaei F., Karim‐Kos H. E., Janssen‐Heijnen M. L. G., Visser O., Verbeek A. L. M., and Kiemeney L. A., “The Validity of the Mortality to Incidence Ratio as a Proxy for Site‐Specific Cancer Survival,” European Journal of Public Health 21, no. 5 (2011): 573–577, 10.1093/eurpub/ckq120. [DOI] [PubMed] [Google Scholar]
- 20. Rencher A. C., “Methods of Multivariate Analysis, Second Edition,” IIE Transactions 37, no. 11 (2005): 1083–1085, 10.1080/07408170500232784. [DOI] [Google Scholar]
- 21. Ringnér M., “What Is Principal Component Analysis?,” Nature Biotechnology 26, no. 3 (2008): 303–304, 10.1038/nbt0308-303. [DOI] [PubMed] [Google Scholar]
- 22. Cao F., He Y. S., Wang Y., et al., “Global Burden and Cross‐Country Inequalities in Autoimmune Diseases From 1990 to 2019,” Autoimmunity Reviews 22, no. 6 (2023): 103326, 10.1016/j.autrev.2023.103326. [DOI] [PubMed] [Google Scholar]
- 23. Fay M. P., Tiwari R. C., Feuer E. J., and Zou Z., “Estimating Average Annual Percent Change for Disease Rates Without Assuming Constant Change,” Biometrics 62, no. 3 (2006): 847–854, 10.1111/j.1541-0420.2006.00528.x. [DOI] [PubMed] [Google Scholar]
- 24. American Heart Association , “New Guidelines for the Primary Stroke Prevention: A Closer Step Toward Personalized Medicine,” accessed January 7, 2025, https://professional.heart.org/en/science‐news/guidelines‐for‐the‐primary‐prevention‐of‐stroke/Commentary.
- 25. Randel A., “AHA and ASA Release Guideline for Prevention of Future Stroke in Patients With Stroke or TIA,” American Family Physician 92 (2015): 11. [Google Scholar]
- 26. Pross C., Berger E., Siegel M., Geissler A., and Busse R., “Stroke Units, Certification, and Outcomes in German Hospitals: A Longitudinal Study of Patient‐Based 30‐Day Mortality for 2006–2014,” BMC Health Services Research 18, no. 1 (2018): 880, 10.1186/s12913-018-3664-y. [DOI] [PMC free article] [PubMed] [Google Scholar]
- 27. Rodgers H. and Price C., “Stroke Unit Care, Inpatient Rehabilitation and Early Supported Discharge,” Clinical Medicine 17, no. 2 (2017): 173–177, 10.7861/clinmedicine.17-2-173. [DOI] [PMC free article] [PubMed] [Google Scholar]
- 28. Gardois P., Booth A., Goyder E., and Ryan T., “Health Promotion Interventions for Increasing Stroke Awareness in Ethnic Minorities: A Systematic Review of the Literature,” BMC Public Health 14 (2014): 409, 10.1186/1471-2458-14-409. [DOI] [PMC free article] [PubMed] [Google Scholar]
- 29. Morrow A., Miller C. B., and Dombrowski S. U., “Can People Apply ‘FAST’ When It Really Matters? A Qualitative Study Guided by the Common Sense Self‐Regulation Model,” BMC Public Health 19, no. 1 (2019): 643, 10.1186/s12889-019-7032-6. [DOI] [PMC free article] [PubMed] [Google Scholar]
- 30. Bray B. D., Paley L., Hoffman A., et al., “Socioeconomic Disparities in First Stroke Incidence, Quality of Care, and Survival: A Nationwide Registry‐Based Cohort Study of 44 Million Adults in England,” Lancet Public Health 3, no. 4 (2018): e185–e193, 10.1016/s2468-2667(18)30030-6. [DOI] [PMC free article] [PubMed] [Google Scholar]
- 31. NHS England , “Tackling Inequalities in Healthcare Access, Experience, and Outcomes,” accessed January 7, 2025, https://www.england.nhs.uk/publication/tackling‐inequalities‐in‐healthcare‐access‐experience‐and‐outcomes/.
- 32. Alamneh T. S., Teshale A. B., Yeshaw Y., et al., “Socioeconomic Inequality in Barriers for Accessing Health Care Among Married Reproductive Aged Women in Sub‐Saharan African Countries: A Decomposition Analysis,” BMC Women's Health 22, no. 1 (2022): 130, 10.1186/s12905-022-01716-y. [DOI] [PMC free article] [PubMed] [Google Scholar]
- 33. Iqbal U., Rabrenovic M., and Li Y. J., “Health Care Quality Challenges in Low‐ and Middle‐Income Countries,” International Journal for Quality in Health Care: Journal of the International Society for Quality in Health Care 31, no. 3 (2019): 165, 10.1093/intqhc/mzz031. [DOI] [PubMed] [Google Scholar]
- 34. Clarke G. M., Conti S., Wolters A. T., and Steventon A., “Evaluating the Impact of Healthcare Interventions Using Routine Data,” BMJ (Clinical Research Ed) 365 (2019): l2239, 10.1136/bmj.l2239. [DOI] [PMC free article] [PubMed] [Google Scholar]
- 35. The Lancet Neurology, “A Unified European Action Plan on Stroke,” Lancet Neurology 19, no. 12 (2020): 963, 10.1016/s1474-4422(20)30409-9. [DOI] [PubMed] [Google Scholar]
- 36. Centers for Disease Control and Prevention , “About Paul Coverdell National Acute Stroke Program,” accessed January 7, 2025, https://www.cdc.gov/coverdell/php/about/.
- 37. Deloitte Insights , “New Era of Global Public Health Partnerships,” accessed January 7, 2025, https://www2.deloitte.com/us/en/insights/industry/public‐sector/government‐trends/2022/global‐health‐partnerships‐collaboration.html.
- 38. IFPMA , “What It Takes to Enable Tech Transfer Partnerships,” 2022, https://www.ifpma.org/insights/what‐it‐takes‐to‐enable‐tech‐transfer‐partnerships/.
- 39. World Health Organization , “WHO's 7 Policy Recommendations on Building Resilient Health Systems,” accessed January 7, 2025, https://www.who.int/news/item/19‐10‐2021‐who‐s‐7‐policy‐recommendations‐on‐building‐resilient‐health‐systems.
Associated Data
This section collects any data citations, data availability statements, or supplementary materials included in this article.
Supplementary Materials
Data S1.
Data Availability Statement
Data used for the analyses of this study are available from the GBD 2021 online database (https://vizhub.healthdata.org/gbd‐results/).