

Abstract
Herein, we demonstrate a one-step, scalable, solution-processed method for the growth of nickel sulfide (NiS) nanostructures using single-source precursors (SSPs) on a flexible substrate as a versatile framework for simultaneous detection of four DNA nucleobases. The as-grown NiS nanostructures exhibit a broad bandgap range and spherical morphology with high surface area and significant porosity, as confirmed by SEM, TEM, and BET surface area analysis. Consequently, the NiS/Ni-foam electrode exhibited remarkable electrochemical performance toward the oxidation of A, G, T, and C due to its large surface area, high electrode activity, and efficient electron transfer capacity. Under the optimum conditions, the electrode demonstrated selective and simultaneous detection of all four nucleobases over a wide linear range from 200 to 1000 μM for A and G, and 50 to 500 μM for T and C, with a low limit of detection of 159 μM for A, 147.6 μM for G, 16.8 μM for T, and 45.9 μM for C, along with high sensitivity of 1.2 × 10⁻⁴ A M–1 for A, 6.1 × 10⁻⁴ A M–1 for G, 1.2 × 10⁻³ A M–1 for T, and 3.0 × 10⁻⁴ A M–1 for C. The as-fabricated electrode revealed excellent reproducibility and stability toward nucleobase detection and demonstrated a reliable DPV response under different bending and twisting conditions. For immediate practical application, NiS/Ni-foam was utilized to quantify the concentration of all nucleobases in calf thymus and Escherichia coli (E. coli) DNA, resulting in a (G + C)/(A + T) ratio of 0.79 and 1.10, respectively. This simple, cost-effective, and flexible NiS/Ni-foam electrode paves the way for the development of non-invasive, wearable biosensors for potential applications in early disease detection.
1. Introduction
Flexible wearable biosensors offer innovative solutions and have received significant attention for their promising applications in personalized health monitoring.1,2 In pursuit of insights into human physiology at the molecular level, these sensors allow continuous, real-time, non-invasive detection of deoxyribonucleic acid (DNA) and other small biomolecules.3 DNA is a one-dimensional polymer composed of four nucleobases, namely adenine (A), guanine (G), cytosine (C), and thymine (T).4 The abnormal changes in DNA nucleobase content can serve as a key indicator for cancer,5 AIDS,6 and diseased growth.7 According to Chargaff’s rule, the ratio of purine to pyrimidine [(G + C)/(A + T)] is specific for different organisms. For instance, the ratios for yeast (Saccharomyces cerevisiae) and ox (Bos taurus) are 1.0 and 1.1, suggesting that the ox DNA has stronger dsDNA interactions compared to yeast DNA.8 The Chargaff’s coefficient for healthy DNA amounts to ≈1, while for a DNA sample of a breast cancer patient,9 it is observed to be 0.6. Hence, this ratio plays a pivotal role in early disease detection. Therefore, detailed analysis and simultaneous detection of all four nucleobases are essential.
In contrast to conventional analytical methods for DNA nucleobase detection,10−12 the well-established electrochemical technique offers several advantages, including high performance, portability, rapid response times, simplicity, and low-cost fabrication. Recently, single-walled carbon nanohorns and nanocellulose,13 silver nanoparticle-β-cyclodextrin-graphene nanocomposites,14 MWCNT-Fe3O4@PDA-Ag nanocomposites,15 and trithiane silver-nanoparticle-decorated polyaniline nanofibers16 have been reported for the detection of A and G. However, the detection of C and T remains challenging due to their slow electron transfer kinetics.17,18 Additionally, the ease of adsorption onto electrode surfaces before and after oxidation gives rise to surface fouling, causing reduced reproducibility.19,20 In order to overcome these shortcomings, there is an urgent need to explore active electrode materials with a flexible structure, wide potential window, and high electrocatalytic activity, which enable simultaneous detection of all four nucleobases. When combined with flexible biosensors such as wearable devices, electrochemical detection provides an added advantage toward personalized and adaptable health monitoring and point-of-care diagnostics. Recent studies have identified the presence of nucleic acid in human sweat, with the representation of all chromosomes as well as mitochondrial DNA, indicating that sweat could be the source of nucleic acid biomarkers related to chronic and neurodegenerative diseases.21−23 Moreover, biosensors have predominantly found applications in stress hormone,24 glucose,25 and monkeypox virus detection.26,27
Commercialization of integrated electrochemical biosensors for point-of-care analysis relies on improvements in long-term stability, sensitivity, reproducibility, and primarily, low-cost materials and easy fabrication routes.28 Next-generation biosensors based on the emerging class of 2D layered materials, such as transition metal dichalcogenides (TMDCs), with tunable band gaps and the ability to downscale to atomic thin layers, enhance flexibility, electron mobility, and ionic conductivity.29 Moreover, the exotic properties, such as an extremely high density of active surface sites over a large area, make them highly desirable candidates for a wide range of applications, including solar cells,30 dye degradation,31,32 oxygen evolution reaction (OER),33 energy storage,34 and flexible biochemical sensing.35 Among TMDCs, NiS (nickel sulfide) is an earth-abundant material and has gained interest among the group of metal sulfides because of its various stoichiometries (Ni3S2, Ni3S4, and Ni6S5) and superior electron transport properties.36 Each phase of nickel sulfide offers distinct advantages, and particularly, binary NiS demonstrates enhanced electrocatalytic properties due to its high electronic conductivity, rich redox chemistry, and diverse atomic configurations, making it a promising material for biosensing applications.37,38 The large-scale deposition of NiS on flexible substrates has been challenging because of limitations in deposition techniques like exfoliation and chemical vapor deposition (CVD).39 The high deposition temperatures of the CVD technique are not suitable for the thermal limitations of many flexible substrates. However, a solution-processable technique offers several advantages, enabling simple and low-temperature processing, easy modulation of stoichiometry, and controlled growth.40,41 Among the various deposition methods, the solvothermal route is superior for the synthesis of metal sulfides on flexible substrates. However, most studies on NiS deposition have focused on the dual-source precursors (DSPs), while only a few have explored the single-source precursor (SSP) route. Compared to DSPs, SSPs offer several advantages, including cost-effectiveness, high purity, precise control over morphology, ease of handling, and the ability to enable binder-free deposition without the need for harmful stabilizers or reducing agents.42,43 Additionally, this route negates the key thermal budget requirement for most of the flexible substrates, providing a cost-effective, scalable, industrially compatible processing suitable for wearable sensors.
In this study, we report a single-step procedure for fabricating nanostructured NiS on a flexible Ni-foam substrate at low temperature using Ni[S2P(OC3H7)2] as a precursor via a solution-processable route for the simultaneous detection of four DNA nucleobases. The developed electrode enables the electrochemical detection of all four nucleobases with a wide linear range, a low limit of detection, high sensitivity, excellent stability, reproducibility, and flexibility. Additionally, it was further utilized to detect nucleobases in ds-calf thymus and E. coli DNA, and the (G + C)/(A + T) ratio was determined by the standard addition method. This study paves the way for the fabrication of simple, scalable, and high-performance biosensing devices as a viable platform for flexible and efficient sensing technologies.
2. Experimental Section
2.1. Materials
Double-stranded DNA (ds-DNA) from calf thymus, nucleobases (adenine, guanine, cytosine, and thymine), nickel(II) chloride hexahydrate (NiCl2·6H2O), and nickel foam (Ni-foam) were procured from Sigma-Aldrich. Ethylene glycol (C2H6O2), potassium chloride (KCl), sodium hydroxide (NaOH), potassium ferricyanide [Fe(CN)6]3–, and hydrochloric acid (HCl) were purchased from S D Fine-Chem Limited. Phosphate-buffered saline (PBS, pH 7.4) was procured from HI Media and used as a supporting electrolyte. The standard stock solutions (200 μM) of A, T, and C were prepared in deionized water (DI), while a stock solution of 1 mM guanine was prepared in 0.1 M NaOH. Other reagents, such as glucose, uric acid, ascorbic acid, lauric acid, KCl, KI, and FeCl2, were procured from SD Fine Chem Limited. All used chemicals were of analytical reagent grade, and aqueous solutions were freshly prepared using Milli-Q water. E. coli genomic DNA was isolated from DH5α cells grown in overnight culture, followed by a standard SDS-proteinase K-based lysis and 70% ethanol-assisted desalting procedure.44
2.2. Characterization
The as-synthesized NiS/Ni-foam was characterized by X-ray diffraction (XRD) analysis utilizing the Rigaku Smart Lab instrument (λ = 1.54 Å) with Cu Kα radiation. The Raman spectra were studied using a Raman spectrometer (Bruker Multi-RAM) with an excitation wavelength of 514 nm. The detailed analysis of the surface morphology and elemental composition of the thin film was conducted using field emission scanning electron microscopy (FE-SEM), energy dispersive X-ray spectroscopy (EDX) (JEOL-JSM 6360A), and transmission electron microscopy (TEM) JEM-2010 (JEOL, Japan) at an accelerating voltage of 200 kV. The surface area and N2 adsorption–desorption isotherm measurements were recorded on Micromeritics ASAP 2020. X-ray photoelectron spectroscopy (XPS) was performed on an Axis Supra Spectro (Kratos Analytical) spectrometer equipped with a monochromatized Al Kα source (1486.69 eV). The surface zeta potentials were obtained with a Zetasizer Nano S90 (Malvern Panalytical Ltd.). Electrochemical analysis, cyclic voltammetry (CV) and differential pulse voltammetry (DPV), were carried out using Klyte 2.0 electrochemical workstation. The Nova 2.1.6 Autolab Metrohm instrument was employed to conduct electrochemical impedance spectroscopic (EIS) studies.
2.3. In-Situ Growth of Nanostructured NiS on Flexible Ni-foam Using SSPs
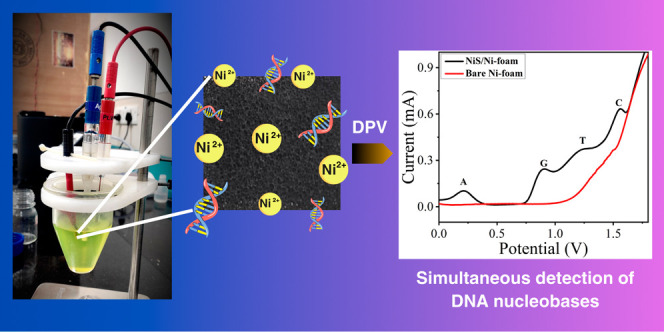
The NiS nanostructures were grown on the porous Ni-foam using a novel SSP-based solution-processable route as reported in our previous work.38 Ni-foam was cleaned by ultrasonication in three different solutions of acetone, ethanol, and 3 M HCl, respectively, for 15 min and was finally rinsed with DI water and dried in an oven at 60 °C for 3–4 h.45 Further, 0.9 mM of Ni[S2P(OC3H7)2]2 was suspended in 15 mL of ethylene glycol, and the mixture was stirred thoroughly for an hour to form a homogeneous mixture at room temperature. Subsequently, the solution was transferred into a Teflon-lined autoclave, and Ni-foam was placed vertically (perpendicular to the bottom) in the solution. The autoclave was kept in the muffle furnace at 135 °C for 10 h (Figure 1). The autoclave was allowed to cool at room temperature, and the as-deposited film was dried in an oven at 80 °C for 3–4 h. The as-grown NiS/Ni-foam was then employed as a flexible sensing electrode for the simultaneous and separation-free detection of four nucleobases (A, G, T, and C).
Figure 1.

Schematic of the fabrication process for porous, flexible NiS/Ni-foam.
2.4. Fabrication and Electrochemical Measurements of the NiS/Ni-foam Sensor
The electrochemical measurements were performed using a three-electrode system containing Ag/AgCl (3 M KCl) as a reference electrode, platinum wire as a counter electrode, and fabricated NiS/Ni-foam (1.5 cm × 1 cm) as the working electrode. A solution of 0.1 M [Fe(CN)6]3–/ [Fe(CN)6]4– and 0.1 M KCl was used as the redox species for the CV and EIS measurements. The optimal parameters for CV are as follows: scan rate = 50 mV/s, potential window = −0.10 V to +0.50 V, and current limit = 1 mA. DPV was performed in 0.1 M PBS and 0.005 M [Fe(CN)6]3– with a potential window of −0.10 V to +1.80 V, a pulse width of 0.25 V for 0.50 s, and an amplitude of 0.05 V. For the EIS studies, the open-circuit potential was used as a starting potential, and the frequency range was maintained from 100 kHz to 1 Hz, with an amplitude of 0.005 V.
2.5. DNA Nucleobase Analyses
The composition of A, G, T, and C in the calf thymus ds-DNA was examined following denaturation into ss-DNA through acid treatment.46 Briefly, 10 mg of ds-DNA was subjected to thermal treatment in a water bath at 80 °C for 50 min in the presence of 1 M HCl (5 mL). Subsequently, 1 M NaOH was introduced into the solution to neutralize it and made up to 20 mL using a buffer solution of PBS pH 7.4. E. coli genomic DNA, suspended in PBS buffer, was denatured by snap-cooling treatment (95 °C for 5 min, followed by incubation on ice for 5 min). The resulting DNA nucleobases were analyzed using DPV.
3. Results and Discussion
3.1. Morphological and Structural Analysis of Nanostructured NiS/Ni-foam
3.1.1. XRD
The X-ray diffraction technique was used to analyze the crystallinity and phase of the nanostructured NiS thin film. The strong and sharp diffraction peaks indicate the crystalline nature of the as-synthesized NiS/Ni-foam (Figure 2a). The peaks at 2θ values of 21.76°, 31.11°, 37.70°, 44.44°, 49.82°, 51.87°, 55.21°, 73.13°, and 76.39° correspond to the (101), (110), (003), (202), (113), (211), (104), (214), and (401) planes of NiS, respectively,47,48 and match well with the JCPDS card no. 012-0041. The lattice parameters, a and b = 5.753 Å, and c = 7.144 Å, are indexed to the trigonal crystal structure of nickel sulfide. The three diffraction peaks (*) are attributed to the Ni (111), (200), and (220) planes of Ni-foam (JCPDS card no. 40-0850)49 and NiS. No additional peaks were observed, indicating a pure NiS phase. The crystallite size (17.31 nm) was calculated using the Debye–Scherrer equation.50
| 1 |
Figure 2.

(a) XRD, (b) Raman spectra, (c) absorbance spectra with bandgap studies, (d) survey XPS spectrum, (e) XPS for Ni 2p, and (f) S 2p regions of NiS/Ni-foam.
3.1.2. Raman Scattering
The crystalline structure of the as-fabricated NiS/Ni-foam was analyzed through the Raman spectra. Figure 2b shows the deconvoluted spectra of NiS fitted using the Lorentzian function. The bands at 190 and 340 cm–1 correspond to the E stretching mode of vibration, while the bands at 242, 291, and 362 cm–1 resembles the A1 vibrational mode of nickel sulfide.39,51 The intensity of Raman vibrational modes strongly depends on the crystal lattice vibrations. When the crystal size is reduced to the nanoscale, the arrangement of atoms within the crystal lattice may change compared to bulk NiS, which affects the vibrational modes of the Raman peaks.52
3.1.3. Absorbance
UV–vis spectroscopy was used to investigate the optical properties of NiS/Ni-foam, and the band gap was determined through the Tauc equation: (αhυ)n = B(hυ – Eg), where υ represents the frequency of photons, h is the Planck constant, Eg is the energy of the optical band gap, n is the electron transition (1/2 or 2 for direct and indirect band gaps), and α is the absorption coefficient.53 The NiS layer displays maximum light absorption in the UV range (200–270 nm) in comparison to bulk nickel sulfide, indicating a blue shift relative to the bulk material (Figure 2c). This shows that the as-prepared NiS nanostructures have a very small size, and an increase in the band gap with a decrease in the particle size is due to the quantum confinement effect in the nanoparticles.54 The calculated energy band gap for NiS/Ni-foam is 2.9 eV.
3.1.4. XPS
X-ray photoelectron spectroscopy (XPS) was conducted in order to analyze the chemical oxidation states and elemental compositions of the NiS nanospheres on Ni-foam (Figure 2d–f). The survey spectrum (Figure 2d) indicates the coexistence of Ni, S, C, and O on the NiS/Ni-foam. The presence of oxygen (1s) and carbon (1s) is derived from carbon tape and atmospheric oxygen.55 The core level XPS Ni 2p spectrum (Figure 2e) exhibited a couple of major peaks at 853.3 and 873.0 eV associated with Ni 2p3/2 and Ni 2p1/2, which are ascribed to the Ni2+ oxidation state of NiS nanostructures.56 While, the other two peaks located at 859.4 and 876.6 eV are ascribed to the shakeup satellite peaks for NiS.57 In the S 2p spectrum (Figure 2f), the major two peaks were observed at 160.2 and 165.4 eV, corresponding to 2p3/2 and 2p1/2 binding energies of S2– of the NiS phase.58
3.1.5. Morphological Studies
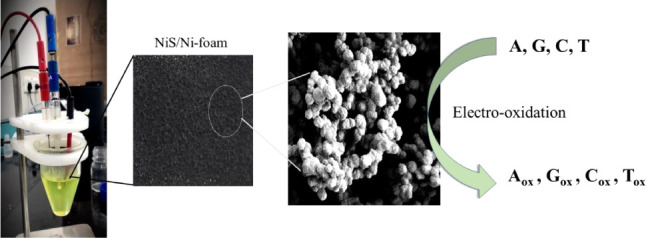
The surface morphology of the as-grown NiS on Ni-foam was studied using FE-SEM. Figure 3a,b shows the SEM images at two different magnifications (1 μm and 200 nm), signifying the complete coverage of NiS nanostructures over the surface of Ni-foam. The porous nanospheres were observed with a size range of 150–200 nm (Figure 3b). The EDX analysis of the film was carried out to determine the elemental composition and purity of nanostructured NiS from the solution-processable route. The obtained spectra highlight the presence of nickel (Ni) and sulfur (S) elements with an atomic ratio of 1:1 (Figure 3c), confirming the formation of pure nickel sulfide. Figure 3d shows the uniform distribution of Ni and S over the Ni-foam.
Figure 3.

SEM images of NiS/Ni-foam with different magnifications: (a) 1 μm and (b) 200 nm. (c) EDX spectrum and (d) elemental mapping of NiS/Ni-foam.
The TEM analysis clearly depicts the spherical nature of the NiS nanostructures (Figure 4a). The surface of these nanospheres exhibits porous structures observed at high magnification, as shown in Figure 4b. The selected area electron diffraction (SAED) pattern of the NiS nanospheres is shown in Figure 4c. The spacing between the two adjacent lattice planes is about 0.27 nm, which is consistent with the (110) lattice plane of NiS. The crystalline characteristics of NiS are depicted in Figure 4d, where the intense circular patterns are associated with the (202), (110), (101), and (003) planes.47,48
Figure 4.

TEM images of NiS/Ni-foam with different magnifications: (a) 200 and (b) 10 nm. (c) HR-TEM image and (d) SAED pattern of NiS/Ni-foam.
To further determine the porosity of NiS/Ni-foam, the N2 adsorption technique was carried out using Micromeritics ASAP 2020. The sample was measured under nitrogen adsorption at 77 K and degassed under flowing argon at 473 K for 1 h before measurements. Figure 5a shows a type-IV isotherm with an H2 hysteresis loop corresponding to the mesoporous structures with an enhanced surface area of NiS nanospheres (∼33.82 m2/g), compared to the bare Ni-foam (∼0.48 m2/g). The pore size distribution is determined using the Barrett–Joyner–Halenda (BJH) method (Figure 5b), and it shows an average pore size of ∼3.34 nm diameter, with a pore volume of 0.0071 cm3/g. The high surface area and consistent pore structure of NiS/Ni-foam serve as an electrolyte reservoir, thereby enhancing the diffusion of electrolyte ions at the electrode–electrolyte interface and improving the electrochemical detection performance of the sensor.59,60
Figure 5.

BET isotherm plot of (a) N2 adsorption–desorption curve and (b) pore size distribution of NiS/Ni-foam.
3.2. Electrochemical Characterization of the NiS/Ni-foam Electrode
Electrochemical characterization was performed to understand the electron transfer capacity of the as-fabricated electrode compared to that of bare Ni-foam. The cyclic voltammetry responses of the NiS/Ni-foam and bare Ni-foam were studied using 0.1 M [Fe (CN)6]3–/[Fe (CN)6]4– and 0.1 M KCl electrolyte. As shown in Figure 6a, the NiS/Ni-foam exhibited a redox peak at an equilibrium potential (E1/2) of 0.22 V with a peak-to-peak separation (ΔEp) of 220 mV, while for bare Ni-foam, E1/2 is 0.23 V and ΔEp is 240 mV. The decreased value of ΔEp for the NiS/Ni-foam, signifies improved electron transfer on the surface of the electrode after deposition of nanospherical NiS. Additionally, the maximum redox peak current ratio (Ipa/Ipc ≈ 1), describes reversible electrochemical activity with single electron transfer.61 This ratio is further used to estimate the electrochemically active surface area of the as-fabricated electrode by using the Randles–Sevcik equation:62
| 2 |
Figure 6.

(a) Cyclic voltammetric response, (b) stability of the NiS/Ni-foam at 50 mV s–1, (c) scan rate-dependent CV response of NiS/Ni-foam (inset: linear relationship between the peak current (Ipa and Ipc) and the square root of the scan rate), and (d) Nyquist plot (inset: electrochemical equivalent fitted circuit and data) of bare Ni-foam and NiS/Ni-foam.
Where, Ip is the ferricyanide redox peak current, A is the electroactive surface area, D is the diffusion coefficient of 7.6 × 10⁻⁶ cm2s–1, n is the number of electrons involved in the redox reaction, υ is the scan rate (mV s–1), and C is the concentration of the electrolyte (mol cm–3).63 The calculated surface areas for NiS/Ni-foam and bare Ni-foam are 0.0739 cm2 and 0.0515 cm2, respectively. The increased surface area of the as-fabricated electrode can be attributed to the high surface area and porous structure of nanospherical NiS, which is in agreement with the BET analysis. Further, to test the reproducibility and reliability of the NiS/Ni-foam, the CV curves were recorded for 120 continuous cycles (Figure 6b). The electrode exhibited high electrochemical stability with consistent and uniform performance. The scan rate-dependent CV cycles were studied by varying the scan rate from 10 to 100 mV s–1 (Figure 6c). A significant increase in the redox peak current was observed at higher scan rates. The linear relationship between the anodic and cathodic peak currents with respect to the square root of the scan rate (regression coefficients (R2) = 0.997 and 0.987) emphasizes that the diffusion of electrons toward the electrode surface is a rate-determining step, signifying relatively fast electron transfer.
3.2.1. Electrochemical Impedance Spectroscopic Studies
The electron-transfer kinetics of the NiS/Ni-foam and bare Ni-foam were studied by using 0.1 M [Fe (CN)6]3–/[Fe (CN)6]4– and 0.1 M KCl electrolyte. The Nyquist plot was used to fit the equivalent circuit, where Rct is charge transfer resistance, Zw is Warburg impedance, and Cdl is double-layer capacitance.64 The width of the semicircle corresponds to the charge transfer resistance values, which shows the electron-transfer kinetics between the working electrode and electrolyte (Figure 6d). The Rct value for the bare Ni-foam is 68.4 Ω, indicating a higher resistance attributed to its poor conductivity and lower charge transfer rate. In contrast, the Rct value for the NiS/Ni-foam is 13.4 Ω, suggesting a more significant quantity of charges transferred on the electrode, which further indicates enhanced conductivity and a higher reaction rate at the electrode.65,66 This increase in conductivity and the charge transfer rate can be attributed to the abundance of active sites on the NiS/Ni-foam, highlighting its exceptional catalytic activity.67
3.3. Analysis of Four DNA Nucleobases at NiS/Ni-foam
The electrochemical detection of four DNA nucleobases (A, G, T, and C) using NiS/Ni-foam was explored by the differential pulse voltammetry (DPV) technique. Among various electrochemical approaches, DPV is a simple and sensitive technique, demonstrating simultaneous detection of model analytes within a single run. Figure 7a shows the DPV response of purine (200 μM A and G) and pyrimidine (50 μM T and C) in 0.1 M PBS and 0.005 M [Fe(CN)6]3– at pH 7.4. The bare Ni-foam did not show any DPV signals (black curve), while the as-fabricated NiS/Ni-foam depicts a clear DPV response (red curve) with four distinct oxidation peaks at 0.21, 0.90, 1.24, and 1.55 V corresponding to A, G, T, and C, respectively. This can be attributed to the improved electrochemical oxidation at the NiS/Ni-foam surface (Scheme 1), serving as an efficient electrochemical catalyst for the simultaneous and separation-free detection of nucleobases.
Figure 7.

(a) Simultaneous DPV responses of A, G, T and C, and (b) effect of pH on the simultaneous detection of four DNA nucleobases (pH range: 4, 7.4, and 11) using NiS/Ni-foam.
Scheme 1. Illustrates the Sensing Mechanism of NiS Towards DNA Nucleobases.
3.4. Effect of pH on the Electrochemical Oxidation of Nucleobases
Furthermore, to examine the proton-coupled electron transfer reactions of nucleobases (A, G, T, and C) on the as-fabricated electrode, the effect of pH toward the electro-oxidized peak currents was studied. Figure 7b shows the DPV response of the four nucleobases at different pH (4, 7.4, and 11). It was observed that at pH 4, only three nucleobases (A, G, and T) were detected, whereas four peaks corresponding to A, G, T, and C were observed at higher pH, emphasizing the ease of oxidation under alkaline conditions (pH 7.4 and 11).68 In accordance with these results, pH 7.4 was chosen for further analysis as it is ideal for all biological samples.
For detailed studies, the oxidation peak potentials (Epa) of all four nucleobases were studied in the pH range from 2.0 to 8.0 at a scan rate of 50 mV s–1, which demonstrates a negative shift with an increase in solution pH (Figure S1). This suggests that the oxidation of A, G, T, and C is associated with the proton-transfer process.69Figure S2a–d shows the linear relationship between the oxidation peak potentials and pH. The pH dependence of A, G, T, and C was described as Epa (V) = 0.653–0.044pH (R = 0.9728), Epa (V) = 0.823–0.046pH (R = 0.99830), Epa (V) = 1.47–0.050pH (R = 0.99534), and Epa (V) = 1.74–0.045pH (R = 0.9634), respectively. The slope values of 44 mV pH–1, 46 mV pH–1, 50 mV pH–1, and 45 mV pH–1, corresponding to A, G, T, and C, respectively, are close to the expected Nernstian theoretical value of 59.1 mV pH–1 at 27 °C, suggesting an equivalent number of proton and electron transfer. The electrochemical oxidation for A undergoes a three-step process with a total loss of six electrons (Scheme 2a), with two electrons and protons participating in the rate-determining step.70 The electrochemical oxidation of G shadowed the two-step mechanism involving a total reduction of four electrons as well as the exchange of two electrons and protons in the rate-determining process, as shown in Scheme 2b.71 Similarly, the electro-oxidation of C involves two electrons and two protons in the rate-determining step (Scheme 2d).69 For T, the oxidation mechanism differs from other nucleobases like A, G, and C due to its distinct molecular structure. It is simpler and requires the exchange of only one electron and one proton for the electro-oxidation of T (Scheme 2c).72
Scheme 2. Reaction Mechanism of (a) A, (b) G, (c) T, and (d) C with NiS/Ni-foam.

3.5. Selective and Simultaneous Detection of Four Nucleobases
The optimized DPV conditions were employed to study the selective and simultaneous detection of nucleobases on NiS/Ni-foam. Throughout the experiment, the concentration of one nucleobase is steadily increased, while the concentrations of the other three are kept constant. Figure 8a,b shows a linear increase in peak current with a progressive increase in concentrations from 200 to 1000 μM for A and G, where the concentrations of T and C are kept constant at 50 μM. Similarly, the current increases linearly with the increase in concentration of T and C (from 50 to 500 μM), while the concentration of A and G is 200 μM (Figure 8c,d). Table 1 summarizes the linear concentration range, sensitivity, and lower limits of detection of all four nucleobases on NiS/Ni-foam. The LOD was determined using 3sb/m, where 3 represents the signal-to-noise ratio, sb is the standard deviation derived from eight repeated signal measurements, and m denotes the sensitivity of the electrode. The LOD values calculated for nucleobases (A, G, T, and C) were 159 μM, 147.6 μM, 16.8 μM, and 45.9 μM, while the corresponding sensitivity values were found to be 1.2 × 10⁻⁴ A M–1, 6.1 × 10⁻⁴ A M–1, 1.2 × 10⁻³ A M–1, and 3.0 × 10⁻⁴ A M–1 for A, G, T, and C. Interestingly, it is observed that the oxidation reaction of G is faster and thus the sensitivity of the electrode to detect G is higher than that of the other three nucleobases. These results affirm the suitability of NiS/Ni-foam for the sensitive and simultaneous detection of nucleobases.
Figure 8.

DPV plot at different concentrations of (a) A, (b) G, (c) C, and (d) T in 0.005 M [Fe(CN)6]3– and 0.1 M PBS (pH 7.4). Inset: the linear relationship between current response and concentrations of nucleobases.
Table 1. Analytical Parameters for Nucleobase Detection using the NiS/Ni-foam Electrode.
| Analyte | Linear range | R2 | Sensitivity | LOD |
|---|---|---|---|---|
| A | 200 μM–1000 μM | 0.97 | 1.2 × 10⁻⁴ A M–1 | 159 μM |
| G | 0.97 | 6.1 × 10⁻⁴ A M–1 | 147.6 μM | |
| T | 50 μM–500 μM | 0.97 | 1.2 × 10⁻³ A M–1 | 16.8 μM |
| C | 0.98 | 3.0 × 10⁻⁴ A M–1 | 45.9 μM |
In order to study the surface charges of NiS nanostructures and the interaction of nucleobases, the surface zeta potentials of NiS were measured. A liquid sample of NiS nanostructures (10 mL) was prepared by dispersing nanostructures in deionized water. As shown in Figure S3a, the average zeta potential of NiS was −15.86 mV, which confirms the presence of a negative charge on the surface.73 The origin of the negative charge on the surface can be attributed to the presence of S2–. For aqueous particle suspensions, the zeta potential confirms the colloidal stability, where a higher zeta potential indicates a more stable suspension. Figure S3b demonstrates the alteration in zeta potential values upon the introduction of nucleobases at a temperature of 25 °C. The DNA nucleobases are negatively charged biomolecules due to the presence of the hydrophilic sugar-phosphate backbone, situated externally in nucleic acids, contributing to the inherent negative surface potential. The results showed that NiS + G has a lower zeta potential compared to NiS, leading to the formation of a more stable chelate bond.74 Whereas, NiS with A, C, and T showed a positive shift toward higher zeta values. A positive shift in the zeta potential suggests that nucleobases are adsorbing onto the surface of the NiS nanostructure.75
3.6. Interference Study
The specificity of the NiS/Ni-foam sensor in the analysis of A, G, T, and C was studied by evaluating the percentage of DNA bases in the presence of interfering species, including biomolecules and diverse ions. Possible interferences for detecting DNA bases were studied by introducing various foreign species into 0.1 M PBS (pH 7.0) with 200 μM A and G, and 50 μM C and T. Figure 9 shows that common inorganic ions with a 50-fold excess, K+, Ca2+, and Fe3+, showed minimal interference (signal change of <8%) in the analysis. Furthermore, potential interferences present in biological samples were also investigated, showing no significant impact (signal change of <7%) for a 50-fold concentration of glucose, uric acid, lauric acid, and ascorbic acid. A relative standard deviation from 0.7 to 2.1% was calculated for n = 3 on the NiS/Ni-foam electrode, demonstrating acceptable accuracy toward interfering species. Thus, the flexible biosensor is suitable for evaluating A, G, T, and C levels in real-life samples.
Figure 9.

Current responses toward 200 μM A and G, and 50 μM C and T in 0.1 M PBS pH 7.0 in the presence of 10 mM interference by using NiS/Ni-foam. Error bars indicate standard deviation (n = 3).
3.7. Stability and Reproducibility of the As-Fabricated NiS/Ni-foam Electrode
The stability of the fabricated flexible electrode was investigated, wherein the electrode was stored at room temperature for a period of 30 days. The DPV response of the electrode exhibited a slight decrease in peak current, retaining the response up to 80%, 112%, 76.08%, and 95.8% for A, G, T, and C, respectively (Figure S4b). Further, the electrode demonstrates a reproducible response for 10 consecutive cycles (Figure S4a), and the relative standard deviation (RSD) values are 6.06%, 3.56%, 1.68%, and 1.99% corresponding to A, G, T, and C, respectively. In order to understand the performance and stability of the proposed electrode, a comparative study of XRD, XPS, and Raman measurements was conducted prior to and post nucleobase detection (Figure S5a–c). The XRD and Raman spectra of the as-fabricated NiS/Ni-foam revealed no phase change of NiS nanostructures even after 10 repeated DPV cycles. However, XPS analysis showed the presence of Ni, S, C, O, and N elements on the NiS/Ni-foam post-electrooxidation of nucleobases (Figure S5c). A new nitrogen signal (N 1s) observed at 398.6 eV is attributed to the amino nitrogen of the N=C bond, confirming the adsorption of nitrogen-containing amide or amine groups on the surface of NiS/Ni-foam.76,77 Additionally, the C 1s peaks, within the 283 eV–292 eV range, correspond to the C–O–C, C–OH, and N–C–O/N—C=O bonds of the nucleobases.77,78 These results favor the anchoring of nucleobases on the surface of NiS/Ni-foam. The Ni 2p3/2 and Ni 2p1/2 peaks remain unchanged after nucleobase adsorption, while the slight increase in the binding energy of the S 2p (2p3/2 and 2p1/2) peaks suggests changes in the localized surface chemical states due to nucleobase interaction (Table S1).79 The reduction in intensity ratios indicates a lower surface concentration of nickel and sulfur after nucleobase adsorption, resulting from the high coverage of nucleobases on the surface, which masks the elemental signals and reduces peak intensity.80
3.8. Application of the Fabricated Electrode for Real Sample Analysis
The applicability of the flexible NiS/Ni-foam for biological samples was evaluated by assaying ds-DNA from calf thymus (short chain, 260 nm) and E. coli (long chain, 1–2 mm) under the optimized conditions. Prior to the measurements, both DNA samples were denatured by using thermal treatment (Section 2.5). The DNA sample was added to 20 mL of 0.1 M PBS solution. Based on the established calibration plots, the contents of A, G, T, and C were obtained directly from the peak currents of the curves. The DPV response of the calf thymus (Figure 10a) and E. coli DNA (Figure 10b) exhibits four distinct peaks of A, G, T, and C. According to Chargaff’s rule, the (G + C)/(A + T) ratio is specific for different organisms. A higher value indicates a stronger interaction between ds-DNA because of three hydrogen bonds in CG pairing, while there are two hydrogen bonds in AT pairing.68 The (G + C)/(A + T) ratio has been estimated to be 0.79 for calf thymus and 1.10 for E. coli DNA, closely aligning with their respective standard values.81,82 The concentrations of A, G, T, and C were determined by the standard addition technique. The known concentrations of nucleobases (A-400, G-450, T-500, and C-550 μM) in calf thymus DNA and (A-250, and G, T, and C-300 μM) in E. coli DNA were spiked, and detected concentrations were determined by using peak current.46 The spiked recovery results of calf thymus DNA are 96, 100, 99, and 92%, and for E. coli DNA are 96, 99, 92, and 100% (for A, G, T, and C), with standard deviation (SD) as shown in Table 2. The extensive results demonstrate the viability of NiS/Ni-foam for the fast and simultaneous detection of DNA in real biological samples.
Figure 10.

Simultaneous detection of A, G, T, and C in (a) calf thymus and (b) E. coli DNA samples.
Table 2. Detection of A, G, T, and C Contents in Real Samples Using NiS/Ni-foam by the DPV Method.
| Sample | Nucleobases | Detected concentration (μM) | Added nucleobases (A, G, T, C) (μM) | Detected concentration (μM) | Recovery (%) ± SD |
|---|---|---|---|---|---|
| Calf thymus DNA | A | 339 | 400 | 385 | 96 ± 0.20 |
| G | 365 | 450 | 454 | 100 ± 0.75 | |
| T | 495 | 500 | 494 | 99 ± 0.27 | |
| C | 299 | 550 | 510 | 92 ± 0.36 | |
| E. coli DNA | A | 221 | 250 | 240 | 96 ± 1.60 |
| G | 290 | 300 | 290 | 99 ± 1.44 | |
| T | 238 | 300 | 278 | 92 ± 0.35 | |
| C | 218 | 300 | 300 | 100 ± 0.15 |
3.9. Flexibility Studies of the as-Fabricated Electrode
Further, to study the mechanical feasibility of the flexible NiS/Ni-foam, the DPV performance was studied by bending and twisting the electrode into different shapes as illustrated in Figure 11 (a-initial state; b-S-shaped; c-3 E-shaped; d-twisted; e-semicircular; f-circular; g-C-shaped; h-coil-shaped). The electrode exhibited a consistent DPV response toward the detection of all four nucleobases under applied strain (Figure 11i), confirming its outstanding mechanical stability. Remarkably, throughout the repeated bending tests, there were no discernible signs of electrode fragmentation, suggesting a pronounced affinity between NiS and Ni-foam. This ensures the structural integrity of the film, making it suitable for various flexible and wearable devices.
Figure 11.

Photographs representing the excellent flexibility of NiS/Ni-foam (a, initial state; b, S-shaped; c, E-shaped; d, twisted; e, semicircular; f, circular; g, C-shaped; h, coil-shaped); and i, DPV response of different shapes of the electrode.
A comparison of metal oxide- and sulfide-based electrochemical sensors is summarized in Table 3. This work represents a simple, cost-effective, and solution-processable route for the fabrication of flexible NiS/Ni-foam via SSPs. The fabricated electrode demonstrates excellent performance with a wide linear range and lower LOD for simultaneous and separation-free detection of four DNA nucleobases in a single run. However, the reported sulfide-based electrodes, such as MoS2, FeS2, and WS2, are on rigid substrates and are able to detect either two or three nucleobases. This limits their potential for precise measurement of DNA nucleobase ratios (G + C)/(A + T), which is crucial for conducting detailed studies on DNA damage. Thus, the NiS/Ni-foam can be a potential candidate for future noninvasive DNA sensing applications and early disease diagnosis.
Table 3. Comparison of the Analytical Performance of the Flexible Electrochemical NiS/Ni-foam Sensor with Other Sensors Used for the Analysis of DNA Nucleobases.
| Material | Synthesis route | Electrode fabrication | Flexible | NB’s | Linear range | LOD | Ref |
|---|---|---|---|---|---|---|---|
| MWCNTs-COOH | DSP | drop cast | no | G | 0.04–130 μM | 0.0055 μM | (83) |
| A | 0.06–130 μM | 0.0072 μM | |||||
| Cu-MOF/GO composites | DSP | drop cast | no | G | (0.02–10)–(20–100) μM | 0.012 μM | (62) |
| A | (0.005–20)–(40–200) μM | 0.002 μM | |||||
| graphitic carbon nitride nanoflakes | DSP | drop cast | no | G | 0.3 × 10⁻⁷–6.6 × 10⁻⁶ M | 4.7 nM | (61) |
| A | 0.3 × 10⁻⁷–7.3 × 10⁻⁶ M | 3.5 nM | |||||
| T | 5.3 × 10⁻⁶–63.3 × 10⁻⁴ M | 55 nM | |||||
| Cu@Ni/MWCNTs | DSP | drop cast | no | G | 1.0–180 μM | 0.17 μM | (67) |
| A | 2.0–150 μM | 0.33 μM | |||||
| DomP/s-SWNTs | DSP | drop cast | no | G | 0.5–100 μM | 3.394 μM | (84) |
| A | 0.5–140 μM | 3.594 μM | |||||
| Co3O4@ TADM COF/MWCNT | DSP | drop cast | no | G | 0.6–180 μM | 0.020 μM | (85) |
| A | 0.6–180 μM | 0.024 μM | |||||
| GQDs-AgNC | DSP | drop cast | no | G | 0.1–6.0 μM | 0.1 μM | (86) |
| A | 0.1–5.0 μM | 0.1 μM | |||||
| AuPtNCs-rGO | DSP | drop cast | no | G | 1.0 μM to 0.2 mM | 60 nM | (87) |
| A | 1.0 μM to 0.2 mM | 100 nM | |||||
| WS2 nanosheet | DSP | hydrothermal method | yes | G | 0.5 μM–20 μM | 20 μM | (88) |
| temp-265 °C | A | 0.5 μM–20 μM | 20 μM | ||||
| MoS2 | DSP | hydrothermal method | no | G | 15–120 μM | 0.76 μM | (89) |
| temp-200 °C | A | 15–120 μM | 2.38 μM | ||||
| 2-D Marcasite FeS2 | DSP | drop cast | no | G | 500–2000 μM | 254 μM | (90) |
| A | 500–2000 μM | 313 μM | |||||
| T | 500–2000 μM | 294 μM | |||||
| C | 500–2000 μM | 387 μM | |||||
| NiS | SSP | hydrothermal method | yes | G | 200 μM–1000 μM | 147.6 μM | this work |
| temp-135 °C | A | 200 μM–1000 μM | 159 μM | ||||
| T | 50 μM–500 μM | 16.8 μM | |||||
| C | 50 μM–500 μM | 45.9 μM |
4. Conclusions
In conclusion, we report the in situ growth of NiS nanospheres on flexible Ni-foam via a novel SSP-based simple and scalable solution-processable route. The as-fabricated NiS/Ni-foam used as the working electrode was characterized by XRD, Raman, UV–vis spectroscopy, XPS, FE-SEM, HR-TEM, and BET, which confirmed the high surface porous nanospheres of NiS. The electrode provided a stable sensing platform with excellent electrode conductivity and high electron transfer kinetics suitable for selective and simultaneous detection of all four nucleobases (A, G, T, and C) over a wide linear range: (200 μM–1000 μM) for A and G, (50 μM–500 μM) for T and C. Under optimized pH conditions, the NiS/Ni-foam exhibits excellent selectivity toward individual nucleobase detection and demonstrates outstanding stability, linearity, and reproducibility over a longer time. The LOD values calculated for nucleobases (A, G, T, and C) were 159 μM, 147.6 μM, 16.8 μM, and 45.9 μM, while the corresponding sensitivity values were found to be 1.2 × 10⁻⁴ A M–1, 6.1 × 10⁻⁴ A M–1, 1.2 × 10⁻³ A M–1, and 3.0 × 10⁻⁴ A M–1 for A, G, T, and C. Additionally, the electrode successfully demonstrated its feasibility toward real samples through the detection of four nucleobases in the denatured ds-DNA of calf-thymus and E. coli. Moreover, the electrode was selective toward the detection of A, G, T, and C even in the presence of interfering foreign factors. This single-step, cost-effective approach represents a significant advancement in the fabrication of efficient, flexible, and portable electrochemical biosensors with potential applications in the field of clinical diagnostics and health monitoring.
Acknowledgments
The authors thank Mahindra University, Hyderabad, for providing the necessary experimental facilities and funding to conduct this research. The authors thank the School of Chemistry, University of Hyderabad, for Raman spectroscopic studies, FE-SEM, HR-TEM, and UV–vis spectroscopy facilities. The authors also thank the Department of Chemical Engineering, Indian Institute of Technology, Hyderabad, for BET and XPS facilities.
Glossary
Abbreviations
- SSP
single-source precursor
- DSP
dual-source precursor
- NiS
nickel sulfide
- Ni-foam
nickel foam
- A
adenine
- G
guanine
- T
thymine
- C
cytosine
- 2D
two-dimensional
- XRD
X-ray diffraction
- XPS
X-ray photoelectron spectroscopy
- SEM
scanning electron microscopy
- TEM
transmission electron microscopy
- DNA
deoxyribonucleic acid
- TMDCs
transition metal dichalcogenides
- DPV
differential pulse voltammetry
- CV
cyclic voltammetry
- EIS
electrochemical impedance spectra
- LOD
limit of detection
- SD
standard deviation
Supporting Information Available
The Supporting Information is available free of charge at https://pubs.acs.org/doi/10.1021/acsomega.4c07106.
Effect of solution pH on DPV responses of A, G, T, and C in 0.1 M PBS with different pH values (Figure S1); oxidation peak potentials versus pH (Figure S2); surface zeta potential analysis of NiS and nucleobases (Figure S3); reproducibility and stability studies, (Figure S4) XRD, Raman and XPS spectra of NiS/Ni-foam prior to and after detection cycles (Figure S5); binding energies of NiS/Ni-foam before and after cycles (Table S1) (PDF)
Author Contributions
∥ P.N.G. and T.R.D. contributed equally to this paper. P.N.G.: conceptualization, methodology, data curation, investigation, validation, analysis, and writing – original draft. T.R.D.: methodology, data curation, investigation, validation, analysis, and writing – original draft. S.G.: methodology, investigation, and validation. C.G.: conceptualization, investigation, validation, writing – review and editing, and supervision.
The authors declare no competing financial interest.
Supplementary Material
References
- Flynn C. D.; Chang D.; Mahmud A.; Yousefi H.; Das J.; Riordan K. T.; Sargent E. H.; Kelley S. O. Biomolecular Sensors for Advanced Physiological Monitoring. Nat. Rev. Bioeng. 2023, 1 (8), 560–575. 10.1038/s44222-023-00067-z. [DOI] [PMC free article] [PubMed] [Google Scholar]
- Ates H. C.; Nguyen P. Q.; Gonzalez-Macia L.; Morales-Narváez E.; Güder F.; Collins J. J.; Dincer C. End-to-End Design of Wearable Sensors. Nat. Rev. Mater. 2022, 7 (11), 887–907. 10.1038/s41578-022-00460-x. [DOI] [PMC free article] [PubMed] [Google Scholar]
- Babar V.; Sharma S.; Shaikh A. R.; Oliva R.; Chawla M.; Cavallo L. Detecting Hachimoji DNA: An Eight-Building-Block Genetic System with MoS2 and Janus MoSSe Monolayers. ACS Appl. Mater. Interfaces 2024, 16 (17), 21427–21437. 10.1021/acsami.3c18400. [DOI] [PMC free article] [PubMed] [Google Scholar]
- Vaghasiya J. V.; Mayorga-Martinez C. C.; Pumera M. Wearable Sensors for Telehealth Based on Emerging Materials and Nanoarchitectonics. Npj Flexible Electron. 2023, 7 (1), 26. 10.1038/s41528-023-00261-4. [DOI] [PMC free article] [PubMed] [Google Scholar]
- Luo J.; Fang L.; Liu H.; Zhu Q.; Huang H.; Deng J.; Liu F.; Li Y.; Zheng J. Dual-Signal Amplified Photoelectrochemical Assay for DNA Methyltransferase Activity Based on RGO-CdS: Mn Nanoparticles and a CdTe@DNA Network. Sens. Actuators, B 2020, 304, 127266–127292. 10.1016/j.snb.2019.127266. [DOI] [Google Scholar]
- Tabucchi A.; Carlucci F.; Re M. C.; Furlini G.; Consolmagno E.; Leoncini R.; Pizzichini M.; Marinello E.; Rubino M.; Pagani R. The Behavior of Free Purine Nucleotides in Lymphocytes Infected with HIV-1 Virus. Biochim. Biophys. Acta, Mol. Basis Dis. 1993, 1182 (3), 317–322. 10.1016/0925-4439(93)90075-C. [DOI] [PubMed] [Google Scholar]
- Sprung C. N.; Ivashkevich A.; Forrester H. B.; Redon C. E.; Georgakilas A.; Martin O. A. Oxidative DNA Damage Caused by Inflammation May Link to Stress-Induced Non-Targeted Effects. Cancer Lett. 2015, 356 (1), 72–81. 10.1016/j.canlet.2013.09.008. [DOI] [PMC free article] [PubMed] [Google Scholar]
- Chargaff E. Some recent studies on the composition and structure of nucleic acids. J. Cell. Comp. Physiol. 1951, 38 (S1), 41–59. 10.1002/jcp.1030380406. [DOI] [PubMed] [Google Scholar]
- Saif I.; Hassou N.; Allali K.; Ennaji M. M. Effect of Hypermethylation in Ovarian Cancer: Computational Approach. Meta Gene. 2018, 18, 157–162. 10.1016/j.mgene.2018.09.001. [DOI] [Google Scholar]
- Haunschmidt M.; Buchberger W.; Klampfl C. W. Investigations on the Migration Behaviour of Purines and Pyrimidines in Capillary Electromigration Techniques with UV Detection and Mass Spectrometric Detection. J. Chromatogr. A 2008, 1213 (1), 88–92. 10.1016/j.chroma.2008.09.063. [DOI] [PubMed] [Google Scholar]
- Zhou Y.; Yan H.; Xie Q.; Yao S. Determination of Guanine and Adenine by High-Performance Liquid Chromatography with a Self-Fabricated Wall-Jet/Thin-Layer Electrochemical Detector at a Glassy Carbon Electrode. Talanta 2015, 134, 354–359. 10.1016/j.talanta.2014.11.042. [DOI] [PubMed] [Google Scholar]
- Wang W.; Zhou L.; Wang S.; Luo Z.; Hu Z. Rapid and Simple Determination of Adenine and Guanine in DNA Extract by Micellar Electrokinetic Chromatography with Indirect Laser-Induced Fluorescence Detection. Talanta 2008, 74 (4), 1050–1055. 10.1016/j.talanta.2007.06.047. [DOI] [PubMed] [Google Scholar]
- Ortolani T. S.; Pereira T. S.; Assumpção M. H. M. T.; Vicentini F. C.; Gabriel de Oliveira G.; Janegitz B. C. Electrochemical Sensing of Purines Guanine and Adenine Using Single-Walled Carbon Nanohorns and Nanocellulose. Electrochim. Acta 2019, 298, 893–900. 10.1016/j.electacta.2018.12.114. [DOI] [Google Scholar]
- Hui Y.; Ma X.; Hou X.; Chen F.; Yu J. Silver Nanoparticles-β-Cyclodextrin-Graphene Nanocomposites Based Biosensor for Guanine and Adenine Sensing. Ionics 2015, 21 (6), 1751–1759. 10.1007/s11581-014-1343-5. [DOI] [Google Scholar]
- Yari A.; Derki S. New MWCNT-Fe3O4@PDA-Ag Nanocomposite as a Novel Sensing Element of an Electrochemical Sensor for Determination of Guanine and Adenine Contents of DNA. Sens. Actuators, B 2016, 227, 456–466. 10.1016/j.snb.2015.12.088. [DOI] [Google Scholar]
- Yari A.; Saidikhah M. Trithiane Silver-Nanoparticles-Decorated Polyaniline Nanofibers as Sensing Element for Electrochemical Determination of Adenine and Guanine in DNA. J. Electroanal. Chem. 2016, 783, 288–294. 10.1016/j.jelechem.2016.10.063. [DOI] [Google Scholar]
- Justino C. I. L.; Gomes A. R.; Freitas A. C.; Duarte A. C.; Rocha-Santos T. A. P. Graphene Based Sensors and Biosensors. TrAC, Trends Anal. Chem. 2017, 91, 53–66. 10.1016/j.trac.2017.04.003. [DOI] [Google Scholar]
- Peng J.; Huang Q.; Zhuge W.; Liu Y.; Zhang C.; Yang W.; Xiang G. Blue-Light Photoelectrochemical Sensor Based on Nickel Tetra-Amined Phthalocyanine-Graphene Oxide Covalent Compound for Ultrasensitive Detection of Erythromycin. Biosens. Bioelectron. 2018, 106, 212–218. 10.1016/j.bios.2018.02.009. [DOI] [PubMed] [Google Scholar]
- Deng C.; Xia Y.; Xiao C.; Nie Z.; Yang M.; Si S. Electrochemical Oxidation of Purine and Pyrimidine Bases Based on the Boron-Doped Nanotubes Modified Electrode. Biosens. Bioelectron. 2012, 31 (1), 469–474. 10.1016/j.bios.2011.11.018. [DOI] [PubMed] [Google Scholar]
- Peng J.; Huang Q.; Liu Y.; Liu P.; Zhang C. Photoelectrochemical Sensor Based on Composite of CdTe and Nickel Tetra-Amined Phthalocyanine Covalently Linked with Graphene Oxide for Ultrasensitive Detection of Curcumin. Sens. Actuators, B 2019, 294, 157–165. 10.1016/j.snb.2019.05.047. [DOI] [Google Scholar]
- Bart G.; Fischer D.; Samoylenko A.; Zhyvolozhnyi A.; Stehantsev P.; Miinalainen I.; Kaakinen M.; Nurmi T.; Singh P.; Kosamo S.; et al. Characterization of Nucleic Acids from Extracellular Vesicle-Enriched Human Sweat. BMC Genom. 2021, 22 (1), 425. 10.1186/s12864-021-07733-9. [DOI] [PMC free article] [PubMed] [Google Scholar]
- Li M.; Lv S.; Yang R.; Chu X.; Wang X.; Wang Z.; Peng L.; Yang J. Development of Lycopene-Based Whole-Cell Biosensors for the Visual Detection of Trace Explosives and Heavy Metals. Anal. Chim. Acta 2023, 1283, 341934–341946. 10.1016/j.aca.2023.341934. [DOI] [PubMed] [Google Scholar]
- Wang Z.; Ma R.; Chen B.; Yu X.; Wang X.; Zuo X.; Liang B.; Yang J. A Transcription Factor-Based Bacterial Biosensor System and Its Application for on-Site Detection of Explosives. Biosens. Bioelectron. 2024, 244, 115805–115816. 10.1016/j.bios.2023.115805. [DOI] [PubMed] [Google Scholar]
- Yu H.; Chong Y.; Zhang P.; Ma J.; Li D. A D-Shaped Fiber SPR Sensor with a Composite Nanostructure of MoS2-Graphene for Glucose Detection. Talanta 2020, 219, 121324–121315. 10.1016/j.talanta.2020.121324. [DOI] [PubMed] [Google Scholar]
- Zhao C.; Tang X.; Zhao J.; Cao J.; Jiang Z.; Qin J. MOF Derived Core-Shell CuO/C with Temperature-Controlled Oxygen-Vacancy for Real Time Analysis of Glucose. J. Nanobiotechnol. 2022, 20 (1), 507. 10.1186/s12951-022-01715-z. [DOI] [PMC free article] [PubMed] [Google Scholar]
- Yang H.; Zheng J.; Wang W.; Lin J.; Wang J.; Liu L.; Wu W.; Zhang C.; Zhang M.; Fu Y.; et al. Zr-MOF Carrier-Enhanced Dual-Mode Biosensing Platforms for Rapid and Sensitive Diagnosis of Mpox. Adv. Sci. 2024, 11, 2405848 10.1002/advs.202405848. [DOI] [PMC free article] [PubMed] [Google Scholar]
- Fu Y.; Chen X.; Song W.; Kuang J.; Wu W.; Yang X.; Xia J.; Liu L.; Yang Y.; Ma S.; et al. Light-Switch Electrochemiluminescence-Driven Microfluidic Sensor for Rapid and Sensitive Detection of Mpox Virus. Chem. Eng. J. 2024, 498, 154930. 10.1016/j.cej.2024.154930. [DOI] [Google Scholar]
- Wu J.; Liu H.; Chen W.; Ma B.; Ju H. Device Integration of Electrochemical Biosensors. Nat. Rev. Bioeng. 2023, 1 (5), 346–360. 10.1038/s44222-023-00032-w. [DOI] [PMC free article] [PubMed] [Google Scholar]
- Arivazhagan M.; Shankar A.; Maduraiveeran G. Hollow sphere nickel sulfide nanostructures–based enzyme mimic electrochemical sensor platform for lactic acid in human urine. Microchim. Acta 2020, 187 (8), 468. 10.1007/s00604-020-04431-3. [DOI] [PubMed] [Google Scholar]
- Li Y.; Wang Y.; Xu Z.; Peng B.; Tran N. Q.; Saxena K. K.; Vadivel S.; Liu X. MXene-Based Materials for Efficient Applications in Perovskite Solar Cells: A Review. J. Mater. Sci. Technol. 2025, 215, 214–232. 10.1016/j.jmst.2024.07.022. [DOI] [Google Scholar]
- Ma H.; Zhao F.; Li M.; Wang P.; Fu Y.; Wang G.; Liu X. Construction of Hollow Binary Oxide Heterostructures by Ostwald Ripening for Superior Photoelectrochemical Removal of Reactive Brilliant Blue KNR Dye. Adv. Powder Mater. 2023, 2 (3), 100117–100126. 10.1016/j.apmate.2023.100117. [DOI] [Google Scholar]
- Ning J.; Zhang B.; Siqin L.; Liu G.; Wu Q.; Xue S.; Shao T.; Zhang F.; Zhang W.; Liu X. Designing advanced S-scheme CdS QDs/La-Bi2WO6 photocatalysts for efficient degradation of RhB. Exploration 2023, 3 (5), 20230050. 10.1002/EXP.20230050. [DOI] [PMC free article] [PubMed] [Google Scholar]
- Liu X.; Xi S.; Kim H.; Kumar A.; Lee J.; Wang J.; Tran N. Q.; Yang T.; Shao X.; Liang M.; et al. Restructuring Highly Electron-Deficient Metal-Metal Oxides for Boosting Stability in Acidic Oxygen Evolution Reaction. Nat. Commun. 2021, 12 (1), 5676. 10.1038/s41467-021-26025-0. [DOI] [PMC free article] [PubMed] [Google Scholar]
- Li Y. M.; Liu Z. C.; Dong X.; Ji Y. P.; Shi C. J.; Zhang G. F.; Li Y. Z.; Kennedy J.; Yang F.. Mechanisms of Grain Refinement and Improved Kinetic Property of Nanocrystalline Mg-Ni-La Hydrogen Storage Alloys Prepared by Nanocrystallization of Amorphous. J. Magnes. Alloys, 2024. 10.1016/j.jma.2024.07.022. [DOI] [Google Scholar]
- Bolotsky A.; Butler D.; Dong C.; Gerace K.; Glavin N. R.; Muratore C.; Robinson J. A.; Ebrahimi A. Two-Dimensional Materials in Biosensing and Healthcare: From in Vitro Diagnostics to Optogenetics and Beyond. ACS Nano 2019, 13 (9), 9781–9810. 10.1021/acsnano.9b03632. [DOI] [PubMed] [Google Scholar]
- Jana S.; Samai S.; Mitra B. C.; Bera P.; Mondal A. Nickel Oxide Thin Film from Electrodeposited Nickel Sulfide Thin Film: Peroxide Sensing and Photo-Decomposition of Phenol. Dalton Trans. 2014, 43 (34), 13096–13104. 10.1039/C4DT01658K. [DOI] [PubMed] [Google Scholar]
- Li C.; Wang Y.; Jiang H.; Wang X. Biosensors Based on Advanced Sulfur-Containing Nanomaterials. Sensors 2020, 20 (12), 3488. 10.3390/s20123488. [DOI] [PMC free article] [PubMed] [Google Scholar]
- Desai T. R.; Goud R. S. P.; Dongale T. D.; Gurnani C. Evaluation of Nanostructured NiS2 Thin Films from a Single-Source Precursor for Flexible Memristive Devices. ACS Omega 2023, 8 (51), 48873–48883. 10.1021/acsomega.3c06331. [DOI] [PMC free article] [PubMed] [Google Scholar]
- Dai C.; Li B.; Li J.; Zhao B.; Wu R.; Ma H.; Duan X. Controllable Synthesis of NiS and NiS2 Nanoplates by Chemical Vapor Deposition. Nano Res. 2020, 13 (9), 2506–2511. 10.1007/s12274-020-2887-5. [DOI] [Google Scholar]
- Li G.; Zhang B.; Rao J.; Herranz Gonzalez D.; Blake G. R.; de Groot R. A.; Palstra T. T. Effect of vacancies on magnetism, electrical transport, and thermoelectric performance of marcasite FeSe2– δ (δ= 0.05). Chem. Mater. 2015, 27 (24), 8220–8229. 10.1021/acs.chemmater.5b03562. [DOI] [Google Scholar]
- Serhan M.; Jackemeyer D.; Long M.; Sprowls M.; Perez I. D.; Maret W.; Chen F.; Tao N.; Forzani E. Total Iron Measurement in Human Serum With a Novel Smartphone-Based Assay. IEEE J. Transl. Eng. Health Med. 2020, 8, 2800309. 10.1109/JTEHM.2020.3005308. [DOI] [PMC free article] [PubMed] [Google Scholar]
- Bobinihi F. F.; Fayemi O. E.; Onwudiwe D. C. Synthesis, characterization, and cyclic voltammetry of nickel sulphide and nickel oxide nanoparticles obtained from Ni(II) dithiocarbamate. Mater. Sci. Semicond. Process. 2021, 121, 105315. 10.1016/j.mssp.2020.105315. [DOI] [Google Scholar]
- Gurnani C.; Hawken S. L.; Hector A. L.; Huang R.; Jura M.; Levason W.; Perkins J.; Reid G.; Stenning G. B. G. Tin(IV) Chalcogenoether Complexes as Single Source Precursors for the Chemical Vapour Deposition of SnE2 and SnE (E = S, Se) Thin Films. Dalton Trans. 2018, 47 (8), 2628–2637. 10.1039/C7DT03848H. [DOI] [PubMed] [Google Scholar]
- Goldenberger D.; Perschil I.; Ritzler M.; Altwegg M. Simple ‘Universal’ DNA Extraction Procedure Compatible with Direct PCR Amplification. Cell. Mol. Life Sci. 1996, 52 (4), 295. 10.1007/BF01919509. [DOI] [PubMed] [Google Scholar]
- Yu L.; Yang B.; Liu Q.; Liu J.; Wang X.; Song D.; Wang J.; Jing X. Interconnected NiS Nanosheets Supported by Nickel Foam: Soaking Fabrication and Supercapacitors Application. J. Electroanal. Chem. 2015, 739, 156–163. 10.1016/j.jelechem.2014.12.031. [DOI] [Google Scholar]
- Thangaraj R.; Senthil Kumar A. Simultaneous Detection of Guanine and Adenine in DNA and Meat Samples Using Graphitized Mesoporous Carbon Modified Electrode. J. Solid State Electrochem. 2013, 17 (3), 583–590. 10.1007/s10008-012-1895-0. [DOI] [Google Scholar]
- Kotei P. A.; Boadi N. O.; Saah S. A.; Mensah M. B. Synthesis of Nickel Sulfide Thin Films and Nanocrystals from the Nickel Ethyl Xanthate Complex. Adv. Mater. Sci. Eng. 2022, 2022, 6587934. 10.1155/2022/6587934. [DOI] [Google Scholar]
- Mi L.; Ding Q.; Chen W.; Zhao L.; Hou H.; Liu C.; Shen C.; Zheng Z. 3D Porous Nano/Micro Nickel Sulfides with Hierarchical Structure: Controlled Synthesis, Structure Characterization and Electrochemical Properties. Dalton Trans. 2013, 42 (16), 5724–5730. 10.1039/c3dt00017f. [DOI] [PubMed] [Google Scholar]
- Chen Y.; Sun P.; Xing W. Cobalt Nitride Nanoflakes Supported on Ni Foam as a High-Performance Bifunctional Catalyst for Hydrogen Production via Urea Electrolysis. J. Chem. Sci. 2019, 131 (10), 169–178. 10.1007/s12039-019-1678-6. [DOI] [Google Scholar]
- Taylor A.; Sinclair H. On the Determination of Lattice Parameters by the Debye-Scherrer Method. Proc. Phys. Soc. 1945, 57 (2), 126–135. 10.1088/0959-5309/57/2/306. [DOI] [Google Scholar]
- Salavati-Niasari M.; Davar F.; Emadi H. Hierarchical Nanostructured Nickel Sulfide Architectures through Simple Hydrothermal Method in the Presence of Thioglycolic Acid. Chalcogenide Lett. 2010, 7 (12), 647–655. [Google Scholar]
- Yoshikawa M.; Murakami M.; Matsuda K.; Matsunobe T.; Sugie S.; Okada K.; Ishida H. Characterization of Si Nano-Polycrystalline Films at the Nanometer Level Using Resonant Raman Scattering. J. Appl. Phys. 2005, 98 (6), 063531. 10.1063/1.2060954. [DOI] [Google Scholar]
- Liu X.; Naraginti S.; Zhang F.; Sathishkumar K.; Saxena K. K.; Guo X. Unlocking the Unique Catalysts of CoTiO3/BiVO4@MIL-Fe(53) for Improving Cr(VI) Reduction and Tetracycline Degradation. Carbon Neutrality 2024, 3 (1), 15. 10.1007/s43979-024-00092-w. [DOI] [Google Scholar]
- Sahiner N.; Sel K.; Meral K.; Onganer Y.; Butun S.; Zay O.; Silan C. Hydrogel Templated CdS Quantum Dots Synthesis and Their Characterization. Colloids Surf., A 2011, 389 (1–3), 6–11. 10.1016/j.colsurfa.2011.09.006. [DOI] [Google Scholar]
- Tang C.; Cheng N.; Pu Z.; Xing W.; Sun X. NiSe Nanowire Film Supported on Nickel Foam: An Efficient and Stable 3D Bifunctional Electrode for Full Water Splitting. Angew. Chem. 2015, 127 (32), 9483–9487. 10.1002/ange.201503407. [DOI] [PubMed] [Google Scholar]
- Luo P.; Sun F.; Deng J.; Xu H.; Zhang H.; Wang Y. Tree-like NiS-Ni3S2/NF Heterostructure Array and Its Application in Oxygen Evolution Reaction. Acta Phys. - Chim. Sin. 2018, 34 (12), 1397–1404. 10.3866/PKU.WHXB201804022. [DOI] [Google Scholar]
- Hung T. F.; Yin Z. W.; Betzler S. B.; Zheng W.; Yang J.; Zheng H. Nickel Sulfide Nanostructures Prepared by Laser Irradiation for Efficient Electrocatalytic Hydrogen Evolution Reaction and Supercapacitors. Chem. Eng. J. 2019, 367, 115–122. 10.1016/j.cej.2019.02.136. [DOI] [Google Scholar]
- Yang Y.; Zhang K.; Lin H.; Li X.; Chan H. C.; Yang L.; Gao Q. MoS2-Ni3S2 Heteronanorods as Efficient and Stable Bifunctional Electrocatalysts for Overall Water Splitting. ACS Catal. 2017, 7 (4), 2357–2366. 10.1021/acscatal.6b03192. [DOI] [Google Scholar]
- Wu M.; Snook G. A.; Chen G. Z.; Fray D. J. Redox Deposition of Manganese Oxide on Graphite for Supercapacitors. Electrochem. Commun. 2004, 6 (5), 499–504. 10.1016/j.elecom.2004.03.011. [DOI] [Google Scholar]
- Nesbitt H. W.; Legrand D.; Bancroft G. M. Interpretation of Ni 2p XPS spectra of Ni conductors and Ni insulators. Phys. Chem. Min. 2000, 27, 357–366. 10.1007/s002690050265. [DOI] [Google Scholar]
- Kalaiyarasi J.; Pandian K.; Ramanathan S.; Gopinath S. C. B. Graphitic Carbon Nitride/Graphene Nanoflakes Hybrid System for Electrochemical Sensing of DNA Bases in Meat Samples. Sci. Rep. 2020, 10 (1), 12860. 10.1038/s41598-020-69578-8. [DOI] [PMC free article] [PubMed] [Google Scholar]
- Wang X.; Zhang J.; Wei Y.; Xing T.; Cao T.; Wu S.; Zhu F. A Copper-Based Metal-Organic Framework/Graphene Nanocomposite for the Sensitive and Stable Electrochemical Detection of DNA Bases. Analyst 2020, 145 (5), 1933–1942. 10.1039/C9AN02398D. [DOI] [PubMed] [Google Scholar]
- Grewal Y. S.; Shiddiky M. J. A.; Gray S. A.; Weigel K. M.; Cangelosi G. A.; Trau M. Label-Free Electrochemical Detection of an Entamoeba Histolytica Antigen Using Cell-Free Yeast-ScFv Probes. Chem. Commun. 2013, 49 (15), 1551–1553. 10.1039/c2cc38882k. [DOI] [PMC free article] [PubMed] [Google Scholar]
- Pang H.; Wei C.; Li X.; Li G.; Ma Y.; Li S.; Chen J.; Zhang J. Microwave-Assisted Synthesis of NiS2 Nanostructures for Supercapacitors and Cocatalytic Enhancing Photocatalytic H2 Production. Sci. Rep. 2014, 4 (1), 3577. 10.1038/srep03577. [DOI] [PMC free article] [PubMed] [Google Scholar]
- Wan S.; Qi J.; Zhang W.; Wang W.; Zhang S.; Liu K.; Zheng H.; Sun J.; Wang S.; Cao R. Hierarchical Co(OH)F Superstructure Built by Low-Dimensional Substructures for Electrocatalytic Water Oxidation. Adv. Mater. 2017, 29 (28), 1700286. 10.1002/adma.201700286. [DOI] [PubMed] [Google Scholar]
- Jian L.; Wang G.; Liu X.; Ma H. Unveiling an S-Scheme F–Co3O4@Bi2WO6 Heterojunction for Robust Water Purification. eScience 2024, 4 (1), 100206–100217. 10.1016/j.esci.2023.100206. [DOI] [Google Scholar]
- Wang D.; Huang B.; Liu J.; Guo X.; Abudukeyoumu G.; Zhang Y.; Ye B. C.; Li Y. A Novel Electrochemical Sensor Based on Cu@Ni/MWCNTs Nanocomposite for Simultaneous Determination of Guanine and Adenine. Biosens. Bioelectron. 2018, 102, 389–395. 10.1016/j.bios.2017.11.051. [DOI] [PubMed] [Google Scholar]
- Ng K. L.; Khor S. M. Graphite-Based Nanocomposite Electrochemical Sensor for Multiplex Detection of Adenine, Guanine, Thymine, and Cytosine: A Biomedical Prospect for Studying DNA Damage. Anal. Chem. 2017, 89 (18), 10004–10012. 10.1021/acs.analchem.7b02432. [DOI] [PubMed] [Google Scholar]
- Wang P.; Wu H.; Dai Z.; Zou X. Simultaneous Detection of Guanine, Adenine, Thymine and Cytosine at Choline Monolayer Supported Multiwalled Carbon Nanotubes Film. Biosens. Bioelectron. 2011, 26 (7), 3339–3345. 10.1016/j.bios.2011.01.011. [DOI] [PubMed] [Google Scholar]
- Dryhurst G.; Elving P. J. Electrochemical Oxidation of Adenine: Reaction Products and Mechanisms. J. Electrochem. Soc. 1968, 115 (10), 1014–1022. 10.1149/1.2410847. [DOI] [Google Scholar]
- Brett A. M. O.; Piedade J. A. P.; Serrano S. H. P. Electrochemical Oxidation of 8-Oxoguanine. Electroanalysis 2000, 12, 969–973. . [DOI] [Google Scholar]
- Hassan Q.; Meng Z.; Noroozifar M.; Kerman K. Methylene Blue-Modified Biochar from Sugarcane for the Simultaneous Electrochemical Detection of Four DNA Bases. Chemosensors 2023, 11 (3), 169. 10.3390/chemosensors11030169. [DOI] [Google Scholar]
- Zhang Z.; Zhao H.; Zeng Z.; Gao C.; Wang J.; Xia Q. Hierarchical Architectured NiS@SiO2 Nanoparticles Enveloped in Graphene Sheets as Anode Material for Lithium Ion Batteries. Electrochim. Acta 2015, 155, 85–92. 10.1016/j.electacta.2014.12.074. [DOI] [Google Scholar]
- Moulick A.; Milosavljevic V.; Vlachova J.; Podgajny R.; Hynek D.; Kopel P.; Adam V. Using CdTe/ZnSe Core/Shell Quantum Dots to Detect DNA and Damage to DNA. Int. J. Nanomed. 2017, 12, 1277–1291. 10.2147/IJN.S121840. [DOI] [PMC free article] [PubMed] [Google Scholar]
- Das S.; Chatterjee S.; Pramanik S.; Devi P. S.; Kumar G. S. A New Insight into the Interaction of ZnO with Calf Thymus DNA through Surface Defects. J. Photochem. Photobiol. B Biol. 2018, 178, 339–347. 10.1016/j.jphotobiol.2017.10.039. [DOI] [PubMed] [Google Scholar]
- Zhou W.; Feng M.; Valadez A.; Li X. J. One-Step Surface Modification to Graft DNA Codes on Paper: The Method, Mechanism, and Its Application. Anal. Chem. 2020, 92 (10), 7045–7053. 10.1021/acs.analchem.0c00317. [DOI] [PubMed] [Google Scholar]
- Sinha R.; Das S. K.; Ghosh M.; Chowdhury J. Fabrication of Gold Nanoparticles Tethered in Heat-Cooled Calf Thymus-Deoxyribonucleic Acid Langmuir-Blodgett Film as Effective Surface-Enhanced Raman Scattering Sensing Platform. Front. Chem. 2022, 10, 1034060. 10.3389/fchem.2022.1034060. [DOI] [PMC free article] [PubMed] [Google Scholar]
- Mishra E.; Majumder S.; Varma S.; Dowben P. A. X-Ray Photoemission Studies of the Interaction of Metals and Metal Ions with DNA. Z. Fur Phys. Chem. 2022, 236 (4), 439–480. 10.1515/zpch-2021-3037. [DOI] [Google Scholar]
- Luo P.; Zhang H.; Liu L.; Zhang Y.; Deng J.; Xu C.; Hu N.; Wang Y. Targeted Synthesis of Unique Nickel Sulfide (NiS, NiS2) Microarchitectures and the Applications for the Enhanced Water Splitting System. ACS Appl. Mater. Interfaces 2017, 9 (3), 2500–2508. 10.1021/acsami.6b13984. [DOI] [PubMed] [Google Scholar]
- Lapicki A.; Sakamoto F.; Sandhu A. Monitoring DNA Hybridization by Quantification of Nitrogen Content Using X-Ray Photoelectron Spectroscopy. Jpn. J. Appl. Phys. 2007, 46 (1–3), L49. 10.1143/JJAP.46.L49. [DOI] [Google Scholar]
- Wang H. S.; Ju H. X.; Chen H. Y. Simultaneous Determination of Guanine and Adenine in DNA Using an Electrochemically Pretreated Glassy Carbon Electrode. Anal. Chim. Acta 2002, 461 (2), 243–250. 10.1016/S0003-2670(02)00297-0. [DOI] [Google Scholar]
- Sun W.; Li Y.; Duan Y.; Jiao K. Direct Electrocatalytic Oxidation of Adenine and Guanine on Carbon Ionic Liquid Electrode and the Simultaneous Determination. Biosens. Bioelectron. 2008, 24 (4), 988–993. 10.1016/j.bios.2008.07.068. [DOI] [PubMed] [Google Scholar]
- Wang M.; Guo H.; Xue R.; Guan Q.; Zhang J.; Zhang T.; Sun L.; Yang F.; Yang W. A Novel Electrochemical Sensor Based on MWCNTs-COOH/Metal-Covalent Organic Frameworks (MCOFs)/Co NPs for Highly Sensitive Determination of DNA Base. Microchem. J. 2021, 167, 106336–106343. 10.1016/j.microc.2021.106336. [DOI] [Google Scholar]
- Ji L.; Yu S.; Zhou X.; Bao Y.; Yang F.; Kang W.; Zhang X. Modification of Electron Structure on the Semiconducting Single-Walled Carbon Nanotubes for Effectively Electrosensing Guanine and Adenine. Anal. Chim. Acta 2019, 1079, 86–93. 10.1016/j.aca.2019.06.027. [DOI] [PubMed] [Google Scholar]
- Guo H.; Yang Z.; Sun L.; Lu Z.; Wei X.; Wang M.; Yu Z.; Yang W. Imine-Linked Covalent Organic Framework with High Crystallinity for Constructing Sensitive Purine Bases Electrochemical Sensor. J. Colloid Interface Sci. 2024, 659, 639–649. 10.1016/j.jcis.2023.12.180. [DOI] [PubMed] [Google Scholar]
- Vinoth V.; Kaimal R.; Selvamani M.; Michael R.; Pugazhenthiran N.; Mangalaraja R. V.; Valdés H.; Anandan S. Synergistic Impact of Nanoarchitectured GQDs-AgNCs(APTS) Modified Glassy Carbon Electrode in the Electrochemical Detection of Guanine and Adenine. J. Electroanal. Chem. 2023, 934, 117302. 10.1016/j.jelechem.2023.117302. [DOI] [Google Scholar]
- Mao B.; Qian L.; Govindhan M.; Liu Z.; Chen A. Simultaneous Electrochemical Detection of Guanine and Adenine Using Reduced Graphene Oxide Decorated with AuPt Nanoclusters. Microchim. Acta 2021, 188 (8), 276. 10.1007/s00604-021-04926-7. [DOI] [PubMed] [Google Scholar]
- Zhang M.; Gan F.; Cheng F. Electrochemical Behaviors and Simultaneous Determination of Guanine and Adenine Based on Highly Ordered Pd-Nanowire Arrays-Modified Glassy Carbon Electrode. Anal. Methods 2015, 7 (12), 4988–4994. 10.1039/C5AY00608B. [DOI] [Google Scholar]
- Vishnu N.; Badhulika S. Single Step Grown MoS2 on Pencil Graphite as an Electrochemical Sensor for Guanine and Adenine: A Novel and Low Cost Electrode for DNA Studies. Biosens. Bioelectron. 2019, 124, 122–128. 10.1016/j.bios.2018.08.055. [DOI] [PubMed] [Google Scholar]
- Sha R.; Vishnu N.; Badhulika S. Single Step Synthesis of 2-D Marcasite FeS2 Micro-Flowers Based Electrochemical Sensor for Simultaneous Detection of Four DNA Bases. IEEE Trans. Nanotechnol. 2022, 21, 374–379. 10.1109/TNANO.2022.3190223. [DOI] [Google Scholar]
Associated Data
This section collects any data citations, data availability statements, or supplementary materials included in this article.