

Abstract
Compared to primary pancreatic islets, insulinoma cell-derived 3D pseudoislets offer a more accessible, consistent, renewable, and widely applicable model system for optimization and mechanistic studies in type 1 diabetes (T1D). Here, we report a simple and efficient method for generating 3D pseudoislets from MIN6 and NIT-1 murine insulinoma cells. These pseudoislets are homogeneous in size and morphology (~150 µm), exhibit functional glucose-stimulated insulin secretion (GSIS) up to 18 days (NIT-1) enabling long-term studies, are produced in high yield [>35,000 Islet Equivalence from 30 ml culture], and are suitable for both in vitro and in vivo studies, including for encapsulation studies. To enable non-invasive longitudinal monitoring of graft survival in vivo, we transduced NIT-1 cells with green fluorescent protein-luciferase and confirmed comparable morphology, viability, and GSIS to untransduced cells in vitro. After subcutaneous implantation, we show capability to monitor graft survival in immunodeficient mice, recurrence of autoimmunity in non-obese diabetic mice, and allorejection in C57BL/6 mice. Overall, this platform provides an accessible protocol for generating high yields of 3D pseudoislets and non-invasive longitudinal monitoring of graft survival in different models offer advantages over primary islets for optimization and mechanistic studies of β cell biology, drug discovery, T1D pathogenesis and prevention, and β cell transplantation.
Keywords: MIN6, NIT-1, islet, transplantation, encapsulation
Graphical Abstract.
Introduction
Pancreatic islets are responsible for regulating glucose metabolism, and β cells are responsible for counteracting elevated glucose levels through glucose-stimulated insulin secretion (GSIS) 1 . Type 1 diabetes (T1D) is an autoimmune disease characterized by the immune destruction of insulin-secreting pancreatic β cells2–4 and requires lifelong exogenous insulin supplementation to regulate glucose metabolism5–9. Thus, the current standard of care for T1D is not curative and patients can experience poor metabolic control, hypoglycemia, long-term complications like nephropathy and retinopathy, and reduced quality of life and life expectancy10–12. Finally, T1D is a growing global concern, with a prevalence of approximately 8.4 million in 2021 that is projected to increase to 15.5 million by 2040 13 .
For basic and translational research in T1D, models using both primary pancreatic islets and insulinoma cell lines have been validated. Primary islets are less ideal for optimization studies due to their limited supply, high cost of procurement, complex and time-consuming isolation procedure, ethical considerations, and high batch-to-batch variability in phenotype and function, requiring large sample sizes14–16. The use of insulinoma cell lines effectively addresses these challenges given their ease of expansion, lack of ethical considerations, limited costs associated with their procurement, and reduced batch-to-batch variability for optimization studies. Toward this, several insulinoma cell lines have been established from humans (CM, EndoC-βH1), hamsters (HIT), mice (RIN-m, MIN, BTC, NIT-1, TC3), and rats (RIN-r, INS-1), with some of these lines displaying functional GSIS17–22.
The use of these insulinoma cell lines have been validated for both mechanistic and translational studies, including β cell transplantation and tolerance-inducing protocols. Some cell lines (MIN6) have mixed endocrine cell compositions with metabolic and transcriptomic profiles similar to primary islets22,23 and have been used to study mechanisms of regulated insulin secretion24,25, lipid metabolism 26 , and oxygen consumption 25 . Insulinoma cells have also enabled studies of cell interactions, such as beneficial effects of extracellular matrix 27 or supportive stromal cells28,29, co-culture with other endocrine cells to study cell–cell interactions within islets 30 , and mechanotransduction pathways 31 . Finally, their capability to reverse diabetes after transplantation in diabetic mice32–34 and as a model to test autoimmunity 35 and prevention 36 were also reported.
Despite their wide application in T1D research, there is no consensus on an optimal cell configuration. Studies more commonly rely on insulinoma cells grown in two-dimensional (2D) planar culture rather than aggregated three-dimensional (3D) insulinoma cell clusters, which would more closely recapitulate the morphology and functionality of primary islets. Several studies reported that 3D insulinoma cell clusters better represent primary islets in terms of β cell signature gene expression, mechanosensing mechanisms 31 , and functionality in vitro18,29,33,37,38 and in vivo after transplantation 34 . The relatively limited use of 3D clusters can likely be explained by the complexity of current protocols to generate 3D insulinoma clusters, such as culture in non-adherent cell wells27–30,38–40, hanging drop 41 , microgravity-simulating culture 33 , microfluidics 42 , bioreactors25,43, microwells31,34,37,44,45, or hydrogel microcapsules32,46, which limits their accessibility to bioengineering-specialized labs and precludes their full utilization in T1D basic and translational studies.
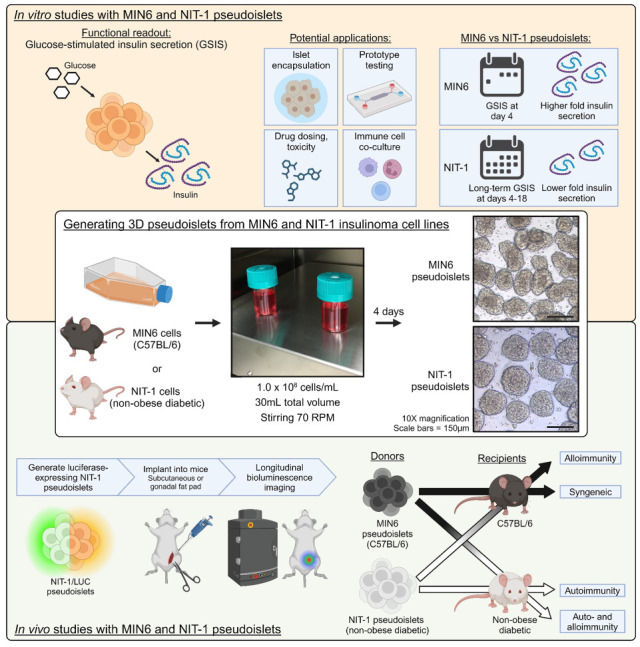
Here, we developed a method to generate MIN6 (C57BL/6 background) and NIT-1 [non-obese diabetic (NOD) background] insulinoma 3D pseudoislets that is (1) easier and more accessible than previous protocols by using commercially available bioreactors and stirring plates and (2) reproducible and optimized in cell seeding density and stirring speed for generating large quantities of pseudoislets with functional GSIS. We chose to optimize MIN6 and NIT-1 cell lines as their combinatorial implantation into C57BL/6 or NOD mice enable in vivo mechanistic and therapeutic studies representing a variety of disease contexts (syngeneic diabetes reversal, allorejection, autoimmunity, or both allo- and autoimmunity). Pseudoislets generated by this method can offer several advantages over primary islets in terms of logistics and cost-effectiveness [at least 35,000 Islet Equivalence (IEQ) from one 30 ml flask versus 250 or 1,000 IEQ from mouse and rat donors] and experimentation with less batch-to-batch and intra-batch variability. NIT-1 pseudoislets maintained GSIS up to 18 days in culture, enabling long-term in vitro studies compared to primary islets. We further validated the use of these pseudoislets for in vitro studies by testing two previously reported encapsulation methods47,48 for downstream β cell replacement studies. Finally, based on previous work with 2D NIT-1 cell delivery35,36, we report the generation of luciferase- and green fluorescent protein (GFP)-expressing NIT-1 pseudoislets with preserved GSIS function in vitro. We also demonstrate their utility for in vivo studies, enabling non-invasive and longitudinal monitoring of graft survival in multiple animal models including immunodeficient mice, autoreactivity in NOD mice, and graft rejection in allogeneic recipient mice.
Materials and Methods
Animals
Mice and rats were housed in specific pathogen-free facilities without additional special housing conditions. Mice were handled according to University of Miami Institutional Animal Care and Use Committee-approved protocols (IACUC 22-013). Three- to four-month-old male and female NOD.Cg-Prkdcscid/J mice (The Jackson Laboratory strain # 001303, Bar Harbor, ME; RRID:IMSR_JAX:001303; NOD/SCID) were used as immunodeficient recipients of NIT-1/LUC pseudoislets. Immunocompetent, pre-diabetic 8-week-old female NOD/ShiLtJ mice (The Jackson Laboratory strain # 001976; RRID:IMSR_JAX:001976; NOD) were used as recipients for autoimmune rejection of NIT-1/LUC pseudoislets; female mice were used due to higher diabetes incidence. Immunocompetent, 8-week-old male and female C57BL/6J mice (The Jackson Laboratory strain # 000664; RRID:IMSR_JAX:000664) were used as recipients for alloimmune rejection of NIT-1/LUC pseudoislets. Mice were randomly assigned to experimental groups and approximately equal proportions of male and female mice were present in all groups unless otherwise stated. Primary mouse islets were acquired from 14-week-old DBA/2J mice (The Jackson Laboratory strain # 000671; RRID:IMSR_JAX:000671; DBA), and primary rat islets were acquired from 11- through 14-week-old Brown Norway rats (Envigo RMS/Inotiv, Lafayette, IN, USA; strain BN/RijHsd; RRID:RGD_5508393).
Cell Lines
All cells were cultured in a humidified atmosphere of 95% air and 5% CO2 at 37°C. MIN6 cells (AddexBio, San Diego, CA, USA; RRID:CVCL_0431; sex unspecified) were cultured in MIN6 media, comprised of Dulbecco’s Modified Eagle Medium supplemented with 15% fetal bovine serum (FBS), 0.05 mM 2-mercaptoethanol, 30 mM D-(+)-glucose, 100 units/ml penicillin, and 100 µg/ml of streptomycin (all reagents obtained from ThermoFisher, Waltham, MA, USA). NIT-1 (ATCC, Manassas, VA, USA; RRID:CVCL_3561; female) and NIT-1/LUC cells were cultured in F-12K Medium (ATCC), 2 mM l-glutamine, 10% FBS, 100 units/ml penicillin, and 100 µg/ml of streptomycin (unless otherwise specified, all reagents obtained from ThermoFisher, Waltham, MA, USA).
Isolation of Primary Rodent Islets and Procurement of Primary Human Islets
Isolation of DBA/2J mouse and Brown Norway rat islets were performed as previously described 49 . Briefly, rodents were anesthetized and a midline incision was made to expose the pancreas, which was subsequently distended by injection of a collagenase solution into the pancreatic bile duct. Animals were sacrificed and pancreatic tissue was collected for static enzymatic digestion at 37°C followed by mechanical disruption by repeated passages through needles of decreasing gauge. Human islets were procured from Prodo Labs or the cGMP (current Good Manufacturing Practice) Human Islet Cell Processing Facility at the Diabetes Research Institute (DRI), University of Miami (UM), Miami, FL, USA. For the latter, human islets were isolated using a modification of the automated method according to the protocol standardized as part of the Clinical Islet Transplant (CIT) consortium and under the exemption issued by the UM Institutional Review Board (IRB).
Preparation of pHEMA Plates
Poly(2-hydroxyethyl methacrylate) (pHEMA)-coated plates were generated for non-adherent static culture of MIN6 cells. pHEMA was prepared in a stock concentration of 100 mg/ml in 95% ethanol in water. At the time of use, stock pHEMA was diluted 1:10 in 95% ethanol to a final concentration of 10 mg/ml. The flasks or culture wells were incubated overnight in the cell culture incubator and subsequently sterilized overnight under UV lamp. The flasks were cultured in a humidified atmosphere of 95% air and 5% CO2 at 37°C.
Cell Culture and Quantification in pHEMA Plates
MIN6 cells (AddexBio, San Diego, CA, USA) were suspended at three different initial seeding conditions (0.25, 0.5, 1.0 × 10⁶ cells/ml) in MIN6 media, and 2 ml of cell suspension was added per well to a pHEMA-coated plate. Media was changed on days 3, 5, 7, and 10 in culture by centering MIN6 clusters in the middle of the well and removing media and cellular debris from the extremities of the wells (without disturbing clusters in the middle).
At days 3, 5, 7, and 10, MIN6 clusters were centered in the middle of the well to create a high density of clusters/mm2. A Leica microscope was used to take 5 images/well in different locations. Circularity of clusters was determined by the ratio of the longest diameter of clusters to the shortest diameter or by Heywood circularity, a ratio of the perimeter of a cluster to the circumference of a circle with the same area 50 .
The MTT assay was used to estimate the number of viable cells in pHEMA-coated well static culture. A stock solution of 5 mg/ml MTT was prepared in 1× phosphate-buffered saline (PBS). A standard curve was created by seeding cells in known increasing densities (ranging from 0.25 to 1.0 × 10⁶ cells) in 2D culture. An MTT assay was then performed on the 2D cells following the manufacturer’s protocol (Promega, Madison, WI, USA) and a linear relationship between absorbance readout and approximate cell number was established. These results were then compared to the standard curve to generate an estimate of the number of viable cells within the 3D spheroids.
Bioreactor Culture of Insulinoma Cells
MIN6, NIT-1, and NIT-1/LUC cells were expanded in tissue culture-treated flasks (Corning, Corning, NY, USA) before seeding in 30 ml Biott ABLE bioreactors (ReproCELL, Beltsville, MD, USA). For experiments optimizing bioreactor conditions, insulinoma cells were seeded at concentrations indicated in each experiment (including 0.5, 1.0, 2.0, or 4.0 × 10⁶ cells/ml) with 30 ml total media per bioreactor. The bioreactors were then placed on magnetic stirrer plates (Chemglass Life Sciences LLC, Vineland, NJ, USA) set to stirring speeds indicated in each experiment (including 40, 70, or 100 RPM). The media was replenished every other day by allowing the clusters to settle for 5 min and carefully aspirating 25 ml, leaving the settled clusters in 5 ml, and adding 25 ml fresh media for a final volume of 30 ml. For experiments generating pseudoislets using optimized bioreactor conditions, insulinoma cells were seeded at 1.0 × 10⁶ cells/ml with 30 ml total volume (30 × 106 cells total) in bioreactors stirring at 70 RPM.
ICC4 Islet Measurements, Counting, and Microscopy
An ICC4 Islet Cell Counter (BioRep, Miami Lakes, FL, USA) was used to quantify the diameter, morphology, and culture yield of pseudoislets. A 100 μl sample of stirring suspension from the bioreactor and 250 μl of PBS were placed in an Islet Cell Counter Dish (ICC-DISH). Number of clusters, IEQ, individual and average cluster diameter, and Heywood characteristics were measured. Phase-contrast images were taken using an inverted phase-contrast microscope (Leica microsystems, Wetzlar, Germany) at 4×, 10×, and 20× magnification for each condition. NIT-1/LUC pseudoislets also underwent confocal microscopy (SP5, Leica Microsystems, Wetzlar, Germany) after 1-h incubation in NIT-1 media supplemented with 20 µM Hoechst at 37°C (ThermoFisher, Waltham, MA, USA). The diameters of primary mouse, rat, and human islets were quantified in ImageJ.
Enzymatic Disassociation of Pseudoislets
We enzymatically disassociated insulinoma clusters to determine cellularity (number of cells per cluster) and single cell viability. A 100 μl sample of clusters was taken from the bioreactor and placed in a 1.5 ml low protein-binding microcentrifuge tube and centrifuged at 150 relative centrifugal force (RCF) for 1 min. Media was aspirated with care as to avoid aspirating the pellet, 300 μl of 0.5% trypsin-EDTA (ThermoFisher, Waltham, MA, USA) was added, and the sample was incubated at 37°C for 3 min. In total, 300 μl of fresh culture media was added to inactivate the trypsin and the sample was spun at 150 RCF for 1 min. The supernatant was removed, and cells were resuspended in 1 ml of culture media. The cell suspension was mixed in a 1:1 ratio with trypan blue and counted using an automated cell counter (Bio-Rad Laboratories, Hercules, CA, USA) in duplicate to determine cell number and viability in the pseudoislets.
Alginate Encapsulation
MIN6 and NIT-1 pseudoislets were encapsulated in a single capsule of alginate using a previously optimized protocol 47 . Briefly, MIN6 clusters were resuspended in 1.2% (w/v) in 0.9% saline solution, sterile-filtered ultra-pure medium viscosity high-guluronic acid (MVG) alginate (lot # BP-1103-01, Novamatrix). The cluster suspension was extruded from an electrostatic droplet generator (NISCO) at a flow rate of 100 μl/min and 7.5 kV voltage through a 0.5 mm nozzle into a SrCl2 gelling bath containing 200 mM mannitol (Millipore Sigma, St. Louis, MO, USA) and 25 mM HEPES (Gibco). After crosslinking, the capsules were purified with three HBSS++ (Millipore Sigma, St. Louis, MO, USA) washes and cultured in a non-treated 10 cm petri dish (Corning, Corning, NY, USA) containing the respective cell culture media for 24 h prior to testing.
Conformal Coating Encapsulation
Conformal coating (CC) of MIN6, NIT-1, and NIT-1/LUC pseudoislets was performed with the previously described emulsion method 48 . Briefly, 5% (w/v), 10 kDa, 8-arm, 75% functionalized poly(ethylene) glycol (PEG; JenKem, Plano, TX, USA) was partially cross-linked by mixing with 2 kDa PEG-dithiol (JenKem, Plano, TX, USA) in a 5:3 molar ratio (base:cross-linker) and 1 N HCl (Millipore Sigma, St. Louis, MO, USA) to a pH of 3. One microliter of 1 N NaOH (Millipore Sigma, St. Louis, MO, USA) was added to return to neutral pH, and pseudoislets were resuspended in the partially cross-linked polymer at a density of 100,000 IEQ/ml. The pseudoislets were run through the CC device and collected within a cross-linking emulsion, which was prepared by dripping 33 ml of 25 mg/ml molecular biology-grade dithiothreitol (VWR, Radnor, PA, USA) in HBSS−/− into 500 ml of poly(propylene) glycol/10% Span80. Coated pseudoislets were incubated in the emulsion for 12 min, then poured into 200 ml of light mineral oil (Millipore Sigma, St. Louis, MO, USA) and topped off to 500 ml with HBSS−/−. The mixture was stirred at 240 rotations per minute for 2 min and then centrifuged at 430 RCF for 5 min and supernatant aspirated. The CC pseudoislets were incubated in 250 µl 1× PEG-SH for 1 min, pelleted, and washed twice with culturing medium before culturing.
Glucose-Stimulated Insulin Secretion
GSIS was performed on MIN6, NIT-1, and NIT-1/LUC pseudoislets at selected time points between 4 and 18 days after seeding in bioreactors to quantitatively assess pseudoislet functionality. GSIS buffer contained 114 mM NaCl, 4.72 mM KCl, 2.56 mM CaCl2·2H2O, 1.2 mM KH2PO4, 1.2 mM MgSO4·7H2O, 0.2% w/v bovine serum albumin, 25 mM HEPES, and 26 mM sodium bicarbonate in ddH2O. A polycarbonate cell culture insert with a pore size of 12 µm (Millipore Sigma, St. Louis, MO, USA) was used in a 24-well plate. In total, 250 IEQ of pseudoislets were placed in triplicate in low glucose solution (2.2 mM glucose) for 1 h as a pre-conditioning step. The cell culture inserts with the pseudoislets were then transferred to 2.2 mM glucose solution (low glucose, L1), 16.7 mM glucose (high glucose, H), 2.2 mM glucose solution (low glucose, L2), and 25 mM KCl in 2.2 mM glucose solution (KCl) for 1 h in each step. The supernatant was collected after each incubation step. Where possible (unencapsulated pseudoislets), the pseudoislets were collected in TPER Reagent (ThermoFisher, Waltham, MA, USA) for DNA analysis. DNA was measured using Quant-iT™ PicoGreen® dsDNA Reagent and Kits (ThermoFisher, Waltham, MA, USA) according to manufacturer protocol. A mouse insulin enzyme-linked immunosorbent assay kit (Mercodia, Uppsala, Sweden) was used to determine the insulin concentration in each step. Insulin secretion profile is shown as micrograms per liter of insulin per microgram of DNA. GSIS of primary islets (mouse, rat, human) was performed under the same setup and conditions without DNA quantification.
Generation of NIT-1/LUC Cell Line
Second-generation lentiviral constructs comprised by the pHR2-GLF lentiviral vector, which encodes a GFP-firefly luciferase fusion gene, packaging vector, and pVSV-G-expressing vectors (3:2:1 ratio), were generously provided by Dr. Remi J. Creusot 51 . 2.5 × 10⁴ passage 11 NIT-1 cells were seeded in a tissue culture-treated 48-well plate for 24 h and then incubated with 300 µl NIT-1 media spiked with the above vector for 24 h at 37°C. The media was then changed, cells were incubated for another 24 h, and then harvested. Transduced cells underwent two rounds of expansion followed by two to four rounds of fluorescence-activated cell sorting selecting for GFP-expressing cells using a BD FACSAria cell sorter (Franklin Lakes, NJ, USA).
Diabetes Induction and Monitoring
NOD/SCID mice underwent diabetes induction by intraperitoneally injecting 5 doses of 50 mg/kg streptozotocin once daily for 5 days. Afterward, blood glucose was measured by glucose test strips (Ascensia, Parsippany, NJ, USA) and tail needlestick once daily for 7 days to monitor for diabetes induction, defined as three consecutive readings above 250 mg/dl. Longitudinal blood glucose measurements were also performed with this method. Plasma C-peptide was measured using a mouse C-peptide enzyme-linked immunosorbent assay kit (ALPCO, Salem, NH, USA). One hundred microliters of blood samples was obtained from mice via submandibular vein puncture and collected into an EDTA-treated capillary tube (Sarstedt, Nümbrecht, Germany) on ice. Samples were centrifuged at 3,000 RCF for 10 min at 4°C, and serum supernatant was collected. The protocol was then performed according to manufacturer instructions. Two technical replicates were performed per subject and averaged. Longitudinal diabetes incidence was monitored by weekly urine dipstick testing (Diastix; Bayer, Leverkusen, Germany), and positive results were followed up with daily blood glucose measurements.
NIT-1/LUC Implantation
NIT-1/LUC pseudoislets were implanted into the left inguinal subcutaneous white adipose tissue (ISWAT) as previously described48,52. Briefly, mice were anesthetized with 2% isoflurane and the left inguinal area and medial left hindlimb were shaved. The area was sanitized using an alcohol towelette. A 25-mm vertical incision was made in the left inguinal area and the inferior epigastric artery was identified. Superior to this location, a small pocket was made in the underlying white adipose tissue. Pseudoislets were resuspended in 10 μl plasma (obtained from a healthy sex- and strain-matched donor) and deposited into the pocket. Five microliters of recombinant human thrombin (Recothrom) was added on top. The incision was closed using 5-0 polydioxanone suture (Ethicon, Cincinnati, OH, USA) and mice were administered 0.1 mg/kg subcutaneous extended-release buprenorphine. Mice recovered in a cage placed upon a heating pad (37°C). Following recovery, mice were given water treated with 140 mg/l of Clavamox and injected subcutaneously with 2 ml of 0.9% isotonic saline every other day for 14 days. For NIT-1/LUC implantation into the gonadal fat pad, the same perioperative measures were performed with the following exceptions: At midline and 1.5 cm above the genitalia, a 1 cm vertical midline incision was made in the skin and underlying abdominal muscle to access the peritoneal cavity. The underlying left-sided gonadal fat pad was extracted and unfolded upon a saline-moistened sterile gauze towelette. Pseudoislets were deposited onto the fat pad as described above. The fat pad was re-folded, and the external surface was treated with an additional 10 µl of plasma and 10 µl of thrombin. The fat pad was re-inserted through the incision sites, and both incision sites were sutured. For transplantation studies with immunosuppression, abatacept (CTLA4 Ig, trade name Orencia; purchased from Bristol Myers Squibb, New York, NY, USA) was administered intraperitoneally with a 75 mg/kg loading dose 1 day prior to implantation and with 37.5 mg/kg maintenance doses starting 1 day after implantation and continuing every other day.
Quantification of Bioluminescence
Bioluminescence studies of NIT-1/LUC pseudoislets were performed using an IVIS Spectrum and IVISbrite d-luciferin prepared according to manufacturer protocols (PerkinElmer, Waltham, MA, USA). For in vitro studies, pseudoislets were transferred to a white/opaque 96-well plate in 300 μl NIT-1 media. Plates were placed within the imaging chamber prewarmed to 37°C and allowed to equilibrate for 10 min. A multichannel pipette was used to add concentrated d-luciferin into the media to achieve a final concentration of 150 µg/ml in media and was immediately imaged. For in vivo studies, shaving performed during implantation was maintained as needed. The injection site was sanitized with an alcohol towelette and then d-luciferin was intraperitoneally injected at 150 mg/kg. A kinetic curve was established by imaging mice every 5 min for 25 min to determine the optimal imaging time of 15 min. For experimental imaging, mice were returned to their cages for 15 min following injection and then anesthetized with 2% isoflurane and imaged. For endpoint ex vivo studies, mice were imaged as above and then euthanized with carbon dioxide, and the implantation site was immediately removed and placed into a 24-well plate containing prewarmed NIT-1 media supplemented with 150 µg/ml of d-luciferin and IVIS imaging immediately followed. Quantification was performed using Living Image 4.8.2 (PerkinElmer, Waltham, MA, USA) by placing a region of interest that matched the circumference of wells (for in vitro and ex vivo studies) or encircled the graft site (in vivo studies); all regions of interest were the same size per experiment type. Bioluminescence images across all timepoints were analyzed as a single batch under the same settings. Total flux was obtained (photons/second) and log2-transformed data was reported. For NIT-1/LUC implantation into the gonadal fat pad, the same procedures were performed except for kinetic imaging at day 1 post-implantation, which revealed an optimal imaging time of 20 min post-injection.
Flow Cytometry
Fluorescence activated cell sorting (FACS) buffer comprised PBS containing 0.5% (w/v) bovine serum albumin, 25 mM HEPES, and 2 mM EDTA (all reagents from ThermoFisher, Waltham, MA, USA). Prior to use, all reagents were titrated to an optimal concentration based on maximized staining index ([Median fluorescence intensity of positive population − median fluorescence intensity of negative population]/[2*standard deviation of negative population]). Flow cytometry reagents are detailed in Supplemental Table S1.
For in vitro assessments of NIT-1/LUC pseudoislet viability and proportion of GFP+ cells, pseudoislets were disassociated into single cells as described above and suspended in FACS buffer containing 0.5 µg/ml of DAPI (ThermoFisher, Waltham, MA, USA). Flow cytometry was performed using a CytoFLEX S (Beckman Coulter, Brea, CA, USA) to measure GFP fluorescence and DAPI exclusion for viability.
For ex vivo assessments, solid organs were mechanically disassociated using a 3-ml syringe plunger (BD, Franklin Lakes, NJ, USA) and 40 µm cell strainer (Corning, Corning, NY, USA). Single cell suspensions underwent LIVE/DEAD Fixable Blue staining according to manufacturer protocol (ThermoFisher, Waltham, MA, USA), two washes in FACS buffer, CD16/32 blocking for 15 min in 2.4G2 hybridoma supernatant (HB-197; ATCC, Manassas, VA, USA), antibody surface staining for 20 min, and two washes in FACS buffer. Centrifugation took place between each step at 450 RCF for 5 min at 4°C. Subsequent intracellular staining was performed using the Foxp3 Transcription Factor kit (ThermoFisher, Waltham, MA, USA) with 18-h (overnight) fixation/permeabilization at 4°C, two washes with 1× permeabilization buffer, intracellular antibody staining for 30 min, two washes with 1× permeabilization buffer, and final resuspension in FACS buffer. Centrifugation took place between each step at 780 RCF for 7 min at 4°C. Tetramer staining was performed as above with the following modifications: after blocking, samples were stained with tetramer solution for 40 min at room temperature, then a 10× concentrated antibody surface staining cocktail was added directly to the samples (resulting in the optimized 1× antibody staining concentration), and staining proceeded for another 20 min at room temperature.
Data were obtained using a 5-laser Cytek Aurora (Cytek Biosciences, Fremont, CA, USA) and analyzed with Kaluza Analysis 2.1 (Beckman Coulter, Brea, CA, USA) or OMIQ (Dotmatics, Boston, MA, USA). Regarding the latter, data from biological replicates were concatenated/pooled, pre-gated on viable, CD45+, CD3+, CD4+, or CD8+ cells, and 13,500 events were subsampled for each treatment. Dimensionality reduction was performed using uniform manifold approximation and projection (UMAP), and clustering was performed using FlowSOM with elbow metaclustering 53 .
Mixed Lymphocyte Reaction
CM media consisted of 5% FBS, 2 mM l-glutamine, 100 units/ml penicillin, 100 µg/ml of streptomycin, and 55 µM 2-mercaptoethanol in RPMI 1640 (all reagents were acquired from ThermoFisher, Waltham, MA, USA). Peripheral blood (100 µl) from C57BL/6 recipients of uncoated or CC NIT-1/LUC (NOD background) implants or sham mice was collected through submandibular vein puncture into an EDTA-treated Microvette capillary tube (Sarstedt, Nümbrecht, Germany). Spleens from non-diabetic NOD mice were harvested and mechanically processed as described above. Blood and spleen samples were treated with ACK lysing buffer (ThermoFisher, Waltham, MA, USA) and counted using Trypan blue exclusion as described above. C57BL/6 cells (responders) were labeled with CellTrace Violet according to manufacturer protocol (ThermoFisher, Waltham, MA, USA). NOD splenocytes (stimulators) were depleted of CD3+ cells using MojoSort magnetic cell separation kits and manufacturer protocol (Biolegend, San Diego, CA, USA). The CD3+ cells were discarded, and remaining cells were inactivated by incubation in CM media containing 50 µg/ml of mitomycin C (Millipore Sigma, St. Louis, MO, USA) for 45 min at 37°C and 5% CO2. In 96-well tissue culture-treated round-bottom plates (Corning, Corning, NY, USA), 1 × 10⁵ responder cells were co-cultured with 2 × 10⁵ stimulator cells in a final volume of 150 µl CM media for 4 days, after which samples were harvested for flow cytometry. For each C57BL/6 recipient, two technical replicates were performed and the average of these replicates was used for analysis.
Insulitis Quantification
Formalin-fixed paraffin-embedded pancreas sections (5 µm thick) were stained with hematoxylin and eosin. Two blinded investigators assessed islets greater than 50 µm in diameter for insulitis with the following scale: no lymphocyte presence = no insulitis, lymphocytes present adjacent to an islet without infiltration = peri-insulitis, lymphocytic infiltration occupying 0% to 10% of islet area = grade 1, 10% to 25% = grade 2, 25% to 50% = grade 3, >50% = grade 4. For each pancreas, two neighboring sections were assessed. Counts between neighboring sections and investigators were used for analysis, and insulitis grades 1, 2, and 3 were combined for statistical analysis due to low counts.
Statistics
Data are presented as mean ± SD. Graphing and statistics were performed in GraphPad Prism 9.4.1 (GraphPad Software, La Jolla, CA, USA) using two-tailed Student’s t-test, one-way analysis of variance (ANOVA) with Tukey’s post hoc test, Kruskal–Wallis with Dunn’s test for multiple comparisons, two-way repeated-measures ANOVA with Tukey’s post hoc testing, and chi-square testing. Least squares regression or one-phase association models were used to model some longitudinal data, and the best-fit model was determined with the F test. Data were analyzed for normality of residuals using the Shapiro–Wilk test and Q-Q plotting and for homoscedasticity using the Brown–Forsythe test to determine the appropriate statistical test. P-values less than 0.05 were considered statistically significant. Statistical details per experiment can be found in figure legends. For in vivo and ex vivo experiments, n represents individual animals or samples taken from individual animals. For in vitro experiments, n represents a sample of cells.
Results
Generating MIN6 Pseudoislets in Static Culture on pHEMA-Coated Surfaces
We seeded MIN6 cells in pHEMA-coated wells to generate pseudoislets in static conditions as previously reported 40 . We determined if initial seeding density (0.25, 0.5, or 1.0 × 10⁶ cells/ml) affected pseudoislet diameter, sphericity, or proliferation over time in culture. As expected, MIN6 cells self-organized over 3 to 10 days into 3D pseudoislets compared to 2D culture (Supplemental Figure S1A, B). Initial seeding density did not affect average MIN6 cluster diameters except at day 10 in culture, where 1.0 × 10⁶ cells/ml resulted in significantly smaller average diameter compared to 0.25 × 10⁶ cells/ml (Supplemental Figure S1C). Average cluster diameters significantly increased over time (day 3: 108 ± 5 µm, day 10: 259 ± 40 µm) at rates that did not significantly differ between initial seeding densities. The number of live cells was assessed by MTT assay and did not significantly increase over 7 days of culture across all seeding densities, suggesting that cluster enlargement occurs through either aggregation of cells and smaller clusters, or cell proliferation in viable clusters is in equilibrium with cell death (Supplemental Figure S1D). MIN6 cluster circularity was not affected by initial seeding density, did not change over time in culture, and ranged between 1.4 and 1.6 indicating similar ovoidal morphology to primary islets (Supplemental Figure S1E).
Optimizing MIN6 Seeding Density and Stirring Speed in Bioreactor Dynamic Culture
Cell culture in bioreactors is known to improve nutrient diffusion and scalability compared to culture in static conditions54,55. Thus, we sought to develop an optimized bioreactor culture protocol that generates MIN6 pseudoislets with comparable diameter and morphology to primary islets, maximizes yield and viability, and remains consistent over 18 days in culture. Optimized variables included bioreactor seeding density (Supplemental Figure S2) and stirring speed (Supplemental Figure S3).
We first determined the optimal seeding density of MIN6 cells in 30-ml bioreactors stirring at 70 rotations per minute (RPM). Higher seeding densities (2.0 and 4.0 × 10⁶ cells/ml) led to a greater number of clusters (Supplemental Figure S2A) and IEQ (Supplemental Figure S2B) in the first 3 days after seeding but declined thereafter. The number of cells per islet for the 0.5 and 4.0 × 10⁶ cells/ml seeding densities spiked at day 7 and decreased thereafter, indicating that clusters became smaller (Supplemental Figure S1C). Finally, the density of live cells in culture increased for the 1.0 × 10⁶ cells/ml seeding density during culture up to 21 days (Supplemental Figure S1D). We found that the 1.0 × 10⁶ cells/ml seeding density produced the most stable trends over time and concluded this to be the optimal seeding density to generate MIN6 pseudoislets in bioreactors with minimized cell input and comparable yield for cultures longer than 3 days.
Next, we optimized the bioreactor stirring speed (40, 70, and 100 RPM) using low passage (11) and high passage (38) MIN6 cells seeded at 1.0 × 10⁶ cells/ml and compared to static culture on pHEMA-coated surfaces (Supplemental Figure S3) for up to 18 days of culture. Over time in culture, the total number of clusters for all settings either did not have strong trends (low passage, Supplemental Figure S3A) or decreased over time (high passage, Supplemental Figure S3C). We found notable upward trends in IEQ over time in low passage cells stirring at 70 RPM and high passage cells stirring at 100 RPM (Supplemental Figure S3B, D, respectively). These findings suggest that pseudoislet yield increases over time through cluster enlargement rather than formation of new clusters. For low passage cells stirring at 70 RPM and high passage cells stirring at 100 RPM, this is corroborated by an increase in the total number of live cells (Supplemental Figure S3F, H), the number of cells per cluster (Supplemental Figure S3I, M), and the average diameter of clusters (Supplemental Figure S3K, O) over time in culture paired with a lack of trend in the number of cells per IEQ (Supplemental Figure S3J, N). The increase over time in total IEQ and number of live cells seen in low passage cells stirring at 70 RPM contrasted with cells in static culture, where both measurements decreased over time. Furthermore, single cell viability of low passage cells decreased over time in static culture and 100 RPM (Supplemental Figure S3E). Together, these findings indicate an optimal stirring speed of 70 RPM which can better support larger numbers of cells and IEQ than static culture. Finally, high passage cells did not show strong trends in single cell viability over time (Supplemental Figure S3G), and we did not observe outstanding differences in pseudoislet circularity over time across conditions (Supplemental Figure S3L, P).
We further determined the effect of dynamic culture, stirring speed, and culture time on pseudoislet diameter and nutrient diffusion (Supplemental Figure S4). Cluster diameter over time (Supplemental Figure S4A, Table S2) did not change in static culture and peaked at 4 days for bioreactors stirring at 40 and 100 RPM. At 70 RPM, cluster diameter did not change between 4 and 11 days and increased by day 18, although with higher variability. Comparing cluster diameter across culture conditions by timepoint (Supplemental Figure S4B), static culture yielded smaller clusters than any dynamic culture across 18 days of culture, likely due to lower nutrient transport. Among the different dynamic conditions, cluster diameter scaled inversely to stirring speed, where higher stirring speeds resulted in smaller cluster diameters, corresponding to the shear stress exerted by each stirring speed. Histological analysis of MIN6 revealed that starting at day 11 after seeding, clusters develop necrotic cores and central cavitation that is most apparent in static conditions and ameliorated by dynamic culture at 100 RPM (Supplemental Figure S4C), suggesting that this may be dependent on nutrient transport which is increased in dynamic culture at higher stirring rates.
Altogether, we concluded that seeding MIN6 cells into bioreactors at a density of 1.0 × 10⁶ cells/ml set to stir at 70 RPM was optimal for generating MIN6 pseudoislets with high yield, high viability, and stable morphology during culture up to 18 days while also maintaining an average cluster diameter similar to the standard human islet diameter of 150 µm56.
In Vitro Characterization of MIN6 Pseudoislets Cultured in Optimized Dynamic Conditions
Next, we characterized the morphology, viability, and GSIS functionality of low passage (11) or high passage (38) MIN6 pseudoislets cultured under the optimized dynamic conditions. High passage MIN6 clusters did not show GSIS responses (not shown) as previously reported 26 and were not evaluated further, while low passage clusters were analyzed at selected timepoints between 2 and 18 days after seeding (Fig. 1). Clustering is initiated by day 2 in culture, and pseudoislet morphology develops at day 4 and is maintained through day 18 (Fig. 1A). Average cluster diameter increased from day 2 to day 11 and decreased by day 18 (Fig. 1B). Similarly, cluster density in culture, expressed both as IEQ/ml (Fig. 1C) and as number of clusters/ml (Fig. 1D), increased over time. Cluster viability (Fig. 1E) peaked at day 4 (95.8% ± 5.2%) and decreased significantly at day 7 (68.1% ± 11.8%) but otherwise did not differ between the remaining timepoints and day 2 (82.1% ± 16.8%). We also evaluated MIN6 pseudoislet GSIS functionality (Fig. 1F–H). Functional GSIS was defined as increased insulin secretion during H stimulation relative to L1 stimulation measured through direct insulin concentration (Fig. 1F), stimulation index >1 (Fig. 1G), stimulation delta >0 (Fig. 1H), and recovery index >1 (Fig. 1I). MIN6 clusters at day 4 and day 18 of culture met these criteria, with the latter timepoint having a greater degree of variability. We concluded that a 4-day culture of MIN6 in the above conditions is optimal in generating viable and functional pseudoislets with an average diameter of 143.4 ± 27.5 µm. These diameters are comparable to those of primary mouse, rat, and human primary islets (Supplemental Figure S5A, B). The magnitude of GSIS by MIN6 pseudoislets may be diminished relative to primary islets (Supplemental Figure S5C-F); however, the above criteria for GSIS are still observed and with lower batch-to-batch variability relative to primary islets.
Figure 1.

In vitro characterization of MIN6 pseudoislets cultured in optimized dynamic conditions. Passage 11 MIN6 cells were seeded at 1.0 × 10⁶ cells/ml and cultured in 30-ml bioreactors stirring at 70 rotations per minute for up to 18 days. (A) Representative phase-contrast microscopy showing morphology of MIN6 pseudoislets harvested at indicated timepoints in culture. 10× objective, scale bar: 150 µm. An ICC4 automated islet counter was used to measure (B) MIN6 pseudoislet diameter (data reported as mean (SD), all comparisons significant), pseudoislet cluster density as (C) islet equivalents (IEQ)/ml, and (D) the number of clusters/ml over time in culture. (E) Percentage of single cell viability within clusters using trypan blue exclusion after enzymatic digestion of pseudoislets into single cells. For C–E, asterisks (*) indicate difference from day 2 unless otherwise denoted. (F) MIN6 pseudoislet glucose-stimulated insulin secretion (GSIS) functionality measured as insulin release normalized to DNA content during sequential stimulation with indicated solutions. This data was used to calculate (G) stimulation index, (H) stimulation delta, and (I) recovery index. Dashed lines: thresholds for effective GSIS. Data were obtained from three independent preparations with n ≥ 3 samples each. Data were analyzed by one-way ANOVA with Tukey’s multiple comparisons testing or Kruskal–Wallis testing with Dunn’s multiple comparisons. *P < 0.05, **P < 0.01, ***P < 0.001, ****P < 0.0001.
In Vitro Characterization of NIT-1 Pseudoislets Cultured in Optimized Dynamic Conditions
Next, we aimed to determine whether culture conditions optimized for MIN6 insulinoma cells could be applied to murine NIT-1 insulinoma cells derived from NOD mice 19 (Fig. 2). NIT-1 cells were seeded at 1.0 × 10⁶ cells/ml in 30 ml total volume in bioreactors stirring at 70 RPM and began forming pseudoislets by day 2 which persisted through day 18 (Fig. 2A). Cluster diameter increased over time in culture but decreased at days 7 and 18 (Fig. 2B). This trend was reflected in cluster density when measured as IEQ/ml (Fig. 2C) or absolute number of clusters/ml (Fig. 2D), which decrease at days 7 and 18. Viability was highest at day 2 (90.3% ± 10.5%) and significantly decreased only at day 7 (65.9% ± 16.9%) and day 18 (69.9% ± 18.7%, Fig. 2E). Regarding functionality, NIT-1 pseudoislets displayed GSIS at all timepoints through day 18 of culture (Fig. 2F–I). NIT-1 cells cultured as 2D monolayers did not display normal GSIS responses unlike what previously reported for MIN6 (not shown). We conclude that NIT-1 cells can be cultured under the same dynamic culture conditions developed for MIN6 cells and form pseudoislets with approximate diameters around 150 µm and GSIS function between 4 and 18 days of culture. These diameters of NIT-1 pseudoislets are also comparable to those of primary islets (Supplemental Figure S5A, B) and we also observe a lower magnitude of GSIS by NIT-1 pseudoislets relative to primary islets that still meets GSIS criteria and demonstrates less batch-to-batch variability.
Figure 2.

In vitro characterization of NIT-1 pseudoislets cultured in optimized dynamic conditions. NIT-1 cells were seeded at 1.0 × 10⁶ cells/ml and cultured in 30-ml bioreactors stirring at 70 rotations per minute up to 18 days. (A) Representative phase-contrast microscopy showing morphology of NIT-1 pseudoislets harvested at indicated timepoints after seeding. 10× objective, scale bar: 150 µm. An ICC4 automated islet counter was used to measure (B) NIT-1 pseudoislet diameter (data reported as mean (SD), all comparisons significant), pseudoislet cluster density expressed as (C) islet equivalents (IEQ)/ml (all comparisons significant except for those indicated), and (D) the number of clusters/ml. (E) Single cell viability within clusters measured by trypan blue exclusion following enzymatic digestion of pseudoislets. For D and E, asterisks (*) indicate difference from day 2 unless otherwise denoted. (F) NIT-1 pseudoislet glucose-stimulated insulin secretion (GSIS) functionality measured by insulin release normalized to DNA content during sequential stimulation with indicated solutions. This data was used to calculate (G) stimulation index, (H) stimulation delta, and (I) recovery index. Dashed lines: thresholds for effective GSIS. Data were obtained from three independent preparations with n ≥ 3 samples each. ns = not significant, *P < 0.05, **P < 0.01, ***P < 0.001, ****P < 0.0001.
Encapsulation and In Vitro Characterization of MIN6 and NIT-1 Pseudoislets
Next, we aimed to validate the applicability of MIN6 and NIT-1 pseudoislets for experimentation in T1D by testing whether they could be encapsulated using two previously reported methodologies while maintaining their GSIS functionalities. We validated MIN6 (Fig. 3A) and NIT-1 (Fig. 3F) pseudoislet encapsulation by electrostatic droplet generation in alginate or CC with poly(ethylene) glycol and assessing GSIS functionality. For MIN6, we found that both alginate and CC encapsulation did not impair GSIS functionality compared to uncoated pseudoislets in total secreted insulin (Fig. 3B), stimulation index (Fig. 3C), stimulation delta (Fig. 3D), or recovery index (Fig. 3E). Similarly, NIT-1 encapsulation with alginate and CC did not impair total secreted insulin (Fig. 3G), stimulation index (Fig. 3H), stimulation delta (Fig. 3I), or recovery index (Fig. 3J) compared to uncoated pseudoislets. Altogether, encapsulation of pseudoislets generated by our optimized method did not negatively impact their GSIS function, making them applicable for further study in this context. We also predict that these pseudoislets would be applicable for other in vitro T1D studies.
Figure 3.

Encapsulation and in vitro characterization of MIN6 and NIT-1 pseudoislets cultured in optimized dynamic conditions. MIN6 cells (A–E) and NIT-1 cells (F–J) were seeded at 1.0 × 10⁶ cells/ml in 30-ml bioreactors stirring at 70 rotations per minute. At 4 days in culture, pseudoislets were harvested and encapsulated either with conformal coating (CC) or alginate, or left unencapsulated (uncoated), then returned to culture for 1 day. Representative phase-contrast microscopy of CC MIN6 (A) and CC NIT-1 (F) pseudoislets. 10× objective, scale bar: 150 µm. Glucose-stimulated insulin secretion functionality of uncoated (white), alginate (gray), and CC (black) pseudoislets measured as (B, G) insulin release during sequential stimulation with indicated solutions. This data was used to calculate (C, H) stimulation index, (D,I) stimulation delta, and (E,J) recovery index. Data were obtained from one or more independent preparations with n ≥ 3 samples each. ns = not significant, *P < 0.05, **P < 0.01, ***P < 0.001, ****P < 0.0001.
GFP-Luciferase Transduction Does Not Alter NIT-1 Cell Morphology or Function In Vitro
To enhance the utility of pseudoislets for in vivo studies, passage 11 NIT-1 cells were transduced with a lentivector to express luciferase and GFP 51 , yielding NIT-1/LUC cells (Fig. 4). NIT-1/LUC cells cultured in the optimized dynamic conditions form pseudoislets comparable in appearance to untransduced NIT-1 cells and can be conformally coated (Fig. 4A). GSIS functionality of NIT-1/LUC pseudoislets did not change from that of untransduced NIT-1 pseudoislets at day 18 of optimized bioreactor culture (Fig. 4B). GFP fluorescence can be detected by confocal microscopy (Fig. 4C) and flow cytometry after disassociation into single cells (Fig. 4D). At 4 days in bioreactor culture, >90% of cells maintained GFP fluorescence at 4 days in bioreactor culture (Fig. 4D) and had no difference in viability compared to untransduced pseudoislets (Supplemental Figure S6A). GFP expression over 18 days in bioreactor culture remains stable for NIT-1/LUC after four rounds of selection for GFP expression compared to two rounds of selection (Supplemental Figure S6B). In vitro bioluminescence of NIT-1/LUC pseudoislets remained stable over 18 days of bioreactor culture (Fig. 4E), and more IEQ of NIT-1/LUC pseudoislets corresponded to greater bioluminescent signal (Fig. 4F).
Figure 4.

In vitro characterization of NIT-1 cells transduced with GFP and luciferase (NIT-1/LUC). Untransduced NIT-1 and NIT-1/LUC cells were seeded at 1.0 × 10⁶ cells/ml in 30-ml bioreactors stirring at 70 rotations per minute. (A) Representative phase-contrast images of uncoated untransduced NIT-1, uncoated NIT-1/LUC, and conformally coated (CC) NIT-1/LUC pseudoislets harvested at 4 days in culture. 10× magnification, scale bar = 150 µm. (B) Glucose-stimulated insulin secretion functionality of untransduced NIT-1 and NIT-1/LUC pseudoislets at 18 days of bioreactor culture. (C) Representative confocal microscopy of untransduced NIT-1 and NIT-1/LUC pseudoislets for GFP (green) and nuclei (Hoeschst, blue) harvested at 7 days after bioreactor seeding. 10× magnification, scale bar = 150 μm. (D) Untransduced NIT-1 and NIT-1/LUC pseudoislets were harvested at 4 days of bioreactor culture, disassociated, and measured by flow cytometry for %GFP+ cells. Merged plots shown. (E) In vitro bioluminescence signal of 500 IEQ untransduced NIT-1 or NIT-1/LUC pseudoislets measured at days 4, 11, and 18 after bioreactor culture. (F) Bioluminescence signal of 750 islet equivalents (IEQ) untransduced NIT-1 or titrated IEQs of NIT-1/LUC pseudoislets at 4 days of bioreactor culture. Data were obtained from one or more independent preparations with n ≥ 3 samples each. Data were analyzed by t-test, one-way ANOVA, or two-way repeated-measures ANOVA with Tukey’s post hoc testing. *P < 0.05, **P < 0.01, ***P < 0.001, ****P < 0.0001.
Bioluminescence of NIT-1/LUC Pseudoislets Can Be Measured In Vivo After Implantation into Immunodeficient Mice
After confirming successful transduction and luciferase activity, we aimed to determine whether NIT-1/LUC pseudoislets could (a) be implanted into mice and enable non-invasive longitudinal graft monitoring through bioluminescence and (b) reverse diabetes. To test this, male and female immunodeficient NOD/SCID mice were rendered diabetic by streptozotocin injection and underwent 750 or 2,000 IEQ NIT-1/LUC pseudoislet implantation into the left ISWAT (Fig. 5A), which was selected to mirror trends in subcutaneous islet transplantation 57 . Fig. 5B depicts a representative IVIS image capturing bioluminescence 2 days after implantation. Mice receiving 750 IEQ NIT-1/LUC had significantly higher bioluminescence compared to control mice only after implantation (day 0), while mice receiving 2,000 IEQ NIT-1/LUC had significantly higher bioluminescence compared to control mice at various times after implantation (Fig. 5C, left). After removing the graft sites on day 22, NIT-1/LUC bioluminescence was detected in grafts that initially received 2,000 IEQ NIT-1/LUC (Fig. 5C, right). Recipients of 2,000 IEQ NIT-1/LUC did not demonstrate significant changes from pre-surgical body weights over time while recipients of 750 IEQ showed a significant decrease from their respective pre-surgical weights at days 1, 3, and 7 post-implantation (Fig. 5D). Recipients were monitored for diabetes reversal through blood glucose and non-fasting serum C-peptide measurements (Fig. 5E), and for both measures no difference was found over time or between treatment groups. Ultimately, the NIT-1/LUC implantations into the ISWAT did not reverse diabetes within 21 days after implantation and did not form tumors, indicating that this model can be used for monitoring pseudoislet graft survival based on luciferase signal but not for diabetes management studies.
Figure 5.

NIT-1/LUC pseudoislets implanted into NOD/SCID recipients can be quantified in vivo for monitoring graft survival. NIT-1/LUC pseudoislets (750 or 2,000 islet equivalents, (IEQ)) were implanted into the inguinal subcutaneous white adipose tissue (ISWAT) of NOD/SCID mice with diabetes induced by streptozotocin (STZ). Control mice did not undergo a surgical procedure. (A) Timeline for experimental setup and in vivo and ex vivo measurements. (B) Representative IVIS image of NOD/SCID mice 2 days post-implantation with 750 or 2,000 IEQ NIT-1/LUC pseudoislets, or control (CTRL). (C) Left: In vivo NIT-1/LUC bioluminescence measured longitudinally over 22 days following implantation. Blue asterisks (*) represent difference between 750 IEQ and control, red crosses (+) represent difference between 2,000 IEQ and control at that timepoint. Right: ISWAT graft sites were removed from mice and imaged ex vivo using IVIS (n = 3). (D) Longitudinal recipient weight change, expressed as the percent change from each recipient’s pre-surgery weight. Blue asterisks (*) represent difference in weight of 750 IEQ recipients at that timepoint from their weight on day 0 prior to surgery. (E) Blood glucose (left) and non-fasting C-peptide measurements (right) of recipients through 21 days. Dashed line = 250 mg glucose/dl. n = 4 in experimental groups, n = 2 in control group. Data were analyzed by two-way repeated-measures ANOVA or one-way ANOVA with Tukey’s post hoc testing. ns = not significant, */+P < 0.05, **/++P < 0.01.
NIT-1/LUC Pseudoislets Can Be Implanted Into Immunocompetent Mice to Model Auto- and Alloimmunity
We aimed to evaluate the applicability of NIT-1/LUC pseudoislets in modeling (a) autoimmunity by syngeneic implantation into immunocompetent, pre-diabetic female NOD mice (Fig. 6) and (b) alloimmunity by allogeneic implantation into C57BL/6 mice (Fig. 7).
Figure 6.

NIT-1/LUC pseudoislets implanted into NOD recipients can be targeted by autoimmunity. NIT-1/LUC pseudoislets (2,000 islet equivalents, (IEQ)) were implanted into the inguinal subcutaneous white adipose tissue (ISWAT) of 8-week-old pre-diabetic female NOD mice. (A) Timeline for experimental setup and in vivo and ex vivo measurements. n = 3 sham and NIT-1/LUC recipients formed a 29-day short-term cohort; n = 11 NIT-1/LUC and n = 6 sham recipients formed a long-term cohort. (B) Representative IVIS image of NIT-1/LUC recipients and sham mice at 1 and 8 days post-implantation. Sham controls underwent the surgical procedure but did not receive cells. (C) Left: In vivo NIT-1/LUC bioluminescence measured through 22 days following implantation (includes all mice). Asterisks (*) represent difference from sham at the same timepoint. Right: From the short-term cohort, ISWAT graft sites were removed and ex vivo bioluminescence was measured using IVIS. (D) Left: Longitudinal diabetes incidence represented as % diabetes-free survival (does not include short-term cohort). Right: blood glucose of all subjects at day 29. Dashed line = 250 mg glucose/dl. (E) Left: Representative images of H&E-stained pancreas obtained from the short-term cohort showing islets without insulitis or with grade 4 insulitis. 10× magnification, scale bar = 150 µm. Right: Quantification of insulitis grading. (F) Pancreatic lymph nodes were harvested from the short-term cohort, tetramer stained for insulin B15-23 autoreactive T cells or with control tetramer, and analyzed by flow cytometry. Plots are pre-gated on viable, CD45+, CD3+, CD8+, CD44hi, CD62Llo cells. Merged plots shown. Data were analyzed by two-way repeated-measures ANOVA or one-way ANOVA with Tukey’s post hoc testing, Log-rank (Mantel-Cox) testing, or chi-square testing. ns = not significant, *P < 0.05, **P < 0.01, ***P < 0.001, ****P < 0.0001.
Figure 7.

NIT-1/LUC pseudoislets implanted into C57BL/6 recipients can be targeted by alloimmunity. Conformally coated (CC) or uncoated NIT-1/LUC pseudoislets (2,000 islet equivalents (IEQ)) were implanted into the inguinal subcutaneous white adipose tissue (ISWAT) of 8-week-old C57BL/6 mice. (A) Timeline for experimental setup and in vivo and ex vivo measurements. (B) Longitudinal NIT-1/LUC graft bioluminescence measured by IVIS. Black asterisks (*) represent differences between recipients of uncoated NIT-1/LUC pseudoislets and sham mice. Red crosses (+) represent differences between recipients of CC NIT-1/LUC pseudoislets and sham mice unless otherwise denoted. (C) Flow cytometry results of a mixed lymphocyte reaction initiated 7 days post-implantation to determine recipient alloreactivity to NIT-1/LUC grafts. Left to right: Proliferated responder CD8+ cells (pre-gated on viability, H2-Kb+, CD3+, CD11b−, CD8+) were selected based on CellTrace dilution, and the number of CD44hi, CD62Llo cells was quantified. Merged plots shown. (D) UMAP dimensionality reduction plots of flow cytometry data obtained from graft-draining inguinal lymph nodes of recipients at 14 days post-implantation, with offset contour plot. Viable, CD45+, CD3+, CD4+, and CD8+ were gated prior to dimensionality reduction, and data from biological replicates were pooled. (E) Quantification of the proportion of CD4+ (left) and CD8+ (right) subsets, identified by post hoc downstream gating. Naive and central: CD44lo and CD62Lhi; intermediate activation: combination of (CD44lo and CD62Llo) and (CD44hi and CD62Lhi); effector: CD44hi and CD62Llo. n = 4 in each group. Data were analyzed by one-way ANOVA or two-way repeated-measures ANOVA with Tukey’s post hoc testing. */+P < 0.05, **/++P < 0.01, ***/+++P < 0.001, ****/++++P < 0.0001.
Fig. 6A depicts the experimental setup for NIT-1/LUC implantation into NOD recipients. Pre-diabetic (8-week-old) female NOD mice were implanted with 2,000 IEQ NIT-1/LUC pseudoislets into the left ISWAT or received a sham surgery and were IVIS imaged for luciferase bioluminescence between days 1 and 22 post-implant. Bioluminescence from NIT-1/LUC grafts was detected 1 day after implantation and was lost by day 8, likely because of rapid recurrence of autoimmunity (Fig. 6B and C, left). At day 29 post-implant, mice assigned to a short-term cohort were sacrificed and ISWAT sites were removed and IVIS imaged ex vivo, which did not detect any bioluminescence (Fig. 6C, right). The graft sites were subsequently formalin-fixed and H&E stained, and NIT-1/LUC cells could not be located (not shown). Regarding diabetes incidence, no subjects were diabetic at 29 days post-implant (Fig. 6D, right) and no significant differences were detected in long-term diabetes incidence between sham subjects and NIT-1/LUC recipients (Fig. 6D, left). Pancreata from short-term cohort mice were formalin-fixed, H&E stained, and graded for insulitis (Fig. 6E), and no significant differences were found between sham subjects and NIT-1/LUC recipients. Pancreatic lymph nodes were also harvested from the short-term cohort and CD8+ T cells were interrogated for insulin B15-23 reactivity by tetramer staining (Fig. 6F). There was not a significant difference between groups in the proportion of insulin B15-23-reactive CD8+ T cells (Fig. 6F), nor in upstream populations (Supplemental Figure S7). Altogether, NIT-1/LUC grafts were rejected by NOD recipients without affecting overall diabetes pathology, making this transplantation scheme useful for studies of T1D pathogenesis and preventative strategies.
Fig. 7A depicts the experimental setup for NIT-1/LUC implantation into allogeneic C57BL/6 recipients. In addition to confirming that NIT-1/LUC pseudoislets would be rejected by alloimmunity, we aimed to test that these cells could be studied in the context of an applied intervention, in this case immunoisolation of implanted pseudoislets by CC encapsulation. Uncoated or CC NIT-1/LUC pseudoislets were implanted into the left ISWAT, and sham mice underwent the surgical procedure but did not receive any cells. Graft bioluminescence was detected in uncoated NIT-1/LUC recipients up through 3 days post-implant and up to 6 days for CC NIT-1/LUC recipients (Fig. 7B). At 7 days post-implant, we conducted a mixed lymphocyte assay on CellTrace-labeled peripheral blood lymphocytes from C57BL/6 recipient animals (Fig. 7C). CD8+ T cells from sham subjects and CC NIT-1/LUC recipients did not display a strong response to NOD stimulators with minimal cell viability, proliferation, and activation compared to cells from uncoated NIT-1/LUC recipients, which had a significantly higher count of activated CD8+ T cells in culture (defined as proliferation by CellTrace dilution, high CD44 expression, and low CD62L expression). Upstream gating strategy is depicted in Supplemental Figure S8A. At 14 days post-implant, CD4+ and CD8+ T cell populations in the inguinal lymph node of recipient C57BL/6 mice were analyzed in the OMIQ platform and pre-gated on viable, CD45+, CD3+, CD4+, and CD8+ cells (Supplemental Figure S8B) before UMAP dimensionality reduction and clustering using the FlowSOM algorithm 53 . Clusters were manually identified post hoc by downstream gating (Supplemental Figure S8C) and their size was quantified as a proportion of the total CD4+ or CD8+ pool. The distribution of T cell phenotype was similar between sham subjects and recipients of uncoated NIT-1/LUC pseudoislets, with cells concentrating in clusters 1 (dark blue, naive CD8+ T cells) and 8 (orange, naive CD4+ Foxp3- T cells; Fig. 7D). Recipients of CC NIT-1/LUC pseudoislets, on the other hand, demonstrated a shift toward clusters 3 and 4 (black, CD8+, CD44hi, CD62Lhi; and red, CD8+, CD44lo, CD62Llo; respectively) as well as clusters 9 and 10 (brown, CD4+, Foxp3-, CD44hi, CD62Lhi; and light blue, CD4+, Foxp3-, CD44lo, CD62Llo; respectively). These combinations of CD44 and CD62L expression were classified as intermediate activation and pooled together during quantification, which reflects a shift in CC NIT-1/LUC recipients away from the naive to the intermediate activation phenotypes (Fig. 7E). This shift likely represents lingering effects of the alloimmune response in CC NIT-1/LUC recipients, which had a more delayed reaction to the graft indicated by bioluminescence. Finally, in a pilot study, we implanted 2,000 IEQ NIT-1/LUC pseudoislets into the gonadal fat pad, which mimics the human omental site58–60 and offers better vascularization relative to the subcutaneous site, of C57BL/6 mice (Supplemental Figure S9). In addition, mice were injected intraperitoneally with abatacept (trade name: Orencia, blocks CD80/86-CD28 T cell co-stimulation61,62) at 1 day prior to implantation with a 75 mg/kg loading dose, and every other day thereafter with 37.5 mg/kg maintenance doses (Supplemental Figure S9A). Bioluminescence signal in the first 3 days after implantation appeared to be higher than that obtained from ISWAT implantations, which may result from a combination of improved vascularization and d-luciferin substrate delivery, and rejection occurred in 3 out of 4 recipients by day 19 (Supplemental Figure S9B). Overall, we found that NIT-1/LUC graft bioluminescence coincides with immunological events (longitudinal monitoring of recipient alloreactivity by mixed lymphocyte reaction and endpoint studies) and interventions aimed at prolonging graft survival can be effectively optimized and tested using this readout in our model.
Discussion
One of the main limitations of using primary pancreatic islets in T1D studies is their batch-to-batch variability in phenotype and function. This is particularly the case with human islets as high-quality pancreases are typically prioritized for clinical transplantation, leaving poorer quality islets that can complicate optimization studies14–16. Insulinoma cell lines like MIN6 and NIT-1 used here represent an unlimited, rapid, and replicable model system. These cells are commonly studied in 2D culture; however, studies have shown that 3D insulinoma clusters better represent the characteristics and functionality of primary islets in vitro and in vivo18,29,31,33,34,37,38. The underutilization of these clusters is likely due to the complexity of current protocols, which we aimed to address by developing a method to generate 3D insulinoma clusters using commercially available bioreactor flasks and simple equipment (magnetic stir plate). We determined the optimal culture conditions to be cell seeding density at 1.0 × 10⁶ cells/ml in 30 ml total culture volume in a bioreactor flask stirring at 70 RPM, and this protocol was applicable to MIN6, NIT-1, and NIT-1/LUC insulinoma lines. In addition to increased accessibility, our reported method generates high yields of pseudoislets, at least 35,000 IEQ from one 30 ml flask, eliminating ethical concerns and reducing procurement costs of harvesting primary islets. MIN6 and NIT-1 pseudoislets maintain their cluster morphology through 18 days in culture and the latter exhibits GSIS from days 4 through 18, enabling long-term in vitro studies which is not possible with primary islets. We demonstrated that genetically modified pseudoislets can be generated and studied after modifying the NIT-1 cell line, in our case to enable longitudinal in vivo pseudoislet graft monitoring. We expect other modifications to be feasible, offering another advantage over primary islets which are not amenable to genetic modifications 63 .
Regarding in vivo studies, transplantation of 3D pseudoislets better models transport limitations faced by primary islets 42 , and the high yield of pseudoislets generated by our method facilitates larger in vivo optimization studies investigating factors such as choice of transplant site or drug dosing. Our study is the first to report the use of 3D NIT-1 pseudoislets in T1D models, as previous studies were performed with single cells35,36. The luciferase-expressing NIT-1/LUC pseudoislets we generated and report here enabled non-invasive longitudinal monitoring of the graft in recipient animals, providing more direct and immediate measurement of graft viability (luciferase quantification correlating to viability) compared to traditional GSIS islet function-based assessments by blood glucose or C-peptide measurements in diabetic recipients. This more real-time assessment of graft survival can offer better insight into initial events leading to transplanted islet damage, dysfunction, and/or death occur before transplanted mice revert to hyperglycemia due to graft loss. The NIT-1/LUC pseudoislets we report here can be used to optimize studies of alloimmunity (implanting NIT-1/LUC into C57BL/6 recipients), where the timing of the decline and loss of bioluminescent signal correlated with the development of alloimmunity as determined by mixed lymphocyte reaction, and autoimmunity (NIT-1/LUC into pre-diabetic NOD recipients), where graft loss occurred without accelerating or delaying the incidence of diabetes compared to control animals. In the latter case, NIT-1/LUC pseudoislets can also be advantageous as better model of autologous stem cell-derived than pre-infiltrated primary NOD islets.
We chose to optimize MIN6 and NIT-1 insulinoma cell lines because both were reported to display GSIS functionality and were of mouse origin, which facilitates in vivo transplantation testing in mice. In addition, MIN6 cells (C57BL/6 background) recapitulate primary islet transcriptional regulation and are a mix of different endocrine cells capable of producing insulin, glucagon, and somatostatin 23 , which is beneficial for islet biology studies. NIT-1 cells are derived from NOD mice, the most widely used murine T1D model, and provide a source of T1D antigens 64 enabling studies in syngeneic NOD mice testing autoimmunity 36 or tolerance induction for developing new T1D therapies65–68. The use of NOD-derived NIT-1 pseudoislets can be advantageous to other murine insulinoma cell lines, such as the recently reported pseudoislets from the INS832/3 insulinoma cell line 25 , as NIT-1 can be used as a source of NOD antigens for autoimmunity studies and for testing tolerance-inducing strategies65–68 in the only mouse model that spontaneously develops T1D. Also, after treatment with interferon-γ, NIT-1 cells overexpress MHC class I and surface antigens 19 , which makes them useful for immunology studies on T1D pathogenesis. For MIN6 cells, we compared both low and high passage cells because previous studies reported that high passage MIN6 lose their GSIS ability due to defective glucose and lipid metabolism 26 and loss of β cell transcriptional profile 69 . Finally, given that islet measurement is critical for clinical transplantation (since insulin independency after islet transplantation is achieved only when a minimum number of islets is transplanted) and traditional manual methods have been questioned for their accuracy 70 , we used an automated method through the BioRep ICC4 instrument to quantify pseudoislet quantity and morphology 56 in our culture optimization studies.
Using MIN6 insulinoma cells, we first optimized the pseudoislet formation protocol in dynamic culture using commercially available small-scale bioreactors by tuning the initial cell seeding density, stirring speed, and harvest time. We aimed to maximize pseudoislet yield, viability, and GSIS function while minimizing variability in size and morphology compared to pseudoislet formation in static culture using in pHEMA-treated wells that prevent adhesion. Static culture of MIN6 cells generated pseudoislets with a diameter that increases with time in culture up to 259 µm independently of the initial seeding density, indicating that minimizing the seeding density to 0.25 × 10⁶ cells/ml was optimal to generate clusters with an ovoidal shape. For dynamic culture in small-scale bioreactors stirred at 70 RPM, a seeding density of 1.0 × 10⁶ cells/ml was optimal to generate MIN6 pseudoislets with high yield; higher seeding densities had an initially higher number of generated clusters and cluster cellularity that decreased after day 3, indicating that these bioreactor conditions do not support the survival of these larger or more numerous clusters. Dynamic conditions stirring at 70 RPM best sustained culture of pseudoislets up to 11 days with uniform morphology of ~170 µm diameter and viability; 40 and 100 RPM led to higher variability. In comparison, static culture had lower yield, lower viability, and higher variability in cluster morphology, altogether indicating the limitations of static culture in supporting nutrient transport through 3D clusters and the need for dynamic culture when maintaining pseudoislets for longer times. Using the optimized conditions of dynamic MIN6 culture stirring at 70 RPM and 1.0 × 10⁶ cells/ml seeding density, we found that the viability of MIN6 pseudoislets peaked at 4 days of culture with an average cluster diameter of 143 µm; longer culture times produced larger clusters but with lower viability, indicating cell death in larger clusters. Indeed, MIN6 pseudoislet histology revealed that culture times longer than 11 days lead to necrotic core formation and cavitation even in dynamic culture. Notably, both MIN6 and NIT-1 culture in optimized dynamic conditions (1.0 × 10⁶ cells/ml seeding density and stirring at 70 RPM) demonstrated a drop in viability at day 7 after seeding. This is likely because bioreactor conditions, even with our optimized settings, are subject to dynamic equilibrium between cell and cluster proliferation versus nutrient content and transport with stirring. This explanation is supported by these histological findings and experiments testing initial seeding density (Supplemental Figure S2), where the number of cells declined during the first four days of culture and became comparable to conditions with lower initial seeding densities. We then evaluated MIN6 pseudoislet GSIS functionality during long-term culture using low passage MIN6 after finding that high passage MIN6 did not display functional GSIS, consistent with literature. As expected, MIN6 pseudoislet GSIS function correlated with viability and was optimal at day 4 of dynamic culture despite other studies reporting the loss of GSIS functionality in MIN6 cells cultured in 3D pseudoislets compared to 2D cultures 27 . Overall, we concluded that MIN6 seeded at 1.0 × 10⁶ cells/ml in bioreactors stirring at 70 RPM generated viable and functional pseudoislets at day 4. This timing is consistent with other studies of static culture, which reported that MIN6 cell growth stopped after 7 days of culture in non-adherent dishes 27 and in alginate capsules 32 . Based on cluster density and single cell viability, MIN6 pseudoislets can also be employed at days 9 to 18, but experimental readouts alternative to GSIS would be needed as we did not observe consistent GSIS after day 4. Our optimized dynamic culture generates smaller clusters (143 µm) than methods like the microgravity culture system (250 µm) 33 , biomaterial-based aggregation (also 250 µm) 32 , and PNIPAAm-coated PDMS-based microwells (200–300 µm) 34 which is advantageous for nutrient transport, viability, and GSIS responses.
Our optimized dynamic method for generating MIN6 pseudoislets could also be applied to NIT-1 cells. Unlike MIN6, NIT-1 seeded at 1.0 × 10⁶ cells/ml in bioreactors stirring at 70 RPM developed pseudoislets with stable morphology (diameter between 124 and 156 µm), viability, and GSIS function through 18 days in culture; the lattermost finding represents a key advantage of NIT-1 pseudoislets as evaluating GSIS in primary islets over the same timeframe is not possible. Interestingly, we showed that 3D-cultured but not 2D-cultured NIT-1 displayed functional GSIS unlike what was previously reported 19 . Importantly, at least 35,000 IEQ from 30 ml culture can be harvested between 4 and 18 days culture, giving a higher yield than compared to murine donors (250 IEQ per mouse, 1,000 IEQ per rat), microgravity culture systems (100 MIN6 spheroids per ml of culture media, 3,000 in 30 ml) 33 , and hanging drop techniques (500–1,000 spheroids individually pipetted) 71 . Overall, NIT-1 pseudoislets generated with our optimized protocol are superior to MIN6 pseudoislets for optimization studies that require consistent morphology, viability, and GSIS during long-term culture. However, NIT-1 display lower fold increase in insulin secretion during stimulation with glucose 18 . Indeed, we also observed this with NIT-1 pseudoislets generated by our protocol relative to primary mouse, rat, and human islets. However, we found that NIT-1 pseudoislets still displayed an appropriate response to glucose and with less batch-to-batch variability compared to primary islets, indicating GSIS by NIT-1 pseudoislets to be a useful functional readout. Comparatively, MIN6 pseudoislets at day 4 display a higher fold increase in insulin secretion during glucose stimulation which may offer higher power in detecting functional impacts during experimentation. Despite the utility of our protocols for generating large amounts of MIN6 and NIT-1 insulinoma pseudoislets with consistent morphology, viability, and GSIS functionality during long-term culture, neither of these cell lines perfectly mimics primary β cell physiology20,39. We anticipate the possibility of incorporating components native to primary islets (extracellular matrix components, endothelial cells, immune cells) to further enhance in vivo representation or experimental modifications (customized pseudoislet compositions incorporating supportive mesenchymal stem cells or stromal cells) into this culture system. Our protocol may also be compatible with human-derived cell lines, such as EndoC-βH1, to develop human pseudoislets for downstream use in studies of cell signaling, in vitro co-culture with immune cells, or humanized mouse models; however, these possibilities have not yet been tested. Therefore, our protocol currently provides a rapid, cost-effective, and consistent for generating pseudoislets that are best suited for preclinical optimization studies, and validation studies with primary islets are needed.
Insulinoma cell lines have been extensively used for initial optimization of encapsulation studies27,28,46, and we assessed the applicability of our pseudoislets in this context by encapsulated pseudoislets using alginate and CC encapsulation platforms we previously reported 47 . We demonstrated that pseudoislet GSIS functionality was not compromised by encapsulation, further validating our method for utilization of these pseudoislets with biomaterial platforms. We expect pseudoislet viability and GSIS function to be effective readouts in optimizing other in vitro studies including encapsulation optimization, drug screening, or co-culture with immune cells.
MIN6 and NIT-1 pseudoislets being on the background of two widely used mouse strains (C57BL/6 and NOD, respectively) enable a variety of mechanistic and therapeutic in vivo studies in the context of allorejection without autoimmunity (NIT-1 to C57BL/6), syngeneic diabetes reversal (MIN6 to C57BL/6), autoimmunity without allorejection (NIT-1 to NOD), or alloimmunity with autoimmunity (MIN6 to NOD). For MIN6, diabetes reversal after transplantation was reported with MIN6 pseudoislets generated by a microgravity culture system and transplanted intrahepatically 33 and with encapsulated MIN6 cells 32 . In our previous studies implanting conformal coated MIN6 clusters in the fat pad of diabetic C57BL/6 mice, we did not achieve diabetes reversal but observed increased survival in mice that received encapsulated clusters, indicating partial functionality 48 . For NIT-1, diabetes reversal after transplantation of pseudoislets generated in microwells was reported but took more than 21 days 34 . Here, NIT-1/LUC pseudoislets were harvested from bioreactors at day 4 due to being the earliest timepoint with pseudoislet morphology and diameter ~150 µm. However, we validated that GSIS function (NIT-1) and bioluminescence via luciferase expression (NIT-1/LUC) are stable over 18 days in bioreactor culture. NIT-1-LUC pseudoislets implanted into the ISWAT of diabetic NOD/SCID recipients were not able to reverse diabetes, presenting a limitation of this study and/or transplantation site. The ISWAT site was chosen to reflect growing trends of islet transplantation into extrahepatic sites, particularly subcutaneous sites in clinical trials72,73. However, in these studies and in preclinical models 74 , cells were co-transplanted with vascularization-supporting devices which we did not test. Employing these devices or implanting these cells into more vascularized sites such as the gonadal fat pad (modeling transplantation into the human omentum58–60) could enable diabetes reversal by these cells.
Beyond demonstrating diabetes reversal, another method to monitor survival of islet grafts in diabetic mice is through bioluminescence quantification of luciferase-expressing cells, which enables monitoring longitudinal graft survival independently of its GSIS functionality35,36. We demonstrated that transduction of NIT-1 cells did not affect their morphology, viability, or functionality. Furthermore, they could form pseudoislets through our optimized dynamic method, which can be advantageous in quantifying, studying, and implanting cell volumes equivalent to primary islets and mimicking islet morphology in vivo. NIT-1/LUC pseudoislets also enabled quantification of survival in immunocompetent mice. We demonstrated in both C57BL/6 and NOD recipients that the loss of bioluminescent signal corresponded to graft loss alongside alloimmunity detected with independent methods (MLR and lymph node populations in C57BL/6 recipients) or without affecting diabetes onset and pathology (NOD recipients). In the case of alloimmunity, we further demonstrated that interventions aimed to prolong graft survival, in this case islet encapsulation, can be evaluated by bioluminescence. Thus, studies aiming to prolong graft survival in alloimmune contexts or study T1D pathogenesis in autoimmune contexts can use this system to detect prolongation of bioluminescent signal, which offers cost and effort advantages over sacrificing timed cohorts of recipients or transplanting primary islets and monitoring diabetes reversal. As with previous discussion, these advantages can be most apparent during optimization phases such as drug dosing or prototype testing that are ultimately confirmed with primary islets.
Finally, the possibility for tumor formation and hypoglycemia following implantation of insulinoma cell lines is an important consideration. In studies implanting into the ISWAT of immunodeficient NOD/SCID recipients, we did not observe weight change, increase in signal over time, or hypoglycemia that would be associated with tumor formation. After implantation into the ISWAT of immunocompetent recipients, pseudoislet grafts were rejected which precluded tumor formation. The gonadal fat pad offers a more favorable implantation site with better vascularization75,76, which supports our observations that NIT-1/LUC implantation into C57BL/6 fat pads resulted in stronger bioluminescence measurements compared to the ISWAT. Rejection still occurred even with immunosuppressive monotherapy (abatacept), suggesting this site to be challenging and robust in testing anti-rejection approaches. However, sufficiently successful approaches may facilitate tumor formation and necessitate regular animal monitoring and supplementing water with glucose for hypoglycemia prophylaxis. Simultaneously, achieving NIT-1/LUC graft protection will likely indicate optimization maturity for validation studies with primary islets.
Supplemental Material
Supplemental material, sj-docx-1-cll-10.1177_09636897251315123 for High-Yield Generation of Glucose-Responsive Pseudoislets From Murine Insulinoma Cells for In Vitro Studies and Longitudinal Monitoring of Graft Survival In Vivo by Grisell C. Gonzalez, Chris M. Li, Ilaria Pasolini, Sophia I. Pete, Connor Verheyen, Sofia M. Vignolo, Teresa De Toni, Aaron A. Stock and Alice A. Tomei in Cell Transplantation
Acknowledgments
The authors would like to thank the University of Miami (UM) Diabetes Research Institute (DRI) Small Animal and Translational Models Core (Joel Szust, DVM; Greycy Vega; Yelena Gadea) for management of diabetic mice; the DRI Histology and Analytical Imaging Core (Kevin Johnson; Maria Boulina, PhD) for assisting with histological processing of samples and confocal imaging; the DRI Flow Cytometry Core (Oliver Umland, PhD); Dr. Peter Buchwald for sharing the ICC4 instrument; UM’s Sylvester Comprehensive Cancer Center’s Cancer Modeling Shared Resource (CMSR, RRID: SCR_022891) for assisting with IVIS imaging (Daniel Bilbao, PhD; Roxana Cruz; Natalia Campos); Dr. Remi Creusot (Columbia University) for providing the pHR2-GLF lentiviral vector for NIT-1 transduction with GFP-LUC; and the NIH Tetramer Core Facility for peptide-MHC complexes. Schematics outlining experimental setups for in vivo studies were created with BioRender.com.
Footnotes
Author Contributions: Conceptualization: AAT, AAS, GCG, CML.
Methodology: AAS, GCG, CML, IP, SIP, CV, SMV, TDT.
Investigation: AAS, GCG, CML, IP, SIP, CV, SMV, TDT.
Visualization: AAT, AAS, GCG, CML, IP, SIP, CV, SMV, TDT.
Funding acquisition: AAT.
Project administration: AAT.
Supervision: AAT, AAS.
Writing – original draft: AAT, GCG, CML.
Availability of Data and Material: Further information and requests for resources and reagents should be directed to and will be fulfilled by the lead contact, Alice Tomei (atomei@med.miami.edu). Requests for the NIT-1/LUC cell line generated in this study should be directed to and will be fulfilled by the lead contact. All data reported in this paper will be shared by the lead contact upon request. This paper does not report original code. Any additional information required to reanalyze the data reported in this paper is available from the lead contact upon request.
Ethical Approval: Protocols for animal experiments were approved by the University of Miami Institutional Animal Care and Use Committee (Approval no. 22-013) on February 8, 2022, in compliance with the National Institutes of Health guidelines for the care and use of laboratory animals.
Statement of Human and Animal Rights: This article does not contain any studies with human subjects, and animal subjects were handled in strict accordance with aforementioned protocols.
Statement of Informed Consent: There are no human subjects in this article and informed consent is not applicable.
The author(s) declared the following potential conflicts of interest with respect to the research, authorship, and/or publication of this article: AAT and AAS are inventors of the IP used in the studies and licensed to Sernova Corp. AAT and AAS have received payment from Sernova related to the IP and stand to gain royalties from commercialization of the IP. In addition, AAT is an equity holder in Sernova Corp. The authors declare no other competing interests.
Funding: The author(s) disclosed receipt of the following financial support for the research, authorship, and/or publication of this article: Funding for this work was provided by the Diabetes Research Institute Foundation, the National Institutes of Health (NIH) National Institute of Diabetes and Digestive and Kidney Diseases (NIDDK) grant 1 and 2 R01DK109929 (AAT) and 1F30DK136276 (CML), the Juvenile Diabetes Research Foundation (JDRF) (grants 5-CDA-2016-171-S-B and 3-SRA-2024-1477-S-B (AT)), the NIH grant 1S10OD023579-01 for the VS120 Slide Scanner housed at the University of Miami Miller School of Medicine Analytical Imaging Core Facility, and the NIH National Cancer Institute (NCI) grant P30CA240139 for the CMSR and IVIS system.
ORCID iDs: Grisell C. Gonzalez  https://orcid.org/0000-0001-6743-1620
Chris M. Li
https://orcid.org/0000-0002-3723-1721
Ilaria Pasolini
https://orcid.org/0009-0005-1169-0590
Alice A. Tomei
https://orcid.org/0000-0002-5059-6303
Supplemental Material: Supplemental material for this article is available online.
References
- 1. Leibiger IB, Leibiger B, Berggren PO. Insulin signaling in the pancreatic beta-cell. Annu Rev Nutr. 2008;28:233–51. [DOI] [PubMed] [Google Scholar]
- 2. Bluestone JA, Herold K, Eisenbarth G. Genetics, pathogenesis and clinical interventions in type 1 diabetes. Nature. 2010;464(7293):1293–300. [DOI] [PMC free article] [PubMed] [Google Scholar]
- 3. Cnop M, Welsh N, Jonas JC, Jörns A, Lenzen S, Eizirik DL. Mechanisms of pancreatic beta-cell death in type 1 and type 2 diabetes: many differences, few similarities. Diabetes. 2005;54(suppl 2):S97–S107. [DOI] [PubMed] [Google Scholar]
- 4. Eizirik DL, Mandrup-Poulsen T. A choice of death—the signal-transduction of immune-mediated beta-cell apoptosis. Diabetologia. 2001;44(12):2115–33. [DOI] [PubMed] [Google Scholar]
- 5. Warshauer JT, Bluestone JA, Anderson MS. New frontiers in the treatment of type 1 diabetes. Cell Metab. 2020;31(1):46–61. [DOI] [PMC free article] [PubMed] [Google Scholar]
- 6. DiMeglio LA, Evans-Molina C, Oram RA. Type 1 diabetes. Lancet.2018;391(10138):2449–62. [DOI] [PMC free article] [PubMed] [Google Scholar]
- 7. Banting FG, Best CH, Collip JB, Campbell WR, Fletcher AA. Pancreatic extracts in the treatment of diabetes mellitus. Can Med Assoc J. 1922;12(3):141–46. [PMC free article] [PubMed] [Google Scholar]
- 8. Nathan DM, Genuth S, Lachin J, Cleary P, Crofford O, Davis M, Rand L, Siebert C. The effect of intensive treatment of diabetes on the development and progression of long-term complications in insulin-dependent diabetes mellitus. N Engl J Med. 1993;329(14):977–86. [DOI] [PubMed] [Google Scholar]
- 9. American Diabetes Association. Standards of medical care in diabetes—2010. Diabetes Care. 2010;33(suppl 1):S11–S61. [DOI] [PMC free article] [PubMed] [Google Scholar]
- 10. Fong DS, Aiello LP, Ferris FL, 3rd, Klein R. Diabetic retinopathy. Diabetes Care. 2004;27(10):2540–53. [DOI] [PubMed] [Google Scholar]
- 11. Pedersen-Bjergaard U, Pramming S, Heller SR, Wallace TM, Rasmussen AK, Jørgensen HV, Matthews DR, Hougaard P, Thorsteinsson B. Severe hypoglycaemia in 1076 adult patients with type 1 diabetes: influence of risk markers and selection. Diabetes Metab Res Rev. 2004;20(6):479–86. [DOI] [PubMed] [Google Scholar]
- 12. Czarnecka Z, Dadheech N, Razavy H, Pawlick R, Shapiro AMJ. The current status of allogenic islet cell transplantation. Cells. 2023;12(20):2423. [DOI] [PMC free article] [PubMed] [Google Scholar]
- 13. Gregory GA, Robinson TIG, Linklater SE, Wang F, Colagiuri S, de Beaufort C, Donaghue KC, International Diabetes Federation Diabetes Atlas Type 1 Diabetes in Adults Special Interest Group, Magliano DJ, Maniam J, Orchard TJ, et al. Global incidence, prevalence, and mortality of type 1 diabetes in 2021 with projection to 2040: a modelling study. Lancet Diabetes Endocrinol. 2022;10(10):741–60. [DOI] [PubMed] [Google Scholar]
- 14. Toso C, Oberholzer J, Ris F, Triponez F, Bucher P, Demirag A, Andereggen E, Buehler L, Cretin N, Fournier B, Majno P, et al. Factors affecting human islet of Langerhans isolation yields. Transplant Proc. 2002;34(3):826–27. [DOI] [PubMed] [Google Scholar]
- 15. Lakey JR, Warnock GL, Rajotte RV, Suarez-Alamazor ME, Ao Z, Shapiro AM, Kneteman NM. Variables in organ donors that affect the recovery of human islets of Langerhans. Transplantation. 1996;61(7):1047–53. [DOI] [PubMed] [Google Scholar]
- 16. Ricordi C, Lakey JR, Hering BJ. Challenges toward standardization of islet isolation technology. Transplant Proc. 2001;33(1–2):1709. [DOI] [PubMed] [Google Scholar]
- 17. Weir GC, Bonner-Weir S. Finally! A human pancreatic β cell line. J Clin Invest. 2011;121(9):3395–97. [DOI] [PMC free article] [PubMed] [Google Scholar]
- 18. Ishihara H, Asano T, Tsukuda K, Katagiri H, Inukai K, Anai M, Kikuchi M, Yazaki Y, Miyazaki JI, Oka Y. Pancreatic beta cell line MIN6 exhibits characteristics of glucose metabolism and glucose-stimulated insulin secretion similar to those of normal islets. Diabetologia. 1993;36(11):1139–45. [DOI] [PubMed] [Google Scholar]
- 19. Hamaguchi K, Gaskins HR, Leiter EH. NIT-1, a pancreatic beta-cell line established from a transgenic NOD/Lt mouse. Diabetes. 1991;40(7):842–49. [DOI] [PubMed] [Google Scholar]
- 20. Poitout V, Olson LK, Robertson RP. Insulin-secreting cell lines: classification, characteristics and potential applications. Diabetes Metab. 1996;22(1):7–14. [PubMed] [Google Scholar]
- 21. Skelin M, Rupnik M, Cencic A. Pancreatic beta cell lines and their applications in diabetes mellitus research. ALTEX. 2010;27(2):105–13. [DOI] [PubMed] [Google Scholar]
- 22. Webb GC, Akbar MS, Zhao C, Steiner DF. Expression profiling of pancreatic beta cells: glucose regulation of secretory and metabolic pathway genes. Proc Natl Acad Sci U S A. 2000;97(11):5773–78. [DOI] [PMC free article] [PubMed] [Google Scholar]
- 23. Nakashima K, Kanda Y, Hirokawa Y, Kawasaki F, Matsuki M, Kaku K. MIN6 is not a pure beta cell line but a mixed cell line with other pancreatic endocrine hormones. Endocr J. 2009;56(1):45–53. [DOI] [PubMed] [Google Scholar]
- 24. Lilla V, Webb G, Rickenbach K, Maturana A, Steiner DF, Halban PA, Irminger JC. Differential gene expression in well-regulated and dysregulated pancreatic beta-cell (MIN6) sublines. Endocrinology. 2003;144(4):1368–79. [DOI] [PubMed] [Google Scholar]
- 25. Hart NJ, Weber C, Price N, Banuelos A, Schultz M, Huey B, Harnois E, Gibson C, Steyn LV, Papas KK, Lynch RM. Insulinoma-derived pseudo-islets for diabetes research. Am J Physiol Cell Physiol. 2021;321(2):C247–C256. [DOI] [PMC free article] [PubMed] [Google Scholar]
- 26. Cheng K, Delghingaro-Augusto V, Nolan CJ, Turner N, Hallahan N, Andrikopoulos S, Gunton JE. High passage MIN6 cells have impaired insulin secretion with impaired glucose and lipid oxidation. PLoS ONE. 2012;7(7):e40868. [DOI] [PMC free article] [PubMed] [Google Scholar]
- 27. Kinoshita N, Echigo Y, Shinohara S, Gu Y, Miyazaki J, Inoue K, Imamura M. Regulation of cell proliferation using tissue engineering in MIN6 cells. Cell Transplant. 2001;10(4–5):473–77. [PubMed] [Google Scholar]
- 28. Bhaiji T, Zhi ZL, Pickup JC. Improving cellular function and immune protection via layer-by-layer nanocoating of pancreatic islet β-cell spheroids cocultured with mesenchymal stem cells. J Biomed Mater Res A. 2012;100(6):1628–36. [DOI] [PubMed] [Google Scholar]
- 29. Drzazga A, Cichońska E, Koziołkiewicz M, Gendaszewska-Darmach E. Formation of βTC3 and MIN6 pseudoislets changes the expression pattern of Gpr40, Gpr55, and Gpr119 receptors and improves lysophosphatidylcholines-potentiated glucose-stimulated insulin secretion. Cells. 2020;9(9):2062. [DOI] [PMC free article] [PubMed] [Google Scholar]
- 30. Jo YH, Jang IJ, Nemeno JG, Lee S, Kim BY, Nam BM, Yang W, Lee KM, Kim H, Takebe T, Kim YS, et al. Artificial islets from hybrid spheroids of three pancreatic cell lines. Transplant Proc. 2014;46(4):1156–60. [DOI] [PubMed] [Google Scholar]
- 31. Nyitray CE, Chavez MG, Desai TA. Compliant 3D microenvironment improves β-cell cluster insulin expression through mechanosensing and β-catenin signaling. Tissue Eng Part A. 2014;20(13–14):1888–95. [DOI] [PMC free article] [PubMed] [Google Scholar]
- 32. Sakai S, Ono T, Ijima H, Kawakami K. Proliferation and insulin secretion function of mouse insulinoma cells encapsulated in alginate/sol-gel synthesized aminopropyl-silicate/alginate microcapsule. J Sol-Gel Sci Technol. 2003;28(2):267–72. [Google Scholar]
- 33. Tanaka H, Tanaka S, Sekine K, Kita S, Okamura A, Takebe T, Zheng YW, Ueno Y, Tanaka J, Taniguchi H. The generation of pancreatic β-cell spheroids in a simulated microgravity culture system. Biomaterials. 2013;34(23):5785–91. [DOI] [PubMed] [Google Scholar]
- 34. Kusamori K, Nishikawa M, Mizuno N, Nishikawa T, Masuzawa A, Shimizu K, Konishi S, Takahashi Y, Takakura Y. Transplantation of insulin-secreting multicellular spheroids for the treatment of type 1 diabetes in mice. J Control Release. 2014;173:119–24. [DOI] [PubMed] [Google Scholar]
- 35. Stewart T, Bode K, Kissler S, Yi P. Bioluminescent monitoring of graft survival in an adoptive transfer model of autoimmune diabetes in mice. J Vis Exp. 2022;189:e64836. [DOI] [PubMed] [Google Scholar]
- 36. Cai EP, Ishikawa Y, Zhang W, Leite NC, Li J, Hou S, Kiaf B, Hollister-Lock J, Yilmaz NK, Schiffer CA, Melton DA, et al. Genome-scale in vivo CRISPR screen identifies RNLS as a target for beta cell protection in type 1 diabetes. Nat Metab. 2020;2(9):934–45. [DOI] [PMC free article] [PubMed] [Google Scholar]
- 37. Ntamo Y, Samodien E, Burger J, Muller N, Muller CJF, Chellan N. In vitro characterization of insulin-producing β-cell spheroids. Front Cell Dev Biol. 2020;8:623889. [DOI] [PMC free article] [PubMed] [Google Scholar]
- 38. Cornell D, Miwa S, Georgiou M, Anderson SJ, Honkanen-Scott M, Shaw JAM, Arden C. Pseudoislet aggregation of pancreatic β-Cells improves glucose stimulated insulin secretion by altering glucose metabolism and increasing ATP production. Cells. 2022;11(15):2330. [DOI] [PMC free article] [PubMed] [Google Scholar]
- 39. Schulze T, Morsi M, Brüning D, Schumacher K, Rustenbeck I. Different responses of mouse islets and MIN6 pseudo-islets to metabolic stimulation: a note of caution. Endocrine. 2016;51(3):440–47. [DOI] [PubMed] [Google Scholar]
- 40. Kim JH, Lim IR, Joo HJ, Choi SC, Choi JH, Cui LH, Im L, Hong SJ, Lim DS. Sphere formation of adipose stem cell engineered by poly-2-hydroxyethyl methacrylate induces in vitro angiogenesis through fibroblast growth factor 2. Biochem Biophys Res Commun. 2015;468(1–2):372–79. [DOI] [PubMed] [Google Scholar]
- 41. Eder T, Eder IE. 3D hanging drop culture to establish prostate cancer organoids. Methods Mol Biol. 2017;1612:167–75. [DOI] [PubMed] [Google Scholar]
- 42. Wassmer CH, Lebreton F, Bellofatto K, Bosco D, Berney T, Berishvili E. Generation of insulin-secreting organoids: a step toward engineering and transplanting the bioartificial pancreas. Transpl Int. 2020;33(12):1577–88. [DOI] [PMC free article] [PubMed] [Google Scholar]
- 43. Lock LT, Laychock SG, Tzanakakis ES. Pseudoislets in stirred-suspension culture exhibit enhanced cell survival, propagation and insulin secretion. J Biotechnol. 2011;151(3):278–86. [DOI] [PubMed] [Google Scholar]
- 44. Bae CY, Min MK, Kim H, Park JK. Geometric effect of the hydrogel grid structure on in vitro formation of homogeneous MIN6 cell clusters. Lab Chip. 2014;14(13):2183–90. [DOI] [PubMed] [Google Scholar]
- 45. Wassmer CH, Bellofatto K, Perez L, Lavallard V, Cottet-Dumoulin D, Ljubicic S, Parnaud G, Bosco D, Berishvili E, Lebreton F. Engineering of primary pancreatic islet cell spheroids for three-dimensional culture or transplantation: a methodological comparative study. Cell Transplant. 2020;29:963689720937292. [DOI] [PMC free article] [PubMed] [Google Scholar]
- 46. Lin CC, Raza A, Shih H. PEG hydrogels formed by thiol-ene photo-click chemistry and their effect on the formation and recovery of insulin-secreting cell spheroids. Biomaterials. 2011;32(36):9685–95. [DOI] [PMC free article] [PubMed] [Google Scholar]
- 47. De Toni T, Stock AA, Devaux F, Gonzalez GC, Nunez K, Rubanich JC, Safley SA, Weber CJ, Ziebarth NM, Buchwald P, Tomei AA. Parallel evaluation of polyethylene glycol conformal coating and alginate microencapsulation as immunoisolation strategies for pancreatic islet transplantation. Front Bioeng Biotechnol. 2022;10:886483. [DOI] [PMC free article] [PubMed] [Google Scholar]
- 48. Stock AA, Gonzalez GC, Pete SI, De Toni T, Berman DM, Rabassa A, Diaz W, Geary JC, Jr, Willman M, Jackson JM, DeHaseth NH, et al. Performance of islets of Langerhans conformally coated via an emulsion cross-linking method in diabetic rodents and nonhuman primates. Sci Adv. 2022;8(26):eabm3145. [DOI] [PMC free article] [PubMed] [Google Scholar]
- 49. Bottino R, Fernandez LA, Ricordi C, Lehmann R, Tsan MF, Oliver R, Inverardi L. Transplantation of allogeneic islets of Langerhans in the rat liver: effects of macrophage depletion on graft survival and microenvironment activation. Diabetes. 1998;47(3):316–23. [DOI] [PubMed] [Google Scholar]
- 50. Carter RM, Yan Y. Measurement of particle shape using digital imaging techniques. J Phys Conf Ser. 2005;15(1):177. [Google Scholar]
- 51. Creusot RJ, Yaghoubi SS, Kodama K, Dang DN, Dang VH, Breckpot K, Thielemans K, Gambhir SS, Fathman CG. Tissue-targeted therapy of autoimmune diabetes using dendritic cells transduced to express IL-4 in NOD mice. Clin Immunol. 2008;127(2):176–87. [DOI] [PMC free article] [PubMed] [Google Scholar]
- 52. Yasunami Y, Nakafusa Y, Nitta N, Nakamura M, Goto M, Ono J, Taniguchi M. A novel subcutaneous site of islet transplantation superior to the liver. Transplantation. 2018;102:945–52. [DOI] [PubMed] [Google Scholar]
- 53. Van Gassen S, Callebaut B, Van Helden MJ, Lambrecht BN, Demeester P, Dhaene T, Saeys Y. FlowSOM: using self-organizing maps for visualization and interpretation of cytometry data. Cytometry A. 2015;87(7):636–45. [DOI] [PubMed] [Google Scholar]
- 54. Kapałczyńska M, Kolenda T, Przybyła W, Zajączkowska M, Teresiak A, Filas V, Ibbs M, Bliźniak R, Łuczewski Ł, Lamperska K. 2D and 3D cell cultures: a comparison of different types of cancer cell cultures. Arch Med Sci. 2018;14(4):910–19. [DOI] [PMC free article] [PubMed] [Google Scholar]
- 55. Jensen C, Teng Y. Is it time to start transitioning from 2D to 3D cell culture. Front Mol Biosci. 2020;7:33. [DOI] [PMC free article] [PubMed] [Google Scholar]
- 56. Buchwald P, Bernal A, Echeverri F, Tamayo-Garcia A, Linetsky E, Ricordi C. Fully automated islet cell counter (ICC) for the assessment of islet mass, purity, and size distribution by digital image analysis. Cell Transplant. 2016;25(10):1747–61. [DOI] [PubMed] [Google Scholar]
- 57. Zhou X, Xu Z, You Y, Yang W, Feng B, Yang Y, Li F, Chen J, Gao H. Subcutaneous device-free islet transplantation. Front Immunol. 2023;14:1287182. [DOI] [PMC free article] [PubMed] [Google Scholar]
- 58. Berman DM, Molano RD, Fotino C, Ulissi U, Gimeno J, Mendez AJ, Kenyon NM, Kenyon NS, Andrews DM, Ricordi C, Pileggi A. Bioengineering the endocrine pancreas: intraomental islet transplantation within a biologic resorbable scaffold. Diabetes. 2016;65(5):1350–61. [DOI] [PMC free article] [PubMed] [Google Scholar]
- 59. Baidal DA, Ricordi C, Berman DM, Alvarez A, Padilla N, Ciancio G, Linetsky E, Pileggi A, Alejandro R. Bioengineering of an intraabdominal endocrine pancreas. N Engl J Med. 2017;376(19):1887–89. [DOI] [PMC free article] [PubMed] [Google Scholar]
- 60. Deng H, Zhang A, Pang DRR, Xi Y, Yang Z, Matheson R, Li G, Luo H, Lee KM, Fu Q, Zou Z, et al. Bioengineered omental transplant site promotes pancreatic islet allografts survival in non-human primates. Cell Rep Med. 2023;4(3):100959. [DOI] [PMC free article] [PubMed] [Google Scholar]
- 61. Lenschow DJ, Zeng Y, Thistlethwaite JR, Montag A, Brady W, Gibson MG, Linsley PS, Bluestone JA. Long-term survival of xenogeneic pancreatic islet grafts induced by CTLA4lg. Science. 1992;257(5071):789–92. [DOI] [PubMed] [Google Scholar]
- 62. Russell WE, Bundy BN, Anderson MS, Cooney LA, Gitelman SE, Goland RS, Gottlieb PA, Greenbaum CJ, Haller MJ, Krischer JP, Libman IM, et al. Abatacept for delay of type 1 diabetes progression in stage 1 relatives at risk: a randomized, double-masked, controlled trial. Diabetes Care. 2023;46(5):1005–13. [DOI] [PMC free article] [PubMed] [Google Scholar]
- 63. Balboa D, Prasad RB, Groop L, Otonkoski T. Genome editing of human pancreatic beta cell models: problems, possibilities and outlook. Diabetologia. 2019;62(8):1329–36. [DOI] [PMC free article] [PubMed] [Google Scholar]
- 64. Chen J, Grieshaber S, Mathews CE. Methods to assess beta cell death mediated by cytotoxic T lymphocytes. J Vis Exp. 2011;52:2724. [DOI] [PMC free article] [PubMed] [Google Scholar]
- 65. Marin-Gallen S, Clemente-Casares X, Planas R, Pujol-Autonell I, Carrascal J, Carrillo J, Ampudia R, Verdaguer J, Pujol-Borrell R, Borràs FE, Vives-Pi M. Dendritic cells pulsed with antigen-specific apoptotic bodies prevent experimental type 1 diabetes. Clin Exp Immunol. 2010;160(2):207–14. [DOI] [PMC free article] [PubMed] [Google Scholar]
- 66. Xia CQ, Peng R, Qiu Y, Annamalai M, Gordon D, Clare-Salzler MJ. Transfusion of apoptotic beta-cells induces immune tolerance to beta-cell antigens and prevents type 1 diabetes in NOD mice. Diabetes. 2007;56(8):2116–23. [DOI] [PubMed] [Google Scholar]
- 67. Au KM, Tisch R, Wang AZ. In vivo bioengineering of beta cells with immune checkpoint ligand as a treatment for early-onset type 1 diabetes mellitus. ACS Nano. 2021;15(12):19990–20002. [DOI] [PubMed] [Google Scholar]
- 68. Au KM, Medik Y, Ke Q, Tisch R, Wang AZ. Immune checkpoint-bioengineered beta cell vaccine reverses early-onset type 1 diabetes. Adv Mater. 2021;33(25):e2101253. [DOI] [PMC free article] [PubMed] [Google Scholar]
- 69. O’Driscoll L, Gammell P, McKiernan E, Ryan E, Jeppesen PB, Rani S, Clynes M. Phenotypic and global gene expression profile changes between low passage and high passage MIN-6 cells. J Endocrinol. 2006;191(3):665–76. [DOI] [PubMed] [Google Scholar]
- 70. Huang HH, Harrington S, Stehno-Bittel L. The flaws and future of islet volume measurements. Cell Transplant. 2018;27(7):1017–26. [DOI] [PMC free article] [PubMed] [Google Scholar]
- 71. Bartosh TJ, Ylostalo JH. Preparation of anti-inflammatory mesenchymal stem/precursor cells (MSCs) through sphere formation using hanging-drop culture technique. Curr Protoc Stem Cell Biol. 2014;28:2b.6.1–2b.6.23. [DOI] [PMC free article] [PubMed] [Google Scholar]
- 72. Shapiro AMJ, Thompson D, Donner TW, Bellin MD, Hsueh W, Pettus J, Wilensky J, Daniels M, Wang RM, Brandon EP, Jaiman MS, et al. Insulin expression and C-peptide in type 1 diabetes subjects implanted with stem cell-derived pancreatic endoderm cells in an encapsulation device. Cell Rep Med. 2021;2(12):100466. [DOI] [PMC free article] [PubMed] [Google Scholar]
- 73. Ramzy A, Thompson DM, Ward-Hartstonge KA, Ivison S, Cook L, Garcia RV, Loyal J, Kim PTW, Warnock GL, Levings MK, Kieffer TJ. Implanted pluripotent stem-cell-derived pancreatic endoderm cells secrete glucose-responsive C-peptide in patients with type 1 diabetes. Cell Stem Cell. 2021;28(12):2047–61. [DOI] [PubMed] [Google Scholar]
- 74. Wang LH, Marfil-Garza BA, Ernst AU, Pawlick RL, Pepper AR, Okada K, Epel B, Viswakarma N, Kotecha M, Flanders JA, Datta AK, et al. Inflammation-induced subcutaneous neovascularization for the long-term survival of encapsulated islets without immunosuppression. Nat Biomed Eng. 2024;8(10):1266–84. [DOI] [PubMed] [Google Scholar]
- 75. Merani S, Toso C, Emamaullee J, Shapiro AM. Optimal implantation site for pancreatic islet transplantation. Br J Surg. 2008;95(12):1449–61. [DOI] [PubMed] [Google Scholar]
- 76. Outzen HC, Leiter EH. Transplantation of pancreatic islets into cleared mammary fat pads. Transplantation. 1981;32(2):101–105. [DOI] [PubMed] [Google Scholar]
Associated Data
This section collects any data citations, data availability statements, or supplementary materials included in this article.
Supplementary Materials
Supplemental material, sj-docx-1-cll-10.1177_09636897251315123 for High-Yield Generation of Glucose-Responsive Pseudoislets From Murine Insulinoma Cells for In Vitro Studies and Longitudinal Monitoring of Graft Survival In Vivo by Grisell C. Gonzalez, Chris M. Li, Ilaria Pasolini, Sophia I. Pete, Connor Verheyen, Sofia M. Vignolo, Teresa De Toni, Aaron A. Stock and Alice A. Tomei in Cell Transplantation