

Abstract
Background:
CMR differentiates CMET and CTHR based on tissue characteristics stemming from vascularity on late gadolinium enhancement (LGE). Perfusion-CMR can assess magnitude of vascularity; utility for CMASS is unknown.
Objectives:
To determine if perfusion-CMR provides diagnostic and prognostic utility for cardiac masses (CMASS) beyond binary differentiation of metastasis (CMET) and thrombus (CTHR).
Methods:
The population comprised adult cancer patients with CMASS on CMR; CMET and CTHR were defined using LGE-CMR: CMASS+ patients were matched to (CMASS-) controls for cancer type/stage. First pass perfusion-CMR was interpreted visually and semi-quantitatively for CMASS vascularity, including contrast enhancement ratio (CER: [plateau vs. baseline]) and uptake rate (CUR [slope]). Follow-up was performed for all-cause mortality.
Results:
462 cancer patients were studied, including patients with (CMET=173, CTHR=69) and without CMASS on LGE-CMR: On perfusion-CMR, CER and CUR were higher within CMET vs. CTHR (p<0.001); CUR yielded better performance (AUC 0.89–0.93) than CER (0.66–0.72; both p<0.001) to differentiate LGE-CMR evidenced CMET and CTHR, although both CUR (p=0.10) and CER (p=0.01) typically misclassified CMET with minimal enhancement. During follow-up, mortality among CMET patients was high but variable; 47% of patients were alive 1-year post-CMR. Patients with semi-quantitative perfusion-CMR evidenced CMET had higher mortality than controls (HR=1.42 [CI 1.06–1.90], p=0.02), paralleling visual perfusion-CMR (HR=1.47 [1.12–1.94], p=0.006) and LGE-CMR (HR=1.52 [1.16–2.00], p=0.003): Among patients with CMET on LGE-CMR, mortality was highest among patients (p=0.002) with lesions in the bottom perfusion (CER) tertile, corresponding to low vascularity. Among CMET and cancer-matched controls, mortality was equivalent (p=NS) among patients with lesions in upper CER tertile (corresponding to higher lesion vascularity). Conversely, patients with CMET in the middle (p=0.03) and lowest CER tertiles (lowest vascularity) had increased mortality (p=0.001).
Conclusions:
Perfusion-CMR yields prognostic utility that complements LGE-CMR: Among cancer patients with LGE-CMR defined CMET, mortality increases in proportion to magnitude of lesion hypoperfusion.
Keywords: cardiac magnetic resonance, cardiac masses, perfusion, cardio-oncology, late gadolinium enhancement
Introduction
Over 19 million people worldwide are diagnosed with cancer annually,(1) among whom survival has markedly increased - highlighting the importance of strategies to refine risk stratification for cancer complications: Cardiac masses (CMASS) are a leading indication for imaging cancer patients, among whom differentiation of metastasis (CMET) from thrombus (CTHR) is key to inform prognosis and therapy. Late gadolinium enhancement (LGE) cardiovascular magnetic resonance (CMR) tissue characterization has been well-validated as a reference for diagnostic differentiation of cardiac neoplasm and thrombus – including prior work by our group(2–7) and others(8–10) in which it has been shown to predict outcomes. Beyond differentiation between broad diagnostic categories, a key rationale for imaging of masses concerns prognostic assessment: LGE-CMR assesses presence of enhancement to differentiate CMET and CTHR, but magnitude of enhancement can be problematic as this method entails static imaging late after contrast infusion (during which contrast has been shown capable of traversing between vascular and avascular regions). This limitation is important, as CMET can vary with respect to magnitude of vascularity, and inadequate vascular supply to neoplastic tissue (i.e. tumor necrosis) is a known marker of aggressiveness.(11–13) In this context, imaging of contrast kinetics by perfusion-CMR holds the potential to further advance diagnostic and prognostic risk assessment for patients with CMET.
Perfusion-CMR can assess dynamic contrast enhancement to measure vascularity: The notion that vascular supply to a given region parallels magnitude of enhancement on perfusion imaging is widely accepted in the context of myocardium.(14) Given that CMET and CTHR intrinsically differ with respect to tissue properties stemming from vascularity, perfusion-CMR would be expected to differentiate between these diagnoses. Perfusion could also provide unique insights regarding magnitude of vascularity within tumors, thus enabling risk stratification that extends beyond binary diagnostic categories. Utility of perfusion-CMR for cardiac masses is acknowledged in consensus statements(15,16), but primary literature supporting this premise is limited to case reports or studies in which perfusion was tested together with other CMR approaches(8,9) – prohibiting assessment of its intrinsic utility.
This study tested utility of perfusion-CMR among a cancer registry of patients with cardiac masses and controls matched for cancer etiology/stage: Perfusion-CMR was used to assess lesion vascularity, as was LGE-CMR. Goals were to test 1) diagnostic performance of semi-quantitative and visual perfusion-CMR analyses to differentiate CMET and CTHR established by the reference of LGE-CMR; 2) whether perfusion-based partitions to distinguish CMET from CTHR confer differential prognosis; and 3) if mortality risk among cancer patients with CMET varies in proportion to lesion avascularity on perfusion-CMR.
Methods
Study Population
The population was derived from a bi-institutional (MSKCC, Cornell) registry of adult patients (≥18 years old) with systemic (extra-cardiac) cancer and CMR-evidenced cardiac masses (CMASS) who underwent a standardized imaging protocol, inclusive of LGE and perfusion. CMASS+ patients were matched (1:1) to patients without CMASS on CMR, but equivalent primary cancer type (primary organ) and disease stage. Additional registry details have been previously reported.(4–7) Patients with primary cardiac malignancies (i.e. sarcoma) were not eligible for this study. Systemic cancer registry patients with CMASS+ were also excluded from this study if perfusion-CMR was not performed as part of the imaging protocol (n=52) or CMASS was not visualized on perfusion-CMR (n=12) due to prominent lesion mobility or inadequate spatial coverage (prohibiting tissue characterization analyses), and/or lack of cancer care at enrolling sites (MSKCC, Cornell) prohibiting adequate clinical characterization (n=11). Patients with CMASS (on LGE) in whom perfusion-CMR was concomitantly performed as part of the imaging protocol were similar to those without perfusion with respect to age, sex, LVEF, and clinical prognosis (all p=NS).
This study entailed analysis of data acquired for clinical purposes between 2012–22. Ethics approval was provided by the Memorial Sloan Kettering Cancer Center and Weill Cornell Institutional Review Boards, which approved waivers of informed consent for analysis of preexisting clinical data.
Image Acquisition
CMR was performed on commercial (1.5T [89%], 3.0T [11%]) scanners (General Electric [GE], Waukesha, WI). Exams included ECG-gated cine, LGE, and perfusion components. Cine-CMR utilized a steady-state free precession (SSFP) pulse sequence acquired in contiguous LV short (mitral annulus - apex) and long axis (2, 3, 4 chamber) orientations. LGE-CMR utilized an inversion recovery pulse sequence. Conventional (inversion time [TI] ~300msec) and “long TI” (600msec) LGE-CMR were used as the reference for CMASS vascularity concordant with prior methods applied and validated by our group.(2,3,5,6,17) Conventional LGE-CMR was acquired in all patients; additional breath holds for supplemental long TI imaging were tolerated in 98% (236/242) of CMASS + patients (97% CTHR, 98% CMET). Long TI LGE was typically acquired 5–10 minutes post-contrast administration and conventional LGE thereafter (10–30 minutes).
Perfusion-CMR utilized an ECG-gated gradient echo pulse sequence. To standardize data interpretation, images were obtained in long axis (4-chamber) orientation; contiguous slices (~8 mm thickness) were acquired throughout the LV. Perfusion-CMR (typical TR: 2.0 msec, TE: 1.3 msec, TI: 105, flip angle 20°, FOV: 40 cm, 256 × 256 pixels, in plane spatial resolution 1.6 mm) was acquired in standardized orientations (4 chamber [3–4 slices; thickness 8–10 mm, spacing 8–10 mm]). Imaging was initiated at time of gadolinium injection (0.1 mmol kg, ~2cc/sec); and continued ~30–40 seconds thereafter (total contrast dose 0.2 mmol/kg, inclusive of first pass perfusion and subsequent infusion prior to LGE).
Image Analysis
CMASS was initially localized on cine-CMR, on which it was defined via established criteria as a discrete tissue prominence independent from normal anatomic structures,(2,3,5,6,17,18) quantified based on size (area, cross-sectional linear dimensions), and further categorized by type (CMET, CTHR) based on tissue characterization:
LGE-CMR:
CMET and CTHR were differentiated based on presence of contrast enhancement via the reference standard of LGE-CMR using established criteria previously validated by our group and others:(2,3,5–7,17,18) In brief, CMET was defined as a discrete mass with vascular tissue properties (enhancement present),(5,6) and CTHR defined based on avascularity (enhancement absent).(2,3,17,18) CMET were further sub-typed based on visually scored magnitude of enhancement (diffusely hyper-enhancing, mixed, predominantly hypo-enhancing) in accordance with established methods previously used by our group.(7)
Perfusion-CMR:
First pass perfusion was used to measure magnitude of contrast enhancement based on semi-quantitative analysis using the following standardized algorithm:
Perfusion datasets were initially reviewed to identify CMASS location, which was confirmed based on co-localization with cine-CMR.
Regions of interest (ROI) were then placed to encompass lesion borders, automatically propagated, and manually adjusted to optimize lesion tracking throughout contrast infusion to calculate contrast uptake rate (defined as slope of signal intensity curve during initial contrast infusion) and contrast enhancement ratio (defined as [plateau – baseline / baseline] signal intensity), both as absolute and (blood pool) normalized indices: Blood pool data was obtained from ROIs drawn in the systemic blood pool (LV cavity or aortic root), so as to calculate normalized CUR and CER based on lesion specific data (e.g. normalized CER = CMASS CER / blood CER).
For patients with multiple masses, the largest lesion (maximal diameter) was used for analysis. LGE and perfusion-CMR analyses were performed independently (blinded to results of the other method).
To test relative value of semi-quantitative and qualitative (visual) analyses, perfusion-CMR datasets were independently analyzed using a qualitative approach approximating that of the above semi-quantitative algorithm. To do so, lesions were interpreted by consensus of three readers (ATC, JK, JWW) for diagnostic etiology (CMET or CTHR) based on presence or absence of contrast enhancement. For cases designated as CMET, lesions were scored for magnitude of first pass contrast uptake using three strata (grade III: minimal [<50% of lesion area], grade II: mixed [≥50% of lesion demonstrating contrast uptake; scattered foci of hypoperfusion], grade I: diffuse contrast uptake).
Ancillary analyses included quantification of cardiac chamber size and function, which was measured on cine-CMR using established methods as have been shown to yield high reproducibility by our lab.(19,20)
Clinical Characterization
Electronic medical records were reviewed to ascertain cardiovascular risk factors, cancer etiology and therapeutic indices, and discern all-cause mortality following CMR: Follow-up date was calculated based on interval between baseline CMR and latest institutional follow-up visit. Pathology records and associated samples (in patients with surgical excision or biopsy of cardiac and/or contiguous extra-cardiac tissue) were extracted from data archives and reviewed for exploratory analysis to support CMR diagnostic classification of CMET and compare perfusion results to histopathology evidenced tissue properties.
Statistical Methods
Comparisons between groups were made using Student’s t test (expressed as mean ± standard deviation) for normally distributed continuous variables. Non-normally distributed variables (median, interquartile range) were compared via the Mann-Whitney U test. Categorical variables were compared using Chi-square or, when fewer than 5 expected outcomes per cell, Fisher’s exact test: Paired testing (t-tests or McNemar’s tests) was employed for matched case-control comparisons. The Kaplan-Meier method was used to estimate survival; follow-up duration was reported as median (IQR). Cox proportional hazards models compared mortality risk between groups. Receiver operating characteristics (ROC) analysis including area under the curve (AUC) estimates were used to evaluate overall diagnostic test performance of perfusion indices (absolute and normalized contrast upslope), and derive cutoffs (maximal sensitivity, specificity) for CMET as established using the reference of LGE-CMR. Univariable regression analyses were used to identify predictors of all-cause mortality, which were then further tested in multivariable regression analyses. Calculations were performed using SPSS v26 (SPSS Inc. [Chicago, IL]). Two-sided p<0.05 was deemed indicative of statistical significance.
Results
Population Characteristics
The study population comprised 462 cancer patients who underwent CMR, including patients with cardiac masses (CMASS) and controls matched (1:1) for cancer etiology/stage. Table 1 details population characteristics together with comparisons between patients with each CMASS type (CMET, CTHR) and their respective controls. As shown, cancer diagnosis varied: Among patients with CMASS, one-fifth (21%) of patients had primary non-cardiac sarcoma with an array of primary cancers (genitourinary, gastrointestinal, lymphoma) near evenly represented (13–18%). CMET and CTHR patients were similar to respective controls with respect to age, clinical indices, and anti-cancer regimen.
Table 1.
Population Characteristics
| Overall (n=462) |
Cardiac Metastasis |
p† | Cardiac Thrombus |
p† | |||
|---|---|---|---|---|---|---|---|
| MET + (n=173) |
MET – (n=157) |
THR + (n=69) |
THR – (n=63) |
||||
|
| |||||||
| Clinical Characteristics | |||||||
| Age (years) | 58 ± 16 | 60 ± 15 | 59 ± 16 | 0.97 | 52 ± 16 | 57 ± 16 | 0.06 |
| Sex (male) | 54% (250) | 54% (94) | 55% (86) | 0.91 | 48% (33) | 59% (37) | 0.30 |
| BSA (kg/m2) | 1.9 ± 0.3 | 1.8 ± 0.3 | 1.9 ± 0.3 | 0.31 | 1.9 ± 0.2 | 1.9 ± 0.3 | 0.85 |
| Cancer Etiologies * | |||||||
| Sarcoma | 21% (98) | 24% (42) | 24% (38) | - | 15% (10) | 13% (8) | - |
| Gastrointestinal | 18% (82) | 13% (22) | 14% (22) | - | 28% (19) | 30% (19) | - |
| Genitourinary | 13% (62) | 14% (24) | 13% (21) | - | 15% (10) | 11% (7) | - |
| Lymphoma | 13% (59) | 10% (17) | 11% (17) | - | 19% (13) | 19% (12) | - |
| Lung | 10% (48) | 13% (22) | 13% (20) | - | 4% (3) | 5% (3) | - |
| Skin/Melanoma | 7% (32) | 10% (17) | 10% (15) | - | 0% (0) | 0% (0) | - |
| Stage IV Cancer | 93% (431) | 100%(173) | 100% (157) | - | 77% (53) | 76% (48) | - |
| Anti-Cancer Regimen | |||||||
| Chemotherapy | |||||||
| Alkylating Agents | 48% (222) | 41% (71) | 43% (68) | 0.69 | 70% (48) | 56% (35) | 0.19 |
| Antimetabolites | 36% (165) | 31% (54) | 31% (48) | 0.89 | 51% (35) | 44% (28) | 0.23 |
| Antimicrotubular Agents | 46% (213) | 37% (64) | 41% (64) | 0.52 | 70% (48) | 59% (37) | 0.21 |
| Anthracycline | 26% (122) | 20% (35) | 26% (40) | 0.24 | 41% (28) | 30% (19) | 0.24 |
| Kinase Inhibitors | 9% (42) | 10% (18) | 11% (17) | 1.00 | 7% (5) | 3% (2) | 0.38 |
| Immunotherapy | 16% (73) | 16% (28) | 22% (35) | 0.08 | 9% (6) | 6% (4) | 0.69 |
| Radiation Therapy | 42% (192) | 49% (85) | 38% (59) | 0.03 | 33% (23) | 40% (25) | 0.46 |
| Mediastinal RT | 10% (48) | 17% (29) | 8% (13) | 0.01 | 1% (1) | 8% (5) | - |
| Coronary Artery Disease | 11% (50) | 15% (25) | 6% (10) | 0.06 | 9% (6) | 14% (9) | 0.58 |
| Atherosclerosis Risk | |||||||
| Factors | |||||||
| Hypertension | 36% (168) | 39% (67) | 39% (61) | 1.00 | 25% (17) | 37% (23) | 0.08 |
| Hypercholesterolemia | 29% (132) | 30% (52) | 31% (48) | 0.90 | 22% (15) | 27% (17) | 0.68 |
| Diabetes Mellitus | 13% (59) | 12% (21) | 15% (24) | 0.50 | 7% (5) | 14% (9) | 0.39 |
| Tobacco Use | 33% (154) | 34% (59) | 34% (54) | 1.00 | 36% (25) | 25% (16) | 0.17 |
|
| |||||||
| Cardiac Morphology and Function | |||||||
|
Left Ventricle Ejection fraction (%) End-diastolic volume (mL) End-systolic volume (mL) Stroke volume (mL) Myocardial mass (gm) End-diastolic diameter (cm) Right Ventricle Ejection fraction (%) End-diastolic volume (mL) End-systolic volume (mL) Stroke volume (mL) |
60 ± 12 125 ± 44 53 ± 33 73 ± 21 114 ± 43 4.8 ± 0.7 54 ± 9 132 ± 43 63 ± 29 69 ± 21 |
62 ± 10 113 ± 33 44 ± 20 69 ± 20 108 ± 39 4.6 ± 0.5 54 ± 9 124 ± 36 58 ± 23 66 ± 20 |
60 ± 13 132 ± 50 57 ± 40 75 ± 22 117 ± 45 4.9 ± 0.8 53 ± 9 136 ± 50 67 ± 36 69 ± 23 |
0.07 <0.001 <0.001 0.03 0.13 <0.001 0.47 0.03 0.02 0.24 |
61 ± 10 128 ± 41 53 ± 33 76 ± 22 105 ± 41 4.9 ± 0.6 56 ± 8 133 ± 41 60 ± 24 73 ± 22 |
55 ± 15 139 ± 47 66 ± 39 73 ± 23 133 ± 47 5.0 ± 0.8 52 ± 11 139 ± 40 69 ± 28 70 ± 21 |
0.02 0.19 0.03 0.51 0.001 0.13 0.01 0.43 0.04 0.27 |
|
Atria Left atrial area (cm2) Right atrial area (cm2) |
20 ± 7 18 ± 6 |
19 ± 6 18 ± 5 |
20 ± 7 20 ± 7 |
0.03 0.68 |
21 ± 7 17 ± 5 |
21 ± 7 19 ± 7 |
0.93 0.15 |
Other cancer etiologies: endocrine (6% [n=26]), breast (6% [n=26]), leukemia (4% [n=17]), and head/neck (3% [n=12]).
Matching not possible in 22 patients (16 CMET, 6 CTHR) due to non-equivalent cancer diagnosis/stage among controls undergoing CMR.
Regarding anatomic distribution, CMET distribution varied widely (30% LV | 27% LA | 32% RV | 36% RA | 30% pericardium); 28% of patients had lesions in multiple cardiac chambers whereas nearly all (90%) CTHR localized to the right atrium. Notably, while LV and RV chamber size were smaller in patients with CMET compared to controls (p<0.05) – a finding potentially attributable to metastatic chamber invasion, systolic function (EF) was similar between groups (p=NS).
Perfusion-CMR Contrast Kinetics
Table 2 compares perfusion-CMR measured contrast kinetics between CMET and CTHR as defined using the reference of LGE-CMR. As shown, contrast uptake rate during first pass gadolinium infusion was higher within CMET irrespective of whether analyzed based on absolute or blood pool normalized data (both p<0.001). Contrast enhancement ratio also yielded differences between CMET compared to CTHR (p<0.001), although magnitude of difference was less (~2-fold) than that of contrast uptake (> 5-fold). Of note, Table 2 also demonstrates that differential tissue properties of CMET and CTHR were not attributable to differential contrast dosing, hemodynamic indices, or LV systolic function between groups (all p=NS). Figure 1 provides representative examples of cardiac masses assessed by perfusion-CMR, as well as corresponding semi-quantitative data for which dynamic contrast enhancement differentiated CMET from CTHR.
Table 2.
Perfusion Contrast Kinetics among Patients with Cardiac Metastasis and Thrombus
| Cardiac Metastasis (n=173) |
Cardiac Thrombus (n=69) |
p | |
|---|---|---|---|
|
| |||
|
Perfusion CMR Contrast uptake rate (CUR) Absolute Normalized (blood pool, %) Blood Pool Contrast Enhancement Ratio (CER) Absolute Normalized (blood pool, %) Blood Pool |
9.4 [5.5–18.1] 9.0 [4.9–16.7] 120.0 [64.7–207.5] 1.3 [0.8–2.4] 15.7 [10.3–24.2] 9.5 [5.6–15.2] |
1.5 [0.3–3.0] 1.0 [0.3–3.2] 114.5 [57.4–210.6] 0.7 [0.3–1.8] 8.7 [4.2–17.2] 8.3 [5.9–15.2] |
<0.001 <0.001 0.74 <0.001 <0.001 0.94 |
|
| |||
|
| |||
| Gadolinium Dose (ml) | 28.7 ± 7.7 | 29.4 ± 6.9 | 0.48 |
| Heart Rate | 85.9 ± 17.7 | 81.2 ± 16.6 | 0.07 |
| Stroke Volume (LV [ml]) | 69.1 ± 20.0 | 75.5 ± 21.7 | 0.03 |
| Blood Pressure † | |||
| Systolic Blood Pressure (mm Hg) | 120.2 ± 17.2 | 119.8 ± 16.6 | 0.88 |
| Diastolic Blood Pressure (mm Hg) | 75.2 ± 10.1 | 75.4 ± 13.9 | 0.94 |
| Mean Arterial Pressure (mm Hg) | 90.3 ± 10.8 | 90.2 ± 12.2 | 0.97 |
Cardiac metastasis and thrombus defined using the reference standard of LGE-CMR
Measured non-invasively via brachial cuff within 24 hours of CMR (available in 91% [91% CMET, 91% CTHR]).
Figure 1. Representative Examples.

Representative examples of left (1A) and right (1B) sided CMET and CTHR as respectively assessed by LGE and perfusion-CMR (top), as well as corresponding perfusion analyses to measure contrast kinetics (bottom). In brief, regions of interest (ROI) were placed over lesions and tracked throughout the cardiac cycle so as to measure slope (contrast uptake rate [CUR]) and plateau enhancement (contrast enhancement ratio [CER]).
Note that for both examples, CMET (blue) demonstrated higher contrast enhancement than did CTHR (purple), consistent with presence of vascular supply. However, a range of vascularity was evident among CMET cases for which lesions with minimal enhancement on LGE-CMR (center; dark blue outline) demonstrated lower magnitude of semi-quantitative perfusion than did diffusely enhancing lesions (left; light blue outline), corresponding to lesser differentiation from CTHR.
Diagnostic Performance of Perfusion-CMR
Perfusion-CMR indices were tested with respect to differential approaches and optimal diagnostic cutoffs to delineate between CMET and CTHR. Figure 2 provides ROC curves for semi-quantitative perfusion cutoffs in relation to the reference of LGE-CMR evidenced CMET. As shown, absolute and blood pool normalized CUR provided higher overall diagnostic performance (AUC: 0.89-0.93) than did CER (AUC: 0.66–0.72; both p<0.001). Table 3 reports individual diagnostic parameters as derived using cutoffs for maximal sensitivity and specificity: Note, absolute CUR yielded highest overall accuracy (87%), but sensitivity (84%) and negative predictive value (71%) were suboptimal, attributable to substantial false negatives (n=27). Table 3 also demonstrates that qualitative (visual) perfusion-CMR interpretation yielded slightly lower overall diagnostic performance to that of semi-quantitative analysis, as evidenced by decreased accuracy (83%) to that of semi-quantitative CMR (maximal accuracy [absolute CUR] 87%).
Figure 2. Perfusion-CMR for Differentiation of Cardiac Metastasis and Thrombus.

Receiver operating characteristics (ROC) curves for perfusion-CMR cutoffs in relation to CMET as established by the reference of LGE-CMR (red = contrast uptake rate [CUR], blue = enhancement ratio [CER]; solid and dashed lines correspond to absolute and blood pool normalized data for each).
Note good overall diagnostic performance for semi-quantitative CUR (AUC 0.89–0.93), which was higher than that of CER (0.66–0.72). Corresponding diagnostic test parameters derived from ROC curves shown in Table 3.
Table 3.
Diagnostic Performance of Perfusion-CMR to Differentiate Metastasis vs. Thrombus
| Sensitivity | Specificity | Accuracy | Positive Predictive Value |
Negative Predictive Value |
|
|---|---|---|---|---|---|
| Semi-Quantitative Analysis | |||||
| Contrast Uptake Rate | |||||
| CMASS | 84% (146/173) |
94% (65/69) |
87% (211/242) |
97% (146/150) |
71% (65/92) |
| CMASS/blood | 93% (160/173) |
73% (50/69) |
87% (210/242) |
89% (160/179) |
79% (50/63) |
| Contrast Enhancement Ratio | |||||
| CMASS | 76% (131/173) |
54% (37/69) |
69% (168/242) |
80% (131/163) |
47% (37/79) |
| CMASS/blood | 73% (126/173) |
65% (45/69) |
71% (171/242) |
84% (126/150) |
49% (45/92) |
| Qualitative (visual) Analysis | |||||
| CMASS | 88% (152/173) |
70% (48/69) |
83% (200/242) |
88% (152/173) |
70% (48/69) |
Diagnostic indices (e.g. sensitivity) calculated in relation to presence of cardiac metastasis as defined using the reference standard of LGE-CMR cut off CUR (CMASS = 4.34, CMASS/blood = 2.64%), CER (CMASS = 0.80, CMASS/blood = 11.56%)
Among the overall cohort of patients with LGE-CMR evidenced CMET, 32 had pathology analyses either via surgical excision or biopsy of cardiac and/or contiguous extra-cardiac tissue (median interval from CMR was 0.05 [IQR −0.86–0.77] months): Of these, all had pathology evidenced neoplasms (97% [31/32] had pathological confirmation of primary cancer type). Among this subgroup of patients with pathology, semi-quantitative perfusion correctly classified lesions as neoplastic in 75% (n=24/32) and visual perfusion in 88% (n=28/32). Figure 3 provides representative examples of perfusion-CMR enhancement patterns in relation to pathology evidenced tissue characterization, for which results demonstrated CMET with minimal enhancement to correspond to lesions with tumor necrosis or prominent cellularity on pathology, and prominent enhancement on CMR to reflect prominent vascularity on pathology.
Figure 3. CMET Perfusion on CMR in Relation to Pathology-Evidenced Lesion Vascularity.
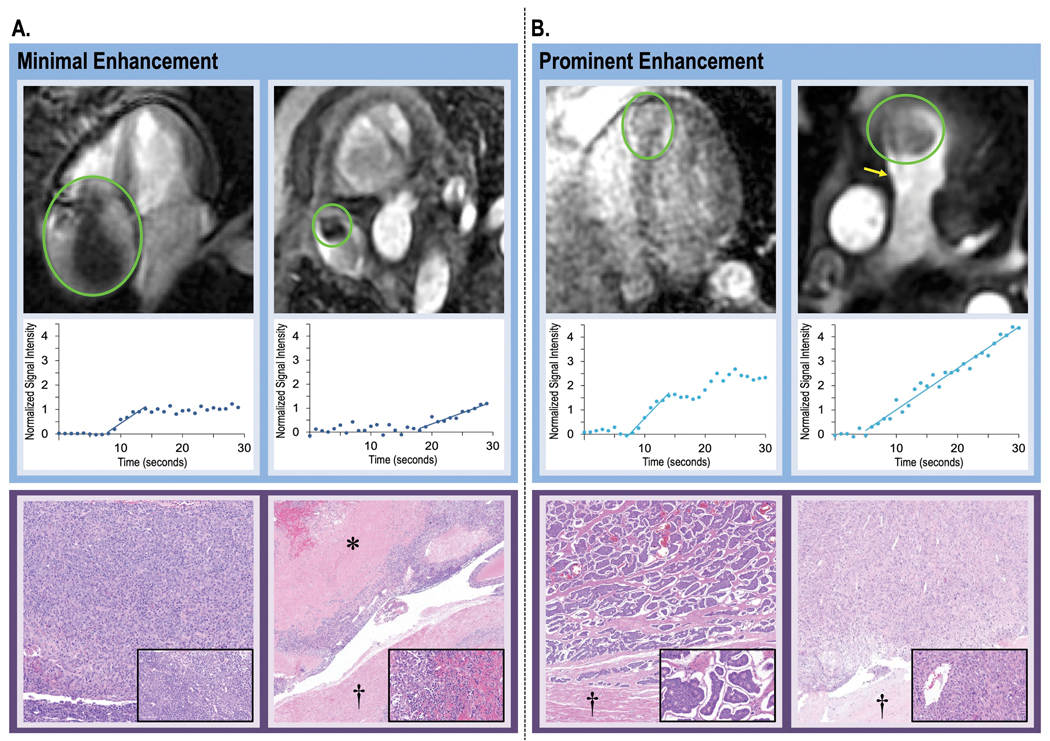
Representative examples of CMET with variable magnitude of perfusion (top) together with semi-quantitative perfusion-CMR analysis (middle) and pathology-evidenced lesion vascularity (bottom). As shown, variability in contrast kinetics on perfusion-CMR paralleled differential vascular and cell density on pathology.
3A: Two cases of minimally enhancing CMET on perfusion-CMR, including thymoma (left) for which pathology demonstrated high tumor cell burden with minimal vascular content and melanoma (right) for which pathology demonstrated scattered vascular content (melanoma) with prominent tumor necrosis.
3B: Two cases of prominently enhancing CMET on perfusion-CMR (left: neuroendocrine, right: spindle cell sarcoma), both of which had high vascular density on pathology.
Legend: asterisk = tumor necrosis, dagger = myocardium; inserts = high power views of tumor components (pathology images obtained using hematoxylin and eosin staining).
To explore whether diagnostic performance varied in relation to magnitude of enhancement, perfusion-CMR performance was tested in relation to lesion sub-type on LGE-CMR: Two thirds (58%) of predominantly hypo-enhancing lesions (on LGE) were misclassified as CTHR based on CER, a rate nearly 3-fold higher compared to mixed or enhancing lesions (22%; p=0.01). Similarly, one third (33%) of CMET lesions misclassified by perfusion-CMR derived CUR were scored as predominantly hypo-enhancing on LGE-CMR, a rate > 2-fold higher compared to mixed or enhancing lesions (14%; p=0.10). Similarly, Figure 1 illustrates CMET enhancement patterns on LGE-CMR, for which predominantly hypo-enhancing lesions (middle) demonstrated lesser differentiation from CTHR than did those with diffuse enhancement (left columns).
Clinical Prognosis
Mortality was assessed after CMR to test whether perfusion-based diagnostic classification of CMET and CTHR conferred differential prognosis, and if magnitude of lesion perfusion further differentiated mortality risk. 92% of patients had follow-up ≥1 year or mortality within this interval, including an aggregate 1-year mortality in patients with LGE-defined CMET of 53% (43% in controls; p=0.09). Median duration of post-CMR follow-up was 29 months [IQR 12.6 – 48.5] among survivors.
Figure 4 provides Kaplan Meier survival curves of patients with LGE (left) and perfusion (middle, right) CMR defined CMET and CTHR, as well as controls matched for primary cancer type and stage. As shown, each tissue characterization method demonstrated mortality to be increased among patients with CMET, although risk for death was higher using LGE (HR=1.52 [1.16–2.00], p=0.003) than perfusion (semi-quantitative HR=1.42 [1.06–1.90], p=0.02; visual HR=1.47 [1.12– 1.94], p=0.006). Regarding CTHR, LGE yielded similar mortality risk between cases and controls (HR=1.43 [0.88–2.32], p=0.15). Conversely, patients with semi-quantitative perfusion-CMR classified CTHR had higher mortality than controls (HR=1.61 [1.07–2.41], p=0.02), consistent with above noted misclassification of low vascularity (predominantly hypo-enhancing) tumors. Of note, differential mortality between respective controls for CMET and CTHR paralleled differences in cancer type and stage between these diagnostic groups.
Figure 4. Mortality Based on Diagnostic Categorization by CMR Tissue Characterization Methods.

Kaplan-Meier analyses for patients with CMET and CTHR as established by LGE (left), semi-quantitative perfusion-CMR (middle) and visual perfusion-CMR (right), as well as among respective cancer-matched controls. As shown, both CMR tissue characterization methods demonstrated mortality to be higher among patients with CMET, although adverse prognosis conferred by LGE was higher (HR=1.52 [1.16–2.00], p=0.003) than that conferred by perfusion, irrespective of whether interpreted using semi-quantitative (HR=1.42 [1.06–1.90], p=0.02) or visual (HR=1.47 [1.12–1.94], p=0.006) based diagnostic classifications. Conversely, LGE-CMR demonstrated patients with CTHR to have similar mortality to controls, whereas mortality was higher when CTHR was established based on perfusion, consistent with study analysis showing tumors with minimal enhancement (on LGE) to often be misclassified as CTHR based on perfusion cutoffs.
Perfusion-Based Strata of Mortality Risk
Given variable magnitude of difference in perfusion indices between CMET and CTHR (paralleled by differential diagnostic performance), mortality was tested in relation to perfusion pattern to discern if mortality among cancer patients with CMET varied in relation to magnitude of contrast enhancement perfusion-CMR.
Figure 5 stratifies patients with CMET (defined by the reference of LGE-CMR) into population-based tertiles of lesion vascularity based on contrast enhancement ratio, as well as follow-up data among CMET patients (compared to controls) within respective tertiles. As shown, mortality risk among the overall cohort (5A) increased in proportion to lesion hypoperfusion (HR=1.40 [1.12–1.74], p=0.003) and was highest among patients with lesions in the bottom perfusion (CER) tertile. One year survival in the top tertile was 57%, ~1.5 times higher than that of the lowest tertile (40%, p=0.07). Consistent with above noted limits in diagnostic performance of semi-quantitative perfusion-CMR, qualitative analysis provided lesser prognostic value than did semi-quantitative assessments as evidenced by non-significant differences in mortality risk among patients with visually assigned perfusion tertiles (HR=1.07 [0.89–1.29, p=0.47).
Figure 5. Mortality Among Patients with Cardiac Metastases in Relation to Lesion Hypoperfusion.

5A: Kaplan-Meier curve encompassing patients with CMET (defined by the reference of LGE-CMR) stratified based on population-based tertiles of lesion vascularity (CER) as measured on semi-quantitative perfusion-CMR. As shown, there was a stepwise association between CMET hypoperfusion and risk for death: Patients in the lowest tertile had higher mortality (p=0.002) than those in the upper-most tertile, paralleling a similar trend for patients in the middle tertile (p=0.09). Primary data from which tertile partitions derived shown in upper right.
5B: Comparisons between CMET cases and cancer-matched controls within each respective semi-quantitative perfusion tertile. As shown, patients within lowest tertile of perfusion-CMR evidenced vascularity (CER) had higher risk for death than did controls (p=0.001), paralleling a similar pattern but lesser magnitude of difference in the middle perfusion tertile (p=0.03). Conversely, mortality for patients with lesions in the highest perfusion tertile (corresponding to highest vascularity) was equivalent to that of cancer-matched controls (p=0.67).
Regarding case-control comparisons, data shown in 5B demonstrates that patients with CMET in the lowest tertile of semi-quantitative perfusion-CMR evidenced vascularity (based on CER) had higher risk for death than did cancer-matched controls (HR = 2.20 [1.37–3.53], p<0.001), paralleling a similar pattern but lesser magnitude of risk for patients in the middle tertile (HR = 1.66 [1.04–2.64], p=0.03). Conversely, prognosis was equivalent to controls among patients with lesions in the highest tertile of perfusion-CMR evidenced contrast enhancement ratio (HR = 0.90 [0.54–1.48], p=0.67).
Despite differential prognosis in relation to lesion perfusion pattern, Table 4 demonstrates that lesion location and cancer etiology did not differ between perfusion-CMR derived contrast enhancement partitions (all p=NS) whereas lesion size (area, length) increased in relation to lesion hypoperfusion (p<0.05). Regarding anti-cancer treatments, mediastinal radiation was associated with lesion hypoperfusion, as evidenced by increased frequency of use among patients stratified based on tertile-based decrements in CER (p<0.05), whereas frequency of chemotherapy and other anti-cancer therapeutic classes did not differ between perfusion-based partitions (p=NS).
Table 4.
Contrast Enhancement Partitions in Relation to Semi-Quantitative Perfusion Data, Anatomic Features, and Cancer Type
| Contrast Enhancement Ratio (population-based tertiles) |
p | |||
|---|---|---|---|---|
| <33th (III) | 33–66th (II) | >66th (I) | ||
|
| ||||
|
Semi-Quantitative Perfusion CER CMET CMET/Blood (%) CUR CMET CMET/Blood (%) Lesion Location Right atrium Right ventricle Left atrium Left ventricle Multi-chamber Pericardium Lesion Size Area (cm2) Perimeter (cm) Maximal Length Orthogonal Length Perimeter/Min Length Cancer Etiology Sarcoma Gastrointestinal Genitourinary Lymphoma Lung Skin/Melanoma Anti-Cancer Regimen Chemotherapy Alkylating Agents Antimetabolites Antimicrotubular Agents Anthracycline Kinase Inhibitors Immunotherapy Radiation Therapy (RT) Mediastinal RT |
0.6 [0.5 – 0.8] 105 [8.6 – 15.2] 6.7 [3.5 – 13.0] 8.3 [4.6 – 15.4] 30% (17) 39% (22) 25% (14) 19% (11) 19% (11) 39% (22) 7.6 [2.2 – 18.2] 11.9 [6.0 – 17.9] 4.0 [2.0 – 6.6] 2.3 [1.3 – 3.8] 4.5 [4.0 – 5.3] 25% (14) 9% (5) 19% (11) 12% (7) 9% (5) 9% (5) 44% (25) 30% (17) 37% (21) 26% (15) 14% (8) 18% (10) 60% (34) 28% (16) |
1.3 [1.2 – 1.6] 16.6 [11.8 – 25.1] 9.3 [5.8 – 15.1] 7.8 [4.7 – 15.8] 43% (25) 28% (16) 26% (15) 35% (20) 31% (18) 29% (17) 6.0 [2.9 – 17.0] 9.7 [7.1 – 17.7] 3.3 [2.3 – 5.7] 2.0 [1.5 – 3.4] 4.7 [3.9 – 5.7] 22% (13) 21% (12) 7% (4) 12% (7) 16% (9) 10% (6) 47% (27) 36% (21) 38% (22) 19% (11) 12% (7) 16% (9) 40% (23) 12% (7) |
2.6 [2.3 – 3.4] 21.3 [15.2 – 31.9] 14.1 [7.5 – 38.5] 9.8 [6.1 – 20.4] 35% (20) 31% (18) 29% (17) 36% (21) 33% (19) 21% (12) 3.3 [1.9 – 8.3] 7.2 [5.5 – 12.7] 2.6 [1.9 – 4.0] 1.8 [1.2 – 2.7] 4.1 [3.6 – 5.2] 26% (15) 9% (5) 16% (9) 5% (3) 14% (8) 10% (6) 33% (19) 27% (16) 36% (21) 16% (9) 5% (3) 16% (9) 48% (28) 10% (6) |
<0.001 <0.001 <0.001 0.42 0.33 0.44 0.84 0.10 0.22 0.11 0.04 0.03 0.02 0.28 0.06 0.91 0.08 0.14 0.35 0.54 0.95 0.28 0.59 0.98 0.34 0.27 0.95 0.10 0.02 |
Table 5 reports regression analyses testing clinical, therapeutic, and imaging predictors of mortality in the study cohort. Regarding cancer related indices, among cancer diagnostic categories, patients with lymphoma were at decreased risk for death (HR= 0.44 [0.26 – 0.75], p=0.002), whereas mortality risk was increased in patients with gastrointestinal malignancies (1.63 [1.12 – 2.37], p=0.01) or those treated with antimetabolites or kinase inhibitors (both p<0.05): Conversely, neither age, cardiovascular risk factors, or conventional indices of cardiac chamber geometry or systolic function were associated with differential prognosis (all p=NS). Regarding CMET tissue characteristics, decreased lesion perfusion (contrast enhancement ratio) conferred increased mortality risk – irrespective of whether assessed as a continuous variable or based on graded tertiles of hypoperfusion (both p<0.05); results paralleled a similar trend for graded severity of hypo-enhancement on LGE-CMR (p=0.09). In multivariable analysis for which the model included all variables associated with differential prognosis in univariable regression, decreased lesion perfusion (CER) remained independently associated with increased risk for death (1.30 [1.03 – 1.64], p=0.03).
Table 5.
Mortality Predictors Among Patients with LGE-CMR Evidenced Cardiac Metastases
| Hazard Ratio | p | |
|---|---|---|
|
| ||
| Univariable Regression * | ||
| Clinical Characteristics Age (per year) Gender (male) Cancer Etiology Sarcoma Gastrointestinal Genitourinary Lymphoma Lung Skin/Melanoma Anti-Cancer Regimen Chemotherapy Alkylating Agents Antimetabolites Antimicrotubular Agents Anthracycline Kinase Inhibitors Immunotherapy Radiation Therapy Mediastinal RT Coronary Artery Disease Cardiovascular Risk Factors Hypertension Hypercholesterolemia Diabetes Mellitus Tobacco Use Cardiac Function and Geometry Left Ventricle (LV) LVEF (per %) LVEF (<50%) LVEDV (per ml) Right Ventricle (RV) RVEF (per %) RVEF (<50%) RVEDV (per ml) CMET Lesion Characteristics Anatomic Properties Maximal diameter (per 10 cm) Area (per 10 cm2) Tissue Properties Perfusion CMR Contrast Enhancement Ratio Contrast Enhancement Ratio Grade (I-III) ‡ Contrast Uptake Rate Visual Perfusion Grade (I-III) § Late Gadolinium Enhancement CMR SNR Visual LGE Grade (I-III) ¶ |
1.00 [0.99 – 1.01] 1.07 [0.82 – 1.40] 1.21 [0.89 – 1.64] 1.63 [1.12 – 2.37] 1.11 [0.75 – 1.63] 0.44 [0.26 – 0.75] 1.46 [0.99 – 2.14] 0.79 [0.50 – 1.24] 1.23 [0.94 – 1.61] 1.81 [1.36 – 2.40] 1.23 [0.94 – 1.62] 0.87 [0.63 – 1.21] 1.68 [1.12 – 2.52] 0.95 [0.67 – 1.35] 1.07 [0.81 – 1.40] 1.10 [0.74 – 1.64] 0.83 [0.53 – 1.33] 0.80 [0.60 – 1.05] 0.92 [0.68 – 1.23] 1.06 [0.73 – 1.53] 0.96 [0.73 – 1.28] 1.01 [0.99 – 1.02] 0.81 [0.54 – 1.23] 1.00 [0.99 – 1.00] 1.01 [0.99 – 1.03] 0.79 [0.57 – 1.08] 1.00 [0.99 – 1.00] 1.82 [0.84 – 3.95] 1.10 [0.97 – 1.26] 0.77 [0.64 – 0.93] 1.32 [1.05 – 1.66] 1.00 [0.99 – 1.01] 1.07 [0.94 – 1.22] 1.00 [1.00 – 1.01] 1.21 [0.97 – 1.52] |
0.62 0.63 0.22 0.01 0.61 0.002 0.06 0.30 0.14 <0.001 0.14 0.40 0.01 0.78 0.64 0.65 0.44 0.11 0.56 0.77 0.80 0.35 0.32 0.15 0.27 0.13 0.19 0.13 0.14 0.005 0.02 0.81 0.33 0.28 0.09 |
|
| ||
| Multivariable Regression † | ||
| Contrast Enhancement Ratio Grade (perfusion) | 1.30 [1.03 – 1.64] | 0.03 |
| GI (cancer etiology) | 1.21 [0.70 – 2.08] | 0.50 |
| Lymphoma (cancer etiology) | 0.79 [0.41 – 1.53] | 0.48 |
| Antimetabolite (therapy) | 1.71 [1.13 – 2.58] | 0.01 |
| Kinase Inhibitors (therapy) | 1.52 [0.84 – 2.74] | 0.16 |
Univariable comparisons between cancer patients with CMR-evidenced cardiac metastases and cancer-matched controls.
Multivariable regression model comprised of factors significantly associated with mortality (p<0.05) in univariable analysis.
Semi-quantitative perfusion tertiles as reported in Figure 5 (I: highest tertile, II: middle tertile, III lowest tertile); HR reported inversely in relation to perfusion tertile (lower 2 tertiles vs. highest tertile)
Qualitative perfusion grades as in text (grade III: <50% of lesion area, grade II: mixed: >50% of lesion demonstrating contrast uptake; scattered foci of hypoperfusion, grade I: diffuse contrast uptake).
LGE grades as in text (diffusely hyper-enhancing, mixed, predominantly hypo-enhancing)
Discussion
This is the first study to test perfusion-CMR tissue characterization for cardiac masses. Key findings are as follows: First, among a broad cancer cohort, perfusion contrast kinetics differed between vascular and avascular masses, as evidenced by higher upslope and peak enhancement for LGE-CMR defined CMET vs. CTHR (p<0.001). Second, while perfusion-CMR yielded good overall performance (maximum AUC 0.89–0.93) for CMET, sensitivity (84%) and negative predictive value (71%) were suboptimal and were predominantly attributable to misclassification of tumors with minimal enhancement on LGE-CMR. Third, although both methods showed mortality to be increased among patients with CMET, risk for death was higher using LGE (HR=1.52 [1.16–2.00], p=0.003) than perfusion (semi-quantitative HR=1.42 [1.06–1.90], p=0.02; visual HR=1.47 [1.12–1.94], p=0.006). Last, whereas CMET strongly impacted prognosis, mortality risk varied – nearly half (47%) of affected patients were alive 1 year post CMR: Among patients with CMET on LGE-CMR, mortality varied in relation to perfusion-CMR – as evidenced by an inverse association between lesion enhancement (CER) and mortality (HR=1.40 [1.12–1.74], p=0.003), and increased mortality among patients with lowest perfusing lesions compared to cancer-matched controls (HR=2.20 [1.37–3.53], p<0.001). Results also demonstrated that key lesion perfusion characteristics (CER) were similarly distributed among patients within major cancer categories within our study population, suggesting that perfusion characteristics are not linked to cancer type. Taken together, findings (Central Illustration) demonstrate added prognostic value of perfusion for patients with CMET among whom lesion hypovascularity is a novel marker of adverse prognosis.
Central Illustration. Perfusion CMR for Cancer-Associated Cardiac Masses.

Multicenter data from two cancer centers demonstrated perfusion-CMR evidenced contrast kinetics to differ between vascular and avascular masses, as evidenced by higher uptake (slope) and plateau enhancement for cardiac metastasis vs. thrombus. While perfusion performed well in relation to LGE, performance as a primary method to differentiate mass types and stratify prognosis was compromised by misclassification of metastases with minimal enhancement: Among patients with CMET on LGE-CMR, perfusion-CMR demonstrated mortality to increase with lesion hypo-perfusion and to be augmented for patients with low vascularity lesions and equivalent (to that of controls) for patients with high vascularity lesions. Findings support utility of integrated CMR tissue characterization for cardiac masses, in which initial diagnosis is established by LGE and prognosis for CMET further stratified based on perfusion-CMR evidenced lesion hypo-vascularity.
Applied clinically, our results support an algorithm by which LGE-CMR is used for initial diagnostic differentiation between CMET and CTHR, and mortality risk among patients with LGE-evidenced CMET is further stratified based on perfusion-CMR. Whereas LGE-CMR is well validated for differentiating between neoplasm and thrombus based on presence or absence of enhancement, perfusion-CMR performed poorly for this purpose in our dataset (58% of patients with predominantly hypo-enhancing lesions on LGE were misclassified as thrombus based on CER and even 14% of patients with mixed or diffusely enhancing lesions on LGE were misclassified). In this context, it is important to recognize that when LGE-CMR demonstrates enhancement within a cardiac mass (which may be minimal in some cases), perfusion characteristics should not alter its diagnostic classification as neoplastic in etiology. Notably, our analyses also demonstrated that qualitative (visual) perfusion yielded slightly lower diagnostic accuracy for differentiating between CMET and CTHR to that of semi-quantitative perfusion (both of which were sub-optimal in relation to LGE-CMR). Semi-quantitative analysis provided added value for stratifying prognosis among patients with LGE defined CMET, whereas visual perfusion analysis lacked sufficient precision to stratify prognosis in relation to reader assigned strata of lesion vascularity. These data add to a growing body of literature highlighting the utility of semi-quantitative perfusion-CMR for myocardial perfusion and highlight the need for future research testing utility of fully quantitative tissue characterization CMR for prognostic assessment of cardiac masses.
Regarding mechanism, we speculate that perfusion-CMR evidenced enhancement within CMET reflects two phenomena - tumor-associated vascularity and increased capillary perfusion. The notion that vascular supply is intrinsic to tumorigenesis has been demonstrated on a cellular basis; tumor neovascularization has been shown to have increased capillary permeability.(21) Regarding prognosis, it is known that aggressive neoplastic cell proliferation can decouple from vascular supply such that tumor growth outstrips oxygen supply and intrinsic cell death (tumor necrosis) occurs: Necrotic cells release proinflammatory and tumor-promoting cytokines, which in turn recruit immune and inflammatory cells, thereby exerting tumor-promoting activity by inducing angiogenesis and proliferation.(22,23) This would be expected to manifest with decreased vascularity in poor prognosis tumors as was observed in our study. It is also possible that decreased tumor vascularity can impede drug delivery, resulting in therapeutic non-responsiveness as a mechanism for our observed association of hypoperfusion with mortality. Whereas the notion that impaired vascularity (tumor necrosis) is an adverse marker is consistent with established concepts in tumor biology,(24,25) we are unaware of any prior study in which this tenet has been used to stratify clinical risk for cancers involving the heart.
It should also be recognized that perfusion-CMR frequently yielded discordant results with LGE, and that it often misclassified low vascularity lesions deemed to be CMET based on the reference standard of LGE. Whereas perfusion-CMR typically misclassified lesions that were predominantly hypo-enhancing on LGE, discordances did occasionally occur in the context of mixed or diffusely enhancing CMET – with similar shortcomings when analysis was performed using CER and CUR (22% and 14% misclassification rate in relation to the reference of LGE, respectively). Additionally, our data demonstrated that the prognostic value of perfusion was complementary to that of LGE, as evidenced by mortality data showing that among patients with LGE classified CMET, prognosis was worse in those with decreased lesion vascularity on perfusion. While these findings might be taken to indicate shortcomings of a given pulse sequence, they could also be taken to support the notion that each provides distinct information regarding lesion vascularity: LGE provides a static window regarding contrast accumulation over a given interval, whereas perfusion provides a snapshot of dynamic contrast uptake during contrast infusion. It is also well known that regions of decreased vascularity can accumulate contrast over time, as evidenced by studies of post-MI microvascular obstruction, in which discordances between perfusion and LGE have been shown to be common(26) and microvascular obstruction size to decrease over time when imaged serially via LGE.(27) Given that 1) neoplasms can contain both vascular and avascular (tissue necrosis) components, and that 2) gadolinium can diffuse between vascular and avascular regions with time (i.e. the interval between contrast infusion and LGE acquisition) – first pass perfusion CMR-based assessment of dynamic contrast kinetics holds appeal as a means to complement LGE-based diagnostic differentiation by further characterizing magnitude of vascularity within LGE defined cardiac neoplasms. To our knowledge, this is the first study to test these physiologic concepts with respect to CMR assessment of cardiac masses.
Regarding significance, it is important to interpret our findings in context of literature indicating that CMET are greatly under-recognized in patients with advanced cancer – highlighting the need to refine screening and prognostic risk stratification as a rationale for this study. Pathology studies have reported cardiac metastases to occur in approximately 10–20% of patients with advanced cancer,(28–31) many of which were not diagnosed prior to autopsy. Regarding imaging, the notion that tissue characterization improves diagnostic and prognostic assessment of CMET is well-established, as evidenced by data from our group and others which have used the technique of LGE-CMR to demonstrate that presence of enhancement within lesions correlates with tumor vascularity and stratifies prognosis.(4–7,10) It is also known that vascularity of CMET can vary as can outcomes – the latter of which have markedly improved with advances in anticancer therapy. As evidence of this, whereas presence of CMET associated with increased mortality in our cohort, nearly 50% of all CMET patients were alive at 1 year follow-up: In this context, our finding that lesion hypo-enhancement on perfusion-CMR stratified mortality among patients with CMET is important to a growing cancer population for whom it extends risk stratification beyond anatomic assessment or binary tissue characterization based on presence or absence of enhancement.
Several limitations should be noted. First, our population encompassed an array of cancer types, thus prohibiting robust assessment of individual cancer types and modifiers. On the other hand, our study design matched patients with cardiac masses to controls with equivalent cancer etiology and extent. In this context, our finding that perfusion results paralleled LGE and refined risk stratification even among patients with CMET and matched controls adds to robustness of our results. Second, CMR methods used in the current study are applicable to lesions of sufficient size to perform reliable tissue characterization, and that our approach is not feasible in patients with highly mobile lesions. As evidence of this, 3% of patients with CMASS were excluded due to inadequate spatial coverage or prominent lesion mobility. These data highlight need for future research to test whether high spatial resolution and/or temporally accelerated CMR methods provide incremental utility for diagnostic and prognostic assessment of cardiac masses. It is also possible that lesions deemed to be CMET may have represented primary cardiac malignancies, given that uniform pathology was not available. While we believe this unlikely (in context of the detailed nature of clinical evaluations, active treatment for systemic cancers, and relative rarity of primary [compared to metastatic] cardiac malignancies), this possibility cannot be fully excluded. Finally, data was derived from a registry that did not include serial CMR to test whether perfusion characteristics are static or dynamic within an individual patient, whether perfusion (or LGE) predicts lesion growth, or whether anti-cancer treatment has modifying effects on lesion tissue characteristics. Whereas all patients with and without CMET had stage IV disease (matching was done based on systemic cancer etiology) and our results showed similar distribution of major cancer categories among perfusion tertiles, lack of longitudinal data in patients with uniform cancer type impeded our ability to fully test if some cancer patients have hypo-vascular metastases and poor survival, whereas others have more vascular metastases and better prognosis (i.e. vascularity is a static marker). Future studies are necessary to explore these issues.
In conclusion, this study adds to a growing body of literature demonstrating utility of CMR tissue characterization in patients with cardiac masses and provides new insights regarding additive prognostic value of perfusion. Larger-scale research is warranted to test whether perfusion-CMR predicts non-mortality related adverse outcomes or response to specific anti-cancer therapies in patients with CMET, towards the goal of tissue characterization imaging guided tailored therapy and improved clinical outcomes for advanced cancer patients.
Supplementary Material
A region of interest (ROI) was drawn over CMASS on perfusion images as shown in bottom image panel. The measured contrast signal intensity (SI) was plotted over time (t): (1) Contrast uptake rate (CUR) was calculated from the upslope of SI vs time. (2) Contrast enhancement ratio (CER) was calculated by normalizing plateau SI from baseline SI.
Perspectives: Core Clinical Competencies and Translational Implications
Competency in Medical Knowledge 1:
Contrast kinetics differ between vascular and avascular masses, as evidenced by higher upslope and peak enhancement for cardiac metastasis vs. thrombus as assessed using first pass perfusion-CMR.
Competency in Medical Knowledge 2:
While late gadolinium enhancement (LGE) CMR is superior to perfusion as a primary method to differentiate cardiac metastases from thrombus, mortality among patients with LGE evidenced cardiac metastases is heterogeneous and varies in relation to perfusion-CMR evidenced lesion hypoperfusion: Findings support utility of an integrated CMR tissue characterization algorithm for cardiac masses, in which initial diagnostic categorization of cardiac metastasis vs. thrombus is established by LGE and prognosis among patients with CMET is further stratified based on perfusion-CMR evidenced lesion hypo-vascularity.
Translational Outlook:
Future research is warranted to test whether perfusion-CMR predicts non-mortality related adverse outcomes or response to specific anti-cancer therapies in patients with cardiac metastases, towards the goal of tissue characterization imaging guided tailored therapy and improved clinical outcomes for advanced cancer patients.
Funding Sources:
NIH 1R01HL151686 (JWW); AHA18CDA34080090 & NYS DOH01-ROWLY6 2021– 00048 (ATC); MSK SKI Core Grant P30 CA008748
Abbreviations
- CER
Contrast enhancement ratio
- CMASS
Cardiac mass
- CMET
Cardiac metastasis
- CTHR
Cardiac thrombus
- CUR
Contrast uptake rate
- LGE
Late gadolinium enhancement
- LA
Left atrium
- LV
Left ventricle
- RA
Right atrium
- RV
Right ventricle
- SI
Signal intensity
- TI
Inversion time
Footnotes
Conflicts of Interest: Dr. Chan holds a secondary appointment in the Mount Sinai Department of Pharmacology for basic science research unrelated to this study. Dr. Weinsaft has received speaker fees from GE Healthcare for talks on cardiac MRI.
Publisher's Disclaimer: This is a PDF file of an unedited manuscript that has been accepted for publication. As a service to our customers we are providing this early version of the manuscript. The manuscript will undergo copyediting, typesetting, and review of the resulting proof before it is published in its final form. Please note that during the production process errors may be discovered which could affect the content, and all legal disclaimers that apply to the journal pertain.
References
- 1.Sung H, Ferlay J, Siegel RL et al. Global Cancer Statistics 2020: GLOBOCAN Estimates of Incidence and Mortality Worldwide for 36 Cancers in 185 Countries. CA Cancer J Clin 2021;71:209–249. [DOI] [PubMed] [Google Scholar]
- 2.Weinsaft JW, Kim HW, Shah DJ et al. Detection of left ventricular thrombus by delayed-enhancement cardiovascular magnetic resonance prevalence and markers in patients with systolic dysfunction. J Am Coll Cardiol 2008;52:148–57. [DOI] [PubMed] [Google Scholar]
- 3.Weinsaft JW, Kim HW, Crowley AL et al. LV thrombus detection by routine echocardiography: insights into performance characteristics using delayed enhancement CMR. JACC Cardiovasc Imaging 2011;4:702–12. [DOI] [PMC free article] [PubMed] [Google Scholar]
- 4.Chan AT, Dinsfriend W, Kim J et al. Risk stratification of cardiac metastases using late gadolinium enhancement cardiovascular magnetic resonance: prognostic impact of hypo-enhancement evidenced tumor avascularity. J Cardiovasc Magn Reson 2021;23:42. [DOI] [PMC free article] [PubMed] [Google Scholar]
- 5.Chan AT, Plodkowski AJ, Pun SC et al. Prognostic utility of differential tissue characterization of cardiac neoplasm and thrombus via late gadolinium enhancement cardiovascular magnetic resonance among patients with advanced systemic cancer. J Cardiovasc Magn Reson 2017;19:76. [DOI] [PMC free article] [PubMed] [Google Scholar]
- 6.Pun SC, Plodkowski A, Matasar MJ et al. Pattern and Prognostic Implications of Cardiac Metastases Among Patients With Advanced Systemic Cancer Assessed With Cardiac Magnetic Resonance Imaging. J Am Heart Assoc 2016;5. [DOI] [PMC free article] [PubMed] [Google Scholar]
- 7.Chan AT, Fox J, Perez Johnston R et al. Late Gadolinium Enhancement Cardiac Magnetic Resonance Tissue Characterization for Cancer-Associated Cardiac Masses: Metabolic and Prognostic Manifestations in Relation to Whole-Body Positron Emission Tomography. J Am Heart Assoc 2019;8:e011709. [DOI] [PMC free article] [PubMed] [Google Scholar]
- 8.Mousavi N, Cheezum MK, Aghayev A et al. Assessment of Cardiac Masses by Cardiac Magnetic Resonance Imaging: Histological Correlation and Clinical Outcomes. J Am Heart Assoc 2019;8:e007829. [DOI] [PMC free article] [PubMed] [Google Scholar]
- 9.Pazos-Lopez P, Pozo E, Siqueira ME et al. Value of CMR for the differential diagnosis of cardiac masses. JACC Cardiovasc Imaging 2014;7:896–905. [DOI] [PubMed] [Google Scholar]
- 10.Shenoy C, Grizzard JD, Shah DJ et al. Cardiovascular magnetic resonance imaging in suspected cardiac tumour: a multicentre outcomes study. Eur Heart J 2021;43:71–80. [DOI] [PMC free article] [PubMed] [Google Scholar]
- 11.Ling YH, Chen JW, Wen SH et al. Tumor necrosis as a poor prognostic predictor on postoperative survival of patients with solitary small hepatocellular carcinoma. BMC Cancer 2020;20:607. [DOI] [PMC free article] [PubMed] [Google Scholar]
- 12.Swinson DE, Jones JL, Richardson D, Cox G, Edwards JG, O’Byrne KJ. Tumour necrosis is an independent prognostic marker in non-small cell lung cancer: correlation with biological variables. Lung Cancer 2002;37:235–40. [DOI] [PubMed] [Google Scholar]
- 13.Langner C, Hutterer G, Chromecki T, Leibl S, Rehak P, Zigeuner R. Tumor Necrosis as Prognostic Indicator in Transitional Cell Carcinoma of the Upper Urinary Tract. Journal of Urology 2006;176:910–914. [DOI] [PubMed] [Google Scholar]
- 14.Hsu LY, Groves DW, Aletras AH, Kellman P, Arai AE. A quantitative pixel-wise measurement of myocardial blood flow by contrast-enhanced first-pass CMR perfusion imaging: microsphere validation in dogs and feasibility study in humans. JACC Cardiovasc Imaging 2012;5:154–66. [DOI] [PMC free article] [PubMed] [Google Scholar]
- 15.Leiner T, Bogaert J, Friedrich MG et al. SCMR Position Paper (2020) on clinical indications for cardiovascular magnetic resonance. J Cardiovasc Magn Reson 2020;22:76. [DOI] [PMC free article] [PubMed] [Google Scholar]
- 16.Hundley WG, Bluemke DA, Finn JP et al. ACCF/ACR/AHA/NASCI/SCMR 2010 expert consensus document on cardiovascular magnetic resonance: a report of the American College of Cardiology Foundation Task Force on Expert Consensus Documents. J Am Coll Cardiol 2010;55:2614–62. [DOI] [PMC free article] [PubMed] [Google Scholar]
- 17.Weinsaft JW, Kim RJ, Ross M et al. Contrast-enhanced anatomic imaging as compared to contrast-enhanced tissue characterization for detection of left ventricular thrombus. JACC Cardiovasc Imaging 2009;2:969–79. [DOI] [PMC free article] [PubMed] [Google Scholar]
- 18.Srichai MB, Junor C, Rodriguez LL et al. Clinical, imaging, and pathological characteristics of left ventricular thrombus: a comparison of contrast-enhanced magnetic resonance imaging, transthoracic echocardiography, and transesophageal echocardiography with surgical or pathological validation. American heart journal 2006;152:75–84. [DOI] [PubMed] [Google Scholar]
- 19.Janik M, Cham MD, Ross MI et al. Effects of papillary muscles and trabeculae on left ventricular quantification: increased impact of methodological variability in patients with left ventricular hypertrophy. J Hypertens 2008;26:1677–85. [DOI] [PubMed] [Google Scholar]
- 20.Kim J, Srinivasan A, Seoane T et al. Echocardiographic Linear Dimensions for Assessment of Right Ventricular Chamber Volume as Demonstrated by Cardiac Magnetic Resonance. J Am Soc Echocardiogr 2016;29:861–70. [DOI] [PMC free article] [PubMed] [Google Scholar]
- 21.Folkman J Role of angiogenesis in tumor growth and metastasis. Semin Oncol 2002;29:15–8. [DOI] [PubMed] [Google Scholar]
- 22.Vakkila J, Lotze MT. Inflammation and necrosis promote tumour growth. Nat Rev Immunol 2004;4:641–8. [DOI] [PubMed] [Google Scholar]
- 23.Lee SY, Ju MK, Jeon HM et al. Regulation of Tumor Progression by Programmed Necrosis. Oxid Med Cell Longev 2018;2018:3537471. [DOI] [PMC free article] [PubMed] [Google Scholar]
- 24.Beddy P, Genega EM, Ngo L et al. Tumor necrosis on magnetic resonance imaging correlates with aggressive histology and disease progression in clear cell renal cell carcinoma. Clin Genitourin Cancer 2014;12:55–62. [DOI] [PMC free article] [PubMed] [Google Scholar]
- 25.Buadu LD, Murakami J, Murayama S et al. Breast lesions: correlation of contrast medium enhancement patterns on MR images with histopathologic findings and tumor angiogenesis. Radiology 1996;200:639–49. [DOI] [PubMed] [Google Scholar]
- 26.Mather AN, Lockie T, Nagel E et al. Appearance of microvascular obstruction on high resolution first-pass perfusion, early and late gadolinium enhancement CMR in patients with acute myocardial infarction. J Cardiovasc Magn Reson 2009;11:33. [DOI] [PMC free article] [PubMed] [Google Scholar]
- 27.Smulders MW, Van Assche LMR, Bekkers S et al. Epicardial Surface Area of Infarction: A Stable Surrogate of Microvascular Obstruction in Acute Myocardial Infarction. Circ Cardiovasc Imaging 2021;14:e010918. [DOI] [PubMed] [Google Scholar]
- 28.Bussani R, De-Giorgio F, Abbate A, Silvestri F. Cardiac metastases. J Clin Pathol 2007;60:27–34. [DOI] [PMC free article] [PubMed] [Google Scholar]
- 29.Hanfling SM. Metastatic cancer to the heart. Review of the literature and report of 127 cases. Circulation 1960;22:474–83. [DOI] [PubMed] [Google Scholar]
- 30.Mukai K, Shinkai T, Tominaga K, Shimosato Y. The incidence of secondary tumors of the heart and pericardium: a 10-year study. Jpn J Clin Oncol 1988;18:195–201. [PubMed] [Google Scholar]
- 31.Abraham KP, Reddy V, Gattuso P. Neoplasms metastatic to the heart: review of 3314 consecutive autopsies. Am J Cardiovasc Pathol 1990;3:195–8. [PubMed] [Google Scholar]
Associated Data
This section collects any data citations, data availability statements, or supplementary materials included in this article.
Supplementary Materials
A region of interest (ROI) was drawn over CMASS on perfusion images as shown in bottom image panel. The measured contrast signal intensity (SI) was plotted over time (t): (1) Contrast uptake rate (CUR) was calculated from the upslope of SI vs time. (2) Contrast enhancement ratio (CER) was calculated by normalizing plateau SI from baseline SI.