

Abstract
PURPOSE:
Genome sequencing (GS)-specific diagnostic rates in prospective tightly ascertained exome sequencing (ES)-negative intellectual disability (ID) cohorts have not been reported extensively.
METHODS:
ES, GS, epigenetic signatures, and long-read sequencing diagnoses were assessed in 74 trios with at least moderate ID.
RESULTS:
The ES diagnostic yield was 42/74 (57%). GS diagnoses were made in 9/32 (28%) ES-unresolved families. Repeated ES with a contemporary pipeline on the GS-diagnosed families identified 8/9 SNVs/CNVs undetected in older ES, confirming a GS-unique diagnostic rate of 1/32 (3%). Episignatures contributed diagnostic information in 9% with GS-corroboration in 1/32 (3%) and diagnostic clues in 2/32 (6%). A genetic aetiology for ID was detected in 51/74 (69%) families. 12 candidate disease genes were identified. Contemporary ES followed by GS cost US$4,976 (95% CI: $3,704; $6,969) per diagnosis and first-line GS at a cost of $7,062 (95% CI: $6,210; $8,475) per diagnosis.
CONCLUSION:
Performing GS only in ID trios would be cost equivalent to ES if GS were available at $2,435, about a 60% reduction from current prices. This study demonstrates that first-line GS achieves higher diagnostic rate than contemporary ES but at a higher cost.
Keywords: intellectual disability, exome-negative, genome sequencing, episignature, long read sequencing, health economics
INTRODUCTION
Intellectual disability (ID) affects 3% of the population, of which 15% are moderate to severe and enriched for Mendelian aetiologies.1 Despite significant molecular diagnostic improvements, approximately half of the individuals with ID remain undiagnosed after exome sequencing (ES).2 Genome sequencing (GS) increases coding region coverage consistency, has improved detection sensitivity for structural variants (SVs) including copy number variants (CNVs) and tandem repeat expansions (TREs) and facilitates the detection of noncoding and mitochondrial variation.3 Short-read sequencing (SRS) trio GS as a first-tier stand-alone test has been proposed to maximize diagnoses in Mendelian disorders when cost is not a consideration.4
Diagnostic testing costs from published and commercial sources range from US$3,825 - $9,304 (trio ES)5 and US$4,963 - $15,000 (trio GS).6 Despite the large resources required for the care of people with ID, there is currently limited health economic evidence to support ES versus GS. Studies that evaluate diagnostic rates, costs, sensitivity and cost-effectiveness of these tests are integral to their implementation into clinical practice.5 These were therefore assessed in this prospective, tightly ascertained, moderate to severe ID cohort using ES, GS, episignatures and long-read sequencing (LRS). Contemporary ES was repeated on families diagnosed by GS where the original ES was reported as uninformative to investigate the current diagnostic potential for ID unique to GS. A cost for GS trios as a first-line test was also estimated based on the incremental diagnostic rate of GS over contemporary ES in ID from this study.
MATERIALS AND METHODS
Cohort ascertainment
Seventy-four trios (proband and unaffected parents) were recruited to this study (Figure 1) funded through Australian Genomics, the Center for Mendelian Genomics (Broad CMG), and New South Wales Statewide Genomic Service. Families were referred from Australian hospitals to the New South Wales Health Pathology Randwick Genomics (RG) and Victorian Clinical Genetics Services (VCGS) laboratories. Probands with moderate or severe ID, non-contributory microarrays and FMR1 molecular testing were included. Individuals with autism spectrum disorder or prior ES were excluded. All individuals had genetic counselling, and their parents/guardians consented for diagnostic ES and research GS. The study was approved by HREC/16/MH/251.
Figure 1. ID Flagship study.
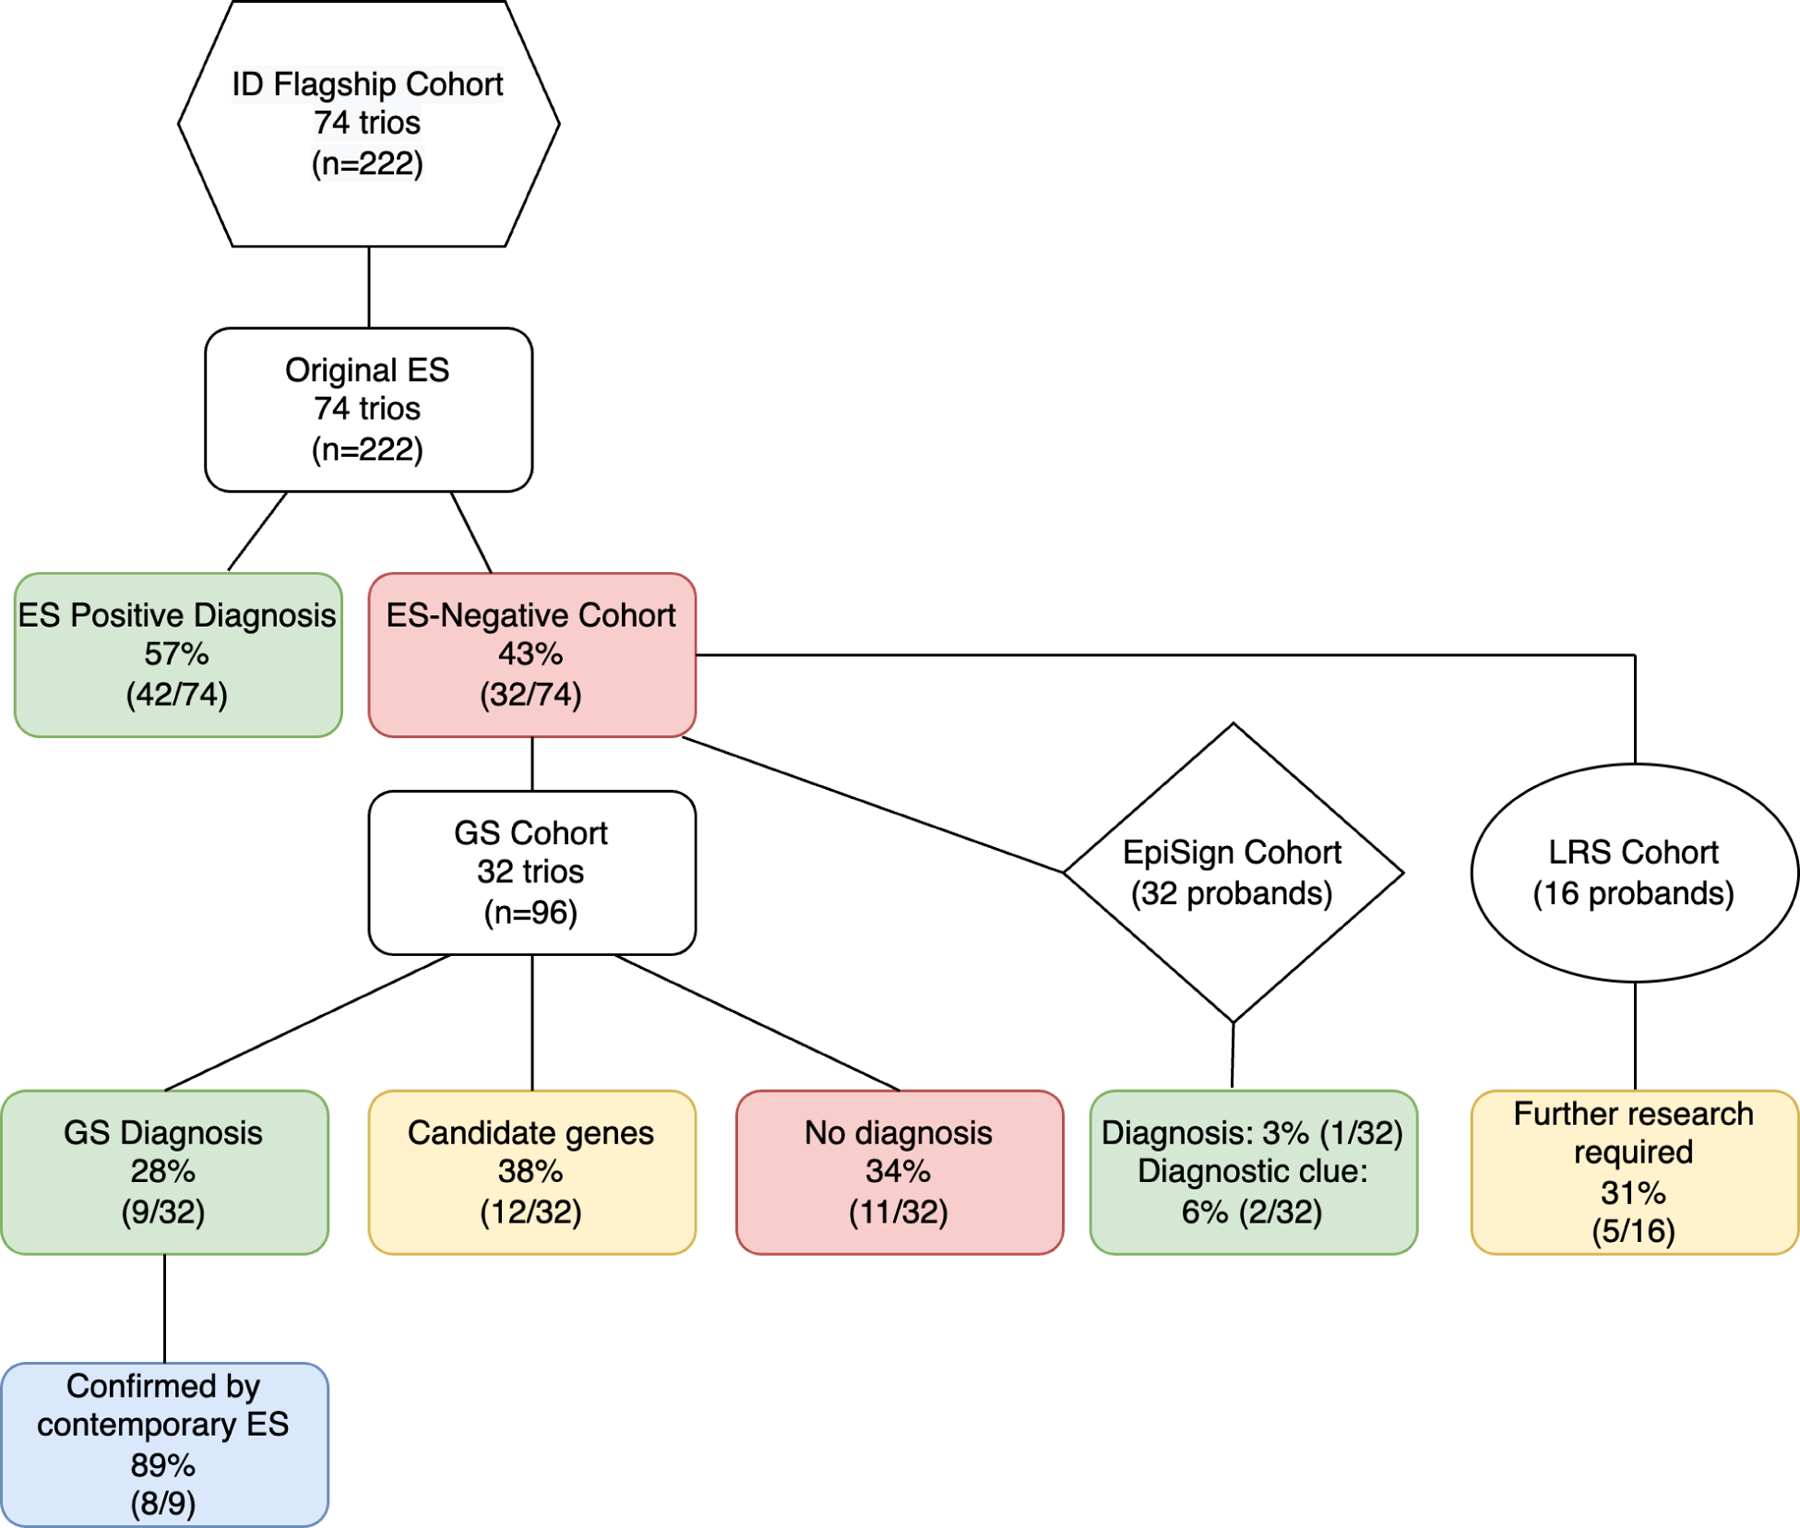
74 trios with molecularly undiagnosed ID investigated using ES (74 trios), GS (32 trios), EpiSign (32 probands) and LRS (16 probands). The overall ES/GS diagnostic yield is 69% (51/74) with 31% (23/74) unresolved. ID, intellectual disability; ES, exome sequencing, GS, genome sequencing; LRS, long read sequencing.
ES analysis
For original ES, DNA analyzed at RG was extracted from peripheral blood samples and libraries using the Ion AmpliSeq Exome RDY kit (Thermo Fisher Scientific, Waltham, USA), sequence on the Ion PI chip kit (v3) and analyzed on a Life Technologies Proton instrument. Reads were aligned to human genome build hg19/GRCh37, SNVs and indels were identified using TorrentSuite v5.10.1 software and analyzed as reported previously.7 The Agilent SureSelect QXT CREv2 kit (Agilent Technologies, Santa Clara, USA) was at VCGS for library preparation, sequenced on an Illumina NextSeq500 (Illumina, San Diego, USA) and variants were analyzed using the Illumina DRAGEN Bio-IT Platform after alignment to hg19/GRCh37. The original ES analyses did not include CNV pipelines. Contemporary ES analysis was performed on selected families at RG to determine GS-unique diagnoses, using library building Exome 2.0 kits (Twist Bioscience, San Francisco, USA) with sequencing on an Illumina NovaSeq 6000 (Illumina, San Diego, USA), mapped to hg38/GRCh38 and analyzed using the Illumina DRAGEN Bio-IT Platform. SNVs, and indels were classified as previously reported,8 utilizing the American College of Medical Genetics and Genomics and the Association for Molecular Pathology (ACMG-AMP) guidelines with modifications and incorporating aspects of the scoring system reported by Karbassi et al.9 Genomic variants were filtered in the GAIA pipeline8 at RG. A commercial genomic analysis pipeline, Alissa Clinical Informatics Platform (Agilent Technologies, Santa Clara, USA), was used for genomic analysis at VCGS. Potential CNVs were identified using DECoN,10 XHMM,11 the Illumina DRAGEN Bio-IT Platform at RG and an internal CNV detection tool CxGo12 at VCGS.
GS analysis
GS was performed on ES-negative families at the Broad CMG. DNA libraries were prepared using the PCR-free KAPA Hyper Prep kit without amplification module (KK8505; KAPA Biosystems, Wilmington, USA) with palindromic forked adaptors (Roche, Basel, Switzerland) and run on the NovaSeq 6000 (Illumina, San Diego, CA, USA). Reads were mapped to hg38/GRCh38 using BWA aligner and analyzed using the Genome Analysis Toolkit (GATK) HaplotypeCaller package (v4.0). GS data were analyzed at RG using GAIA, aligned to GRCh38. SV, CNV and the mitochondrial genome were analyzed by a number of different platforms in the study laboratories (See Supplementary Methods). GS data were analyzed by the Broad CMG using the open-source genomic analysis platform seqr.13 Clinical phenotypes correlated with gene names were used in PubMed searches (https://pubmed.ncbi.nlm.nih.gov/). Diagnostic outcomes were assessed based on ACMG-AMP criteria. Candidate research genes were deposited into Matchmaker Exchange through seqr13 or GeneMatcher.14
Episignature analysis
Episignature analysis was conducted on ES-negative families with available DNA using EpiSign, a genome-wide DNA methylation test. DNA was extracted from peripheral blood and processed using the Illumina Infinium EPIC bead chip array (Illumina, San Diego, USA) as described previously.15 Data were analyzed using EpiSign (V3) at the Molecular Diagnostics Laboratory, London Health Sciences Centre, Western University, London, Canada.16
Long read sequencing analysis
DNA was subject to LRS using Oxford Nanopore Technologies (ONT) at the Garvan Institute Sequencing Platform. Libraries were prepared from high molecular weight DNA using native ligation-based library kit (SQK-LSK110) and sequenced on PromethION R9.4.1 flowcells at one sample per flowcell. ONT sequencing data were converted from FAST5 to BLOW5 format17 using slow5tools (v0.3.0).18 Data were base called using Guppy. Targeted genotyping was performed on 48 STR sites associated with neurological disease19 using a local haplotype aware ONT read assembly spanning each STR site, annotating STR size, motif and other summary statistics using Tandem Repeats Finder (4.09) followed by manual inspection and motif counting.19
Health economic analysis
Health economic analysis were undertaken from the health care funder perspective at the time of diagnosis to evaluate the cost-effectiveness of performing GS over ES under three different models: i) performing GS on ES-negative families ii) GS-unique diagnoses after contemporary ES iii) performing GS on all families as a first line test. Laboratory costs for ES and GS were sourced from RG and VCGS. These were fixed costs at publicly reimbursement rates in Australia and thus have no uncertainty in the unit costs. All costs are Australian prices unless otherwise stated and are converted to US dollars, based on the exchange rate of AU$ 1 = US$ 0.6577 of 1st June 2023 (https://www.xe.com/currencytables/). Unit costs are listed in Table S1. The cost-effectiveness of GS relative to ES or contemporary ES was analyzed for the incremental cost per additional diagnosis under three diagnostic pathways with uncertainty assessed using a bootstrapping method. This generated 1000 replicated datasets, randomly drawn with replacement. Incremental costs per additional diagnosis were estimated for each dataset, and a 95% confidence interval was estimated as an uncertainty related to incremental cost from the distribution of incremental cost based on the percentile method. The price reduction of GS was estimated such that it produced the same cost per diagnosis as contemporary ES in ID. As our study was performed to cost the diagnostic rate of different technologies, the base results included the costs that were within the scope of laboratory testing including sample collection, sequencing and data analysis but not including the costs of clinical review. A sensitivity analysis was conducted assuming two clinical geneticist / genetic counsellor visits one at the beginning and one at follow up.
RESULTS
Clinical characteristics of the cohort
This cohort included 74 probands (41 male, 33 female) with a median age of 15 years (6–43 years). ID severity was determined by developmental assessments as moderate (35), severe (37) and profound (2). Non-familial facial features were present in 19/74 (26%), 12/74 (16%) had microcephaly and 10/74 (13%) had seizures (Supplementary Table S2).
ES diagnostic yield
Trio ES analysis was performed in 74 families. Pathogenic or likely pathogenic variants were identified in 42 out of 74 families (57%). These diagnoses included 32 SNVs and 10 indels (Table S3). No diagnosis was obtained in 43% (32/74).
GS diagnostic yield compared to original ES
The ES-negative cases (n=96; 32 families) had trio GS at the Broad CMG to investigate the GS-specific diagnostic rate. This analysis resulted in an additional diagnosis for 9 families (9/74; 12%), which included three SNVs, one indel and five CNVs (Figure S1; Table 1 and S4). Mitochondrial variant, promoter and TRE analyses did not detect any additional diagnoses. Twelve candidate genes were implicated in ID (Table S5). Additional evidence of pathogenicity through collaborative studies facilitated through Matchmaker Exchange via seqr13 or GeneMatcher14 resulted in two families (3%) with possible diagnoses. Twenty-three families (31%) remained undiagnosed after GS testing.
Table 1.
Genome sequencing, episignature and long read sequencing findings in ID Flagship cohort
| Proband | GS Gene (HGNC ID) | HGVS Nomenclature | GS ACMG Criteria | GS ACMG Interpretation | Episig nature | LRS | |
|---|---|---|---|---|---|---|---|
| 43 | NR2F1(7975) | NC_000005.10:g.93585289G>A |
NC_000005.10(NM_005654.6):c.266G>A NP_005645.1:p.(Cys89Tyr) |
PS2, PM1, PM2, PP3 | LP | ND | NT |
| 44 | MED13L (22962) | NC_000012.12:g.115991285_116027907dup |
NC_000012.12(NM_015335.5):c.480–5305_3670dup NP_056150.1:p.(Ser1224Asnfs*8) |
PVS1, PS2 | P | BWS | ND |
| 45 | XRN1 (30654) (research) | NC_000003.12:g.142425225G>T |
NC_000003.12(NM_001282857.2):c.624C>A XP_016862130.1:p.(Asp208Glu) |
NA | NA | ND | ND |
| 46 | SF3B1 (10768) (research) | NC_000002.12:g.197402101T>G |
NC_000002.12(NM_012433.4):c.2107A>C NP_036565.2:p.(Thr703Pro) |
NA | NA | ND | ND |
| 47 | YARS1 (12840) | NC_000001.11:g.32779421_32779423del |
NC_000001.11(NM_003680.4):c.1438_1440del NP_003671.1:p.(Glu480del) |
PS2, PM4 | LP | ND | ND |
| NC_000001.11:g.32787071G>A |
NC_000001.11(NM_003680.4):c.689C>T NP_003671.1:p.(Ser230Phe) |
PS2, PM2, PP3 | |||||
| 48 | ND | ND | |||||
| 49 | UBR5 (16806) (research) | NC_000008.11:g.102288189C>A |
NC_000008.11(NM_015902.6):c.4791G>T NP_056986.2:p.(Glu1597Asp) |
NA | NA | ND | ND |
| 50 | DYRK1A (3091) | NC_000021.9:g.37512175A>G |
NC_000021.9(NM_001347721.2):c.1909A>G NP_001334650.1:p.(Met637Val) |
PS2, PP2, BS2 | VUS | ND | ND |
| POLR3B (30348) | NC_000012.12:g.106433856G>A |
NC_000012.12(NM_018082.6):c.1765G>A NP_060552.4:p.(Gly589Arg) |
PS2, PM1, PM2, PP2, PP3 | LP (no second allele) | |||
| 51 | ND | ND | |||||
| 52 | ND | ND | |||||
| 53 | ND | ND | |||||
| 54 | SCN2A (10588) | NC_000002.12:g.165312617_165332618del |
NC_000002.12(NM_001371246.1): c.1034+529_2388+1050del NP_001358175.1:p.(Gln346Serfs*14) |
PVS1, PS2, PM2 | P | ND | ND |
| 55 | POGZ (18801) | NC_000001.11:g.151405203del |
NC_000001.11(NM_015100.4):c.3837del NP_055915.2:p.(Lys1279Asnfs*31) |
PVS1, PS2, PM2 | P | ND | Not analyzed due to low coverage |
| 56 | CELF2 (2550) (research) | NC_000010.11:g.11165632A>G |
NC_000010.11(NM_001326342.2):c.221A>G NP_001313271.1:p.(Tyr74Cys) |
PS2, PM2 | Research originally, now publisheda | ND | ND |
| 57 | ND | ND | |||||
| 58 | UPF3B (20439) | NC_000023.11:g.119808858_119816662del |
NC_000023.11(NM_080632.3):c.*18216_*26020del NP_542199.1:p.(?) |
PVS1 PM4 | LP | ND | Not analyzed due to low coverage |
| 59 | ND | NT | |||||
| 60 | ND | NT | |||||
| 61 | MCM6 (6949) (research) | NC_000002.12:g.135868621T>C |
NC_000002.12(NM_005915.6):c.605A>G NP_005906.2:p.(Asp202Gly) |
NA | Research originally, now publishedb | NT | NT |
| 62 | EHMT1 (24650) | NC_000009.12:g.137699442_137754877dup |
NC_000009.12(NM_024757.5): c.22–11525_1369+586dup NP_079033.4:p.(?) |
PVS1, PS2 | P | Kleefstra | NT |
| 63 | KANSL3 (25473) (research) | NC_000002.12:g.96609039C>A |
NC_000002.12(NM_001115016.3):c.1409G>T NP_001108488.1:p.(Gly470Val) |
NA | NA | ND | ND |
| KANSL3 (25473) (research) | NC_000002.12:g.96613488T>C |
NC_000002.12(NM_001115016.3):c.795A>G NP_001108488.1:p.(Pro265=) |
NA | NA | |||
| FBP2 (3607) (research) | NC_000009.12:g.94593659C>T |
NC_000009.12(NM_003837.4):c.68G>A NP_003828.2:p.(Arg23His) |
NA | Research originally, now publishedc | |||
| 64 | ND | NT | |||||
| 65 | ND | NT | |||||
| 66 | ND | NT | |||||
| 67 | PPP2R5C (9311) (research) | NC_000014.9:g.101882257T>C |
NC_000014.9(NM_001352913.2):c.556T>C NP_001339842.1:p.(Trp186Arg) |
NA | NA | ND | NT |
| 68 | ZBTB34 (31446) (research) | NC_000009.12:g.126879889_126879890del |
NC_000009.12(NM_001099270.4):c.490_491del NP_001092740.2:p.(Pro164Serfs*19) |
NA | NA | ND | NT |
| NFE2L3 (7783) (research) | NC_000007.14:g.26152577del |
NC_000007.14(NM_004289.7):c.79del NP_004280.5:p.(Arg27Alafs*2) |
NA | NA | |||
| NFE2L3 (7783) (research) | NC_000007.14:g.26152931G>T |
NC_000007.14(NM_004289.7):c.433G>T NP_004280.5:p.(Gly145Cys) |
NA | NA | |||
| 69 | UPD7p at /MRXSCJ | NT | |||||
| 70 | SHANK2 (14295) / near CREB3L1 (18856) | NC_000011.10:g.46301244_70530165inv |
NC_000011.10(NM_012309.5): c.2062–27234_*24171625inv NP_036441.2:p.(?) |
PVS1, PS2 | P | ND | NT |
| 71 | ND | NT | |||||
| 72 | ARFGEF3 (21213) (research) | NC_000006.12:g.138298628_138298629del |
NC_000006.12(NM_020340.5):c.3671_3672del NP_065073.3:p.(His1224Argfs*11) |
NA | NA | ND | NT |
| 73 | ND | NT | |||||
| 74 | MAP2K4 (6844) (research) | NC_000017.11:g.12129194A>T |
NC_000017.11(NM_003010.4):c.947A>T NP_003001.1:p.(Gln316Leu) |
NA | NA | ND | NT |
GS, genome sequencing; LRS, long read sequencing; ID, intellectual disability; ACMG, American College of Medical Genetics; LP, likely pathogenic; P, pathogenic; NA, not applicable; ND, not detected; NT, not tested; dup, duplication; del, deletion; inv, inversion.
Itai et al.38
Smits et al.39
Gizak et al.40
GS-unique diagnostic yield compared to repeated contemporary ES
Contemporary ES re-analysis including CNV detection was performed at RG to determine the GS-unique diagnostic rate for ID. Three cases with SNVs and five cases with one indel and four CNVs detected by GS were also detected by contemporary ES analysis (Figure S2, Table S6). Compound heterozygous YARS1 variants detected in proband 47 in GS were present in prior ES data but were discarded as the only phenotype in OMIM at the time was Charcot-Marie-Tooth syndrome without correlation to neurocognitive disease. A de novo heterozygous SNV in NR2F1 in proband 43 and a de novo heterozygous indel in POGZ in proband 55 were both present in prior ES data, but they were assessed previously as false positives. A de novo heterozygous variant in CELF2 predicted to result in a missense change was identified by GS and contemporary ES in proband 56 but was not a known Mendelian gene at the time of the original ES. All variants were absent from gnomAD and had in silico scores supportive of pathogenicity. Likewise, four of the five CNVs detected by GS and not detected in the original ES were also detected by contemporary ES using CNV callers. These included a de novo heterozygous partial MED13L 26.6 kb out of frame tandem duplication (NM_015335.5, exons 5 – 16 of 31) in proband 44, a paternal mosaic heterozygous partial deletion of SCN2A in proband 54, a maternally inherited hemizygous UPF3B deletion in proband 58 and a de novo heterozygous EHMT1 partial duplication in proband 62.
GS-unique diagnoses not detected with contemporary ES analysis
One of the five GS-detected CNVs or SVs were not detected by contemporary ES. A large 24Mb de novo heterozygous copy-neutral chromosome 11 pericentric inversion, with break points in intronic regions of SHANK2 and CREB3L1 was detected in proband 70. A subsequent karyotype confirmed the inversion. With known de novo pathogenic loss-of-function variants, the SHANK2 breakpoint is likely to invert exons, resulting in truncation with nonsense mediated decay and loss of protein function. A deletion partially spanning exon 8 and a partial intronic region of ANK3 in an isoform expressed in the brain (NM_020987.5) was detected in proband 73 with the RG GS pipeline, but not with the Broad CMG GS pipeline, contemporary ES pipeline (RG) or ES CxGo (VCGS). This variant was subsequently assessed as a false positive. This brings the total GS-unique diagnoses down from nine (12%) to one (3%) after contemporary ES analysis.
Genome-wide episignature results
Episignatures were investigated in 32 ES-negative probands where DNA was available. The outcomes were a diagnosis in one family and unresolved findings in two families (Table S7). This resulted in a minimum diagnostic yield of 3% and a maximum yield considering all abnormal episignatures of 9%. An EHMT1/Kleefstra syndrome (MIM 610253) episignature was detected in proband 62 and correlated with a GS CNV finding of a partial EHMT1 duplication (Figure 2A). This CNV was also detected through a contemporary ES pipeline with CNV analysis using CxGo. A high confidence episignature interpreted as mosaic Beckwith-Wiedemann syndrome (BWS) (MIM 130650) IC2 on chromosome 11 was detected in proband 44, where a de novo MED13L duplication on chromosome 12 was also identified on GS CNV analysis (Figure 2B). This CNV was assessed as the diagnosis. There is currently no episignature for MED13L, and it is unknown whether the mosaic IC2 episignature may be related to the MED13L event. There were no clinical features consistent with BWS present. An inconclusive episignature for KDM5C was detected in proband 69 (Figure S3A), as well as a likely mosaic uniparental disomy of the paternal chromosome 7 for MEST, SVOPL and HTR5A (hemi-methylation observed at GRB10 and PEG10 regions on chromosome 7 (Figure S3B). A prior SNP array did not detect a mosaic isodisomy in this patient and no rare variants in KDM5C were identified.
Figure 2. Concordance between GS and episignature findings.
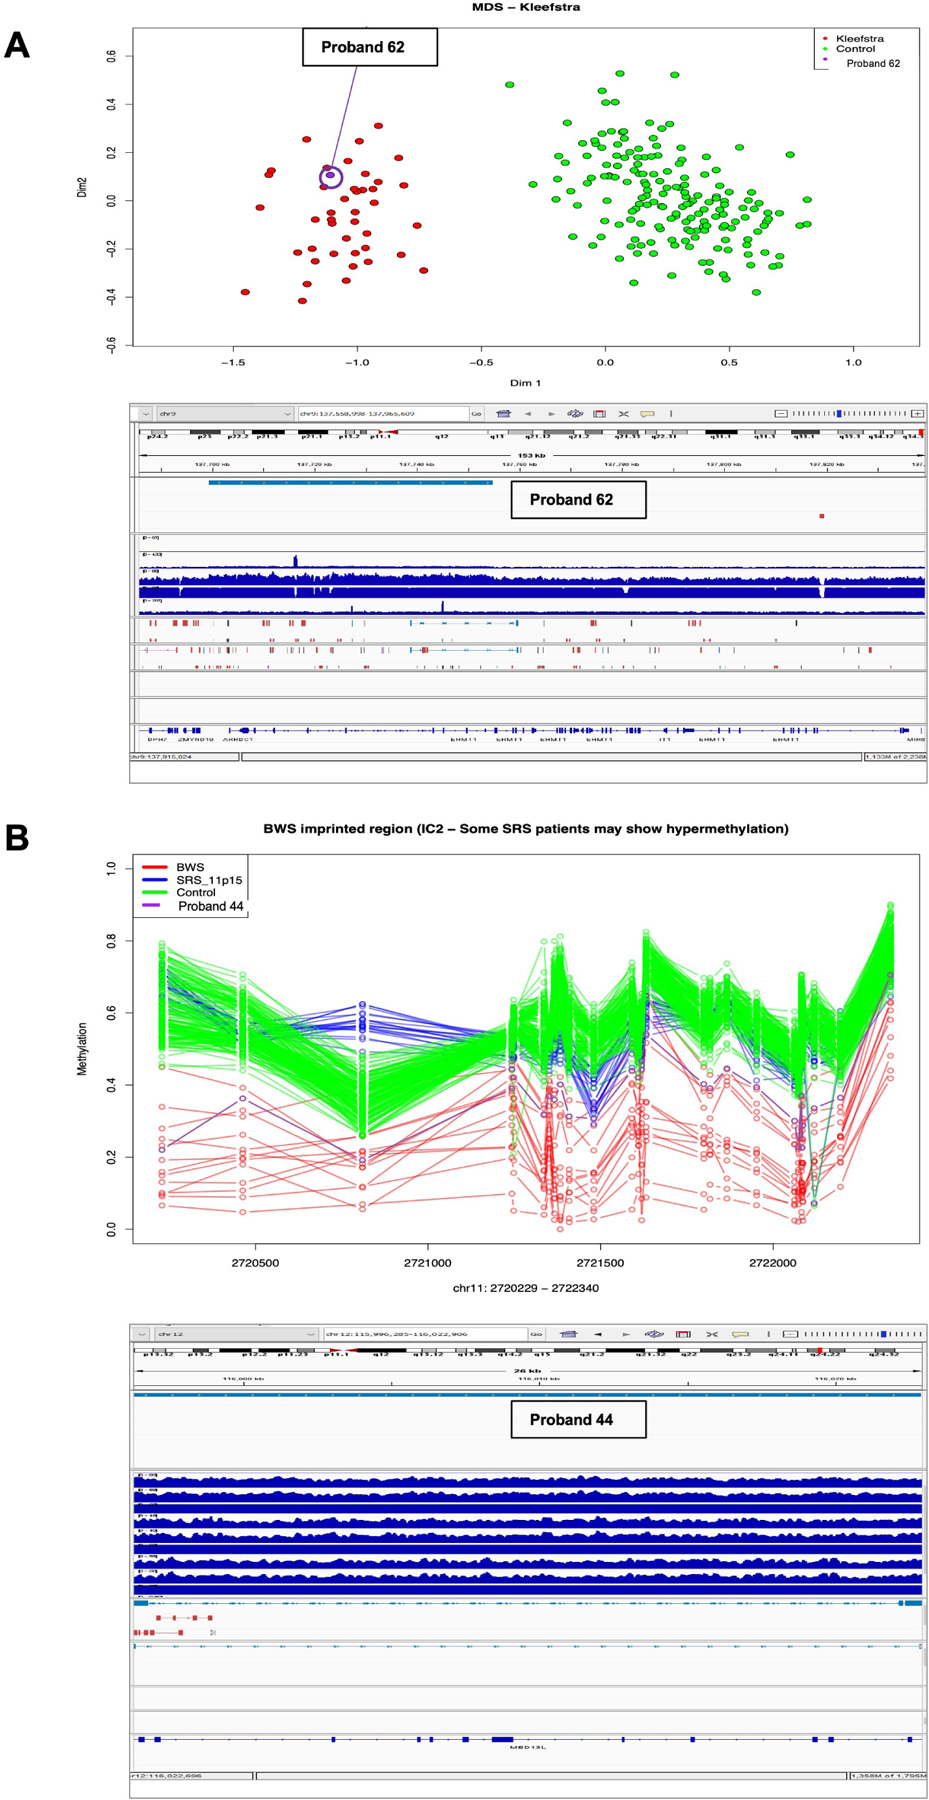
A. A Kleefstra syndrome episignature in proband 62 was concordant to the finding of a duplication in EHMT1 using GS. B. A Beckwith-Weidemann syndrome with IC2 episignature in proband 44 and detection of a de novo heterozygous partial out of frame tandem duplication (NM_015335.5, exons 5 – 16 of 31) of MED13L using GS might be related by a yet unknown mechanism.
Long read sequencing results
STR analysis of 48 genes on LRS data from 16 probands, where DNA was available, identified no pathogenic TREs but five probands with variants of potential interest were identified (Table S7). An approximate 275-repeat intronic STARD7 non-reference motif expansion, TTCAG/AACTG, also present in the general population (gnomAD [v3.1.2.]), was identified in proband 49. This expansion was confirmed to be paternally inherited and is likely benign for an ID phenotype. A different intronic STARD7 ATTTC pentamer repeat expansion has been reported in Familial Adult Myoclonic Epilepsy.20
Health economic analyses results
Cost effectiveness analysis provided information on the health and cost impacts of trio GS compared to the current standard of care test, trio ES. The average cost per family under the original ES pathway was estimated at $1,851. Performing GS on 32 original ES negative families increased the average cost per family to $3,956, with a further 9 families being diagnosed (a total of 51 families diagnosed). Had contemporary ES been performed at the beginning of the study, 50 out of 74 families would have been diagnosed by ES. Performing GS on the contemporary ES negative families, therefore, yielded one additional GS-unique diagnosis. Using GS as a first-line test resulted in an average cost of $4,867 per family, with 51 out of 74 families being diagnosed.
The incremental cost per additional genetic diagnosis using GS on the original ES-negative families was estimated at $17,305 (95% CI: $11,125; $40,153). The incremental cost per additional genetic diagnosis using GS on contemporary ES-negative families was estimated at $116,808 (95% CI: $37,314; Dominated (i.e., higher cost but no additional diagnosis)). GS as a first line test had an incremental cost of $223,184 (95% CI: $74,395; Dominated) per additional genetic diagnosis compared to contemporary ES as a first line test. Performing GS on contemporary ES-negative families was less costly compared to performing GS as a first-line test, with the contemporary ES followed by GS pathway costing $4,976 (95% CI: $3,704; $6,969) per diagnosis and first-line GS costing $7,062 (95% CI: $6,210; $8,475) per diagnosis (Table 2). Cost-effectiveness acceptability curves were calculated for a range of willingness-to-pay threshold cost for each additional genetic diagnosis using GS (Figure S4). Since there was only one additional diagnosis for GS in our cohort, the cost-effectiveness acceptability curves show that for a willingness-to-pay threshold of additional $150,000 for each additional diagnosis, there was a 62% probability that GS would be cost-effective if it was performed on contemporary ES-negative families and about 26% if it was performed as a first line test.
Table 2.
Comparisons of average cost, average cost per diagnosis and incremental cost per additional diagnosis under different diagnostic pathways
| Compared to Original ES | Compared to Contemporary ES | |||||
|---|---|---|---|---|---|---|
| Original ES | Original ES followed by GS | GS (as a first line test) | Contemporary ES | Contemporary ES followed by GS | GS (as a first line test) | |
| Total number of diagnosis | 42 | 51 | 51 | 50 | 51 | 51 |
| Average cost per family | 1,851 | 3,956 | 4,867 | 1,851 | 3,429 | 4,867 |
| Average cost per diagnosis (95% CI) | 3,261 | 5,740 | 7,062 | 2,739 | 4,976 | 7,062 |
| (2,796; 4,029) | (4,459; 7,680) | (6,210; 8,475) | (2,362; 3,301) | (3,704; 6,969) | (6,210; 8,475) | |
| Incremental cost per additional diagnosis (95% CI) | Reference diagnostic pathway | 17,305 | 24,798 | Reference diagnostic pathway | 116,808 | 223,184 |
| (11,125; 40,153) | (14,879; 55,796) | (37,314; Dominated) | (74,395; Dominated) | |||
ES, exome sequencing; GS, genome sequencing; CI, confidence interval; Dominated, higher cost but no additional diagnosis
Based on Australian costs ($1,851 for ES and $4,867 for GS), the cost of GS trios would need to be reduced by 61.2% (95% uncertainty range: 59.4–61.9%) to be cost equivalent to contemporary ES trios on a cost per diagnosis basis if all families have GS as a first line test. If GS is to be performed only on contemporary ES-negative families (the contemporary ES followed by GS pathway), the cost of GS trios would need to be reduced by 43.7% (95% uncertainty range: 32.2 – 51.4%) for it to be cost equivalent. Based on costs more reflective of those in the US ($2,393 for ES and $6,598 for GS), the approximate cost of GS of $2,435 would be cost equivalent to contemporary ES on a cost per diagnosis basis. This would represent a reduction in the cost of GS of 63.1% (95% uncertainty range: 61.3–63.7%), to become cost-equivalent to contemporary ES.
Sensitivity analysis
Analysis including Australian specific costs of clinical review and genetic counselling, in addition to laboratory costs, shows that the estimated average cost per family would be $2,050 for the contemporary ES pathway, $3,634 for GS following contemporary ES and $5,066 for GS as a first line test. Sensitivity analysis exploring a range of GS diagnostic yields at 5%, 10%, 15% and 20% more than the contemporary ES diagnostic yield showed that the estimated incremental cost per additional genetic diagnosis using GS on contemporary ES-negative families was $38,936 (95% CI: $17,521; Dominated) if the GS diagnostic yield was 5% more than the contemporary ES diagnostic yield and $11,681 (95% CI: $7,964; $23,848) if it was 20% more than the contemporary ES diagnostic yield (Figure S5).
DISCUSSION
This study was assembled to obtain health economic evidence for the most rational genomic testing pathways for people with Mendelian forms of ID. Trio ES was performed on 74 prospective, tightly ascertained families with at least moderate ID, followed by trio GS in 32 ES-negative families, episignature analysis in 32 ES-negative individuals and LRS in 16 ES-negative individuals. A genetic aetiology for ID was detected in 51 out of 74 families (69%) using a combination of older Illumina and Life Technologies ES and current GS, with the original ES contributing 42/74 (57%) and GS-unique diagnoses contributing an additional one diagnoses (1%). Although genomic testing has become available and bioinformatic pipelines more standardised, the time required to complete cohort studies is still significant and results in diagnostic outcome biases due to technological advancement. The GS-unique diagnostic yield was therefore refined by repeated contemporary ES sequencing and analysis. Although GS identified nine events not reported in the original ES, contemporary ES was able to detect 8 of these. The diagnoses were missed due to older sequencing chemistries and unavailability of ES CNV analyses. The one GS-unique diagnosis included a large 24MB de novo copy-neutral inversion on chromosome 11 with breakpoints within SHANK2 and near CREB3L1. The presence of a de novo aetiology for ID enabled accurate low-recurrence risk genetic counselling for this family. Episignature analysis detected an episignature concordant for the EHMT1 duplication event detected on GS/contemporary ES. Episignature testing also provided further diagnostic information in two individuals, consistent with a partial Beckwith-Wiedemann syndrome episignature in one and a possible paternal UPD7 and/or a partial MRXSCJ episignature in the other. The effects of controlling for interim novel gene identifications, refinements to bioinformatic pipelines and improved sequencing quality have increased the relative utility of ES compared to GS. This study has shown that combining contemporary ES with episignature analyses has narrowed the diagnostic gap between ES and GS to maximize ID diagnoses.
LRS more accurately detects more SVs and STR expansions/contractions across the genome than short-read GS.21 Much of this variation is highly polymorphic and previously unannotated. Large-scale LRS studies will be required to generate appropriate reference data to assist in interpreting this variation, and functional studies will be required to validate possible pathogenic alleles. Because it is still unknown how much of the additional variation revealed by LRS is clinically relevant, it remains unclear how much of a diagnostic advantage these technologies offer over current first-tier genetic testing.
The GS-specific diagnostic rate for ID appears similar between contemporary ES and GS.22 A recent Dutch study that performed ES and GS on 150 trios with neurodevelopmental disorders, reported a similar diagnostic yield for GS (30.0%) and ES (28.7%).23 All GS-unique diagnoses reported in that study were CNV events, therefore it may be concluded that the diagnostic benefit of performing GS in ID is to detect CNVs. The higher diagnostic rate (69%) in this study compared to the diagnostic rate of 30% in the Dutch study may be explained by the selection criteria focussing on families with moderate to severe ID in the study reported here. Most GS findings were identifiable on contemporary ES due to better sequencing quality or higher coverage (22%, 2/9), introduction of ES CNV analysis (44%, 4/9) and interim publication of novel Mendelian gene disease relationships (22%, 2/9). Ongoing improvements in bioinformatic pipelines, coding region coverage, SV/CNV detection, consanguinity assessment and integration of HPO-coded phenotypic information can facilitate the identification of missed diagnoses through data re-analysis.4,24 A significant impact on diagnostic rates for both ES and GS is novel Mendelian gene disease relationship ascertainment over time. This has been estimated to be approximately 244 novel genes per year at the end of 2018 and includes many conditions with ID.25 It would be expected that as the rate of novel gene disease relationship discovery plateaus and eventually falls, the relative utility of reanalysis will be reduced.
ES sensitivity has increased through better sequencing and the inclusion of intronic and non-coding regions where definitive pathogenic variants are described. GS has a simpler library building process, provides more uniform genome coverage and reduces the number of tests for a diagnosis. GS has some drawbacks compared to ES, including decreased sensitivity for detecting mosaic variants due to reduced depth, increased costs for data generation, analysis and storage, and a limited understanding of the functional effects of non-coding variation.26 Costs for confirmatory tests, including RNA-seq for potential splicing variants should also be considered. RNA-seq from relevant tissues, can increase diagnostic yields by 7–36%.27 RNA-seq costs are relatively low but need to be incorporated into a post-GS cost estimates. Although upfront ES costs can be seen as most cost-effective, the additional costs of GS even with small increases in diagnostic rates and only a proportion of eligible families seeking reproductive modulation, the costs are small compared to life-long care for those families with ID.28,29 Thus, even a single additional diagnosis may have substantial health and cost implications.
The lifetime costs to families living with ID and society have been estimated to be at least US$172,000 per family/year.28 It is reasonable to support the larger upfront GS costs as these are recovered over time, even with a small incremental diagnostic rate over contemporary ES. GS funds and those for patient care are, however, often derived from different sources. Consequently, although the general adoption of GS can be argued, the upfront costs need to be reduced for GS to be adopted as a routine first-tier diagnostic test. The potential for lower cost GS data production is emerging, with costs estimated to be reduced to US$1/Gb30 or US$200 per genome31 for high sample volumes exclusive of data analysis and tertiary reporting. This is well below the estimate for cost-equivalence of GS to ES for achieving a genomic report in ID trios of US$2,435 calculated in this study.
The health economic assessments in this study related to ID trios. Other disease types, different sample sizes, gene panels or singleton sequencing will not have the same health economic outcomes and would require independent analysis studies. Despite this, a similar sized cohort (n=87) was reported to have comparable diagnostic yields to this study for ES which was between 20–75% depending on cohort structure, followed by GS performed on the ES-negative cases (n=12) yielded one diagnosis (8%) of a missense and an intragenic deletion of 90Kb.32 The similarity of ES and GS diagnostic rates is becoming apparent and should be taken into consideration when allocating health budget resources for genomic sequencing versus investment in lower cost sequencing technologies.
Useful adjunct methodologies with lower costs than GS, such as episignatures have become available33 resulting in alternatives to binary decisions between ES and GS. The proportion of genes with episignatures (EpiSign v4) were estimated in this study, the Dutch study,23 diagnosed ID cases in RG internal databases and the top 200 DECIPHER ID genes ranked by frequency of diagnoses (Figure S6). Of the 51 diagnoses in this study, nine were genes with episignatures, consistent with 12% (9/74) of cases being diagnosable using a comprehensive ID gene panel at lower cost than ES or GS. Similarly, had episignature testing been performed in the Dutch cohort,23 it could have provided information about the causative gene in 13 out of 150 (7%) cases. The utility of episignature testing is potentially even higher when applied before GS as 3/9 (33%) of the GS-identified genes in this study and 13/45 (29%) in the Dutch study23 may have been diagnosable by a panel containing ID genes with known episignatures. Forty-nine of the top 200 (24%) ID genes in DECIPHER database have an episignature, whereas, out of 930 cases with diagnoses in 469 ID genes in the RG database, 58 genes (12%) have been assessed as having an episignature. These findings demonstrate that the concurrent use of ES and episignatures could assist in prioritizing the choice of the most relevant post-ES methodology to maximize diagnostic rates and minimize costs. Episignatures may have a higher clinical utility with potential cost reductions if performed with ES to prioritise GS. Episignatures have also been shown to have utility in providing a genome-wide functional test to identify likely genetic etiologies but also in the re-classification of VUS.34 No VUS were identified in this study that had episignature pathogenicity assessment alterations, but this represents additional potential utility for episignatures.35
After extensive testing, 23/74 (31%) families in this cohort remained undiagnosed. RNA-seq has been reported to detect an additional 7–35% of diagnoses and so can be considered to detect abnormally spliced transcripts due to deep intronic or synonymous/missense variants with splicing effects.36 A splice variant was detected in a similar cohort23 (0.7%) so it is likely that at least one case in our cohort might be diagnosed through RNA-seq. Although the most comprehensive combination of diagnostic techniques could be GS, episignatures and RNA-seq, these are not yet available routinely in most diagnostic settings. Variation relevant to ID and commonly missed by SRS can also be assessed using LRS.21 Its utility lies in confirmatory testing and detecting variants inaccessible to SRS, such as large CNVs/SVs and repeat expansions, particularly variation in repeat-rich and high GC-content gene regions, but analysis and interpretation of these data types are still under development.37
The narrowing of the diagnostic gap using contemporary ES analysis and episignature informs the most cost-effective combination of diagnostic techniques for ID. Most variants are predicted to be identified using ES trios analyzed with a contemporary ES pipeline inclusive of CNV analysis. Using complementary genetic technologies after contemporary ES and ES re-analysis such as episignatures and then GS will maximize the diagnostic rates in ID. The GS trio price setting cost-equivalent to ES for ID trio diagnostic rates was assessed as US$2,435, approximately a 60% reduction from current prices. Ongoing technological developments resulting in lower cost GS will increase its relative value compared to ES, to the point where it is likely to become the preferred first-line genomic test.
URLS
Alamut Visual Plus: https://www.sophiagenetics.com/platform/alamut-visual-plus/. CADD Score: http://cadd.gs.washington.edu/. ClinVar: https://www.ncbi.nlm.nih.gov/clinvar/. Eukaryotic Promoter Database: https://epd.epfl.ch/EPDnew_database.php. GeneMatcher https://genematcher.org. gnomAD: https://gnomad.broadinstitute.org/. OMIM: https://www.omim.org/. PubMed: https://pubmed.ncbi.nlm.nih.gov/. RefSeq: https://www.ncbi.nlm.nih.gov/refseq/. seqr: https://seqr.broadinstitute.org/. UCSC Genome Browser: http://genome.ucsc.edu/. VarCards: http://varcards.biols.ac.cn/.
Supplementary Material
Acknowledgements
The authors thank the families that participated in this research and the clinical teams involved in their care. We thank the laboratory teams at New South Wales Statewide Genomic Service, VCGS and the Center for Mendelian Genomics (Broad CMG) for their technical expertise. Exome sequencing was funded through the Australian Genomics grant (NHMRC GNT1113531) and the New South Wales Statewide Genomic Service. K-RD and C-AE were supported by the Australian NHMRC Centre for Research Excellence in Neurocognitive Disorders (NHMRC-RG172296). Genome sequencing and analysis were provided by the Broad Institute of MIT and Harvard Center for Mendelian Genomics (Broad CMG) as part of the GREGoR (Genomics Research to Elucidate the Genetics of Rare diseases) consortium and was funded by the National Human Genome Research Institute (NHGRI) Grants U01HG011755 and R01HG009141.
Footnotes
Publisher's Disclaimer: This is a PDF file of an article that has undergone enhancements after acceptance, such as the addition of a cover page and metadata, and formatting for readability, but it is not yet the definitive version of record. This version will undergo additional copyediting, typesetting and review before it is published in its final form, but we are providing this version to give early visibility of the article. Please note that, during the production process, errors may be discovered which could affect the content, and all legal disclaimers that apply to the journal pertain.
Ethics Declaration
The study was approved by the Melbourne Health Human Research Ethics Committee (HREC/16/MH/251).
Conflicts of Interest
The authors declare no conflicts of interest.
Data Availability
This study generated GS data that is deposited in the NHGRI GREGoR Consortium: Genomics Research to Elucidate the Genetics of Rare Disease - dbGaP Study Accession: phs003047.v1.p1. Proband numbers are mapped to accession numbers (Table S8).
References
- 1.Maia N, Nabais Sá MJ, Melo-Pires M, de Brouwer APM, and Jorge P (2021). Intellectual disability genomics: current state, pitfalls and future challenges. BMC Genomics 22, 1–17. 10.1186/s12864-021-08227-4. [DOI] [PMC free article] [PubMed] [Google Scholar]
- 2.Srivastava S, Love-Nichols JA, Dies KA, Ledbetter DH, Martin CL, Chung WK, Firth HV, Frazier T, Hansen RL, Prock L, et al. (2019). Meta-analysis and multidisciplinary consensus statement: exome sequencing is a first-tier clinical diagnostic test for individuals with neurodevelopmental disorders. Genetics in Medicine. 10.1038/s41436-019-0554-6. [DOI] [PMC free article] [PubMed] [Google Scholar]
- 3.Marshall CR, Chowdhury S, Taft RJ, Lebo MS, Buchan JG, Harrison SM, Rowsey R, Klee EW, Liu P, Worthey EA, et al. (2020). Best practices for the analytical validation of clinical whole-genome sequencing intended for the diagnosis of germline disease. NPJ Genom Med 5. 10.1038/s41525-020-00154-9. [DOI] [PMC free article] [PubMed] [Google Scholar]
- 4.Ewans LJ, Schofield D, Shrestha R, Zhu Y, Gayevskiy V, Ying K, Walsh C, Lee E, Kirk EP, Colley A, et al. (2018). Whole-exome sequencing reanalysis at 12 months boosts diagnosis and is cost-effective when applied early in Mendelian disorders. Genetics in Medicine 20, 1564–1574. 10.1038/gim.2018.39. [DOI] [PubMed] [Google Scholar]
- 5.Schwarze K, Buchanan J, Taylor JC, and Wordsworth S (2018). Are whole-exome and whole-genome sequencing approaches cost-effective? A systematic review of the literature. Genetics in Medicine 20, 1122–1130. 10.1038/gim.2017.247. [DOI] [PubMed] [Google Scholar]
- 6.Jegathisawaran J, Tsiplova K, Hayeems RZ, Marshall CR, Stavropoulos DJ, Pereira SL, Thiruvahindrapuram B, Liston E, Reuter MS, Manshaei R, et al. (2022). Trio genome sequencing for developmental delay and pediatric heart conditions: A comparative microcost analysis. Genetics in Medicine 24, 1027–1036. 10.1016/J.GIM.2022.01.020. [DOI] [PubMed] [Google Scholar]
- 7.Evans CA, Pinner J, Chan CY, Bowyer L, Mowat D, Buckley MF, and Roscioli T (2019). Fetal diagnosis of Mowat-Wilson syndrome by whole exome sequencing. Am J Med Genet A 179, 2152–2157. 10.1002/ajmg.a.61295. [DOI] [PubMed] [Google Scholar]
- 8.Sundercombe SL, Berbic M, Evans CA, Cliffe C, Elakis G, Temple SEL, Selvanathan A, Ewans L, Quayum N, Nixon CY, et al. (2021). Clinically Responsive Genomic Analysis Pipelines: Elements to Improve Detection Rate and Efficiency. Journal of Molecular Diagnostics 23, 894–905. 10.1016/j.jmoldx.2021.04.007. [DOI] [PubMed] [Google Scholar]
- 9.Karbassi I, Maston GA, Love A, Divincenzo C, Braastad CD, Elzinga CD, Bright AR, Previte D, Zhang K, Rowland CM, et al. (2016). A Standardized DNA Variant Scoring System for Pathogenicity Assessments in Mendelian Disorders. Hum Mutat 37, 127–134. 10.1002/humu.22918. [DOI] [PMC free article] [PubMed] [Google Scholar]
- 10.Fowler A, Mahamdallie S, Ruark E, Seal S, Ramsay E, Clarke M, Uddin I, Wylie H, Strydom A, Lunter G, et al. (2016). Accurate clinical detection of exon copy number variants in a targeted NGS panel using DECoN. Wellcome Open Res 1. 10.12688/WELLCOMEOPENRES.10069.1. [DOI] [PMC free article] [PubMed] [Google Scholar]
- 11.Fromer M, Moran JL, Chambert K, Banks E, Bergen SE, Ruderfer DM, Handsaker RE, McCarroll SA, O’Donovan MC, Owen MJ, et al. (2012). Discovery and Statistical Genotyping of Copy-Number Variation from Whole-Exome Sequencing Depth. Am J Hum Genet 91, 597. 10.1016/J.AJHG.2012.08.005. [DOI] [PMC free article] [PubMed] [Google Scholar]
- 12.Sadedin SP, Ellis JA, Masters SL, and Oshlack A (2018). Ximmer: A system for improving accuracy and consistency of CNV calling from exome data. Gigascience 7. 10.1093/gigascience/giy112. [DOI] [PMC free article] [PubMed] [Google Scholar]
- 13.Pais LS, Snow H, Weisburd B, Zhang S, Baxter SM, DiTroia S, O’Heir E, England E, Chao KR, Lemire G, et al. (2022). seqr: A web-based analysis and collaboration tool for rare disease genomics. Hum Mutat 43, 698–707. 10.1002/humu.24366. [DOI] [PMC free article] [PubMed] [Google Scholar]
- 14.Sobreira N, Schiettecatte F, Valle D, and Hamosh A (2015). GeneMatcher: A Matching Tool for Connecting Investigators with an Interest in the Same Gene. Hum Mutat 36, 928–930. 10.1002/humu.22844. [DOI] [PMC free article] [PubMed] [Google Scholar]
- 15.Aref-Eshghi E, Kerkhof J, Pedro VP, France GDI, Barat-Houari M, Ruiz-Pallares N, Andrau J-CC, Lacombe D, Van-Gils J, Fergelot P, et al. (2020). Evaluation of DNA Methylation Episignatures for Diagnosis and Phenotype Correlations in 42 Mendelian Neurodevelopmental Disorders. Am J Hum Genet 106, 356–370. 10.1016/J.AJHG.2020.01.019. [DOI] [PMC free article] [PubMed] [Google Scholar]
- 16.Sadikovic B, Levy MA, Kerkhof J, Aref-Eshghi E, Schenkel L, Stuart A, McConkey H, Henneman P, Venema A, Schwartz CE, et al. (2021). Clinical epigenomics: genome-wide DNA methylation analysis for the diagnosis of Mendelian disorders. Genetics in Medicine 23, 1065–1074. 10.1038/s41436-020-01096-4. [DOI] [PMC free article] [PubMed] [Google Scholar]
- 17.Gamaarachchi H, Samarakoon H, Jenner SP, Ferguson JM, Amos TG, Hammond JM, Saadat H, Smith MA, Parameswaran S, and Deveson IW (2022). Fast nanopore sequencing data analysis with SLOW5. Nat Biotechnol 40, 1026–1029. 10.1038/s41587-021-01147-4. [DOI] [PMC free article] [PubMed] [Google Scholar]
- 18.Samarakoon H, Ferguson JM, Jenner SP, Amos TG, Parameswaran S, Gamaarachchi H, and Deveson IW (2022). Flexible and efficient handling of nanopore sequencing signal data with slow5tools. bioRxiv. 10.1101/2022.06.19.496732. [DOI] [PMC free article] [PubMed] [Google Scholar]
- 19.Stevanovski I, Chintalaphani SR, Gamaarachchi H, Ferguson JM, Pineda SS, Scriba CK, Tchan M, Fung V, Ng K, Cortese A, et al. (2022). Comprehensive genetic diagnosis of tandem repeat expansion disorders with programmable targeted nanopore sequencing. [DOI] [PMC free article] [PubMed] [Google Scholar]
- 20.Corbett MA, Kroes T, Veneziano L, Bennett MF, Florian R, Schneider AL, Coppola A, Licchetta L, Franceschetti S, Suppa A, et al. (2019). Intronic ATTTC repeat expansions in STARD7 in familial adult myoclonic epilepsy linked to chromosome 2. Nat Commun 10. 10.1038/S41467-019-12671-Y. [DOI] [PMC free article] [PubMed] [Google Scholar]
- 21.Miller DE, Sulovari A, Wang T, Loucks H, Hoekzema K, Munson KM, Lewis AP, Fuerte EPA, Paschal CR, Walsh T, et al. (2021). Targeted long-read sequencing identifies missing disease-causing variation. The American Journal of Human Genetics 108, 1436–1449. 10.1016/j.ajhg.2021.06.006. [DOI] [PMC free article] [PubMed] [Google Scholar]
- 22.Kingsmore SF, Cakici JA, Clark MM, Gaughran M, Feddock M, Batalov S, Bainbridge MN, Carroll J, Caylor SA, Clarke C, et al. (2019). A Randomized, Controlled Trial of the Analytic and Diagnostic Performance of Singleton and Trio, Rapid Genome and Exome Sequencing in Ill Infants. Am J Hum Genet 105, 719. 10.1016/J.AJHG.2019.08.009. [DOI] [PMC free article] [PubMed] [Google Scholar]
- 23.van der Sanden BPGH, Schobers G, Corominas Galbany J, Koolen DA, Sinnema M, van Reeuwijk J, Stumpel CTRM, Kleefstra T, de Vries BBA, Ruiterkamp-Versteeg M, et al. (2022). The performance of genome sequencing as a first-tier test for neurodevelopmental disorders. European Journal of Human Genetics 2022, 1–8. 10.1038/s41431-022-01185-9. [DOI] [PMC free article] [PubMed] [Google Scholar]
- 24.Bullich G, Matalonga L, Pujadas M, Papakonstantinou A, Piscia D, Tonda R, Artuch R, Gallano P, Garrabou G, González JR, et al. (2022). Systematic Collaborative Reanalysis of Genomic Data Improves Diagnostic Yield in Neurologic Rare Diseases. Journal of Molecular Diagnostics 24, 529–542. 10.1016/j.jmoldx.2022.02.003. [DOI] [PubMed] [Google Scholar]
- 25.Bamshad MJ, Nickerson DA, and Chong JX (2019). Mendelian Gene Discovery: Fast and Furious with No End in Sight. The American Journal of Human Genetics 105, 448–455. 10.1016/J.AJHG.2019.07.011. [DOI] [PMC free article] [PubMed] [Google Scholar]
- 26.Schwarze K, Buchanan J, Fermont JM, Dreau H, Tilley MW, Taylor JM, Antoniou P, Knight SJL, Camps C, Pentony MM, et al. (2019). The complete costs of genome sequencing: a microcosting study in cancer and rare diseases from a single center in the United Kingdom. Genetics in Medicine 2019 22:1 22, 85–94. 10.1038/s41436-019-0618-7. [DOI] [PMC free article] [PubMed] [Google Scholar]
- 27.Montgomery SB, Bernstein JA, and Wheeler MT (2022). Toward transcriptomics as a primary tool for rare disease investigation. Cold Spring Harb Mol Case Stud 8. 10.1101/MCS.A006198. [DOI] [PMC free article] [PubMed] [Google Scholar]
- 28.Doble B, Schofield D, Evans CA, Groza T, Mattick JS, Field M, and Roscioli T (2020). Impacts of genomics on the health and social costs of intellectual disability. J Med Genet, 1–8. 10.1136/jmedgenet-2019-106445. [DOI] [PubMed] [Google Scholar]
- 29.Ewans LJ, Minoche AE, Schofield D, Shrestha R, Puttick C, Zhu Y, Drew A, Gayevskiy V, Elakis G, Walsh C, et al. (2022). Whole exome and genome sequencing in mendelian disorders: a diagnostic and health economic analysis. European Journal of Human Genetics 2022, 1–11. 10.1038/s41431-022-01162-2. [DOI] [PMC free article] [PubMed] [Google Scholar]
- 30.Almogy G, Pratt M, Oberstrass F, Lee L, Mazur D, Beckett N, Barad O, Soifer I, Perelman E, Etzioni Y, et al. (2022). Cost-efficient whole genome-sequencing using novel mostly natural sequencing-by-synthesis chemistry and open fluidics platform. bioRxiv, 1–8. 10.1101/2022.05.29.493900. [DOI] [Google Scholar]
- 31.Hale C (2022). Illumina pitches $200 genomes with new line of DNA sequencers. Fierce Biotech. [Google Scholar]
- 32.Álvarez-Mora MI, Sánchez A, Rodríguez-Revenga L, Corominas J, Rabionet R, Puig S, and Madrigal I (2022). Diagnostic yield of next-generation sequencing in 87 families with neurodevelopmental disorders. Orphanet J Rare Dis 17, 60. 10.1186/S13023-022-02213-Z. [DOI] [PMC free article] [PubMed] [Google Scholar]
- 33.Frésard L, and Montgomery SB (2018). Diagnosing rare diseases after the exome. Cold Spring Harb Mol Case Stud 4. 10.1101/mcs.a003392. [DOI] [PMC free article] [PubMed] [Google Scholar]
- 34.Ciolfi A, Foroutan A, Capuano A, Pedace L, Travaglini L, Pizzi S, Andreani M, Miele E, Invernizzi F, Reale C, et al. (2021). Childhood-onset dystonia-causing KMT2B variants result in a distinctive genomic hypermethylation profile. Clin Epigenetics 13, 1–11. 10.1186/S13148-021-01145-Y/FIGURES/5. [DOI] [PMC free article] [PubMed] [Google Scholar]
- 35.Levy MA, McConkey H, Kerkhof J, Barat-Houari M, Bargiacchi S, Biamino E, Bralo MP, Cappuccio G, Ciolfi A, Clarke A, et al. (2022). Novel diagnostic DNA methylation episignatures expand and refine the epigenetic landscapes of Mendelian disorders. Human Genetics and Genomics Advances 3, 100075. 10.1016/J.XHGG.2021.100075. [DOI] [PMC free article] [PubMed] [Google Scholar]
- 36.Montgomery SB, Bernstein JA, and Wheeler MT (2022). Toward transcriptomics as a primary tool for rare disease investigation. Cold Spring Harb Mol Case Stud 8. 10.1101/MCS.A006198. [DOI] [PMC free article] [PubMed] [Google Scholar]
- 37.Pauper M, Kucuk E, Wenger AM, Chakraborty S, Baybayan P, Kwint M, van der Sanden B, Nelen MR, Derks R, Brunner HG, et al. (2021). Long-read trio sequencing of individuals with unsolved intellectual disability. European Journal of Human Genetics 29, 637. 10.1038/S41431-020-00770-0. [DOI] [PMC free article] [PubMed] [Google Scholar]
- 38.Itai T, Hamanaka K, Sasaki K, Wagner M, Kotzaeridou U, Brösse I, Ries M, Kobayashi Y, Tohyama J, Kato M, et al. (2021). De novo variants in CELF2 that disrupt the nuclear localization signal cause developmental and epileptic encephalopathy. Hum Mutat 42, 66–76. 10.1002/humu.24130. [DOI] [PubMed] [Google Scholar]
- 39.Smits DJ, Schot R, Popescu CA, Dias KR, Ades L, Briere LC, Sweetser DA, Kushima I, Aleksic B, Khan S, et al. (2023). De novo MCM6 variants in neurodevelopmental disorders: a recognizable phenotype related to zinc binding residues. Hum Genet 10.1007/s00439-023-02569-7. [DOI] [PMC free article] [PubMed] [Google Scholar]
- 40.Gizak A, Diegmann S, Dreha-Kulaczewski S, Wiśniewski J, Duda P, Ohlenbusch A, Huppke B, Henneke M, Höhne W, Altmüller J, et al. (2021). A novel remitting leukodystrophy associated with a variant in FBP2. Brain Commun 3. 10.1093/braincomms/fcab036. [DOI] [PMC free article] [PubMed] [Google Scholar]
Associated Data
This section collects any data citations, data availability statements, or supplementary materials included in this article.
Supplementary Materials
Data Availability Statement
This study generated GS data that is deposited in the NHGRI GREGoR Consortium: Genomics Research to Elucidate the Genetics of Rare Disease - dbGaP Study Accession: phs003047.v1.p1. Proband numbers are mapped to accession numbers (Table S8).