

Abstract
Crop production is among the most extensive human activities on the planet – with critical importance for global food security, land use, environmental burden, and climate. Yet despite the key role that croplands play in global land use and Earth systems, there remains little understanding of how spatial patterns of global crop cultivation have recently evolved and which crops have contributed most to these changes. Here we construct a new data library of subnational crop-specific irrigated and rainfed harvested area statistics and combine it with global gridded land cover products to develop a global gridded (5-arcminute) irrigated and rainfed cropped area (MIRCA-OS) dataset for the years 2000 to 2015 for 23 crop classes. These global data products support critical insights into the spatially detailed patterns of irrigated and rainfed cropland change since the start of the century and provide an improved foundation for a wide array of global assessments spanning agriculture, water resource management, land use change, climate impact, and sustainable development.
Subject terms: Environmental impact, Hydrology
Background & Summary
Croplands account for 13% of the planet’s habitable land1,2. On the one hand, crop production is central to ensuring the food security of an ever-growing global population and supporting the livelihoods of more than a billion people. On the other hand, it exerts a profound influence on Earth systems – imposing substantial environmental burdens for water3, land4, greenhouse gas emissions1,2, biogeochemical cycles5, and biodiversity6,7 and modifying land-atmosphere interactions8. These benefits and impacts of crop production are highly dynamic across space and time and are in large part influenced by the specific crops being cultivated in a particular place1,2. Given the outsized role that crop production will likely continue to play in determining the overall economic, social, and environmental sustainability of humanity, it is essential to better understand global patterns of cropped areas, how these patterns have recently evolved, and which crops have contributed most to these changes.
Several initiatives have begun to address the challenges of mapping spatial patterns and temporal trends in global irrigated and rainfed cropped areas. Datasets on the extent of rainfed and irrigated cropland have been developed at global9 and regional10 scales, but the limited spatial (i.e., restricted to specific regions) and temporal (i.e., constrained to particular years) coverage of these analyses hinders a comprehensive assessment of crop-specific changes since the beginning of the century. A growing number of studies have also attempted to map irrigated areas or crop types at global or national scales using satellite imagery and remotely sensed data10–12. While these approaches provide finer spatial resolution, the resultant data products are often inconsistent with official statistics and do not combine information on irrigation status and crop type. Other datasets2,13,14 offer greater temporal coverage but at coarser spatial resolutions (i.e., national or sub-national administrative units), limiting their utility in spatially explicit assessments or modeling of rainfed and irrigated cropland changes. A few existing global gridded products on crop-specific irrigated and rainfed areas have also been developed – namely GAEZ15–17 (Global Agroecological Zones), SPAM18–20 (Spatial Production Allocation Model), and MIRCA200021 (Monthly Irrigated and Rainfed Cropped Areas) – with limitations on either temporal coverage or intra-annual granularity. While all of the efforts described above have provided valuable insights into aspects of either spatial patterns or temporal trends of global cropland areas, there remains a critical need for integrated information that is both spatially and temporally detailed on global changes in crop-specific irrigated and rainfed areas in the 21st century.
Here, we address this gap by developing the MIRCA-OS dataset, a global gridded (5-arcminute) crop-specific irrigated and rainfed cropped area dataset of the 21st century (2000–2015). Through an improved methodology based on that used for the MIRCA200021 dataset (Fig. 1), we first leverage a global assessment of food production data22 to build a comprehensive data library of municipal- to national-scale crop-specific irrigated and rainfed harvested area statistics – covering 23 crop classes (Table 2) for all study years and all countries from the best available international and national data sources (Table 1). We then combine this data library with information on updated crop-specific and spatially detailed planting and harvesting dates23,24 to produce crop calendars for each administrative unit and crop. Within each administrative unit, crop-specific irrigated and rainfed harvested areas are spatially allocated to 5-arcminute grid cells based on a sequential and iterative downscaling approach constrained by information on crop-specific harvested area (HA)15–17, cropland extent (CE)25, and area equipped for irrigation (AEI)26. In doing so, we produce five main data products: 1) crop calendars for irrigated and rainfed crops (CC-I & CC-R), 2) monthly growing area grids for irrigated and rainfed crops (MGAG-I & MGAG-R), 3) maximum monthly growing area grids for irrigated and rainfed crops (MMGAG-I & MMGAG-R), 4) maximum monthly cropped area grids for irrigated and rainfed crops (MMCAG-I & MMCAG-R), and 5) annual harvested area grids for irrigated and rainfed crops (AHAG-I & AHAG-R). All data products, input datasets, code, and metadata are publicly available on HydroShare27. We also provide aggregations at the 0.5° resolution to align with global assessment model needs. These data products hold great potential for enabling a new understanding of fine-scale patterns and temporal evolution of global irrigated and rainfed croplands and can contribute directly to informing multi-scalar efforts on food security, water sustainability, climate adaptation, and development at national and international levels.
Fig. 1.

Workflow used to develop the MIRCA-OS dataset. A unit code is a seven-digit unique identifier assigned to each spatial unit. The first three digits correspond to the M49 United Nations country code, while the remaining four digits uniquely identify each spatial unit.
Table 2.
Crop classes used for MIRCA-OS.
| Crop classes | Crop name within crop class |
|---|---|
| Barley | Barley |
| Cassava | Tapioca; cassava |
| Cocoa | Cocoa |
| Coffee | Coffee |
| Cotton | Cotton |
| Fodder | Alfalfa; grasses and legumes; clover; hay; haylage |
| Groundnuts | Groundnuts; peanuts |
| Maize | Maize; corn (both grain and silage); sweet corn; popcorn |
| Millet | Pearl millet; finger millet; small millet |
| Oil palm | Oil palm |
| Potatoes | Potato |
| Pulses | Chickpeas; pigeon peas; cowpeas; peas, beans; lentils; other Pulses |
| Rapeseed | Rapeseed; canola; mustard |
| Rice | Rice; paddy |
| Rye | Rye |
| Sugar beet | Sugar beet |
| Sugar cane | Sugar cane |
| Sorghum | Sorghum (grain and silage) |
| Soybeans | Soybean |
| Sunflower | Sunflower |
| Wheat | Spring soft wheat; winter soft wheat, durum |
| Others perennial | Abaca (manila hemp); agave fibers; almonds; apples; apricots; areca nuts (betel);avocados; bananas; berries; blueberries; brazil nuts; carobs; cashew nuts; cashew apple; cinnamon (canella); citrus fruit; coconuts; cranberries; currants; date palm, figs; fruit fresh; fruit tropical fresh; gooseberries; grapefruit and pomelos; grapes; kapok fiber; kapok seed in shell; kola nuts; kiwi fruit; lemons and limes; mangoes and mate; natural gums; natural rubber;nutmeg, mace, and cardamon; nuts, other; olives; oranges; papayas; peaches and nectarines; pears; pepper; peppermint; persimmons; pineapples; pistachios; plantains; plums; pyrethrum, dried flowers; quinces; ramie; sisal; sour cherries; spices; stone fruit; strawberries; tangerines and mandarins; tea leaves; tung nuts; vanilla and walnuts |
| Others annual | Other crops not listed before |
Table 1.
Characteristics of input datasets used to generate MIRCA-OS.
| Input dataset | Characteristics | Remarks |
|---|---|---|
| Administrative boundaries28 (2000–2015) | Shapefile of all spatial units’ boundaries from GADM. | |
| Harvested area statistics (2000–2015) | Census-based statistics of total and irrigated harvested area at national and subnational units. | National census and survey reports, national data portal (e.g., USDA NASS Qucik Stats45), Eurostat14, FAOSTAT2, FEWS NET29,46, AQUASTAT32, CountrySTAT30 and Gambhir and Marston (2024)47. For detailed information, see Supplementary Table S1 and Supplementary Note 2. |
| Crop calendars for irrigated and rainfed crops21,23,24,32 | A dataset provides planting and maturity months at a spatial unit or a 0.5° spatial resolution. | We used the latest crop calendars dataset for all crops except groundnuts, pulses, rice, and other annuals, for which the MIRCA200021 and RiceAtlas33 crop calendars were used. |
| Cropland extent25 (2000–2015) | A HYDE3.2 5-arcminute gridded map of cropland extent. | |
| Area Equipped for Irrigation (AEI)26 (2000–2015) | 5-arcminute gridded map of area equipped for irrigation. | |
| Gridded crop-specific annual harvested area15–17 (2000–2015) | GAEZ and GAEZ + 2015 Datasets: 5-arcminute gridded maps of crop-specific annual harvested areas. | A 5-arcminute gridded map of crops for 2000, 2010, and 2015. The 2005 maps were spatially interpolated. |
| Validation datasets21,35–37,39 | To validate MIRCA-OS products against all available gridded data products. |
Methods
We develop global gridded (5-arcminute) maps of crop-specific irrigated and rainfed areas for 5-year timesteps from 2000 to 2015 for 23 crop classes – barley, cassava, cocoa, coffee, cotton, fodder, groundnuts, maize, millet, oil palm, potatoes, pulses, rapeseed, rice, rye, sorghum, soybeans, sugar cane, sugar beet, sunflower, wheat, others perennial, and others annual (Table 2). The choice of spatial resolution is primarily to ensure consistency with other global gridded datasets, though our approach is readily adaptable to all resolutions. The selection of 2015 as the end of the study period is primarily due to the different years with which agricultural censuses occur within each country (ranging from −/+3 years before/after each time step; e.g., 2000 maps are based on agricultural censuses occurring from 1997–2003) as well as delays in reporting of each country’s sub-national agricultural statistics (i.e., the year 2020 full census reports of most countries are not yet publicly accessible). Consequently, there is a significant delay between the agricultural year and the year of our latest MIRCA-OS products. To reduce this lag, better alignment between the timelines of census collection and reporting is necessary. As more census data becomes available, the MIRCA-OS will be extended to more recent years.
Data sources
Administrative boundaries
Several input data sources were used to generate the MIRCA-OS datasets (Table 1). Spatial units were delineated using the official administrative boundaries from Global Administrative Areas28 (GADM). We identified each spatial unit using a seven-digit unit code. The first three digits correspond to the M49 United Nations country code, while the remaining four digits are uniquely assigned to each spatial unit29. Because of shifting political boundaries and differences in the level of disaggregation of crop statistics through time, we developed a unique map of global administrative boundaries for each time step in our analysis (Fig. 2).
Fig. 2.
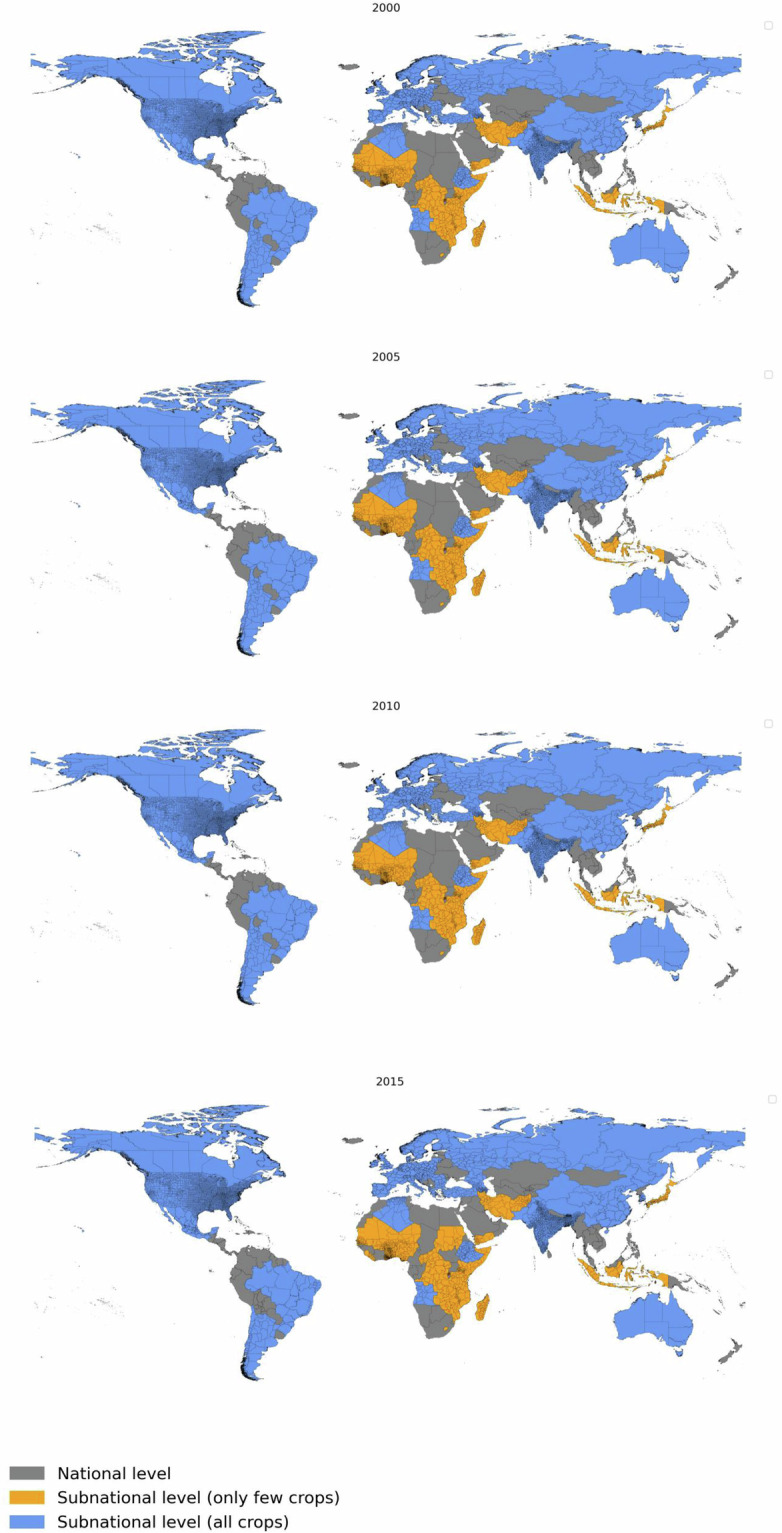
Administrative boundaries of spatial units used for spatial downscaling. Levels of spatial disaggregation are dependent on the detail provided within each country’s crop statistics and range from the municipal to national level.
Harvested area statistics
We developed a comprehensive data library of municipal- to national-scale crop-specific irrigated and rainfed harvested area statistics for all study years and all countries using a suite of international (i.e., FAOSTAT2, AQUASTAT13, CountrySTAT30, EUROSTAT14) and national (i.e., USDA NASS31, Ministries of Agriculture and/or Water Resources) sources. We gathered data for the finest spatial administrative level available. Harvested area data at the municipal or district level were collected for Bangladesh (only for the year 2015), India, and the United States. Complete province-level data were gathered for 41 countries, while limited (e.g., in terms of number of crops or years with available data) province-level data were collected for 26 additional countries. For other countries, national-level data were collected, covering most countries in Africa and Asia, some regions in South America, and several small island nations. Comprehensive country-specific data descriptions are provided in Supplementary Table S1 and Note 2.
For countries where crop-specific irrigated harvested area data was available (i.e., the United States, Mexico, and India), data was taken directly from the national census. For various European countries, the total harvested and irrigated area data at the provincial level (according to the Nomenclature of Territorial Units for Statistics, or NUTS2) were gathered from EUROSTAT14. This data on crop-specific irrigated areas is available from 2000 to 2013, with gaps in the data for most countries—2010 being an exception where data coverage extends to all countries. However, irrigated area data from Greece, France, Italy, and Spain has fewer gaps relative to other countries for the whole period; in cases where only a single year’s data on irrigated areas was available, the national-level irrigated areas collected from AQUASTAT32 were allocated to each province assuming that the regional proportions remain constant for the target period. When more than one year of data was available, a linear interpolation was performed to estimate the crop-specific irrigated area for the target year. For some countries, while data on total harvested areas and areas equipped for irrigation were accessible at a subnational level, no specific statistics on irrigated areas for individual crops were available. For these instances, we used the proportion of area equipped for irrigation to the total harvested area within each spatial unit to assign the national-level irrigated area from AQUASTAT to each province. For other countries, subnational data on total harvested area were available for only a few crops, and there were no specific statistics on irrigated areas for individual crops. To address this, national-level irrigated areas were proportionally assigned to each spatial unit based on the total harvested area and area equipped for irrigation in each province. After assigning these crops, the remaining CE and AEI were computed and used to allocate the remaining crop area at the national level. For countries with no national census reports of total and irrigated harvested area for each crop, the national-level total harvested area came from FAOSTAT, and the irrigated harvested area came from AQUASTAT. The rainfed harvested areas were computed as the difference between total and irrigated harvested areas for each crop class and spatial unit. In cases where the irrigated harvested area was larger than the total harvested area, the rainfed harvested area was assumed to be zero.
Crop growing periods
Information on crop growing periods was taken from a recent global crop calendar dataset23,24, which provides 0.5° gridded information on the planting and harvesting dates - disaggregated as irrigated and rainfed systems. Jägermeyr et al.23 combine various national and international observational sources to create a new composite crop calendar product. We used this source of crop calendars for barley, cassava, cotton, maize, millet, potatoes, rapeseed, rye, sugar beet, sugar cane, sorghum, soybeans, sunflower, and wheat. We used the RiceAtlas33 Calendar for rice crops to account for multiple growing seasons. This approach was particularly important for addressing spatial units with more than two rice growing seasons, where we were unable to utilize the latest crop calendar data. For groundnuts, pulses, and other annuals, for which recent datasets did not provide information, we used the MIRCA200021 crop calendar. Cocoa, coffee, oil palm, fodder, other perennials, and sugar cane were classified as perennial crops.
Global gridded inputs
Gridded (5-arcminute) cropland extent (CE) came from the History Database of the Global Environment (HYDE) dataset25. The latest version of the HYDE dataset, version 3.2, offers comprehensive data on land use and land cover from 10,000 BCE to 2015 AD25. In our study, we utilized HYDE’s annual maps of cropland extent spanning from 2000 to 2015. Gridded crop-specific total harvested area (HA) data at 5-arcminute resolution for the years 2000 and 2010 were obtained from the FAO/IIASA Global Agroecological Zones15,16 (GAEZ v4) dataset. The harvested area for the year 2005 was temporally interpolated for each crop and grid cell. The harvested area for 2015 data came from the recent GAEZ + 15 update17. To define the extent of the irrigated area of each 5-arcminute grid cell, we used recent gridded data on the area equipped for irrigation (AEI) for the years 2000 to 2015 from Mehta et al.26.
Preprocessing
Crop-specific harvested area data were reclassified into 46 crop classes (23 irrigated + 23 rainfed) (Table 2). Compared to the original MIRCA2000 dataset, we did not include date palm, citrus, and grapes due to a lack of gridded crop-specific HA information for those crop classes. These crops were grouped into the other perennials class. In most countries, the data on grain and silage for maize and sorghum were not reported separately. To ensure consistency for the few countries that distinguish these uses in their statistics, we aggregated the grain and silage harvested area for each of these crops into maize and sorghum crop classes. Consequently, the fodder crop category does not encompass the silage of maize and sorghum. Another significant challenge in harmonizing fodder crop classes arises from the fact that FAOSTAT no longer reports these classes separately. As a result, our dataset relies entirely on national and regional census reports and the AQUASTAT database for the harvested area of fodder, potentially leading to underestimation in countries that did not include fodder crop classes in their census reports. The reclassification of all other crops into other annuals and other perennials was done according to the annual and perennial categories used by Monfreda et al.34.
All gridded input datasets were spatially preprocessed to ensure a consistent spatial resolution (5 arcminutes) and projection (WGS84). The gridded planting and harvesting dates for each crop in each spatial unit were assigned by extracting the majority of pixel values within each spatial unit. For certain crop classes, some cross-walking was required between MIRCA-OS and the GAEZ HA maps. The GAEZ HA map of stimulants was used in MIRCA-OS for both cocoa and coffee crop classes. The GAEZ HA maps for other cereals were used in MIRCA-OS for the rye crop class. The GAEZ HA map of other crops (NES) was split between other perennials and other annuals based on the proportions of annual and perennial crops of each spatial unit for each year – as determined from FAOSTAT. The GAEZ HA maps of banana, olives, and the perennial portion of NES crops were aggregated and reclassified in MIRCA-OS as other perennials. Similarly, the GAEZ HA maps for tobacco, yam, vegetables, and the annual portion of NES crops were aggregated and reclassified in MIRCA-OS as other annuals.
Data quality indicators
We assessed the quality of the harvested area statistics for each country using five criteria: (1) availability of subnational data (assessing the resolution from municipal to national level), (2) temporal consistency (evaluating the availability of consistent data throughout the study period), (3) synchrony (measuring how closely the timing of data collection matches the study period), (4) spatial consistency (determining whether the data covers the entire target area), and (5) availability of segregated irrigated and rainfed areas (checking if data is available separately for these categories). Each criterion was scored from 0 to 1 for each crop and country, and the total scores were summed, where a lower score represents poor data quality and a higher score represents high data quality (i.e., equal weightage was given to each metric). We observe relatively lower total quality metric scores for irrigated statistics in 2000 and 2005 due to the unavailability of irrigated area data for some countries from AQUASTAT in the early 2000s (Fig. 3). This data quality is similar across crops but widens in 2010 and 2015. For statistics on total harvested area, we see no substantial differences in data quality from 2000 to 2015 but with wide variation in data quality between crops (Fig. 4).
Fig. 3.

Distribution of total data quality scores for irrigated harvested area statistics. Each panel represents a different year, showing the distribution of total quality scores across various irrigated crops. A lower score represents poor data quality, while a higher score represents high data quality.
Fig. 4.

Distribution of total data quality scores for total harvested area statistics. Each panel represents a different year, showing the distribution of total quality scores across various crops. A lower score represents poor data quality, while a higher score represents high data quality.
Compilation of Crop calendars
By combining the harvested area statistics along with the crop calendar, we develop monthly growing areas (i.e., Crop calendars (CC)) of irrigated and rainfed crops for each (sub-)national administrative unit. These temporally disaggregated CCs were necessary to enable the monthly spatial downscaling from the administrative unit to the grid cell. Two growing seasons were considered for wheat and three growing seasons for rice, based on the latest crop calendar23,24 and RiceAtlas calendars33, respectively. For the irrigated other annuals class, up to four growing seasons were considered, while up to three growing seasons were considered for the rainfed other annuals class, according to the MIRCA200021 crop calendars. In comparison to MIRCA2000, the current version lacks multiple growing seasons for barley maize, rye, and sorghum due to the constraints imposed by the availability of the latest crop calendar for multiple growing seasons. In many countries (excluding Bangladesh, China, most European Union countries with EUROSTAT data, India, Mexico, the Republic of Korea, and the United States), rice and wheat harvested areas are each reported as annual totals without differentiating per season. To allocate the irrigated harvested areas of wheat into multiple growing seasons (winter wheat and spring wheat), we used the FAO irrigated crop calendar32, which provides the harvested area and growing season of major crops for the most recent available year (between 1987 and 2015, depending on the country). The FAO irrigated crop calendar is not available for the entire study period, so we assumed that the seasonal distribution of those crops remained constant throughout our study period. We used this information to determine the proportion of total irrigated harvested areas of wheat to be allocated to the different growing seasons. The irrigated harvested areas of rice were allocated into up to three growing seasons (Rice1, Rice2, and Rice3) according to RiceAtlas33 calendars and production dataset. For rainfed crops of rice, wheat, and other annuals, multiple cropping seasons were determined according to the MIRCA200021 crop calendar.
Spatial downscaling to the grid cell level
We adopted an improved methodology that builds on that developed for the MIRCA200021 (monthly irrigated and rainfed cropped areas for the year 2000) dataset (Fig. 5). Each administrative ‘unit’s crop-specific irrigated and rainfed harvested area was downscaled to each eligible five-arcminute grid cell falling within the administrative unit, with limits on eligible area determined by data on the gridded crop-specific harvested area (HA), cropland extent (CE), and area equipped for irrigation (AEI). All of the gridded datasets (AEI, CE, and HA) have inconsistencies as they come from different sources. For instance, in some locations, AEI pixel values were larger than CE values. To minimize these inconsistencies, we employed a stepwise prioritization strategy during the downscaling process (Table 3). While downscaling, the highest priority was given to ensure the sum of a crop-specific irrigated area at each grid cell is lower than or equal to the AEI. For any amounts of harvested area that remained to be allocated within the administration unit after meeting this highest priority, we then spatially distributed these harvested areas to maximize the consistency of each grid’s crop-specific irrigated and rainfed areas with CE and HA (Table 3).
Fig. 5.

Procedure for spatial downscaling. Ordering sequences for downscaling growing areas of each spatial unit from the crop calendar (CC) to a 5-arcminute grid cell level, constrained by available land resources (CE, AH, and AEI). The specified conditions dictate the requirements for assigning cell-specific irrigated and rainfed growing areas. Adapted from Portmann et al.21.
Table 3.
Priority level for downscaling a CC of each administrative unit to growing area grids.
| Priority | Input dataset | Goal |
|---|---|---|
| 1 | Area equipped for irrigation26 (AEI) | In each month and grid cell, the total irrigated area is less than or equal to the corresponding area equipped for irrigation. |
| 2 | Cropland extent25 (CE) | In each month and grid cell, the combined area of crop-specific irrigation and rainfed areas is less than or equal to the cropland extent. |
| 3 | Total harvested area15–17 (HA) | In each grid cell and crop class, the combined yearly harvested area for irrigated and rainfed crops is equal to the total harvested area for that particular crop. |
The procedure was adapted from MIRCA200021. Priority 1 was given the highest priority to ensure the sum of crop-specific irrigated areas at each grid cell is lower than or equal to the AEI. We aimed to maximize the consistency between crop-specific irrigated and rainfed areas at each grid cell with the CE and HA data.
The downscaling procedure was sequential and iterative, consisting of seven distinct steps: four to assign irrigated areas and three more to assign rainfed areas. The allocation of irrigated and rainfed areas was performed crop by crop and spatial unit by spatial unit. After each step, the sum of downscaled grid cell harvested areas was compared with the total crop-specific harvested area of the CC; if all of a crop’s harvested area was not distributed after completing a step, then we proceeded to the subsequent step (Fig. 5). All steps of the spatial downscaling procedure are summarized below, and detailed downscaling methods are available in Supplementary Note 1.
In this study, harvested area is defined as the total area from which a specific crop is harvested in a given growing season or year. It accounts for multiple harvests of the same crop in a year. In contrast, growing area refers to the total area where a specific crop is cultivated from planting to harvest.
In step 1, the irrigated growing area of each crop in a specific grid cell during any month of the growing period was estimated as the product of the total harvested area (HA) of the crop and a fraction of the grid cell area equipped for irrigation (AEI)), divided by the number of sub crops. For crops with multiple growing seasons, the irrigated growing area was equally distributed among each sub-crop, ensuring that the total did not exceed the AEI for any grid cell. After completing each step, the sum of the allocated cell growing areas within each spatial unit was compared to the monthly growing area of the calendar unit in the CC. This comparison was conducted to verify whether the full growing area was assigned or if additional areas needed to be allocated in the subsequent step.
To determine which crop statistics to allocate first, all irrigated crops were ranked based on their irrigated harvested area within each administrative unit (starting with the crop with the largest harvested area) and the corresponding crop category. While assigning ranks, perennial crops (sugar cane, oil palm, cocoa, and coffee) were processed first, followed by other perennials and fodder crops. This prioritization is due to the limited flexibility in allocating the growing area for perennial crops. Annual crops (barley, cassava, cotton, fodder, groundnuts, maize, millet, potatoes, pulses, rapeseed, rice, sorghum, soybeans, sunflower, and wheat) were then processed, followed by the other annuals crop classes. Following their ranking, Steps 2 through 4 were computed for each crop reported in an administrative unit iteratively based on their rank, starting from the top-ranked crop, and then these steps were repeated iteratively for each subsequent crop, accounting for the remaining AEI, HA, and CE.
After each step, the maximum cumulative irrigated area assigned for all preceding crops was determined by selecting the maximum total irrigated area assigned during the growing months of the processed crops. The irrigated area still available after each step was estimated as the difference between the cell-specific area equipped for irrigation (AEI) and the maximum cumulative irrigated area assigned in the previous step/s. The total harvested area available was also estimated as the difference between the HA in the grid cell and the total area allocated in the previous step/s. This ensured that the cumulative monthly growing area assigned for each crop and month did not exceed the area equipped for irrigation or the upper bound of the total harvested area.
In step 2, irrigated growing areas for each crop and sub-crop were allocated based on the available AEI and HA in each grid cell. After determining the available AEI and HA, the minimum value of the two was allocated in this step. In step 3, the irrigated growing area of each crop and sub-crop was assigned to the remaining AEI after the previous steps for grid cells with a cropland extent value greater than zero. In step 4, the remaining harvested area in the calendar unit was allocated to the amount of AEI left after the previous steps were completed, even if the grid cell had no cropland extent.
After allocating the irrigated growing areas for all sub-crops, steps 5 to 7 were performed to assign the rainfed growing areas for each sub-crop and grid cell. The remaining cropland extent after assigning the irrigated areas was determined as the difference between the cell-specific CE and the total assigned irrigated area from steps 1 to 4. In step 5, the rainfed growing areas for each annual crop and sub-crop were allocated based on the remaining cropland extent after the previous steps. Perennial crops were allocated to grid cells not occupied by AEI. In steps 6 and 7, rainfed areas could be distributed beyond the cropland extent, taking into account the available area constrained to AEI and 95% of the grid cell area21. We utilize only 95% of the cell area to account for other land uses (e.g., roads and settlements).
Data Records
Each annual and monthly gridded dataset is in standard raster format (GeoTIFF/NetCDF) with global coverage (180°E–180°W; 90°S–90°N) and a 5-arcminute spatial resolution (approximately 10 km × 10 km at the equator) using the WGS84 coordinate system. The crop calendars for irrigated and rainfed crops from 2000 to 2015 are also available in CSV format. This dataset is publicly available on HydroShare27 at 10.4211/hs.60a890eb841c460192c03bb590687145. A detailed description of each dataset is provided below.
Crop Calendar for 23 irrigated and rainfed crops
Description: A crop calendar (CC) presents tabulated data compiled by combining harvested area statistics of various spatial units and their corresponding cropping calendars. Each entry in the CC includes the unit code, crop or sub-crop name, number of sub-crops, categorization (perennial, annual, fodder, or others), annual harvested area, and planting and maturity months. Separate crop calendars were prepared for both irrigated and rainfed crops for the years 2000, 2005, 2010, and 2015.
File format: CSV
Period: 2000 to 2015
File name: MIRCA-OS_year_system_version
Unit: harvested area (ha)
Where ‘year’ signifies the data year, and the ‘system’ indicates whether the harvested area pertains to an irrigated (assigned as ‘ir’) or rainfed (assigned as ‘rf’) system. ‘Version’ represents the version of the dataset.
Repository: HydroShare27
Monthly growing area grids (MGAG) for 23 irrigated and rainfed crops
Description: This dataset presents monthly growing area grids for 23 irrigated and 23 rainfed crops, in a spatial resolution of 5 arcminutes, for the years 2000, 2005, 2010, and 2015 (Fig. 6). It depicts the growing area of each crop per spatial unit within a grid cell from planting to maturity month.
Fig. 6.

The global monthly irrigated area of selected crops in the year 2015. Panels show monthly irrigated area maps for maize, rice, and wheat for the months of January, April, July, and October. Pixel values represent the percentage of a crop’s harvested area relative to the grid cell area.
File format: NetCDF
File name: MIRCA-OS_Crop_subcrop_year_system_version
where ‘crop’ denotes the crop name, ‘subcrop’ indicates multiple cropping. A numerical value is assigned to each subcrop following the crop name. For example, ‘Rice1’ signifies the rice crop growing in the first season. ‘year’ signifies the data year, and ‘system’ indicates whether the growing area pertains to an irrigated (assigned as ‘ir’) or rainfed (assigned as ‘rf’) system. ‘Version’ is the version of the dataset.
Spatial Metadata:
Extent: X: −180° to +180°
Extent Y: −90° to +90°
Extent Z (month): A numeric value ranging from 1 to 12, each representing a monthly harvested area layer for each month.
Resolution: 5-arcminutes (0.083333 decimal degrees)
Coordinate reference system: longitude/latitude (WGS84 datum)
Units: growing area (ha)
Repository: HydroShare27
Maximum monthly growing area grids (MMGAG) for 23 irrigated and rainfed crops
Description: This dataset presents the maximum monthly growing area grids for 23 irrigated and 23 rainfed crops, in a spatial resolution of 5 arcminutes, for the years 2000, 2005, 2010, and 2015. A maximum monthly grid was determined as the maximum pixel value within each monthly grid without taking multiple cropping into account. These datasets are crucial for users keen to know about non-seasonal crop-specific maximum irrigated and rainfed harvested areas. Particularly for user groups aiming to simulate cropping seasons independently through various dynamic vegetation models, the MMGAG dataset proves to be highly beneficial21.
File format: Geotiff
File name: MIRCA-OS_crop_year_system_version
where ‘crop’ represents the crop name, ‘year signifies the data year, and ‘system ‘indicates whether the harvested area pertains to an irrigated (assigned as ‘ir’) or rainfed (assigned as ‘rf’) system, ‘version’ is the version of the dataset.
Spatial Metadata:
Extent: X: −180° to +180°
Extent Y: −90° to +90°
Resolution: 5-arcminutes (0.083333 decimal degrees) and 30-arcminutes (0.5 decimal degrees)
Coordinate reference system: longitude/latitude (WGS84 datum)
Units: harvested area (ha)
Repository: HydroShare27
Maximum monthly cropped area grids (MMCAG) for either all irrigated crops, all rainfed crops, or the total of irrigated and rainfed crops
Description: These datasets represent the maximum monthly cropped area grids for 23 irrigated and 23 rainfed crops, in a spatial resolution of 5 arcminutes, for the years 2000, 2005, 2010, and 2015. The maximum monthly cropped area grids of irrigated and rainfed crops were determined by summing the monthly growing area grids of all crops and then selecting the maximum grid cell value from those summed areas. These datasets reveal the maximum monthly cropping extent or the maximum share of the irrigated and rainfed cropping area used in a particular year.
File format: Geotiff
File name: MIRCA-OS_year_system_version
where ‘year signifies the data year, and ‘system ‘indicates whether the harvested area pertains to an irrigated (assigned as ‘ir’), rainfed (assigned as ‘rf’) system or total(assigned as ‘tot’), ‘version’ is the version of the dataset.
Spatial Metadata:
Extent: X: −180° to +180°
Extent Y: −90° to +90°
Resolution: 5-arcminutes (0.083333 decimal degrees) and 30-arcminutes (0.5 decimal degrees)
Coordinate reference system: longitude/latitude (WGS84 datum)
Units: harvested area (ha)
Repository: HydroShare27
Annual crop harvested area grids for 23 irrigated and rainfed crops
Description: These data represent annual harvested area grids of 23 irrigated and 23 rainfed crops in 5 arcminutes spatial resolution for 2000, 2005, 2010, and 2015 (Figs. 7, 8). For crops with a single cropping season, the annual crop harvested area was determined as the maximum pixel value of that specific crop’s monthly harvested area grids. For those crops with multiple cropping, an annual harvested area was determined as the sum of each sub-crop’s maximum monthly harvested area grids.
Fig. 7.

Global irrigated areas of selected crops in the year 2015. Pixel values show the harvested area as a percentage of the grid cell area.
Fig. 8.

Global rainfed area of selected crops in the year 2015. Pixel values show the harvested area of rainfed crops in the year 2015 as a percentage of grid cell area.
File format: Geotif
File name: MIRCA-OS_crop_year_system_version
Period: 2000 to 2015
where ‘crop’ represents the crop name, ‘year signifies the data year, and ‘system ‘indicates whether the harvested area pertains to an irrigated (assigned as ‘ir’) or rainfed (assigned as ‘rf’) system, ‘version’ is the version of the dataset.
Spatial Metadata:
Extent: X: −180° to +180°
Extent Y: −90° to +90°
Resolution: 5-arcminutes (0.083333 decimal degrees) and 30-arcminutes (0.5 decimal degrees)
Coordinate reference system: longitude/latitude (WGS84 datum)
Units: harvested area (ha)
Repository: HydroShare27
Technical Validation
Temporal continuity
One limitation of many global datasets is the lack of temporal continuity, as the methodology and input data sources used often vary across different years. This inconsistency presents a challenge for conducting time series analysis and for reliably assessing patterns of change. Because no spatially detailed time-vary datasets exist for validation, we conducted an internal assessment of the pixel-level temporal continuity of the MIRCA-OS dataset by fitting a linear regression and calculating the Root Mean Square Percentage Error (RMSPE). RMSPE was computed as the square root of the mean of the squared relative errors between the MIRCA-OS harvested areas and the values of fitted linear regression, divided by the MIRCA-OS pixel values. This method allows us to quantify temporal variability in our dataset by assuming a linear trend over time, comparing the observed harvested areas for both irrigated and rainfed crops to those predicted by the fitted linear regression models.
For each crop, we then mapped the spatial distribution of the calculated RMSPE values and developed histograms showing the overall distribution of RMSPE values (Figs. 9, 10; Supplementary Figure S1-S46). For most crops, we find no substantial temporal deviation of MIRCA-OS pixel values from the predicted values of the linear regression models. Most pixels across all crops exhibit RMSPE values below 5%. Notably, irrigated areas showed less temporal variation compared to rainfed crops. However, only irrigated rice in Madhya Pradesh, India, demonstrated relatively higher temporal inconsistency, but this was limited to fewer pixels. While most rainfed crops exhibited temporal consistency, certain exceptions were observed, including rainfed fodder in Nebraska, USA, and France, rainfed rice in Uttar Pradesh, India, and rainfed wheat in Canada, which showed relatively higher temporal variability. This aligns with expectations, as rainfed areas tend to experience greater variability year to year compared to irrigated areas.
Fig. 9.

Spatial distribution of the RMSPE for irrigated rice between 2000 to 2015. Maps depict the temporal continuity of irrigated area estimates, where lower RMSPE values (cool colors) indicate strong temporal consistency and higher RMSPE values (warm colors) reflect greater temporal variability relative to a linear regression. Corresponding histograms show the overall distribution of RMSPE values.
Fig. 10.

Spatial distribution of RMSPE for rainfed wheat between 2000 and 2015. Maps depict the temporal continuity of rainfed area estimates, where lower RMSPE values (cool colors) indicate strong temporal consistency and higher RMSPE values (warm colors) reflect greater temporal variability relative to a linear regression. Corresponding histograms show the overall distribution of RMSE values.
Global comparisons
The MIRCA-OS dataset was evaluated by comparing it with all available global and regional data products on crop-specific irrigated areas. First, we compared the presence/absence and relative difference of crop-specific irrigated and rainfed harvested areas between MIRCA-OS for the year 2000 and the original MIRCA2000 dataset for four major crops — maize, rice, soybeans, and wheat (Figs. 11, 12). The spatial agreement between the MIRCA-OS and MIRCA2000 datasets is also depicted in stacked bar charts, demonstrating the agreement levels for irrigated and rainfed crops ranked from highest to lowest agreement (Figs. 13, 14). In addition, we also quantified the level of agreement between the two datasets using the intersection over union (IoU) score (Table 4), which is the ratio of the area of intersection to the area of union35. The IoU scores enable quantifying a pixel-level similarity between the crop-specific harvested area of MIRCA-OS and MIRCA2000 datasets.
Fig. 11.

Pixel-level spatial agreement between MIRCA-OS and MIRCA2000. Locations of agreement (depicted in blue) or disagreement (depicted in orange and red) are shown for the irrigated extent of four primary crops—maize, rice, soybeans, and wheat – for the year 2000.
Fig. 12.

Pixel-level absolute relative difference between MIRCA-OS and MIRCA2000 for four primary irrigated crops for the year 2000.
Fig. 13.

Spatial agreement for irrigated crops between MIRCA-OS and MIRCA2000 datasets for the year 2000. Each bar in the chart represents a different crop type and shows the proportion of agreement and exclusive presence in the two datasets. Bars are ordered based on their percentage of spatial agreement.
Fig. 14.

Spatial agreement for rainfed crops between MIRCA-OS and MIRCA2000 datasets for the year 2000. Each bar in the chart represents a different crop type and shows the proportion of agreement and exclusive presence in the two datasets. Bars are ordered based on their percentage of spatial agreement.
Table 4.
IoU scores of agreement between MIRCA-OS and MIRCA2000 for the year 2000.
| Crop | IoU Score for: | |
|---|---|---|
| Irrigated crops | Rainfed crops | |
| Barley | 0.502 | 0.495 |
| Cassava | 0.347 | 0.652 |
| Cocoa | 0.285 | 0.517 |
| Coffee | 0.420 | 0.580 |
| Cotton | 0.477 | 0.500 |
| Fodder | 0.453 | 0.621 |
| Groundnuts | 0.491 | 0.575 |
| Maize | 0.600 | 0.628 |
| Millet | 0.492 | 0.549 |
| Oil palm | 0.10 | 0.537 |
| Other annuals | 0.650 | 0.607 |
| Other perennials | 0.497 | 0.545 |
| Potatoes | 0.507 | 0.515 |
| Pulses | 0.460 | 0.644 |
| Rapeseed | 0.445 | 0.610 |
| Rice | 0.521 | 0.500 |
| Rye | 0.514 | 0.593 |
| Sorghum | 0.526 | 0.569 |
| Soybeans | 0.581 | 0.574 |
| Sugar beet | 0.404 | 0.489 |
| Sugar cane | 0.428 | 0.440 |
| Sunflower | 0.557 | 0.515 |
| Wheat | 0.620 | 0.555 |
A score of 0 indicates no spatial overlap, and a score of 1 indicates perfect spatial agreement.
The presence/absence maps (Fig. 11) and relative difference maps (Fig. 12) show that the two datasets agree well overall. However, for maize in Russia, India, and China and for wheat and soybeans in the United States, the datasets exhibit a higher absolute relative difference. Given the differences in input datasets (including CE, HA, and AEI) and underlying statistics between MIRCA-OS and MIRCA2000, some differences are not surprising (e.g., rice in Peru, Spain, and France (except two provinces); wheat in Canada, Poland, and the United Kingdom; soybeans in central Brazil). Across all study crops, we find the most extensive agreement for maize, other annuals, and wheat, with lower levels of agreement for cassava, cocoa, and oil palm (Figs. 13, 14). Low levels of agreement with the original MIRCA2000 dataset for certain crops were primarily attributable to improved and more refined underlying crop-specific harvested area statistics.
Similarly, the IoU scores calculated for each irrigated and rainfed crop showed varying levels of agreement from crop to crop as well as between irrigated and rainfed systems, with the overall scores for rainfed systems showing better agreement (Table 4). For maize, other annuals, pulses, sorghum, soybeans, and wheat, there is a high similarity in the spatial distribution of irrigated and rainfed areas between the MIRCA-OS and MIRCA2000 datasets. IoU scores showed larger differences in the spatial distribution of irrigated areas for cassava, cocoa, coffee, and oil palm. This is mainly due to more comprehensive coverage of the underlying irrigated area statistics which were available for the development of each dataset. For example, MIRCA2000 did not report any irrigated area of cassava, cocoa, coffee, and oil palm for India, while our dataset contained substantial irrigated areas for those crops.
We also performed a pixel-level scatter plot analysis and calculated corresponding Pearson coefficients (Figs. 15, 16). We found relatively high coefficients for most crops and observed that the magnitudes of both irrigated and rainfed harvested areas were consistently lower for MIRCA-OS as compared to MIRCA2000. Major crops such as cotton, fodder, maize, sorghum, soybeans, and wheat exhibited a high pixel-level correlation between MIRCA-OS and MIRCA2000 datasets. In addition, for crops such as cocoa, groundnuts, other perennials, rice, and sugarcane, although they demonstrated low to moderate IoU scores, there was a notably higher correlation in a pixel-harvested area between the two datasets. Conversely, certain crops with relatively high IoU scores in spatial distribution (e.g., other annuals, potatoes, sunflowers) showed lower Pearson coefficients at the pixel level. This suggests significant differences in the pixel-level harvested area despite similar spatial distributions for these crops between the two datasets. Still, other crops such as cassava, coffee, and oil palm exhibited both low IoU scores and Pearson coefficients, indicating considerable disparities in both spatial distribution and pixel values of harvested areas between the datasets. Overall, despite considerable differences in input data and statistics between MIRCA2000 and MIRCA-OS, we find good agreement in both the spatial distribution and harvested area magnitude, particularly in the core breadbasket regions for each crop.
Fig. 15.

Hexagonal analysis of irrigated harvested areas in MIRCA-OS and MIRCA2000. The color bar indicates the number of grid cells within each hexagon. ‘r’ and ‘n’ represent the Pearson coefficient and the number of grid cells analyzed, respectively. The black line indicates the 1-to-1 line (i.e., no difference), while the red line represents the fitted linear regression.
Fig. 16.

Hexagonal analysis of rainfed harvested areas in MIRCA-OS and MIRCA2000. The color bar indicates the number of grid cells within each hexagon. ‘r’ and ‘n’ represent the Pearson coefficient and the number of grid cells analyzed, respectively. The black line indicates the 1-to-1 line (i.e., no difference), while the red line represents the fitted linear regression.
Moreover, we compared our MIRCA-OS rice annual harvested area dataset against the recent GloRice(I)36 dataset, which is a global gridded paddy rice distribution dataset covering the years 1961 to 2021. We extracted the NetCDF raster files for the years 2000, 2005, 2010, and 2015, which provided the maximum harvested area extent of each five-arc-minute resolution pixel covered by paddy rice. We then compared each year’s rice area map against the MIRCA-OS for the same period. The presence and absence maps (Fig. 17) demonstrated a high level of agreement between the two datasets for most countries. However, for Russia in 2015, our dataset displayed more pixels than the GloRice dataset.
Fig. 17.

Pixel-level spatial agreement on the total harvested area of rice between MIRCA-OS and GloRice from 2000 to 2015. Locations of agreement (depicted in blue) and disagreement (depicted in orange and red) are shown for the extent of rice. The bar chart on the right side shows the percentage levels of agreement and disagreement between the two datasets.
A pixel-level hexagonal plot analysis and its corresponding Pearson coefficients, shown in Fig. 18, reveal high Pearson coefficients for all years, with values ranging from 0.85 to 0.9, indicating a strong correlation between the MIRCA-OS and GloRice datasets. However, the level of agreement slightly diminishes over time.
Fig. 18.

Hexagonal analysis of the total harvested area of rice in MIRCA-OS and GloRice from 2000 to 2015. The color bar indicates the number of grids within each hexagon. ‘r’ and ‘n’ represent the Pearson coefficient and the number of grid cells analyzed, respectively. The black line indicates the 1-to-1 line (i.e., no difference), while the red line represents the fitted linear regression.
Continental-level comparison Europe
We utilized the European Irrigation Map for 2010 (EIM2010)37, an updated version of EIM2000, which provides a 10 km × 10 km resolution of irrigated area per grid cell for 14 major crops based on the 2010 agricultural census. We compared the irrigated area data from EIM2010 with the annual irrigated area dataset from MIRCA-OS for the year 2010. The spatial presence maps (Fig. 19) and the estimated IoU scores indicated a generally high level of agreement between the MIRCA-OS and EIM2010 datasets regarding the spatial distribution of irrigated areas across Europe. These results suggest that the datasets align well for maize and potatoes, with more variability observed for rice and sugar beet. The MIRCA-OS dataset reports a larger irrigated rice area than the EIM2010 dataset. This discrepancy might be due to different methodologies or data sources used in compiling the datasets.
Fig. 19.

Pixel-level spatial agreement on irrigation presence between MIRCA-OS and EIM2010 for 2010. Locations of agreement (depicted in blue) and disagreement (depicted in orange and red) are shown for the irrigated extent of four primary crops—maize, potatoes, rice, and sugar beet in Europe. The bar chart on the right side shows the percentage levels of agreement and disagreement between the two datasets.
The IoU scores shown in Table 5 revealed that for most crops, the MIRCA-OS and EIM2010 datasets, developed based on different approaches and assumptions, have a moderate level of agreement. However, a lower level of agreement was observed for some crops, such as pulses, rice, and rapeseed. In these crops, the EIM2010 dataset has more aerial coverage, particularly in Norway and Sweden, while our dataset showed no irrigated area for these crops based on the collected statistics.
Table 5.
IoU scores of spatial agreement between MIRCA-OS and EIM2010 irrigated crops for 2010.
| Crop | IoU score |
|---|---|
| Maize | 0.534 |
| Potatoes | 0.415 |
| Pulses | 0.264 |
| Rice | 0.249 |
| Rapeseed | 0.209 |
| Sugar beet | 0.308 |
| Sunflower | 0.441 |
A score of 0 indicates no spatial overlap, and a score of 1 indicates perfect spatial agreement.
A pixel-level hexagonal plot analysis and its corresponding Pearson coefficients shown in Fig. 20 reveal moderate to high Pearson coefficients for most crops, although lower coefficients were observed, particularly for sugar beet, sunflower, and rice. For rice, our MIRCA-OS dataset, as shown in Fig. 19, has more aerial coverage than the EIM2010 dataset. For sunflowers, our dataset showed no irrigated sunflower areas in Norway, Sweden, and the UK, while EIM2010 indicated a considerable irrigated area in these regions. This discrepancy resulted in lower Pearson coefficients for these crops.
Fig. 20.

Hexagonal analysis of irrigated harvested areas in MIRCA-OS and EIM2010. The color bar indicates the number of grids within each hexagon. ‘r’ and ‘n’ represent the Pearson coefficient and the number of grid cells analyzed, respectively. The black line indicates the 1-to-1 line (i.e., no difference), while the red line represents the fitted linear regression.
Country-level comparisons United States
We also validated MIRCA-OS against remote sensing products (combining remotely sensed irrigation maps with remotely sensed maps of crop type) where possible. In the United States, we compared MIRCA-OS with a combination of the Irrigated Agriculture Dataset for the United States38 (MIrAD-US) (250 m resolution) and the United States Department of Agriculture’s CropScape cropland data layer39 (30 m resolution). The latest version of MIrAD provides a comprehensive irrigated area dataset for 2002, 2007, 2012, and 2017. To ensure that the data falls within our period of analysis, we first temporally interpolate the MIrAD maps of 2007 and 2012 to produce an irrigated area map for 2010. This was repeated for the year 2012 and 2017 MIrAD maps to produce the year 2015 irrigated area map. As an example, for the soybean crop type map from CropScape for the year 2010, any pixels that spatially overlapped with the MIrAD irrigated area for 2010 were defined as irrigated soybean. Then the number of irrigated soybean pixels (30 m) falling within a 5-arcminute pixel was summed and then multiplied by 0.09 to calculate the irrigated soybean area in hectares for that 5-arcminute pixel (i.e., the same resolution as MIRCA-OS). This was repeated for all crops and for all year 2015 maps. We then performed a pixel-level comparison of estimated hectares with MIRCA-OS (Figs. 21, 22).
Fig. 21.

Pixel-level spatial agreement on irrigation presence between MIRCA-OS and MirAD-Cropscape for the year 2015. Locations of agreement (depicted in Light blue) or disagreement (depicted in orange and red) are shown for the irrigated extent of four primary crops— cotton, maize, soybeans, and wheat. The bar chart on the right side shows the percentage levels of agreement and disagreement between the two datasets.
Fig. 22.

Hexagonal analysis of irrigated harvested areas in MIRCA-OS and MirAD-Cropscape for 2015. The color bar indicates the number of grids within each hexagon. ‘r’ and ‘n’ represent the Pearson coefficient and the number of grid cells analyzed, respectively. The black line indicates the 1-to-1 line (i.e., no difference), while the red line represents the fitted linear regression.
While all the spatial presence maps revealed good agreement between MIRCA-OS and MIrAD-Cropscape products (Figs. 21, 22), with variations between crops, the hexagonal analysis showed a lower Pearson coefficient for all crops except cotton. For instance, maize, wheat, and soybeans showed a high IoU score and high spatial agreement, but a lower Pearson coefficient indicates that even though both datasets have shown a similar spatial distribution, the pixel-level irrigated area (value) significantly differs between the two datasets. We also found that the IoU scores improved between 2010 and 2015 (Table 6) and that these scores tended to positively correlate with levels of production, with maize, soybean, and wheat showing the highest spatial agreements. The hexagonal analysis highlighted that our MIrAD-Cropscape dataset often showed higher pixel values for certain crops compared to MIRCA-OS. Because previous work has shown that the AEI product used in our analysis has a very high level of agreement with the MIrAD product, the main source of differences for the crop-specific comparisons is likely attributable to the combined pixel-level accuracy of the Cropscape and MIrAD products – both of which are independently consistent with US county-level harvested area and total irrigated area statistics, respectively. Thus, the limitations of the data fusion that we perform (based on a method of MIrAD-Cropscape spatial overlap) mean that such a comparison with MIRCA-OS (while the best possible at present) should be viewed with caution.
Table 6.
IoU scores of spatial agreement between MIRCA-OS and MirAD-Cropscape irrigated crops for the years 2010 and 2015.
| Crop | IoU score | |
|---|---|---|
| 2010 | 2015 | |
| Barley | 0.429 | 0.404 |
| Cotton | 0.501 | 0.567 |
| Fodder | 0.574 | 0.659 |
| Groundnuts | 0.509 | 0.425 |
| Maize | 0.569 | 0.768 |
| Other annuals | 0.493 | 0.476 |
| Other perennials | 0.429 | 0.511 |
| Potatoes | 0.384 | 0.451 |
| Pulses | 0.373 | 0.366 |
| Rapeseed | 0.100 | 0.185 |
| Rice | 0.209 | 0.219 |
| Rye | 0.183 | 0.294 |
| Sorghum | 0.416 | 0.535 |
| Soybeans | 0.593 | 0.750 |
| Sugar beet | 0.309 | 0.334 |
| Sugar cane | 0.361 | 0.325 |
| Sunflower | 0.146 | 0.243 |
| Wheat | 0.550 | 0.669 |
A score of 0 indicates no spatial overlap, and a score of 1 indicates perfect spatial agreement. Cassava, cocoa, coffee, millet, and oil palm are not cultivated in the US.
Brazil
We also performed similar comparisons for selected crops and countries with remotely sensed crop-type maps. For soybean in Brazil, we used remotely sensed annual maps of soybean extent (2001–2015; 0.00025° or approximately 27 meters) from the University of Maryland’s Global Land Analysis and Discovery (GLAD) Laboratory40. We aggregated this data to a 5-arc-minute resolution for the years 2001, 2005, 2010, and 2015. We interpolated the MIRCA-OS soybeans annual harvested area map for the year 2001 using the 2000 and 2005 maps. To compare to the aggregated GLAD soybean product, we then summed the MIRCA-OS irrigated and rainfed harvested areas for soybeans. The resulting presence-absence map revealed smaller disparities between the two datasets, with MIRCA-OS having a larger extent of harvested area (Fig. 23). However, MIRCA-OS only includes diffuse soybean areas in these places, and it captures the core soybean regions well and agrees with GLAD.
Fig. 23.

Pixel-level spatial agreement on soybean presence between MIRCA-OS and GLAD for the years 2001 to 2015. Locations of agreement (depicted in Light blue) or disagreement (depicted in orange and red) are shown for the extent of soybeans. The bar chart on the right side shows the percentage levels of agreement and disagreement between the two datasets.
Usage Notes
We expect that MIRCA-OS can enable a suite of spatially refined assessments of changes in global cropping patterns and that our products will directly benefit numerous international development and research initiatives. Given the potential for broad usage, it is essential to note the key limitations of these products to ensure their proper use and to prevent their over-extension beyond what they can reasonably show.
One of the main uncertainties of our products relates to the input datasets, including the agricultural statistics and gridded maps. In particular, there is a lack of consistent and spatially disaggregated crop-specific irrigated harvested areas in many countries22. While we utilized sub-national agricultural statistics to the greatest extent available, there is a significant scarcity of such data in many parts of Asia, South America, Africa, and small island nations at national and sub-national levels. For these data-scarce regions, we used national-level statistics from AQUASTAT. For other countries (such as Brazil, Argentina, and Russia), subnational statistics on total harvested areas were available, but information on crop-specific irrigated areas was limited. The granularity of these underlying agricultural statistics is fundamental to the accuracy of global gridded products (including MIRCA-OS), and a comprehensive country-by-country description of all data collection, processing, and harmonization is available in the Supplementary Information. In regions where harvested area statistics are only available at coarser spatial scales, users are cautioned that evaluations of fine-scale changes in irrigated areas may not be reliable and should be verified by independent sources of information to the greatest extent possible. As we ensure that allocated harvested areas are consistent within a spatial unit, it is recommended to interpret the spatial and temporal trends of our products aggregated to the appropriate administration levels. Fusing our census-based downscaling approach with remote sensing methods could help overcome some of these data limitations by providing additional spatially detailed information on rainfed/irrigation status and crop type. Such fusion approaches could enable the production of finer-resolution datasets with improved timeliness and frequency
Another limitation within the MIRCA-OS data products is the use of static, monthly crop calendars. While the information used to develop these products represents the best available data on crop planting and harvesting periods, it is well known that farmers employ a range of dates within suitable planting and harvesting windows depending on prevailing weather conditions and other information. However, such information on planting and harvesting remains difficult to gather comprehensively and consistently. In the future, cropping calendars that are time-varying (i.e., annually reported) and probabilistic (i.e., reporting the fraction of planted area sown/harvested within different parts of the planting/harvesting windows) can meaningfully improve our data products by better accounting for factors such as climatic changes and technological improvements41–44.
With these considerations in mind, the MIRCA-OS data products represent an important advance in the ability to evaluate crop-specific changes in irrigated and rainfed areas through time. MIRCA-OS can serve as an improved underpinning for a suite of global assessments related to agriculture, food security, water sustainability, environmental burdens, and climate resilience.
Supplementary information
Acknowledgements
We thank Gambhir Lamsal and Landon Marston for providing the harvested area statistics for the United States. E.A.K. and K.F.D. were supported by USDA Grant no. 2022-67019-37180 and the University of Alabama Global Water Security Center. E.A.K. was supported by the Consortium of Universities for the Advancement of Hydrologic Sciences (CUAHSI) through the Hydroinformatics Innovation Fellowship. S.H. was supported by the National Science Foundation Digital Transformation of Development Fellowship (#DGE- 2125913) and the National Science Foundation Graduate Research Fellowships Program (#DGE-1752814). S.S. was supported by the Deutsche Forschungsgemeinschaft (D.F.G., German Research Foundation) – SFB 1502/1-2022 – Projektnummer: 450058266.
Author contributions
K.F.D. and S.S. conceived the idea. E.A.K. led the study. K.F.D. coordinated the study. E.A.K., S.S., K.F.D., P.M., S.H., D.R., T.A. and W.X. collected the necessary input data. J.J. prepared the crop-specific calendar for irrigated and rainfed crops. E.A.K. and K.O. wrote the code. E.A.K., K.F.D. and S.S. conducted the analysis and prepared the data products. E.A.K. and K.F.D. drafted the initial manuscript. All authors provided revisions to the manuscript.
Code availability
All code used to prepare the MIRCA-OS monthly irrigated and rainfed cropped area dataset is freely available on GitHub: https://github.com/EndiKebede/MIRCA-OS_Code.
Competing interests
The authors declare no competing interests.
Footnotes
Publisher’s note Springer Nature remains neutral with regard to jurisdictional claims in published maps and institutional affiliations.
Contributor Information
Endalkachew Abebe Kebede, Email: endiabe@udel.edu.
Kyle Frankel Davis, Email: kfdavis@udel.edu.
Supplementary information
The online version contains supplementary material available at 10.1038/s41597-024-04313-w.
References
- 1.Poore, J. & Nemecek, T. Reducing food’s environmental impacts through producers and consumers. Science (1979)360, 987–992 (2018). [DOI] [PubMed] [Google Scholar]
- 2.Food and Agriculture Organization of the United Nations. FAOSTAT Statistical Database. Rome. https://www.fao.org/faostat/en/#data/QCL (2022).
- 3.Hoekstra, A. Y. & Mekonnen, M. M. The water footprint of humanity. Proceedings of the National Academy of Sciences109, 3232–3237 (2012). [DOI] [PMC free article] [PubMed] [Google Scholar]
- 4.Curtis, P., Slay, C., Harris, N., Tyukavina, A. & Hansen, M. Classifying drivers of global forest loss. Science (1979)361, 1108–1111 (2018). [DOI] [PubMed] [Google Scholar]
- 5.Zabel, F. et al. Global impacts of future cropland expansion and intensification on agricultural markets and biodiversity. Nat Commun10, 2844 (2019). [DOI] [PMC free article] [PubMed] [Google Scholar]
- 6.Center for International environmental Law. Fossils, Fertilizers, and False Solutions How Laundering Fossil Fuels in Agrochemicals Puts the Climate and the Planet at Risk. https://www.ciel.org/reports/fossil-fertilizers (2022).
- 7.Foley, J. A. et al. Global Consequences of Land Use. Science (1979)309, 570–574 (2005). [DOI] [PubMed] [Google Scholar]
- 8.Vilà-Guerau de Arellano, J. et al. Advancing understanding of land–atmosphere interactions by breaking discipline and scale barriers. Ann N Y Acad Sci1522, 74–97 (2023). [DOI] [PubMed] [Google Scholar]
- 9.Siebert, S. et al. A global data set of the extent of irrigated land from 1900 to 2005. Hydrol Earth Syst Sci19, 1521–1545 (2015). [Google Scholar]
- 10.Deines, J. M., Kendall, A. D. & Hyndman, D. W. Annual Irrigation Dynamics in the U.S. Northern High Plains Derived from Landsat Satellite Data. Geophys Res Lett44, 9350–9360 (2017). [Google Scholar]
- 11.Nagaraj, D., Proust, E., Todeschini, A., Rulli, M. C. & D’Odorico, P. A new dataset of global irrigation areas from 2001 to 2015. Adv Water Resour152, 103910 (2021). [Google Scholar]
- 12.Xie, Y., Gibbs, H. K. & Lark, T. J. Landsat-based Irrigation Dataset (LANID): 30m resolution maps of irrigation distribution, frequency, and change for the US, 1997–2017. Earth Syst. Sci. Data13, 5689–5710 (2021). [Google Scholar]
- 13.Food and Agriculture Organization of the United Nations. AQUASTAT—FAO’s global information system on water and agriculture. Rome. http://www.fao.org/nr/water/aquastat/main/index.stm (2022).
- 14.Eurostat. Statistical Office of the European Union. https://ec.europa.eu/eurostat (2023).
- 15.Fischer, G. et al. Global Agroecological Zones (GAEZ v3.0), IIASA, Laxenburg, Austria and FAO, Rome, Italy, 2012. (2012).
- 16.Fischer, G. et al. Global Agro-Ecological Zone V4 – Model Documentation. Global agro-ecological zone V4 – Model documentation10.4060/cb4744en (2021).
- 17.Grogan, D., Frolking, S., Wisser, D., Prusevich, A. & Glidden, S. Global gridded crop harvested area, production, yield, and monthly physical area data circa 2015. Sci Data9, 1–16 (2022). [DOI] [PMC free article] [PubMed] [Google Scholar]
- 18.International Food Policy Research Institute (IFPRI) & International Institute for Applied Systems Analysis (IIASA). Global Spatially-Disaggregated Crop Production Statistics Data for 2005 Version 3.2. 10.7910/DVN/DHXBJX (2016).
- 19.International Food Policy Research Institute. Global Spatially-Disaggregated Crop Production Statistics Data for 2000 Version 3.0.7. 10.7910/DVN/A50I2T (2019).
- 20.International Food Policy Research Institute. Global Spatially-Disaggregated Crop Production Statistics Data for 2010 Version 2.0. 10.7910/DVN/PRFF8V (2019).
- 21.Portmann, F. T., Siebert, S. & Döll, P. MIRCA2000-Global monthly irrigated and rainfed crop areas around the year 2000: A new high-resolution data set for agricultural and hydrological modeling. Global Biogeochem Cycles24, n/a–n/a (2010). [Google Scholar]
- 22.Kebede, E. A. et al. Assessing and addressing the global state of food production data scarcity. Nat Rev Earth Environ10.1038/s43017-024-00516-2 (2024).
- 23.Jägermeyr, J. et al. Climate impacts on global agriculture emerge earlier in new generation of climate and crop models. Nat Food2, 873–885 (2021). [DOI] [PubMed] [Google Scholar]
- 24.jonas Jägermeyr, Christoph Müller, Sara Minoli, Deepak Ray & Stefan Siebert. GGCMI Phase 3 crop calendar. Zenodo (2021).
- 25.Goldewijk, K. K., Beusen, A., Doelman, J. & Stehfest, E. Anthropogenic land use estimates for the Holocene - HYDE 3.2. Earth Syst Sci Data9, 927–953 (2017). [Google Scholar]
- 26.Mehta, P. et al. Half of twenty-first century global irrigation expansion has been in water-stressed regions. Nature Water10.1038/s44221-024-00206-9 (2024).
- 27.Kebede, E., et al. A global open-source dataset of monthly irrigated and rainfed cropped areas (MIRCA-OS) for the 21st century. HydroShare10.4211/hs.60a890eb841c460192c03bb590687145 (2024). [DOI] [PubMed]
- 28.Global Administrative Areas. GADM database of Global Administrative Areas, version 4.1. https://gadm.org/download_country.html (2023).
- 29.FEWS NET. Famine Early Warning Systems Network (FEWS NET) Data Center. Crop Plantation and Production Information Including Area Harvested, Planted, Quantity Produced, and Yield. https://fdw.fews.net/data-explorer/crop (2024).
- 30.CountrySTAT. Official Statistics through the CountrySTAT Food and Agriculture Data Network. https://www.fao.org/in-action/countrystat/en/ (2022).
- 31.United States Department of Agriculture (USDA) National Agricultural Statistics Service (NASS). The Quick Stats Database. https://quickstats.nass.usda.gov/ (2023).
- 32.Food and Agriculture Organization of the United Nations. AQUASTAT - Irrigated crop calendars. https://www.fao.org/aquastat/en/databases/crop-calendar (2023).
- 33.Laborte, A. G. et al. RiceAtlas, a spatial database of global rice calendars and production. Sci Data4, 170074 (2017). [DOI] [PMC free article] [PubMed] [Google Scholar]
- 34.Monfreda, C., Ramankutty, N. & Foley, J. A. Farming the planet. Part 2: The geographic distribution of crop areas, yields, physiological types, and NPP in the year 2000. Global Biogeochemical Cycles22, GB1022, 10.1029/2007GB002947 (2008). [Google Scholar]
- 35.Rezatofighi, H. et al. Generalized Intersection over Union: A Metric and A Loss for Bounding Box Regression.
- 36.Xie, H. et al. GloRice (I): Gridded paddy rice distribution for the years 1961 to 2021. (2024). [DOI] [PMC free article] [PubMed]
- 37.Zajac, Z. et al. Estimation of spatial distribution of irrigated crop areas in Europe for large-scale modelling applications. Agric Water Manag266, 107527 (2022).
- 38.Pervez, M. S. & Brown, J. F. Mapping irrigated lands at 250-m scale by merging MODIS data and National Agricultural Statistics. Remote Sens (Basel)2, 2388–2412 (2010). [Google Scholar]
- 39.United States Department of Agriculture (USDA) National Agricultural Statistics Service (NASS). Cropland Data Layer. Marketing and Information Services Office, Washington, D.C. https://croplandcros.scinet.usda.gov/ (2024).
- 40.Song, X.-P. et al. Massive soybean expansion in South America since 2000 and implications for conservation. Nat Sustain4, 784–792 (2021). [DOI] [PMC free article] [PubMed] [Google Scholar]
- 41.Yang, Y. et al. Characterizing spatiotemporal patterns of crop phenology across North America during 2000–2016 using satellite imagery and agricultural survey data. ISPRS Journal of Photogrammetry and Remote Sensing170, 156–173 (2020). [Google Scholar]
- 42.Luo, Y., Zhang, Z., Chen, Y., Li, Z. & Tao, F. ChinaCropPhen1km: a high-resolution crop phenological dataset for three staple crops in China during 2000-2015 based on leaf area index (LAI) products. Earth Syst Sci Data12, 197–214 (2020). [Google Scholar]
- 43.Mori, A., Doi, Y. & Iizumi, T. GCPE: The global dataset of crop phenological events for agricultural and earth system modeling. Journal of Agricultural Meteorology79, 120–129 (2023). [Google Scholar]
- 44.Minoli, S., Egli, D. B., Rolinski, S. & Müller, C. Modelling cropping periods of grain crops at the global scale. Glob Planet Change174, 35–46 (2019). [Google Scholar]
- 45.USDA NASS. The Quick Stats Database. https://quickstats.nass.usda.gov/ (2022).
- 46.Lee, D. et al. HarvestStat Africa-Harmonized Subnational Crop Statistics for Sub-Saharan Africa. EarthArXiv. 10.5061/dryad.vq83bk42w (2024).
- 47. Lamsal, G. & Marston, L T. HarvestGRID: High-resolution harvested crop areas of the United States from 1981 to 2019. EarthArXiv10.31223/X5FH78 (2024).
Associated Data
This section collects any data citations, data availability statements, or supplementary materials included in this article.
Supplementary Materials
Data Availability Statement
All code used to prepare the MIRCA-OS monthly irrigated and rainfed cropped area dataset is freely available on GitHub: https://github.com/EndiKebede/MIRCA-OS_Code.