

Abstract
The early step in triploblastic embryo differentiation is the formation of the three germ layers. Maternal pioneer transcription factors (TFs) bind to embryonic enhancers before zygotic genome activation, initiating germ layer specification. While maternal TFs’ role in establishing epigenetic marks is known, how early pluripotent cells gain spatially restricted epigenetic identities remains unclear. We show that by the early gastrula stage, H3K4me1-marked regions become distinct in each germ layer, with certain chromatin regions forming high density H3K4me1 marked regions (HDRs). Genes associated with these HDRs are more robustly expressed compared to those associated with low density H3K4me1 marked regions LDRs in the genome. This process is driven by the sequential actions of maternal and zygotic factors. Knockdown of key maternal endodermal TFs (Otx1, Vegt and Foxh1) leads to a loss of endodermal H3K4me1 marks in endoderm, with a concurrent emergence of ectodermal and mesodermal marks, indicating a shift in chromatin state. This work highlights the importance of coordinated activities of maternal and zygotic TFs in defining the regionally-resolved and dynamic process of chromatin modification conferred by H3K4me1 in the early Xenopus embryo.
Keywords: zygotic genome activation, canalization, super enhancers, gene expression, epigenetics, robustness, histone modification, transcription factors
Introduction
Following fertilization, the newly formed embryo transitions from a totipotent state to a collection of pluripotent zygotic cells. During this process the transcriptionally silent embryonic genome undergoes zygotic genome activation (ZGA), to initiate the establishment of developmental programs for the three primary germ layers. Crucial to this process is the action of maternal products, including transcription factors (TFs), which are accumulated in the egg during oogenesis. While the role of maternal TFs in coordinating the initial transcription of the zygotic genome and germ layer differentiation has been extensively studied (Paraiso et al., 2020; Blitz and Cho, 2021; Wu and Vastenhouw, 2020), their involvement in the differentiation of chromatin landscape is not well understood. Examining the role of TFs in embryonic chromatin is challenging due to a rapid rise in cellular heterogeneity during early development, along with morphogenetic movements dynamically affecting cell-cell interactions. However, by focusing on the role of maternal TFs in sculpting the chromatin landscape during the earliest stages of germ layer specification, when transcription from the embryonic genome has not yet begun and the number of different cell types is minimal, we can avoid these complications.
In Xenopus embryos, the three germ layers form along the animal-vegetal (AV) axis. Specifically, ectoderm is formed in the animal pole, endoderm is formed in the vegetal pole, and mesoderm is induced in the equator between the animal and the vegetal poles. During the early cleavage divisions maternally deposited mRNAs and proteins are inherited by individual blastomeres. Many maternal products show localized expression, thereby giving rise to an asymmetric segregation of cytoplasmic factors, including TFs, which differentially affect cellular differentiation (Cabral and Mowry, 2020). By altering transcriptomic profiles of cells along this initial AV axis and rapidly reprogramming the chromatin state of the embryonic genome, maternal TFs drive differential specification of germ layer cell identities. A network of maternal TFs encoding Fox, Sox and Pou family proteins acts through conserved mechanisms to program the cellular genome into the early embryonic states (Leichsenring et al., 2013; Chiu et al, 2014; Charney et al., 2017a; Gentsch et al., 2019; Pálfy et al., 2019; Veil et al., 2019). Recent work examining the function of vegetally localized maternal Otx1 and Vegt, together with Foxh1 show combinatorial binding of these TFs, prior to the appearance major epigenetic histone marking around enhancers (Charney et al.,2017a; Paraiso et al., 2019). This suggests the formation of enhanceosome complexes on the enhancers of target genes. These regulatory regions later become docking sites for numerous zygotically-expressed TFs involved in endoderm specification (Paraiso et al., 2019). Thus, maternal TFs are binding to enhancers long in advance of gene transcription and prior to formation of enhancer marks, which then are established at and after onset of ZGA.
Histone modifications are pivotal in the regulation of gene expression, particularly during the early stages of embryonic development, when the embryonic genome remains epigenetically naïve and undifferentiated for a limited period (Akkers et al., 2009; Vastenhouw et al., 2010; Gupta et al., 2014; Hontelez et al., 2015). One such modification, H3K4me1, is notably associated with the marking of active promoters and enhancers, and emerges around the onset of ZGA in Xenopus. The presence of H3K4me1, especially in the absence of H3K4me3, serves as a distinguishing feature of enhancers, differentiating them from proximal promoters (Heintzman et al., 2009). Additionally, the coexistence of H3K27ac with H3K4me1 distinguishes active enhancers from primed enhancers (Creyghton et al., 2010; Rada-Iglesias et al., 2011). Despite the crucial role of H3K4me1 in the making of enhancers and promoters, the precise mechanisms underlying its establishment and regulation remain largely unexplored during early embryogenesis.
In this study, we investigate how maternal TFs establish spatially restricted H3K4me1 marks in different germ layers. By the early gastrula stage, the H3K4me1 marked region becomes distinct within each germ layer, with certain chromatin regions forming high density H3K4me1 marked regions (HDRs). Genes associated with these HDRs are more robustly expressed compared to those associated with low density H3K4me1 marked regions (LDRs) in the genome. Inhibition of zygotic gene expression using α-amanitin, as well as the depletion of endodermally localized maternal TFs via MOs, demonstrated that the spatially restricted HDR marking along the AV axis requires the inputs of both maternal and zygotic TFs. In the absence of maternally deposited endodermal TFs, the endodermal chromatin state in vegetal tissue shifts towards a more mesoderm/ectoderm state. This work highlights the importance of coordinated activities of maternal and zygotic TFs in defining the regionally-resolved and dynamic process of chromatin modification conferred by H3K4me1 in the early Xenopus embryo.
Results
Establishment of distinct chromatin states by early gastrula stage
To understand the establishment of tissue-specific chromatin states, we dissected fixed Xenopus gastrulae (NF 10.25, 7 hours post-fertilization or hpf) along the AV axis into the ectoderm, mesoderm and endoderm germ layers. The chromatin state of regulatory regions (i.e. promoters and enhancers) was interrogated by performing H3K4me1 ChIP-seq and compared between the different tissues. By the early gastrula, select loci surrounding developmental genes already appear distinct between the different germ layers (Figure 1A). For example, genes that are zygotically-expressed in the endoderm (vegetal-most) such as gata6, nodal and hnf1b show a vegetal-animal gradation in H3K4me1 marking. Conversely, genes that are zygotically-expressed in the ectoderm (animal-most) such as bambi, foxi1 and klf17, show the strongest signals in the ectoderm sample, although the gradation is not as stark. The H3K4me1 markings are not limited to genes involved in germ layer patterning. We find that as early as the gastrula stage, genes involved in anterior-posterior (AP) regionalization of the embryo are already marked during the start of gastrulation. All four Hox clusters, which contain genes that regulate AP cell identity (Tschopp and Duboule, 2011), are marked by H3K4me1 in all three germ layers (Figure S1) prior to their expression. Among 38 annotated Hox TF encoding genes (Blitz et al., 2017), only 3 are expressed at a transcripts per million (TPM) > 1, while 16 show no detectable expression (TPM = 0) (Owens et al., 2016; Kondo et al., 2019). Only when the embryos reach the latest stages of gastrulation (NF 12.5, 10 hpf) do the majority of Hox genes show expression levels greater than 1 TPM. This demonstrates pre-marking of the Hox regulatory code prior to establishment of the AP axis. By performing peak calling on these ChIP-seq datasets, the majority of H3K4me1 peaks already appear to be distinct between each germ layer (Figure 1B, S2), while the rest are shared between two or all of the germ layers (including peaks in the Hox gene cluster).
Figure 1. Germ layer-specific distribution and ranking of H3K4me1 signals in the three germ layers at early gastrula.

(A) Genome browser of H3K4me1 ChIP-seq obtained from dissected ectoderm, mesoderm and endoderm near developmental genes. (B) Germ layer-specific H3K4me1 ChIP-seq signal in different combinations of ectoderm, mesoderm, and endoderm peaks. (C) Ranking of H3K4me1 signal in enhancer regions to identify HDRs and LDRs. In black are all identified regions obtained from the H3K4me1 ChIP. Highlighted are genes known to be important for each germ layer that is associated with a genomic region. (D) Average sizes of low H3K4me1 regions and HDRs in each germ layer. (E) Overlap of HDRs among the three germ layers showing germ-layer specific and germ-layer shared HDRs. LDR: low-density H3K4me1 regions, HDR: high-density H3K4me1 regions.
Previously, we showed that the regulatory regions of endodermally expressed genes are highly enriched with H3K4me1, suggesting that high density H3K4me1 marked peaks correlate with gene expression activity in these cells (Paraiso et al., 2019). To further study the difference of between the germ layer chromatin states marked by H3K4me1, we rank ordered enhancer regions of genes for each germ layer and identified the HDRs (high density H3K4me1 regions) (HDRs) using the method developed for identifying large cluster of enhancers, called super enhancers (SEs) (Figure 1C) (Whyte et al., 2013). The average length of HDRs marked by H3K4me1 is approximately 20kb for ectoderm, mesoderm and endoderm (Figure 1D). The size is slightly larger than the ~15kb average size of SEs in mouse embryonic stem cells (Whyte et al., 2013). We initially performed GO analysis of these genes, but were unable to identity useful terms. Therefore, we compared our results with published datasets of genes whose expression has been profiled in dissected embryonic tissue samples and genomic studies (Blitz et al., 2017; Paraiso et al, 2020). Manual inspection of HDRs for each germ layer show markings near genes which encode for regulators and expression markers representative of each germ layer tissue. Ectodermal HDRs are located near genes encoding ectodermal TFs such as sox3 (Rogers et al., 2009), and epidermally-expressed cement gland cytokeratin krt18 (LaFlamme and Dawid, 1990). In the mesoderm, HDRs mark genes encoding T-box TFs tbxt (Smith et al., 1991), eomes (Ryan et al., 1996) and zygotically-expressed vegt (Lustig et al., 1996; Zhang et al., 1996; Stennard et al., 1996; Horb & Thomsen, 1997); as well as negative feedback regulators of Fgf signaling spry1 and spry2, which regulate the morphogenetic movements of mesodermal cells (Nutt et al., 2001). Endoderm HDRs mark critical regulators of endodermal fate including foxa4 (Dirksen and Jamrich, 1992), mix1 (Rosa, 1989), mixer (Henry and Melton, 1998), sox17 (Hudson et al., 1997), and lhx1 (Taira et al., 1992). These results suggest that many TFs known to be critical for germ layer specific properties are closely associated with the germ layer specific H3K4me1 marked regions (Figure 1E, Table S1). We conclude that the H3K4me1 marked enhancers are already regionally distinct along the AV axis of the early Xenopus early gastrula embryo
Tissue specific HDR marking is associated with spatial-restriction and robustness in gene expression
While the role of promoters and enhancers during development has been well characterized, the role of HDRs in developmental systems is yet unclear. Here we examine the formation of germ layer-specific HDRs during spatial patterning of embryos. We assigned each HDR to the nearest gene(s) (Figure 2A, Table S2), and examined whether the transcriptional activity of the genes associated with HDRs are germ layer specific and quantitatively different from that of the other genes that are not associated with HDRs. While many HDR-associated genes showed specificity for each germ layer (92 for ectoderm, 144 for mesoderm, and 281 for endoderm), 95 HDRs are H3K4me1-marked across all three germ layers. This set of genes includes developmental genes that are required for tissue regionalization across both the dorsal-ventral (DV) axis (e.g. ventx1.1 and ventx2.1) and the AP axis (e.g. hoxb2 and hoxb4) rather than germ layer formation along the AV axis. HDR-associated genes are more highly expressed than low density H3K4me1 regions (LDRs) associated genes for all three germ layers (Figure 2B). Furthermore, the expression levels of each set of HDR associated genes show distinct spatial pattern consistent with their germ layer-specific H3K4me1 marking (Figure 2C). Ectoderm and endoderm HDR-associated genes are expressed in animal-vegetal and vegetal-animal gradients, respectively. Mesoderm HDR-associated genes are expressed in the embryo equator, and less so in the poles.
Figure 2. Genes associated with high density H3K4me1 marked-regions are tissue-specific and robustly expressed during development.

(A) Genes associated with HDRs for the three germ layers. (B) Expression of genes associated with either LDRs or HDRs in their respective tissues. (C) Distribution of the expression of genes associated with HDRs and their expression in the ectoderm, mesoderm and endoderm. (D) Coefficient of variation (COV) of gene expression from the RNA-seq of 15 embryos from 3 clutches at 7 hpf. Displayed are the COV for non-H3K4me1 (NH) associated, LDR associated and HDR associated genes. (E) COV of gene expression for genes that are either non-H3K4me1 (NH) associated, LDR associated or HDR associated genes. Contributions from maternal transcripts were excluded for this analysis. The expression levels are binned as 1–25, 25–50, 50–100, and 100+ TPM to account for variation caused by the noisy expression at low TPMs. Significance is tested by Wilcoxon Rank-Sum test. * = p-value < 0.01 and NS = not significant.
SEs defined by Mediator binding or H3K27ac have been proposed to confer robustness in gene expression (Whyte et al., 2013; Sengupta et al., 2015; Osterwalder et al., 2018). Here, we tested whether H3K4me1 marked HDR associated genes are expressed with lower expression variability than other genes. Multiple time-course transcriptomic datasets (collected at 30 minutes interval) from different embryo clutches were used (Collart et al., 2014; Owens et al., 2016; Figure S3A) to compare the coefficient of variation (COV) of zygotic gene expression in transcripts per million (TPM) across 11 time points from 4 hpf (NF 8) to 9 hpf (NF 11.5–12). Both HDR- and LDR-associated genes showed lower variation than genes that are non-H3K4me1 (NH) associated (Figure S3B). Because RNA-seq is generally noisy at lower levels of gene expression, we binned gene expression based on TPM levels and compared COV of genes in associated bins. In the lowest TPM bin, genes show similar COV across all three sets (Figure S3C). At higher TPM bins, where there is less technical noise, the NH genes maintain a similar level of COV as those in the low TPM bin. Genes associated with LDRs have lower COV than NH genes. Genes associated with HDRs showed the least variation.
Since these RNA-seq datasets are generated from pooled embryos, we measured the transcriptome of 15 embryos from 3 different clutches at 7 hpf (NF 10.25) so we can measure the COV at the individual embryo level (Figure S3D). Embryos from the same clutch showed more similar transcriptomes (Figure S3E). For each gene, we measured the COV. Among the genes with the least variation are well known germ layer patterning genes (e.g. crx, sox17a, tbxt and foxh1.2) and dorsal-ventral patterning genes (e.g. ventx2.2, wnt5b, fgf8 and lefty), many of which encode signaling molecules and transcription factors. Among the top 100, 37 are associated with HDRs and another 37 are associated with LDRs, suggesting an enrichment for genes with H3K4me1 marks. Indeed, gene enrichment analysis of HDR-associated genes, ranked by COV, reveals a significant enrichment in those with low COV (Figure S3F). As a group, HDR associated genes tend to have the lowest COV, followed by LDR associated genes (Figure 2D). When comparing different expression levels, HDR associated genes consistently have the lowest variations in expression (Figure 2E), consistent with our previous findings.
Overall, our analysis shows two putative regulatory functions of HDRs during embryo development. These HDRs are associated with spatial patterning and robust expression of germ layer specific genes.
Maternal and zygotic requirements for establishment of chromatin states
Previous work has shown that maternal TFs play critical roles in the establishment of chromatin states using bulk embryo samples (Foo et al., 2014; Schulz et al., 2015; Leichsenring et al., 2013; Charney et al., 2017a; Paraiso et al., 2019; Gentsch et al., 2019; Pálfy et al., 2019; Veil et al., 2019). To delineate the roles of maternal and zygotic factors in the early stages of chromatin differentiation, an RNA polymerase II inhibitor, α-amanitin, was microinjected into 1-cell stage embryos (Chafin et al., 1995; Hontelez et al., 2015). We dissected early gastrula (NF 10.5, 7hpf) embryos with and without α-amanitin into the three germ layer regions and compared H3K4me1 marks. The loss of zygotic factors exerted variable effects on H3K4me1 deposition in different peak regions (Figure 3A). Near genes such as not, the H3K4me1 marking appeared largely unchanged across all three germ layers, even when zygotic gene expression was inhibited, suggesting that the H3K4me1 modification of the not gene is predominantly regulated by maternal factors. In the loci surrounding genes which are expressed in an animally-enriched manner such as bambi and klf17, the H3K4me1 marking is largely unchanged in the ectodermal and mesodermal tissues. However, these marks are somewhat increased in the endodermal tissue, particularly the marks upstream of the gene body, suggesting that the establishment of these marks is inhibited by zygotic factors. In the mesendodermally- or endodermally-expressed genes (e.g. frzb, foxa4 and nodal), H3K4me1 is more prominent in the endoderm, showing a distinct vegetal-animal gradation in uninjected embryo tissues. The marking in the endoderm is severely disrupted in the presence of α-amanitin, and resembles that of the wild type ectodermal or mesodermal tissue. The reduction in H3K4me1 marking spans promoter-proximal, intronic and intergenic regions suggesting that the deposition of both promoter and enhancer markings are inhibited. This result suggests that zygotic factors are required for the deposition of H3K4me1 marking in these regions. This also raises the question of whether the H3K4me1 marking of endodermally expressed genes is driven by zygotic TFs, while the H3K4me1 marking in animally pole regions is predominantly controlled by maternal factors. The mechanisms underlying this difference is unknown.
Figure 3. Maternal and zygotic requirements for establishment of enhancer landscape.
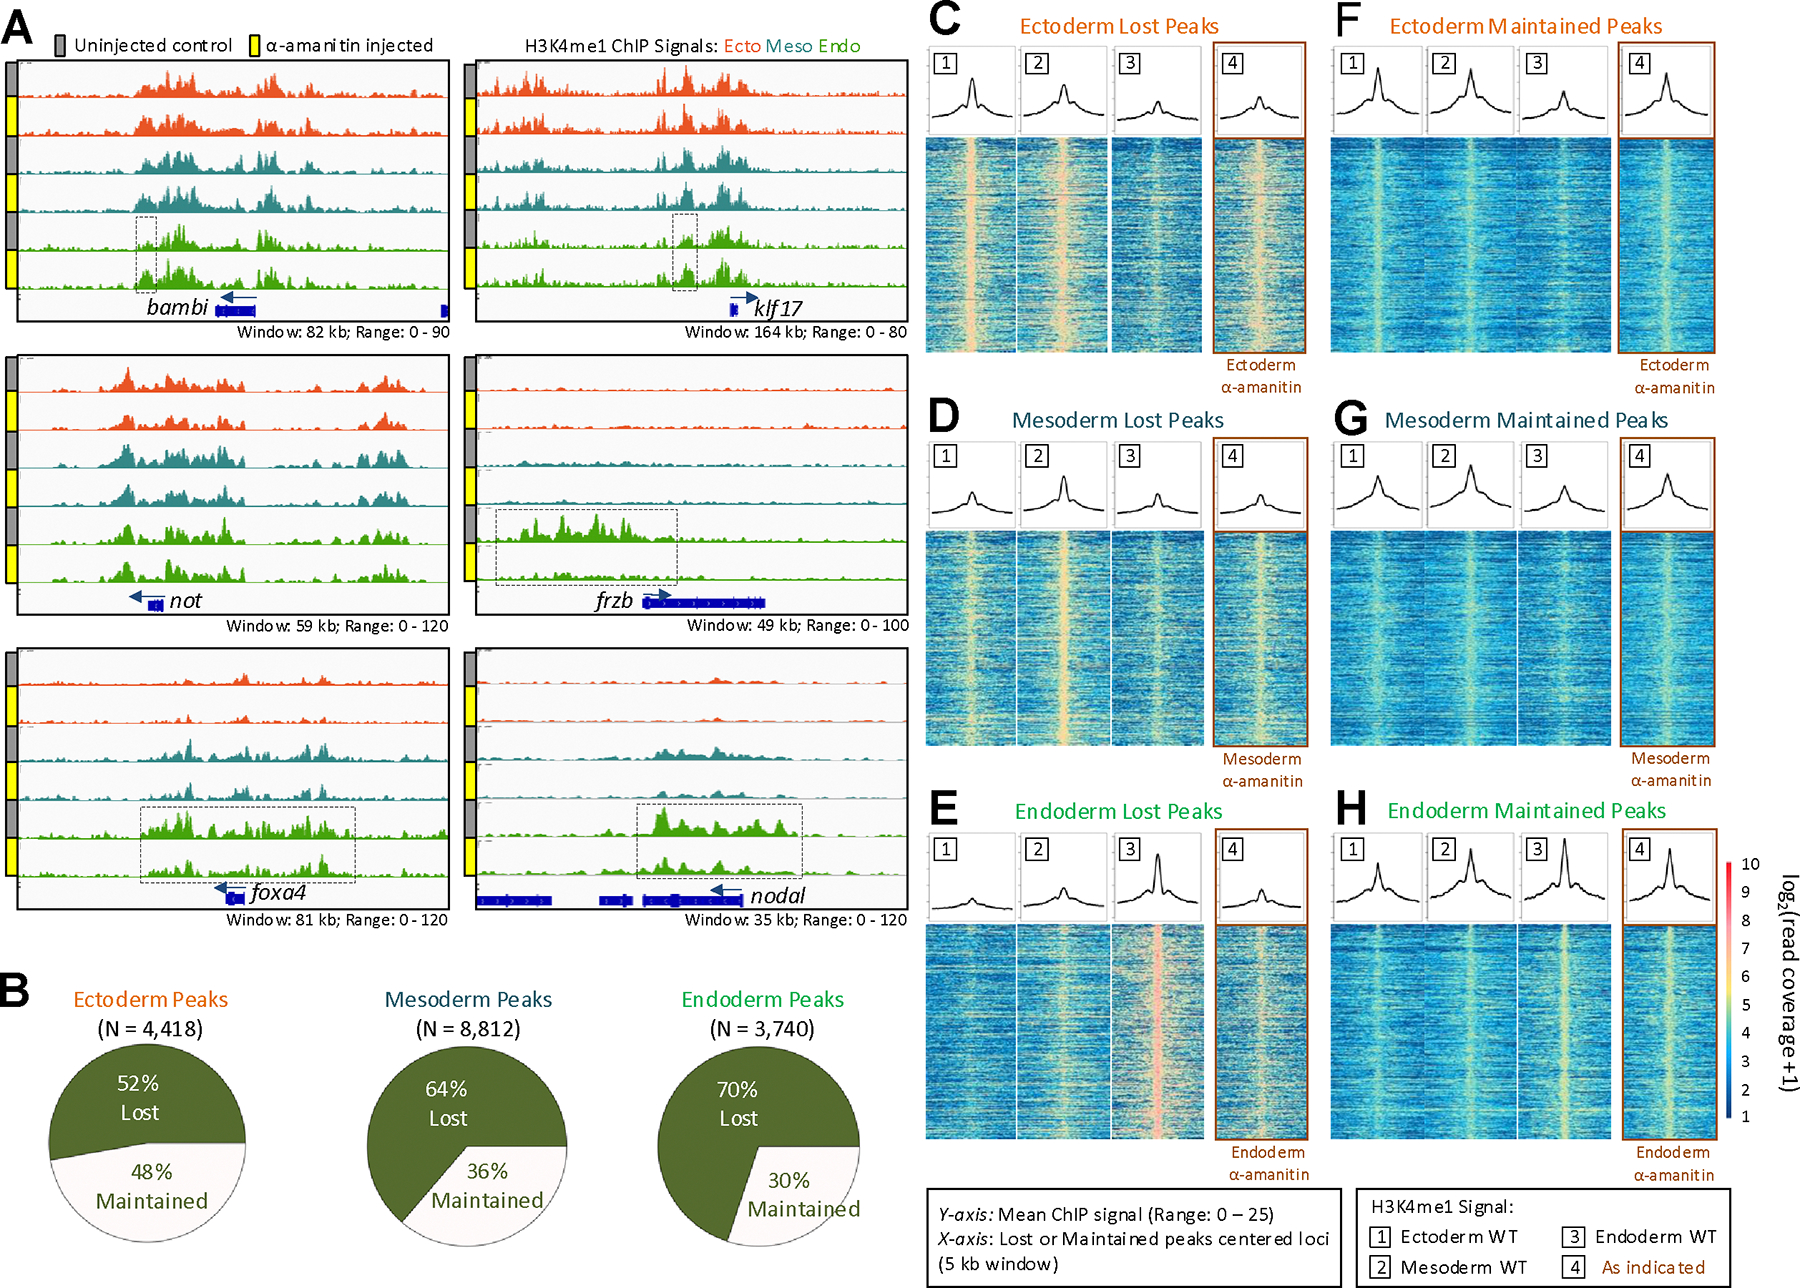
(A) Genome browser of H3K4me1 ChIP-seq obtained from germ layer tissues of control and α-amanitin injected embryos in the not, klf17, bambi, foxa4, frzb, and nodal loci. (B) Fraction of lost and maintained wild type ChIP-seq peaks after α-amanitin treatment. (C-H) The heatmap shows read coverage of the wild type H3K4me1 signal in the three germ layers centered around the peaks with a 5 kb window which were either ‘lost’ (C-E) or ‘maintained’ (F-H) after α-amanitin injection. The line plot above each heatmap is a measure of the mean ChIP-seq signal for each base within the 5 kb window.
To approximate the effects of maternal and zygotic factors in establishment of these marks, we performed peak calling on the H3K4me1 ChIP-seq datasets in both control and α-amanitin samples. We counted the number of peaks that were either maintained or lost after α-amanitin treatment. The maintained peaks represent maternally controlled peaks, whereas lost peaks in the presence α-amanitin represent zygotically controlled H3K4me1 modification. Previous bulk embryo chromatin datasets have suggested varying levels of maternal control of chromatin states. For example, H3K4me3-marked promoters and H3K27me3-marked repressed regions are largely maternally-controlled such that α-amanitin treatment resulted in 14% and 10% of peaks lost, respectively (Hontelez et al., 2015). Ep300-marked enhancers on the other hand lost 85% of peaks after α-amanitin treatment, suggesting strong dependence on zygotic factors for the binding of this enhancer-marking factor (Hontelez et al., 2015). In our data, H3K4me1 marking appears to be intermediate between these two extremes (Figure 3B). The percentages of peaks dependent on zygotic factors varies between the ectoderm, mesoderm and endoderm, showing 52%, 64% and 70% of peak loss, respectively, upon α-amanitin treatment. This suggests that maternal and zygotic factors collaborate to control the early chromatin states. In addition, the balance of control between maternal and zygotic factors vary between the three germ layers in establishing the early epigenome.
To better understand which regions are preferentially regulated by zygotic factors, we quantified the read coverage in peaks that were lost in genomic landmarks following α-amanitin treatment. First, we compared the promoter and enhancer regions (Figure S4). Both promoter and enhancer H3K4me1 markings are disrupted by blocking zygotic transcription. H3K4me1 peaks are reduced more in the promoters than enhancers in both the ectoderm and mesoderm tissues, while the opposite is true in the endodermal tissue (Figure S4D). Second, we compared the marking in LDRs and HDRs (Figure S5). The markings in ectodermal and mesodermal tissues are affected relatively similarly in both the LDRs and HDRs, whereas the endodermal tissues appear to be more affected in the HDRs (such as the HDRs in the frzb and foxa4 in Figure 3A). Finally, we wished to know whether the peaks that are lost or maintained appear across all three germ layers, or whether these marks are preferentially or uniquely marked in their respective germ layer. By plotting the read coverage (heatmaps) and the mean read coverage (line plot) across these lost or maintained peaks within a 5 kb span, we uncovered that lost and maintained peaks have distinct regional marking patterns (Figure 3C–H). Peaks that are lost tend to have very specific marking in their respective germ layers. For example, peaks that are lost in the endoderm (Figure 3E, compare track 3 to 4) are strongly endodermally-marked showing a vegetal-animal gradation (Figure 3E, decreasing signal across tracks 3, 2 and 1). Similarly, lost mesodermal peaks (Figure 3D, compare track 2 to 4) tend to be most strongly H3K4me1 marked in the mesodermal region (Figure 3D, compare track 2 to 1 and 3). Finally, lost ectodermal peaks (Figure 3C, compare track 1 to 4) tend to be most strongly marked in the ectoderm with an animal-vegetal gradation (Figure 3C, decreasing signal across tracks 1, 2 and 3). These results are consistent with the view that H3K4me1 marks lost in specific germ layers are regulated by zygotically regulated TFs. Conversely, the maternally-controlled H3K4me1 marks (maintained peaks in the presence of α-amanitin) show enriched marking in their respective germ layers, and differences are much less stark (Figure 3F–H). Based on these findings, we suggest that the factors responsible for germ layer specific H3K4me1 marking are zygotic factors expressed in each germ layer. On the other hand, H3K4me1 patterns established by maternal TFs are less germ layer specific, indicating that maternally present ubiquitously expressed TFs may be responsible for majority of these histone markings. We suggest that this is consistent with the Waddington landscape model of cell differentiation (Waddington et al., 1957): the cis-regulatory domains we observed are established sequentially, first by maternal TFs and then by zygotic TFs, in different germ layers, gradually becoming more divergent.
Loss of maternal TFs results in animalization of the endodermal chromatin state
Here we investigated the direct role of maternal TFs in endodermal chromatin state formation by knocking down the expression of Otx1, Vegt and Foxh1 (OVF), after microinjecting morpholino antisense oligonucleotides (MOs). As with the α-amanitin experiment, OVF knockdown (KD) resulted in reduction of H3K4me1 marking in a variable manner across known mesodermal/endodermal genes (Figure 4A). The loci near genes such as admp, pitx2, lhx1, and foxa4 all showed decrease in H3K4me1 marking. More drastic decrease could be seen in the loci near genes such as pnhd, hnf1b and gata6. By quantifying peaks, we find that the large majority of peaks (88% of peaks) are lost after OVF MO knockdown (Figure 4B). This suggests a significant contribution of the maternal OVF TFs in the establishment of the H3K4me1 state of the early endoderm.
Figure 4. Transformation of the endoderm chromatin state due to loss of endoderm transcription factors.

(A) Genome browser view of endodermal H3K4me1 ChIP-seq in control and OVF MO injected embryos. The top three genome browser view graphs display the wild type ectodermal, mesodermal, and endodermal H3K4me1 ChIP-seq signal. The endodermal H3K4me1 ChIP-seq signal from the OVF MO-injected sample is shown at the bottom. (B) Fraction of lost and maintained wild type ChIP-seq peaks after OVF MO injection. (C) Quantification of change in read coverage in ChIP peaks after α-amanitin and OVF MO injection. (D) Quantification of change in read coverage in LDR and HDR constituent peaks after α-amanitin and OVF MO injection. (E-F) The heatmap shows read coverage of the wild type H3K4me1 signal in the three germ layers centered around the peaks with a 5 kb window, which were either ‘lost’ (E) or ‘gained’ (F) after OVF MO injection. The line plot above each heatmap is a measure of the mean ChIP-seq signal within the 5 kb window. (G) Intersection of wild type and OVF MO injected endodermal HDRs with the wild type germ layer HDRs from the Figure 1C dataset. (H) Expression of genes associated with ‘gained’, ‘lost’ and ‘maintained’ peaks in the three germ layers.
To identify the genomic locations by which wild type H3K4me1 signal is lost due to the KD of OVF TFs, we first quantified read coverage in enhancers and promoters (Figure 4C, S6A). Compared to the α-amanitin treatment, the H3K4me1 marking in both promoters and enhancer regions are more significantly reduced in the OVF TFs knockdown samples. The strongest disruption is seen in the enhancers, highlighting the importance of OVF TFs in enhancer activity in the endoderm. Second, we compared the read coverage in LDRs and HDRs. While these regions are much more disrupted in the OVF TF knockdown compared to α-amanitin treatment, effects on LDRs and HDRs are largely indistinct (Figure 4D, S6B). Finally, we examined the regional pattern (e.g. ectoderm, mesoderm and endoderm) of the peaks that were lost or gained after OVF KD (Table S3). By plotting the read coverage (heatmaps) and the mean read coverage (line plot) across these lost or gained peaks within a 5 kb span, we uncovered that lost and maintained peaks have distinct regional marking patterns (Figure 4E, F). Peaks that are lost (Figure 4E, compare track 4 to 3) appear to be most strongly endodermally marked with a vegetal-animal graded pattern (Figure 4E, decreasing signal across tracks 3, 2 and 1). Conversely, H3K4me1 peaks which were gained in OVF injected embryos (Figure 4F, compare track 4 to 3) tend to be most strongly marked in the mesoderm wild type sample and less so in the ectoderm and endoderm (Figure 4F, compare track 3 to 1 and 2). Further, we compared HDR profile in the control and the OVF morpholino treated endoderm to those identified in wild type tissues (Figure 4G). We identified the genomic coordinates of the HDRs for the wild type and OVF KD, and asked what percentage of these HDRs match those found in the ectoderm, mesoderm and endoderm WT. The profile of the wild type unsurprisingly reflected an endodermal profile, while showing the least similarity with the ectodermal sample. On the other hand, the MO knockdown showed a reduced similarity to the endodermal sample and an increased resemblance to the ectodermal sample.
Lastly, we associated the peaks gained or lost following OVF TF knockdown to gene expression patterns. By analyzing their expression in wild type embryos, we observed that genes associated with lost peaks exhibited a vegetal-animal gradient of expression (Figure 4H). In contrast, genes associated with gained peaks were predominantly expressed in the mesoderm. The gene expression patterns closely mirror the H3K4me1 marking pattern of gained and lost peaks shown in Figure 4E and F. These findings suggest that maternal OVF TFs are crucial in establishing the endodermal chromatin state while simultaneously repressing ectodermal or mesodermal chromatin states.
Lost H3K4me1 peaks after OVF MOs are associated with the endodermal gene regulatory network
To identify a candidate set of TFs responsible for the modifications in H3K4me1 marking in the endoderm, we performed de novo motif analysis on H3K4me1-flanked nucleosome-free regions (NFRs). These NFRs, which represent the promoter and enhancer regions of DNA, are accessibility to various transcription factors. For this analysis, we utilized the Homer peak calling option ‘–nfr’ (Heinz et al., 2010), which specifically identifies the valleys in the histone peaks. NFR peak calling of H3K4me1 signals in both control and OVF-depleted endodermal samples yielded 22,577 and 8,270 peaks, respectively (Figure 5A, Table S4). We then compared the set of NFRs that were either lost or gained in the OVF-depleted samples to those in the control sample. Notably, 88% of H3K4me1-flanked NFRs were lost upon OVF-depletion (Figure 4B).
Figure 5. Uncovering of the endodermal gene regulatory network TF motif profile after endodermal maternal TF knockdown.

(A) Heatmap of H3K4me1 ChIP-seq signal surrounding H3K4me1-flanked NFRs from wild type and OVF MO embryos. (B) Enriched motifs under H3K4me1-flanked NFRs, which were ‘lost’ after maternal endodermal TF knockdown.
De novo motif analysis performed on the NFRs identified enrichment of both maternal and zygotic TFs (Figure 5B). The motifs identified under NFRs which were lost after OVF KD include key TFs of the endodermal gene regulatory network. Among the top ranked motifs include the T-box and paired-type homeobox motifs, that are likely to represent Vegt and Otx1 (Paraiso et al., 2019). We also found motifs representing zygotically expressed endodermal pioneer TFs Gata4/5/6 (Weber et al., 2000; Afouda et al., 2005) and Foxa2 (Suri et al., 2004; Iwafuchi-Doi and Zaret, 2014), as well as Sox17, which is a critical endodermal regulator (Hudson et al., 1997; Clements and Woodland 2000). In addition, the motif for Tcf/Lef TFs, critical mediators for patterning the DV axis of the mesendoderm, was identified (Molenaar et al., 1996; Behrens et al, 1996; Larabell et al., 1997; Tao et al., 2005). Interestingly, we failed to identify motifs representing Smad2/3, which mediate Nodal signaling, a key endodermal signaling pathway. However, this is consistent with the finding that loss of Nodal signaling through small molecule inhibition marginally affects the H3K4me1 deposition in the early embryo (Gupta et al., 2014). Conversely, the motif analysis on gained H3K4me1-flanked NFRs identified motifs of known regulators of ecto-mesodermal cell lineages (Figure S7), including the motifs for Neurog2 (Ma et al., 1996), Six1 (Pandur and Moody, 2000) and Six6 (Zhou et al., 2000; Bernier et al., 2000), Sox9 (Spokonoy et al., 2002), Sox10 (Honoré et al., 2003) and Etv2 (Nie and Bronner, 2015). These TFs are known to regulate ecto-mesodermal derived lineages such as neurons, neural crest cells and cardiac muscle. In summary, the gained and lost H3K4me1-flanked NFR regions are enriched with motifs representing lineage specific TFs important for germ layer specification. We suggest that these TFs actively shape the chromatin states of differentiating germ layers, consistent with the notion that the loss of OVF promotes the H3K4me1 epigenetic signature of ectoderm and mesoderm, rather than the endodermal H3K4me1 signature.
Discussion
Model of early chromatin state dynamics
The dynamic interplay between transcription factors, epigenetics in cell lineage commitment during differentiation in metazoan genomes remains one of the central questions in developmental biology. Here, we generated ChIP-seq data to explore how H3K4me1 chromatin marking and enhancer activities are established during the differentiation of the pluripotent zygote into the three germ layer cell states. Based on our experiments using early Xenopus tropicalis embryos, we conclude with the following model (Figure 6A). As early as gastrula stage NF 10.25 (~7 hpf, or ~2.5 hours after the initiation of the major wave of ZGA), the chromatin states of the early Xenopus embryo are already distinct among the putative germ layers (Figure 1,2). By this point, these states appear to have been uniquely modified by both maternal and zygotic factors (Figure 3, 4). These modifications appear to be intrinsically linked to the germ layer gene regulatory networks (Figure 5). Loss of endodermal maternal factors results in the transformation of the endodermal chromatin state to a more ecto/mesodermal-like state (Figure 4). The histone markings that are lost are enriched with the consensus binding motifs of maternal and zygotic endodermal TFs known to regulate the endodermal program (Charney et al., 2017a), reinforcing the close relationship between the regulators of cellular differentiation and the epigenetics of cellular states. Future research should explore the mechanism by which maternal TFs recruit histone-modifying enzymes to maintain gene regulatory programs.
Figure 6. Model of H3K4me1 establishment during early embryogenesis.

(A) The chromatin state differentiation during the first 7 hours of development is highly dynamic and is under both maternal and zygotic factor control. Loss of OVF TFs in the endoderm result in the establishment of a more ecto-mesodermal-like chromatin state in the endoderm. (B) Canalization of gene expression during early stages of development. Boxed show early blastula and gastrula stage embryos where gene expression and chromatin states were examined. Genes associated with HDRs show lower variability in expression compared to those with non-HDR associated.
Interplay of histone methylation and enhancer activity for developmental stability
For organisms to develop as functionally integrated systems, proper tissue structures have to develop in coordinated and highly predictable ways. The term “canalization” describes the tendency for embryonic cells or tissues to follow the same developmental trajectory during development (Waddington, 1942). This implies that developmental mechanisms exist to ensure tight control, resulting in this predictability in development. In the current paper, we have examined the expression of genes associated with HDR peaks by measuring variation of gene expression obtained from RNA-seq from embryos of different clutches. Given that HDR regions are composed of multiple constituent enhancers, we hypothesized that the clustering of enhancers into HDRs confers robustness (tight control) in gene expression, perhaps acting similar to shadow enhancers in certain genes (Frankel et al., 2010; Perry et al., 2010; Osterwalder et al., 2018). The time course expression patterns of genes associated with HDRs show that they maintain lower expression variability relative to the other genes in the genome (i.e. LDR associated genes or non-H3K4me1 enhancer (NH) associated genes) (Figure 6B). Since genes marked by HDRs are linked to key developmentally genes, HDRs may provide buffers against variations in gene expression, contributing to developmental stability during cell fate canalization by providing the resistance to change, thus giving the robustness to the embryonic tissue formation. Alternatively, it is possible that histone mono-methylation itself could be the determinant of canalization of expression, rather than the activity of the enhancer, as has been speculated with the role of DNA methylation (Pujadas and Feinberg, 2012). How these H3K4me1-marked genomic elements are associated with canalization of gene expression is yet to be determined.
HDRs roles along the anterior-posterior and dorsal-ventral axes
Our work has shown that distinct HDRs are formed during germ layer specification along the animal-vegetal axis. We have in parallel identified the putative cis-regulatory regions near genes that are important for the patterning of AP and DV axes. The collinearly controlled expression of Hox genes is important for conferring spatial identity along the AP axis (Tschopp and Duboule, 2011). Among vertebrates, Hox genes are organized on 4 different chromosomes representing hoxa, hoxb, hoxc and hoxd clusters. The majority of these genes initiate transcription during late gastrula/early neurula stage (Owens et al., 2016; Kondo et al., 2019), when the embryo begins to extend along the AP axis. We find that all four Hox clusters are H3K4me1-marked (on both HDRs and LDRs) by early gastrula stage in all three germ layers. In embryos where zygotic transcription is inhibited, Hox clusters still remain marked with H3K4me1, suggesting that maternal factors are responsible for this early marking of these clusters. Since these loci also remain marked after the loss of the endodermal maternal OVF TFs and their downstream regulatory target genes, we propose that the H3K4me1 marking of the Hox complexes is mediated by alternative and perhaps ubiquitous maternal factors. It is unclear why the Hox genes are H3K4me1 marked hours prior to the onset of their transcription and the formation of the AP axis. Perhaps, a mechanism exists to ensure these critical genes are placed in a poised state to protect them from gene silencing during early stages, prior to their transcriptional activation hours later in development.
Conversely, genes that are important for DV patterning of the embryo tend to be affected by inhibition of zygotic transcription or knockdown of maternal OVF function. Genes in the ventx cluster (ventx1.1, ventx1.2, ventx2.1 and ventx2.2) (Onichtchouk et al. 1998) and bmp4 (Jones et al., 1992) which control ventral identity, are highly marked by H3K4me1 across all three germ layers. Genes such a Bmp antagonists chrd (Sasai et al., 1994), nog (Smith and Harland, 1992) and fst (Hemmati-Brivanlou et al., 1994), as well as Nodal ligands nodal1 and nodal2 (Jones et al., 1995), which are important for dorsal cell identity, are marked by H3K4me1 in the meso/endoderm germ layers. Unlike the loci near the Hox genes, these loci are partially or fully affected by the loss of zygotic transcription, suggesting the involvement of both maternal and zygotic TFs for the marking.
Ectodermal, mesodermal, and endodermal HDR-associated genes are differentially expressed along the animal-vegetal axis. Here, we examined their impact on AP and DV patterning. Hox genes, essential for anterior-posterior (AP) patterning, are marked by H3K4me1 early, likely due to maternal TFs. In contrast, dorsoventral (DV) patterning genes, like those in the ventx cluster and bmp4, show H3K4me1 marking influenced by both maternal and zygotic transcription factors. Although the full extent of this association is unclear, further exploration of the link between HDR formation and cell differentiation in later stages is warranted.
Pioneer factors in the endodermal gene regulatory network
Pioneer factors are a class of TFs that are able to bind to closed chromatin, and may cause the extrusion of core histones and/or epigenetic changes important for gene regulation (Iwafuchi-Doi and Zaret, 2014). During early development in a variety of different organisms, maternal TFs perform this role to initiate modifications to the zygotic epigenome (Foo et al., 2014; Schulz et al., 2015; Leichsenring et al., 2013; Charney et al., 2017a; Paraiso et al., 2019; Gentsch et al., 2019; Pálfy et al., 2019; Veil et al., 2019). In the Xenopus embryo, these TFs include relatives of the mammalian pluripotency TFs and germ layer-specific maternal TFs such as Foxh1, Sox3, Pou5f3 (Charney et al., 2017b; Gentsch et al., 2019). In the current study, we identified a set of H3K4me1 bimodal peaks flanking nucleosome free regions (NFRs) that are lost following the knockdown of maternal endodermal TFs (Figure 5). Consistent with the known roles of maternal TFs, these lost H3K4me1-flanked NFRs are enriched with motifs that bind maternal endodermal TFs. In addition, these NFRs are also littered with the motifs of zygotic endodermal TFs, suggesting that the set of lost H3K4me1-flanked NFRs represent the chromatin bound by the TFs in the endodermal gene regulatory cascade (Charney et al., 2017a). These zygotic TFs include Foxa and Gata, the Xenopus orthologs of the earliest mammalian pioneer FOXA and GATA TFs (Iwafuchi-Doi and Zaret, 2014). The pan-vertebrate endodermal TF Sox17 (Hudson et al., 1997) is also directly regulated by Otx1, Vegt and Foxh1 (Zhang et al., 1998; Taverner et al., 2005; Chiu et al., 2014; Paraiso et al., 2019).
In sum, we have shown that maternal and uniformly expressed Foxh1 together with endodermally expressed Otx1 and Vegt TFs function at the top of a hierarchy of TF interactions. These factors not only regulate the transcriptional responses of developmental genes, but also implicate a role in coordinating H3K4me1 histone modifications, thereby affecting the epigenetic landscape regulating endoderm development. However, our data does not provide how these marks function in defining these transcriptional states. Since these TFs are conserved among vertebrates, it would be important in the future to test whether the similar germ layer specific HDRs are formed among different vertebrate species. Our work has therefore revealed the interplay between maternal TFs and epigenetic modifications of histones.
Materials and Methods
Animal husbandry and embryo manipulation
Xenopus tropicalis males and females were maintained in accordance with the University of California, Irvine Institutional Animal Care Use Committee (IACUC). X. tropicalis females to be used for embryo collection were injected with 10 units of Chorulon HCG (Merck and Co.) 1–3 days before and 100 units of HCG in the morning of the embryo collection. Eggs were collected in a 0.1% BSA in 1/9x MMR coated glass dish. The eggs were in vitro fertilized with sperm suspension in 0.1% BSA in 1/9x MMR containing 0.1% BSA(Ogino et al., 2006) obtained from sacrificed males. The embryos were dejellied at 10 minutes post fertilization with 3% cysteine in 1/9x MMR, pH 7.8, 10 minutes post fertilization and were then ready for manipulation. Embryos were staged using the Nieuwkoop-Faber developmental table (Nieuwkoop and Faber, 1956). For inhibition of zygotic transcription, 5 pg of α-amanitin (MilliporeSigma) was injected per embryo. Combinatorial inhibition of Otx1/Vegt/Foxh1 was performed as previously described (Paraiso et al., 2019) using morpholino antisense oligonucleotides (Gene Tools, LLC) with the sequences 5’-ATGACATCATGCTCAAGGCTGGACA-3’ for otx1, 5’-TGTGTTCCTGACAGCAGTTTCTCAT-3’ for vegt, and 5’-TCATCCTGAGGCTCCGCCCTCTCTA-3’ for foxh1.
H3K4me1 ChIP-seq and Bioinformatics
ChIP-seq on formaldehyde-fixed X. tropicalis embryonic tissues was performed as previously described (Chiu et al., 2014) using an anti-H3K4me1 antibody (Abcam). One hundred ectodermal, mesodermal and endodermal tissue fragments were isolated from two biologically independent embryo clutches, resulting in two ChIP-seq samples for each germ layer. ChIP-seq libraries were generated using Nextflex ChIP-seq kit (Bioo Scientific), analyzed using an Agilent Bioanalyzer 2100, quantified using KAPA qPCR and sequenced using Illumina instruments at the UC Irvine Genomics High Throughput Facility.
To define high-density H3K4me1 regions, the sequences from the biological duplicates of H3K4me1 ChIP-seq were concatenated into a single file. The reads were aligned to the X. tropicalis genome v9.0 (Karimi et al., 2018; Mitros et al., 2019) using Bowtie 2 v2.2.7 (Langmead and Salzberg, 2012) with default settings. To ensure fair comparison across datasets, the set of unique aligned reads for each dataset were downsampled to 15 million reads for each dataset. To visualize the ChIP-seq tracks, IGVtools was used to sort (default settings) and generate TDF files (count function:--w 25 -e 250), which were loaded into IGV v2.3.20 Genome Browser (Robinson et al., 2011).
We pooled reads from the two biological replicates as pooling the replicates enables better distinction of true peaks from background noise. We performed peak calling using the broad peak option in MACS2 (v2.0.10) (Zhang et al., 2008), which is appropriate for the broader distribution of this histone mark compared to those typically associated with transcription factors. Peaks were identified by comparing ChIP-seq data to stage 10 input DNA (Charney et al., 2017a) with a stringent p-value cut-off < 10e−9, while keeping all other parameters maintained at the default settings as previously described (Whyte et al., 2013). Promoter peaks were defined as those within 500bp of transcription start sites, while enhancer peaks were identified in intronic and intergenic regions, excluding promoter regions. High-density H3K4me1 regions (HDRs) were identified using a previously published method (Lovén et al., 2013; Whyte et al., 2013). First, peaks were stitched together, allowing a maximum distance of 12.5 kilobases between H3K4me1 peaks. The H3K4me1 ChIP signal within these stitched regions was quantified as reads per million. Regions were then ranked, and the point at where the slope of the H3K4me1 ChIP signal curve reached 45° was used to distinguish ‘low density regions’ from ‘high density regions’ (HDR), according to the Ranking of Super Enhancers (ROSE) algorithm. We assigned each HDR to the nearest genes, which are identified based on their closest proximity to the nearest transcription start site (TSS) using bedtools closest.
To identify H3K4me1 peaks sensitive to a-amanitin treatment, peaks present in the wild type embryonic tissues were compared with those in a-amanitin-treated tissues. Peaks located in the same genomic regions under both conditions were classified as maintained peaks, while those present in the control but absent in the a-amanitin treatment were designated as lost peaks
H3K4me1-flanked nucleosome free regions (NFRs) were identified using HOMER v4.7 (Heinz et al., 2010) with the function annotatePeaks.pl –style histone –nfr and a p-value cut-off < 10e−9 but otherwise default options. De novo motif analysis was performed on 50bp windows from the center of the NFR peaks using DREME (Bailey et al., 2011), and motifs were matched to databases using TOMTOM (Gupta et al., 2007). Genes were assigned to peaks using Bedtools v2.19.1 (Quinlan et al., 2010) based on proximity.
RNA-seq and Bioinformatics
The spatial (ectoderm, mesoderm and endoderm) (Blitz et al., 2017) and temporal (4–9 hours post-fertilization) expression of genes were analyzed using published RNA-seq datasets (Collart et al., 2014; Owens et al., 2016). Note that only the genes that do not have maternal expression (TPM > 1 at 0 hours post-fertilization) were considered for the spatial and temporal expression analysis of zygotic genes. Reads were aligned using RSEM v.1.2.12 (Li and Dewey, 2011) and Bowtie 2 v2.2.7 (Langmead and Salzberg, 2012) to X. tropicalis genome v9.0 (Karimi et al., 2018; Mitros et al., 2019) resulting in expression in transcripts per million. To measure the coefficient of variation (COV) of gene expression, the three time-course datasets were aligned to each other based on reported hours post-fertilization. The COV was calculated as the standard deviation over the mean for each time point per gene. Gene set enrichment analysis was performed using the GSEA software (Subramanian et al., 2005; Mootha et al., 2003) with the pre-ranked option using our ranked genes based on COV.
Supplementary Material
Table S1. Overlap of HDRs domains from the three germ layers showing germ-layer specific and germ-layer shared HDRs
Table S2. Genes associated with high density H3K4me1 marked regions (HDRs) for the three germ layers.
Table S4. Peak location of H3K4me1 ChIP-seq signal surrounding H3K4me1-flanked NFRs from wild type and OVF MO embryos.
Table S3. Fraction of lost and maintained wild type ChIP-seq peaks after α-amanitin treatment in the three germ layers.
Figure S1. Genome browser view of germ layer-specific H3K4me1 marking in the hoxa, hoxb, hoxc and hoxd clusters loci.
Figure S2. Mean ChIP signal of H3K4me1 ChIP-seq in unique and shared peaks between the three germ layers. Mean ChIP signal is measured as the mean read coverage across the 10 kb window for each peak region. For each dataset, the lowest mean ChIP signal is subtracted from the rest of the values within the window such that each plot starts at zero.
Figure S3. Robustness of gene expression. (A) Measuring the coefficient of variation (COV) among published RNA-seq datasets which were generated from pooled embryo samples from 4 – 9 hpf with 0.5 hour intervals. The COV is measured for each gene for each time point. (B) COV of gene expression from the RNA-seq of three separate embryo clutches from 4 – 9 hpf. Displayed are the COV for non-H3K4me1 (NH) associated, LDR associated and HDR associated genes. (C) COV of gene expression for genes that are either non-H3K4me1 (NH) associated, LDR associated or HDR associated genes. The expression levels are binned as 1–25, 25–50, 50–100 and 100+ TPM to account for variation caused by the noisy expression at low TPMs. Significance is tested by Wilcoxon Rank-Sum test. * = p-value < 0.01 and NS = not significant. (D) Measuring the COV among 15 embryos from 3 clutches at 7 hpf. (E) Principal component analysis of the transcriptome from the 15 embryo samples. (F) Gene set enrichment analysis of HDR-associated genes where genes are ranked based on COV.
Figure S4. H3K4me1 ChIP-seq signal in control and α-amanitin injected germ layer tissues comparing promoter and enhancer peaks. (A-C) Read coverage of H3K4me1 ChIP-seq of control and α-amanitin injected tissues in promoters and enhancers. The set of displayed promoter and enhancer peaks were identified from the control H3K4me1 ChIP-seq. (D) Quantification of change in read coverage in promoter and enhancer peaks after α-amanitin treatment.
Figure S5. H3K4me1 ChIP-seq signal in control and α-amanitin injected germ layer tissues comparing regular and high density peaks. (A-C) Read coverage of H3K4me1 ChIP-seq of control and α-amanitin injected tissues LDRs and HDRs. The set of displayed LDR and HDR constituent peaks were identified from the control H3K4me1 ChIP-seq. (D) Quantification of change in read coverage in LDR and HDR constituent peaks after α-amanitin injection.
Figure S6. H3K4me1 ChIP-seq signal in control, α-amanitin and OVF MO injected endodermal tissues. (A) Read coverage of H3K4me1 ChIP-seq of control, α-amanitin injected and OVF MO injected endodermal tissues in promoters and enhancers. The set of displayed H3K4me1 peaks were identified from the control H3K4me1 ChIP-seq peaks. (B ) Read coverage of H3K4me1 ChIP-seq of control, α-amanitin injected and OVF MO injected endodermal tissues in LDRs and HDRs. The displayed LDR and HDR constituent peaks were identified from the control endodermal H3K4me1 ChIP-seq peaks.
Figure S7. Enriched motifs under H3K4me1-flanked NFR regions of H3K4me1 ChIP-seq that were gained after maternal endodermal TF knockdown compared to control. (related to Fig S4A–C)
Acknowledgements
This work was made possible, in part, through access to the Genomic High-Throughput Facility Shared Resource of the Cancer Center Support Grant (P30CA-062203) at the University of California, Irvine, and NIH shared instrumentation grants 1S10RR025496-01, 1S10OD010794-01, and S10OD021718-01. We thank Xenbase for genomic and community resources (http://www.xenbase.org/, RRID: SCR_003280), and the University of California, Irvine High Performance Computing Cluster (https://hpc.oit.uci.edu/) for their valuable resources and helpful staff. This research was funded by the following grants awarded to K.W.Y.C. National Institute of Health R01 GM126395, R35 GM139617 and National Science Foundation 1755214.
GEO accession numbers of the data: GSE172395.
References
- Afouda BA, Ciau-Uitz A, Patient R. 2005. GATA4, 5 and 6 mediate TGFbeta maintenance of endodermal gene expression in Xenopus embryos. Development. 132(4), 763–74. [DOI] [PubMed] [Google Scholar]
- Akkers RC, van Heeringen SJ, Jacobi UG, Janssen-Megens EM, Françoijs KJ, Stunnenberg HG, Veenstra GJ. 2009. A hierarchy of H3K4me3 and H3K27me3 acquisition in spatial gene regulation in Xenopus embryos. Dev Cell. 17(3), 425–34. [DOI] [PMC free article] [PubMed] [Google Scholar]
- Bailey TL. 2011. DREME: motif discovery in transcription factor ChIP-seq data. Bioinformatics. 27(12), 1653–9. [DOI] [PMC free article] [PubMed] [Google Scholar]
- Behrens J, von Kries JP, Kühl M, Bruhn L, Wedlich D, Grosschedl R, Birchmeier W. 1996. Functional interaction of beta-catenin with the transcription factor LEF-1. Nature. 382(6592), 638–42. [DOI] [PubMed] [Google Scholar]
- Bernier G, Panitz F, Zhou X, Hollemann T, Gruss P, Pieler T. 2000. Expanded retina territory by midbrain transformation upon overexpression of Six6 (Optx2) in Xenopus embryos. Mech Dev. (1–2), 59–69. [DOI] [PubMed] [Google Scholar]
- Blitz IL, Paraiso KD, Patrushev I, Chiu WTY, Cho KWY, Gilchrist MJ. 2017. A catalog of Xenopus tropicalis transcription factors and their regional expression in the early gastrula stage embryo. Dev Biol. 426(2), 409–417. [DOI] [PMC free article] [PubMed] [Google Scholar]
- Blitz IL, Cho KWY. 2021. Control of zygotic genome activation in Xenopus. Curr Top Dev Biol. 145, 167–204. [DOI] [PMC free article] [PubMed] [Google Scholar]
- Cabral SE, Mowry KL. 2020. Organizing the oocyte: RNA localization meets phase separation. Curr Top Dev Biol. 140, 87–118. [DOI] [PMC free article] [PubMed] [Google Scholar]
- Chafin DR, Guo H, Price DH. 1995. Action of alpha-amanitin during pyrophosphorolysis and elongation by RNA polymerase II. J Biol Chem. 270(32), 19114–9. [DOI] [PubMed] [Google Scholar]
- Charney RM, Paraiso KD, Blitz IL, Cho KWY. 2017a. A gene regulatory program controlling early Xenopus mesendoderm formation: Network conservation and motifs. Semin Cell Dev Biol. 66:12–24. [DOI] [PMC free article] [PubMed] [Google Scholar]
- Charney RM, Forouzmand E, Cho JS, Cheung J, Paraiso KD, Yasuoka Y, Takahashi S, Taira M, Blitz IL, Xie X, Cho KW. 2017b. Foxh1 Occupies cis-Regulatory Modules Prior to Dynamic Transcription Factor Interactions Controlling the Mesendoderm Gene Program. Dev Cell. 40(6):595–607. [DOI] [PMC free article] [PubMed] [Google Scholar]
- Chiu WT, Charney Le R, Blitz IL, Fish MB, Li Y, Biesinger J, Xie X, Cho KW. 2014. Genome-wide view of TGFβ/Foxh1 regulation of the early mesendoderm program. Development. 141(23), 4537–47. [DOI] [PMC free article] [PubMed] [Google Scholar]
- Clements D, Woodland HR. 2000. Changes in embryonic cell fate produced by expression of an endodermal transcription factor, Xsox17. Mech Dev. 99(1–2), 65–70. [DOI] [PubMed] [Google Scholar]
- Collart C, Owens ND, Bhaw-Rosun L, Cooper B, De Domenico E, Patrushev I, Sesay AK, Smith JN, Smith JC, Gilchrist MJ. 2014. High-resolution analysis of gene activity during the Xenopus mid-blastula transition. Development. 141(9), 1927–39. [DOI] [PMC free article] [PubMed] [Google Scholar]
- Creyghton MP, Cheng AW, Welstead GG, Kooistra T, Carey BW, Steine EJ, Hanna J, Lodato MA, Frampton GM, Sharp PA, Boyer LA, Young RA, Jaenisch R. 2010. Histone H3K27ac separates active from poised enhancers and predicts developmental state. Proc Natl Acad Sci U S A. 107(50), 21931–6. [DOI] [PMC free article] [PubMed] [Google Scholar]
- Dirksen ML, Jamrich M. 1992. A novel, activin-inducible, blastopore lip-specific gene of Xenopus laevis contains a fork head DNA-binding domain. Genes Dev. 6(4), 599–608. [DOI] [PubMed] [Google Scholar]
- Frankel N, Davis GK, Vargas D, Wang S, Payre F, Stern DL. 2010. Phenotypic robustness conferred by apparently redundant transcriptional enhancers. Nature. 466(7305), 490–3. [DOI] [PMC free article] [PubMed] [Google Scholar]
- Foo SM, Sun Y, Lim B, Ziukaite R, O’Brien K, Nien CY, Kirov N, Shvartsman SY, Rushlow CA. 2014. Zelda potentiates morphogen activity by increasing chromatin accessibility. Curr Biol. 24(12), 1341–1346. [DOI] [PMC free article] [PubMed] [Google Scholar]
- Gentsch GE, Spruce T, Owens NDL, Smith JC. 2019. Maternal pluripotency factors initiate extensive chromatin remodelling to predefine first response to inductive signals. Nat Commun. 10(1), 4269. [DOI] [PMC free article] [PubMed] [Google Scholar]
- Gupta S, Stamatoyannopoulos JA, Bailey TL, Noble WS. 2007. Quantifying similarity between motifs. Genome Biol. 8(2), R24. [DOI] [PMC free article] [PubMed] [Google Scholar]
- Gupta R, Wills A, Ucar D, Baker J. 2014. Developmental enhancers are marked independently of zygotic Nodal signals in Xenopus. Dev Biol. 395(1), 38–49. [DOI] [PMC free article] [PubMed] [Google Scholar]
- Henry GL, Melton DA. 1998. Mixer, a homeobox gene required for endoderm development. Science. 281(5373), 91–6. [DOI] [PubMed] [Google Scholar]
- Heinz S, Benner C, Spann N, Bertolino E, Lin YC, Laslo P, Cheng JX, Murre C, Singh H, Glass CK. 2010. Simple combinations of lineage-determining transcription factors prime cis-regulatory elements required for macrophage and B cell identities. Mol Cell. 38(4):576–89. [DOI] [PMC free article] [PubMed] [Google Scholar]
- Heintzman ND, Hon GC, Hawkins RD, Kheradpour P, Stark A, Harp LF, Ye Z, Lee LK, Stuart RK, Ching CW, Ching KA, Antosiewicz-Bourget JE, Liu H, Zhang X, Green RD, Lobanenkov VV, Stewart R, Thomson JA, Crawford GE, Kellis M, Ren B. 2009. Histone modifications at human enhancers reflect global cell-type-specific gene expression. Nature. 459(7243), 108–12. [DOI] [PMC free article] [PubMed] [Google Scholar]
- Hemmati-Brivanlou A, Kelly OG, Melton DA. 1994. Follistatin, an antagonist of activin, is expressed in the Spemann organizer and displays direct neuralizing activity. Cell. 77(2):283–95. [DOI] [PubMed] [Google Scholar]
- Honoré SM, Aybar MJ, Mayor R. 2003. Sox10 is required for the early development of the prospective neural crest in Xenopus embryos. Dev Biol. 260(1), 79–96. [DOI] [PubMed] [Google Scholar]
- Hontelez S, van Kruijsbergen I, Georgiou G, van Heeringen SJ, Bogdanovic O, Lister R, Veenstra GJC. 2015. Embryonic transcription is controlled by maternally defined chromatin state. Nat Commun. 6, 10148. [DOI] [PMC free article] [PubMed] [Google Scholar]
- Horb ME, Thomsen GH. 1997. A vegetally localized T-box transcription factor in Xenopus eggs specifies mesoderm and endoderm and is essential for embryonic mesoderm formation. Development. 124(9), 1689–98. [DOI] [PubMed] [Google Scholar]
- Hudson C, Clements D, Friday RV, Stott D, Woodland HR. 1997. Xsox17alpha and -beta mediate endoderm formation in Xenopus. Cell. 91(3), 397–405. [DOI] [PubMed] [Google Scholar]
- Iwafuchi-Doi M, Zaret KS. 2014. Pioneer transcription factors in cell reprogramming. Genes Dev. 28(24), 2679–92. [DOI] [PMC free article] [PubMed] [Google Scholar]
- Jones CM, Lyons KM, Lapan PM, Wright CV, Hogan BL. 1992. DVR-4 (bone morphogenetic protein-4) as a posterior-ventralizing factor in Xenopus mesoderm induction. Development. 115(2), 639–47. [DOI] [PubMed] [Google Scholar]
- Jones CM, Kuehn MR, Hogan BL, Smith JC, Wright CV. 1995. Nodal-related signals induce axial mesoderm and dorsalize mesoderm during gastrulation. Development. 121(11), 3651–62. [DOI] [PubMed] [Google Scholar]
- Karimi K, Fortriede JD, Lotay VS, Burns KA, Wang DZ, Fisher ME, Pells TJ, James-Zorn C, Wang Y, Ponferrada VG, Chu S, Chaturvedi P, Zorn AM, Vize PD. 2018. Xenbase: a genomic, epigenomic and transcriptomic model organism database. Nucleic Acids Res. 46(D1), D861–D868. [DOI] [PMC free article] [PubMed] [Google Scholar]
- Kondo M, Matsuo M, Igarashi K, Haramoto Y, Yamamoto T, Yasuoka Y, Taira M. 2019. De novo transcription of multiple Hox cluster genes takes place simultaneously in early Xenopus tropicalis embryos. Biol Open. 8(3), bio038422. [DOI] [PMC free article] [PubMed] [Google Scholar]
- LaFlamme SE, Dawid IB. 1990. XK endo B is preferentially expressed in several induced embryonic tissues during the development of Xenopus laevis. Differentiation. 43(1), 1–9. [DOI] [PubMed] [Google Scholar]
- Langmead B, Salzberg SL. 2012. Fast gapped-read alignment with Bowtie 2. Nat Methods. 9(4), 357–9. [DOI] [PMC free article] [PubMed] [Google Scholar]
- Larabell CA, Torres M, Rowning BA, Yost C, Miller JR, Wu M, Kimelman D, Moon RT. 1997. Establishment of the dorso-ventral axis in Xenopus embryos is presaged by early asymmetries in beta-catenin that are modulated by the Wnt signaling pathway. J Cell Biol. 136(5), 1123–36. [DOI] [PMC free article] [PubMed] [Google Scholar]
- Leichsenring M, Maes J, Mössner R, Driever W, Onichtchouk D.2013. Pou5f1 transcription factor controls zygotic gene activation in vertebrates. Science. 341(6149), 1005–9. [DOI] [PubMed] [Google Scholar]
- Li B, Dewey CN. 2011. RSEM: accurate transcript quantification from RNA-Seq data with or without a reference genome. BMC Bioinformatics. 12, 323. [DOI] [PMC free article] [PubMed] [Google Scholar]
- Lovén J, Hoke HA, Lin CY, Lau A, Orlando DA, Vakoc CR, Bradner JE, Lee TI, Young RA. 2013. Selective inhibition of tumor oncogenes by disruption of super-enhancers. Cell. 153(2), 320–34. [DOI] [PMC free article] [PubMed] [Google Scholar]
- Lustig KD, Kroll KL, Sun EE, Kirschner MW. 1996. Expression cloning of a Xenopus T-related gene (Xombi) involved in mesodermal patterning and blastopore lip formation. Development. 122(12), 4001–12. [DOI] [PubMed] [Google Scholar]
- Ma Q, Kintner C, Anderson DJ. 1996. Identification of neurogenin, a vertebrate neuronal determination gene. Cell. 87(1), 43–52. [DOI] [PubMed] [Google Scholar]
- Mitros T, Lyons JB, Session AM, Jenkins J, Shu S, Kwon T, Lane M, Ng C, Grammer TC, Khokha MK, Grimwood J, Schmutz J, Harland RM, Rokhsar DS. 2019. A chromosome-scale genome assembly and dense genetic map for Xenopus tropicalis. Dev Biol. 452(1), 8–20. [DOI] [PubMed] [Google Scholar]
- Molenaar M, van de Wetering M, Oosterwegel M, Peterson-Maduro J, Godsave S, Korinek V, Roose J, Destrée O, Clevers H. 1996. XTcf-3 transcription factor mediates beta-catenin-induced axis formation in Xenopus embryos. Cell. 86(3), 391–9. [DOI] [PubMed] [Google Scholar]
- Mootha VK, Lindgren CM, Eriksson KF, Subramanian A, Sihag S, Lehar J, Puigserver P, Carlsson E, Ridderstråle M, Laurila E, Houstis N, Daly MJ, Patterson N, Mesirov JP, Golub TR, Tamayo P, Spiegelman B, Lander ES, Hirschhorn JN, Altshuler D, Groop LC. 2003. PGC-1alpha-responsive genes involved in oxidative phosphorylation are coordinately downregulated in human diabetes. Nat Genet. 34(3), 267–73. [DOI] [PubMed] [Google Scholar]
- Nie S, Bronner ME. 2015. Dual developmental role of transcriptional regulator Ets1 in Xenopus cardiac neural crest vs. heart mesoderm. Cardiovasc Res. 106(1), 67–75. [DOI] [PMC free article] [PubMed] [Google Scholar]
- Nieuwkoop PD., Faber J. 1958. Normal Table of Xenopus Laevis (Daudin). Copeia 65 [Google Scholar]
- Nutt SL, Dingwell KS, Holt CE, Amaya E. 2001. Xenopus Sprouty2 inhibits FGF-mediated gastrulation movements but does not affect mesoderm induction and patterning. Genes Dev. 15(9), 1152–66. [DOI] [PMC free article] [PubMed] [Google Scholar]
- Ogino H, McConnell WB, Grainger RM. 2006. High-throughput transgenesis in Xenopus using I-SceI meganuclease. Nat Protoc. 1(4), 1703–10. [DOI] [PubMed] [Google Scholar]
- Onichtchouk D, Glinka A, Niehrs C. 1998. Requirement for Xvent-1 and Xvent-2 gene function in dorsoventral patterning of Xenopus mesoderm. Development. 125(8), 1447–56. [DOI] [PubMed] [Google Scholar]
- Osterwalder M, Barozzi I, Tissières V, Fukuda-Yuzawa Y, Mannion BJ, Afzal SY, Lee EA, Zhu Y, Plajzer-Frick I, Pickle CS, Kato M, Garvin TH, Pham QT, Harrington AN, Akiyama JA, Afzal V, Lopez-Rios J, Dickel DE, Visel A, Pennacchio LA. 2018. Enhancer redundancy provides phenotypic robustness in mammalian development. Nature. 554(7691), 239–243. [DOI] [PMC free article] [PubMed] [Google Scholar]
- Owens NDL, Blitz IL, Lane MA, Patrushev I, Overton JD, Gilchrist MJ, Cho KWY, Khokha MK. 2016. Measuring Absolute RNA Copy Numbers at High Temporal Resolution Reveals Transcriptome Kinetics in Development. Cell Rep. 14(3), 632–647. [DOI] [PMC free article] [PubMed] [Google Scholar]
- Pálfy M, Schulze G, Valen E, Vastenhouw NL. 2020. Chromatin accessibility established by Pou5f3, Sox19b and Nanog primes genes for activity during zebrafish genome activation. PLoS Genet. 16(1), e1008546. [DOI] [PMC free article] [PubMed] [Google Scholar]
- Pandur PD, Moody SA. 2000. Xenopus Six1 gene is expressed in neurogenic cranial placodes and maintained in the differentiating lateral lines. Mech Dev. 96(2), 253–7. [DOI] [PubMed] [Google Scholar]
- Paraiso KD, Blitz IL, Coley M, Cheung J, Sudou N, Taira M, Cho KWY. 2019. Endodermal Maternal Transcription Factors Establish Super-Enhancers during Zygotic Genome Activation. Cell Rep. 27(10), 2962–2977.e5. [DOI] [PMC free article] [PubMed] [Google Scholar]
- Paraiso KD, Cho JS, Yong J, Cho KWY. 2020. Early Xenopus gene regulatory programs, chromatin states, and the role of maternal transcription factors. Curr Top Dev Biol.139, 35–60. [DOI] [PMC free article] [PubMed] [Google Scholar]
- Perry MW, Boettiger AN, Bothma JP, Levine M. 2010. Shadow enhancers foster robustness of Drosophila gastrulation. Curr Biol. 20(17), 1562–7 [DOI] [PMC free article] [PubMed] [Google Scholar]
- Pujadas E, Feinberg AP. 2012. Regulated noise in the epigenetic landscape of development and disease. Cell. 148(6), 1123–31. [DOI] [PMC free article] [PubMed] [Google Scholar]
- Quinlan AR, Hall IM. 2010. BEDTools: a flexible suite of utilities for comparing genomic features. Bioinformatics. 26(6), 841–2. [DOI] [PMC free article] [PubMed] [Google Scholar]
- Rada-Iglesias A, Bajpai R, Swigut T, Brugmann SA, Flynn RA, Wysocka J. 2011. A unique chromatin signature uncovers early developmental enhancers in humans. Nature. 470(7333), 279–83. [DOI] [PMC free article] [PubMed] [Google Scholar]
- Robinson JT, Thorvaldsdóttir H, Winckler W, Guttman M, Lander ES, Getz G, Mesirov JP. 2011. Integrative genomics viewer. Nat Biotechnol. 29(1), 24–6. [DOI] [PMC free article] [PubMed] [Google Scholar]
- Rogers CD, Harafuji N, Archer T, Cunningham DD, Casey ES. 2009. Xenopus Sox3 activates sox2 and geminin and indirectly represses Xvent2 expression to induce neural progenitor formation at the expense of non-neural ectodermal derivatives. Mech Dev. 126(1–2), 42–55. [DOI] [PMC free article] [PubMed] [Google Scholar]
- Rosa FM. 1989. Mix.1, a homeobox mRNA inducible by mesoderm inducers, is expressed mostly in the presumptive endodermal cells of Xenopus embryos. Cell. 57(6), 965–74 [DOI] [PubMed] [Google Scholar]
- Ryan K, Garrett N, Mitchell A, Gurdon JB. 1996. Eomesodermin, a key early gene in Xenopus mesoderm differentiation. Cell. 87(6), 989–1000. [DOI] [PubMed] [Google Scholar]
- Sasai Y, Lu B, Steinbeisser H, Geissert D, Gont LK, De Robertis EM. 1994. Xenopus chordin: a novel dorsalizing factor activated by organizer-specific homeobox genes. Cell. 79(5), 779–90. [DOI] [PMC free article] [PubMed] [Google Scholar]
- Schulz KN, Bondra ER, Moshe A, Villalta JE, Lieb JD, Kaplan T, McKay DJ, Harrison MM. 2015. Zelda is differentially required for chromatin accessibility, transcription factor binding, and gene expression in the early Drosophila embryo. Genome Res. 25(11), 1715–26. [DOI] [PMC free article] [PubMed] [Google Scholar]
- Sengupta D, Kannan A, Kern M, Moreno MA, Vural E, Stack B Jr, Suen JY, Tackett AJ, Gao L. 2015. Disruption of BRD4 at H3K27Ac-enriched enhancer region correlates with decreased c-Myc expression in Merkel cell carcinoma. Epigenetics. 10(6), 460–6. [DOI] [PMC free article] [PubMed] [Google Scholar]
- Smith JC, Price BM, Green JB, Weigel D, Herrmann BG. 1991. Expression of a Xenopus homolog of Brachyury (T) is an immediate-early response to mesoderm induction. Cell. 67(1), 79–87. [DOI] [PubMed] [Google Scholar]
- Smith WC, Harland RM. 1992. Expression cloning of noggin, a new dorsalizing factor localized to the Spemann organizer in Xenopus embryos. Cell. 70(5), 829–40. [DOI] [PubMed] [Google Scholar]
- Spokony RF, Aoki Y, Saint-Germain N, Magner-Fink E, Saint-Jeannet JP. 2002. The transcription factor Sox9 is required for cranial neural crest development in Xenopus. Development. 129(2), 421–32. [DOI] [PubMed] [Google Scholar]
- Stennard F, Carnac G, Gurdon JB. 1996. The Xenopus T-box gene, Antipodean, encodes a vegetally localised maternal mRNA and can trigger mesoderm formation. Development. 122(12), 4179–88. [DOI] [PubMed] [Google Scholar]
- Subramanian A, Tamayo P, Mootha VK, Mukherjee S, Ebert BL, Gillette MA, Paulovich A, Pomeroy SL, Golub TR, Lander ES, Mesirov JP. 2005. Gene set enrichment analysis: a knowledge-based approach for interpreting genome-wide expression profiles. Proc Natl Acad Sci U S A. 102(43), 15545–50. [DOI] [PMC free article] [PubMed] [Google Scholar]
- Suri C, Haremaki T, Weinstein DC. 2004. Inhibition of mesodermal fate by Xenopus HNF3beta/FoxA2. Dev Biol. 265(1):90–104. [DOI] [PMC free article] [PubMed] [Google Scholar]
- Taira M, Jamrich M, Good PJ, Dawid IB. 1992. The LIM domain-containing homeo box gene Xlim-1 is expressed specifically in the organizer region of Xenopus gastrula embryos. Genes Dev. 6(3), 356–66. [DOI] [PubMed] [Google Scholar]
- Tao Q, Yokota C, Puck H, Kofron M, Birsoy B, Yan D, Asashima M, Wylie CC, Lin X, Heasman J. 2005. Maternal wnt11 activates the canonical wnt signaling pathway required for axis formation in Xenopus embryos. Cell. 120(6), 857–71. [DOI] [PubMed] [Google Scholar]
- Taverner NV, Kofron M, Shin Y, Kabitschke C, Gilchrist MJ, Wylie C, Cho KW, Heasman J, Smith JC. 2005. Microarray-based identification of VegT targets in Xenopus. Mech Dev. 122(3), 333–54. [DOI] [PubMed] [Google Scholar]
- Tschopp P, Duboule D. 2011. A genetic approach to the transcriptional regulation of Hox gene clusters. Annu Rev Genet. 45, 145–66. [DOI] [PubMed] [Google Scholar]
- Vastenhouw NL, Zhang Y, Woods IG, Imam F, Regev A, Liu XS, Rinn J, Schier AF. 2010. Chromatin signature of embryonic pluripotency is established during genome activation. Nature. 464(7290), 922–6. [DOI] [PMC free article] [PubMed] [Google Scholar]
- Veil M, Yampolsky LY, Grüning B, Onichtchouk D. 2019. Pou5f3, SoxB1, and Nanog remodel chromatin on high nucleosome affinity regions at zygotic genome activation. Genome Res. 29(3), 383–395. [DOI] [PMC free article] [PubMed] [Google Scholar]
- Waddington CH. 1942. Canalization of development and the inheritance of acquired characters. Nature 150, 563–565. [DOI] [PubMed] [Google Scholar]
- Weber H, Symes CE, Walmsley ME, Rodaway AR, Patient RK. 2000. A role for GATA5 in Xenopus endoderm specification. Development. 127(20), 4345–60. [DOI] [PubMed] [Google Scholar]
- Whyte WA, Orlando DA, Hnisz D, Abraham BJ, Lin CY, Kagey MH, Rahl PB, Lee TI, Young RA. (2013). Master transcription factors and mediator establish super-enhancers at key cell identity genes. Cell. 153(2), 307–19. [DOI] [PMC free article] [PubMed] [Google Scholar]
- Wu E, Vastenhouw NL. 2020. From mother to embryo: A molecular perspective on zygotic genome activation. Curr Top Dev Biol. 140, 209–254. [DOI] [PubMed] [Google Scholar]
- Zhang J, King ML. 1996. Xenopus VegT RNA is localized to the vegetal cortex during oogenesis and encodes a novel T-box transcription factor involved in mesodermal patterning. Development. 122(12), 4119–29. [DOI] [PubMed] [Google Scholar]
- Zhang J, Houston DW, King ML, Payne C, Wylie C, Heasman J. 1998. The role of maternal VegT in establishing the primary germ layers in Xenopus embryos. Cell. 94(4), 515–24. [DOI] [PubMed] [Google Scholar]
- Zhang Y, Liu T, Meyer CA, Eeckhoute J, Johnson DS, Bernstein BE, Nusbaum C, Myers RM, Brown M, Li W, Liu XS. 2008. Model-based analysis of ChIP-Seq (MACS). Genome Biol. 9(9), R137. [DOI] [PMC free article] [PubMed] [Google Scholar]
- Zhou X, Hollemann T, Pieler T, Gruss P. 2000. Cloning and expression of xSix3, the Xenopus homologue of murine Six3. Mech Dev. 91(1–2), 327–30. [DOI] [PubMed] [Google Scholar]
Associated Data
This section collects any data citations, data availability statements, or supplementary materials included in this article.
Supplementary Materials
Table S1. Overlap of HDRs domains from the three germ layers showing germ-layer specific and germ-layer shared HDRs
Table S2. Genes associated with high density H3K4me1 marked regions (HDRs) for the three germ layers.
Table S4. Peak location of H3K4me1 ChIP-seq signal surrounding H3K4me1-flanked NFRs from wild type and OVF MO embryos.
Table S3. Fraction of lost and maintained wild type ChIP-seq peaks after α-amanitin treatment in the three germ layers.
Figure S1. Genome browser view of germ layer-specific H3K4me1 marking in the hoxa, hoxb, hoxc and hoxd clusters loci.
Figure S2. Mean ChIP signal of H3K4me1 ChIP-seq in unique and shared peaks between the three germ layers. Mean ChIP signal is measured as the mean read coverage across the 10 kb window for each peak region. For each dataset, the lowest mean ChIP signal is subtracted from the rest of the values within the window such that each plot starts at zero.
Figure S3. Robustness of gene expression. (A) Measuring the coefficient of variation (COV) among published RNA-seq datasets which were generated from pooled embryo samples from 4 – 9 hpf with 0.5 hour intervals. The COV is measured for each gene for each time point. (B) COV of gene expression from the RNA-seq of three separate embryo clutches from 4 – 9 hpf. Displayed are the COV for non-H3K4me1 (NH) associated, LDR associated and HDR associated genes. (C) COV of gene expression for genes that are either non-H3K4me1 (NH) associated, LDR associated or HDR associated genes. The expression levels are binned as 1–25, 25–50, 50–100 and 100+ TPM to account for variation caused by the noisy expression at low TPMs. Significance is tested by Wilcoxon Rank-Sum test. * = p-value < 0.01 and NS = not significant. (D) Measuring the COV among 15 embryos from 3 clutches at 7 hpf. (E) Principal component analysis of the transcriptome from the 15 embryo samples. (F) Gene set enrichment analysis of HDR-associated genes where genes are ranked based on COV.
Figure S4. H3K4me1 ChIP-seq signal in control and α-amanitin injected germ layer tissues comparing promoter and enhancer peaks. (A-C) Read coverage of H3K4me1 ChIP-seq of control and α-amanitin injected tissues in promoters and enhancers. The set of displayed promoter and enhancer peaks were identified from the control H3K4me1 ChIP-seq. (D) Quantification of change in read coverage in promoter and enhancer peaks after α-amanitin treatment.
Figure S5. H3K4me1 ChIP-seq signal in control and α-amanitin injected germ layer tissues comparing regular and high density peaks. (A-C) Read coverage of H3K4me1 ChIP-seq of control and α-amanitin injected tissues LDRs and HDRs. The set of displayed LDR and HDR constituent peaks were identified from the control H3K4me1 ChIP-seq. (D) Quantification of change in read coverage in LDR and HDR constituent peaks after α-amanitin injection.
Figure S6. H3K4me1 ChIP-seq signal in control, α-amanitin and OVF MO injected endodermal tissues. (A) Read coverage of H3K4me1 ChIP-seq of control, α-amanitin injected and OVF MO injected endodermal tissues in promoters and enhancers. The set of displayed H3K4me1 peaks were identified from the control H3K4me1 ChIP-seq peaks. (B ) Read coverage of H3K4me1 ChIP-seq of control, α-amanitin injected and OVF MO injected endodermal tissues in LDRs and HDRs. The displayed LDR and HDR constituent peaks were identified from the control endodermal H3K4me1 ChIP-seq peaks.
Figure S7. Enriched motifs under H3K4me1-flanked NFR regions of H3K4me1 ChIP-seq that were gained after maternal endodermal TF knockdown compared to control. (related to Fig S4A–C)