Abstract
Effects of water deficit on the chlorophyllide (Chlide) transformation pathway were studied in etiolated barley (Hordeum vulgare) leaves by analyzing absorption spectra and 77-K fluorescence spectra deconvoluted in components. Chlide transformations were examined in dehydrated leaves exposed to a 35-ms saturating flash triggering protochlorophyllide (Pchlide) and Chlide transformation processes. During the 90 min following the flash, we found that dehydration induced modifications of Chlide transformations, but no effect on Pchlide phototransformation into Chlide was observed. During this time, content of NADPH-Pchlide oxydoreductase in leaves did not change. Chlide transformation process in dehydrated leaves was characterized by the alteration of the Shibata shift process, by the appearance of a new Chlide species emitting at 692 nm, and by the favored formation of Chl(ide) A668F676. The formation of Chl(ide) A668F676, so-called “free Chlide,” was probably induced by disaggregation of highly aggregated Chlide complexes. Here, we offer evidence for the alteration of photoactive Pchlide regeneration process, which may be caused by the desiccation-induced inhibition of Pchlide synthesis.
The greening process in etiolated angiosperms starts with the light-requiring step known as photoreduction of protochlorophyllide (Pchlide) into chlorophyllide (Chlide), which is catalyzed by the photoenzyme NADPH-Pchlide oxydoreductase (POR; Griffiths, 1978; Apel et al., 1980). Etiolated leaves contain photoactive PchlideA650F655 (A650, absorption maximum at 650 nm; F655, fluorescence maximum at 655 nm) and PchlideA636F645, which represent aggregated ternary POR-Pchlide-NADPH complexes (Ryberg et al., 1992). Etiolated leaves contain also a non-photoactive form, PchlideA628F633, which is considered to be a “free” pigment (Kahn et al., 1970). A very short light pulse (a few milliseconds) induces formation of several Chlide and partially esterified Chlide species, noted as Chl(ide), in etiolated leaves (Henningsen and Thorne, 1974). One of these species is a highly aggregated form of POR-Chlide-NADPH complex, which is characterized by fluorescence emission and absorption maxima at 695 nm and 684 nm, respectively (ChlideA684F695). It was found that ChlideA684F695 form is produced from the PchlideA650F655 via the aggregated Chlide-POR-NADP+ complex designated as ChlideA678F690 (El Hamouri et al., 1982; Oliver and Griffiths, 1982). Within the same time scale, a small amount of Chlide form emitting at 676 nm [Chl(ide) A668F676] appears and is often considered to be a “free Chlide” produced by dissociation of the POR-pigment-coenzyme complexes (Litvin and Belyaeva, 1971; Franck et al., 1997). Chl(ide) A668F676 has been suggested to represent pheophytin/chlorophyll (Chl)-containing complexes (Ignatov and Litvin, 1994). During the first 15 min of dark incubation after the flash, ChlideA684F695 converts into Chl(ide) A672F682, a process known as the Shibata shift, whereas Chl(ide) A668F676 remains a stable pigment form (Shibata, 1957; Franck, 1993a). Chlide is then transferred from a POR complex to the Chl synthase for a subsequent esterification, and then released POR enzyme binds newly synthesized PchlideA628F633 resulting in de novo formation of photoactive Pchlide complexes (Sundqvist and Dahlin, 1997).
It has been suggested that the same POR molecules undergo several regeneration cycles, assuring the continuity of the Chlide transformation process and Chl accumulation (Oliver and Griffiths, 1982). After the Shibata shift, Chl(ide) A674F684 appears concomitantly with the formation of photoactive photosystem II (PSII) units (Franck, 1993b). It has been shown that the accumulation of functional PSII units is dependent on the nature of different Chlide forms produced through the Pchlide photoreduction process. After a low-intensity flash (inducing a low extent of phototransformation), preferential accumulation of Chl(ide) A668F676 occurred, and the related absence of formation of ChlideA684F695 impaired the subsequent PSII active form assembly in barley (Hordeum vulgare) leaves (Franck et al., 1997). It was found that Chl biosynthetic processes are sensitive to different external factors (Eullaffroy et al., 1995; Eullaffroy and Popovic, 1997; Juneau et al., 1997). Earlier, it was also noticed that water shortage has an impact on the Chl biosynthesis in barley, probably due to the inhibition of Pchlide synthesis (Virgin, 1965). It was found that phototransformation can be completed in etiolated leaves desiccated by lyophilization, but no further transformation process occurred during the subsequent dark incubation (Dujardin, 1973). Recently it was shown that, in highly desiccated leaves, modifications in Chlide transformation may lead to the impairment of the assembly of the first functional PSII complexes, which normally appear within 90 min after a flash illumination (Le Lay et al., 2000).
The inactivation of different processes of photosynthesis under dehydration has often been related to modifications of the structure of the PSII complexes. Vapaavuori and Nurmi (1982) found that the PSII complexes are not stable in willow leaves exposed to dehydration, probably due to a weakening of the pigment-protein bonds under the water deficit conditions. In Lupin plants, it was also found that dehydration might cause the inactivation of PSII even if no physical loss of the reaction centers and core antenna could be observed. This was attributed to structural changes of the active PSII complexes as a consequence of lipid-related modifications in membrane composition (Ferrari-Iliou et al., 1984; Meyer and de Kouchkovsky, 1993). The reorganization of PSII core complexes through adaptive processes under water-deficit conditions was shown by Giardi et al. (1996). Dehydration has also an adverse effect on structural reorganization of etioplast membranes into chloroplast membranes by preventing etioplast-to-chloroplast transformation (Bourque et al., 1975). For greening barley leaves, it has been reported that dehydration affects electron transport on the oxidizing side of PSII, which was interpreted as a consequence of a structural alteration of the oxygen-evolving complex (Bhardwaj and Singhal, 1981).
In this work, we studied the change of Chlide transformation pathway in etiolated barley leaves exposed to desiccation. Trough identification of Chlide species appearing specifically under dehydration conditions, we attempt to determine the sites of effects induced by dehydration stress.
RESULTS
Absorption Spectra and Their Fourth Derivatives
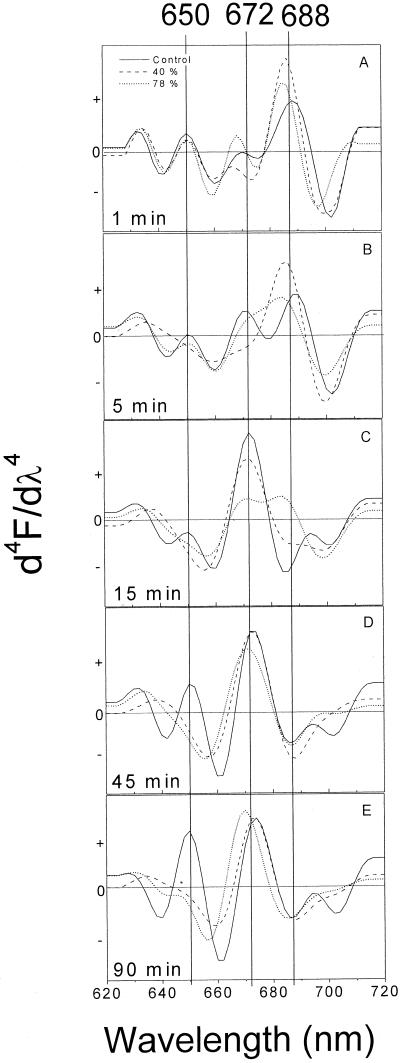
Fourth derivatives of absorption spectra from 600 to 800 nm of hydrated leaves and those desiccated up to 40% and 78% weight loss (corresponding to relative water content [RWC] values of 54 ± 3 and 12 ± 1, respectively) are presented in Figure 1. In control leaves, the majority of Pchlide was phototransformed into Chlide already 1 min after the flash, as indicated by the appearance of a strong band at 688 nm and concomitant decrease of an absorption maximum at 650 nm. At the same time, the absorption peak at 688 nm was shifted to 686 and 684 nm in 40%- and 78%-desiccated leaves, respectively (Fig. 1A). In control leaves, 5 min after the flash, Shibata shift was progressing as indicated by the appearance of Chl(ide) A672 and by the concomitant decrease of its precursor ChlideA688 (Fig. 1B). It has been assumed that Chl(ide) A672 represents a mixture of newly released Chlide and its esterified form synthesized simultaneously during the Shibata shift process (Sironval et al., 1965; Henningsen and Thorne, 1974). However, ChlideA686 and ChlideA684 characteristic for desiccated leaves did not pass through the transformation 5 min following the flash. Already 15 min after the flash, a single major peak at 672 nm was well pronounced in the control leaves, indicating the end of the Shibata shift. At the same time, Shibata shift was also finished in 40%-desiccated leaves, whereas ChlideA684 form was not completely transformed in 78%-desiccated leaves. It appeared that this Chlide continued transformation during the following 30 min as indicated by the band at 671 nm (Fig. 1, C and D). A single Chl(ide) appeared at 672 nm for the 40%-desiccated leaves and at 673 nm for the control (Fig. 1D). The blue shift of the Chlide absorption maximum already observed in 78%-desiccated leaves after 45 min was even more pronounced in spectra measured 90 min after the flash since the main peak was observed at 670 nm (Fig. 1E). For both control and 40%-desiccated leaves, the main absorption band was around 674 nm (Fig. 1E). Pchlide A650 regeneration process is well pronounced from 45 to 90 min following the flash, as indicated by the absorption band at 650 nm in control leaves. However, in desiccated leaves the regeneration of PchlideA650 did not occur as indicated by the absence of the 650-nm band (Fig. 1, D and E).
Figure 1.
Fourth derivative of absorption spectra for 1 (A), 5 (B), 15 (C), 45 (D), and 90 (E) min after the flash. Spectra are presented for 40%- to 78%-desiccated and non-desiccated leaves. For spectra treatment, see “Materials and Methods.”
Topological Visualization of Absorption Spectra during Chlide Transformation
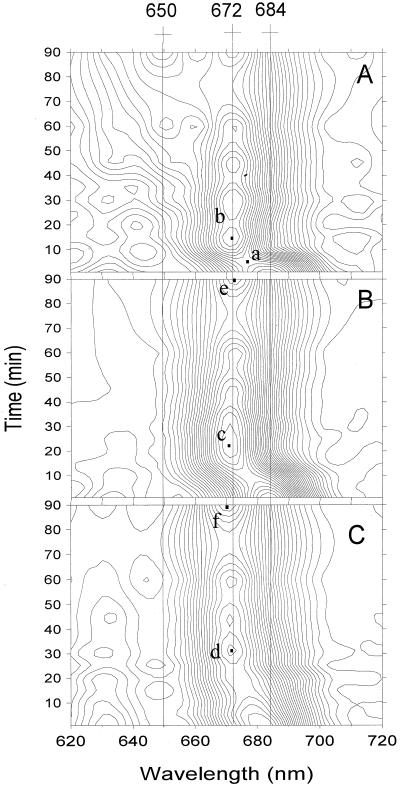
The topological representation of absorption spectra provides a convenient way to follow the continuity of Chlide transformation and to identify the appearance of different Chlide species according to time and wavelength. The gradual transformation of ChlideA684 into Chl(ide) A672 was characterized in the control leaves by a symmetrical saddle shape whose center was localized at 677 nm and 3 min on the topological presentation (Fig. 2A, point a). For leaves exposed to water deficit, the shape of the symmetrical saddle was modified in 40%-desiccated leaves and was not pronounced at all in 78%-desiccated leaves, showing modifications of ChlideA684 transformation through the Shibata shift (Fig. 2, B and C). In the control leaves, the Chlide peak appearing at 672 nm within 15 min after a flash as a product of the Shibata shift did not change its position on the map during the following 90 min (Fig. 2A, point b). For 40% dehydration, the first obvious Chlide band was detected at 670.5 nm and 23 min (Fig. 2B, point c). For 78% dehydration, the first band position was shifted to 671.5 nm and 30 min on the topological scheme (Fig. 2C, point d), showing a delay in the Shibata shift and confirming the blue shift of the Chlide bands detected earlier by absorption spectra. Afterwards, 90 min following a flash, these peaks were shifted to 672.5 and 670.5 nm, respectively (Fig. 2, B and C, points e and f).
Figure 2.
Topological presentation of absorption spectra changes after 1, 5, 10, 15, 20, 25, 35, 45, 60, and 90 min following the flash. A, Control. B, Forty percent-desiccated leaf. C, Seventy-eight percent-desiccated leaf. Crosses placed above curves indicate characteristic wavelengths. Point a, Center of the symmetrical saddle. Points b–d, The first stable Chlide peak for control and 40%- and 78%-desiccated leaf appearing after illumination, respectively. Points e and f, Chlide peak after 90 min in 40%- and 78%-desiccated leaf, respectively.
This methodological approach also showed the effects of desiccation on the Pchlide regeneration process. For control leaves, the inflection of iso-intensity contours around 650 nm and after 30 min following a flash illumination indicates the beginning of the photoactive Pchlide regeneration process, and 90 min after a flash the pronounced peak at 650 nm indicates a significant regeneration of PchlideA650 (Fig. 2A). For the desiccated leaves, no inflection of the iso-intensity contours and no peak at 650 nm were seen, suggesting again the inhibition of the photoactive Pchlide regeneration process by water deficit (Fig. 2, B and C).
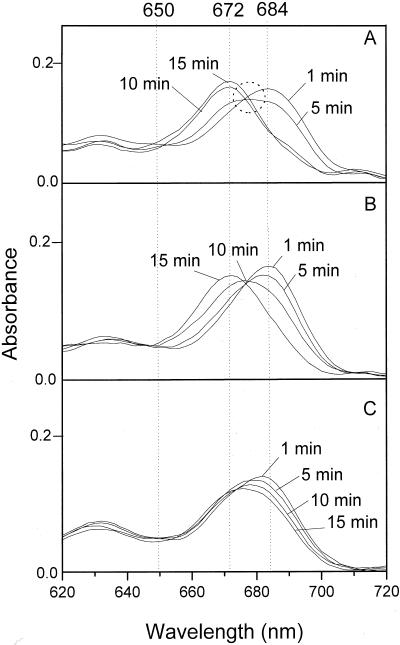
When absorption spectra of control leaves recorded 1 to 15 min of dark incubation following a saturating flash were plotted together, the plot showed the convergence of all the spectra to the same wavelength region (Fig. 3A). The convergence region, which is the equivalent of the symmetrical saddle seen in the three-dimensional representation, has been described by Shibata (1957) as a characteristic of Chlide spectral shifts. Therefore, the absence of a clear convergence region of the absorption spectra in 78%-desiccated leaves during the Chlide transformation process indicates its modification by the water deficit (Fig. 3C).
Figure 3.
The changes of absorption spectra during 15 min following the flash. A, Control. B and C, Forty percent- and 78%-desiccated leaves, respectively, at 1, 5, 10, and 15 min after a saturating flash. Dashed circle indicates the convergence region of the spectra.
Absorption Values at 650 nm and the POR Protein Content
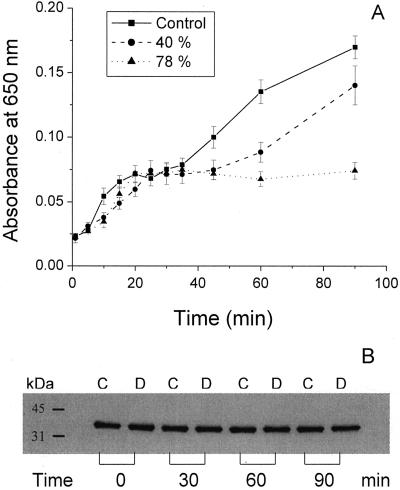
The inhibition level of the photoactive Pchlide regeneration was estimated by comparing the absorption values of photoactive Pchlide (650 nm) for control and treated leaves at different times following the flash. We found that no modifications of the regeneration process occurred in desiccated leaves during the first 30 min after the flash (Fig. 4A). However, photoactive Pchlide continued to accumulate in control leaves and, at a lower rate, in 40%-desiccated leaves, attaining approximately 80% of its control level during the next 60 min of dark incubation. The additional accumulation was not observed for 78%-desiccated leaves after the initial 30-min regeneration period. Here, we used western blot in order to find out if this impairment of PchlideA650 regeneration process was due to a change in the POR protein content. In 40%-desiccated leaves, during 90 min of dark incubation no differences in the respective POR contents were observed compared to the control (Fig. 4B).
Figure 4.
A, Changes of the absorption values at 650 nm for control and 40%- and 78%-desiccated leaves. sds are shown by error bars. B, Immunoblot analysis of POR protein content for control (C) and 40%-desiccated (D) leaves, after 30, 60, and 90 min following the flash. Nonilluminated samples are indicated with 0 min.
Fluorescence Spectra and Deconvolution into Gaussian Components
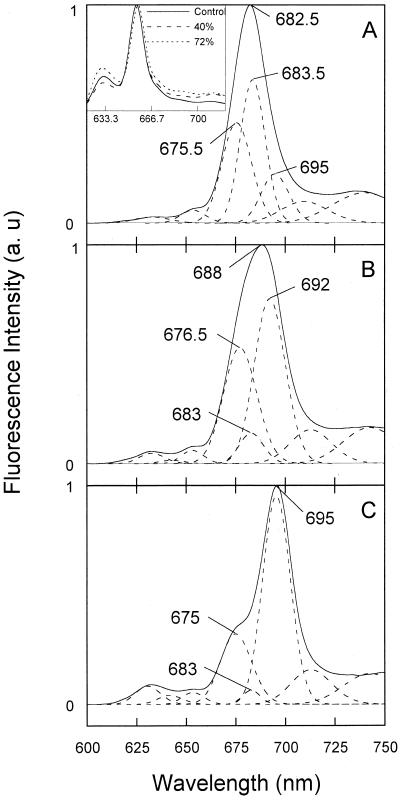
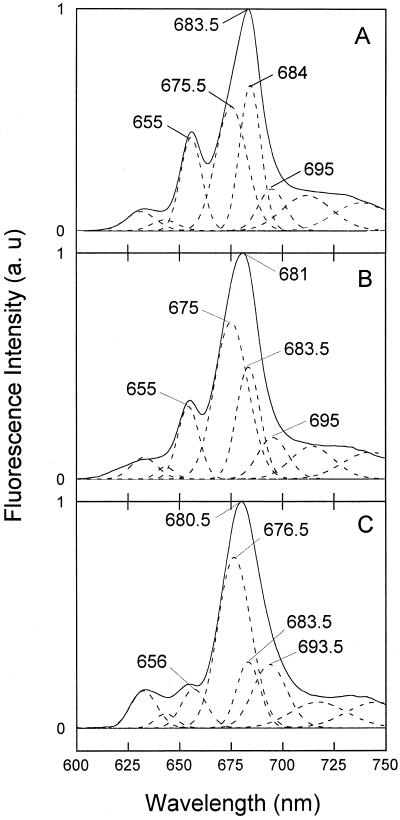
Due to the strong overlap of the Chlide absorption bands, we used fluorescence spectra at low temperature (77 K) and deconvolution analysis to better identify spectral changes resulting from desiccation. We found that the appearance and amplitudes of the Gaussian components (at 632, 643, 654, 674, 683.5, 695, 710, and 752 nm) in the spectra recorded 1 min after the flash were not affected by water deficit, indicating that Pchlide phototransformation normally occurred (spectra not shown). However, in nonilluminated leaves, the amplitude of the 632-nm component was slightly higher in spectra of highly desiccated leaves (Fig. 5A, inset), which was interpreted by Dujardin (1973) as a small degradation of Pchlide complexes due to severe dehydration. In control leaves, the fluorescence spectra recorded 15 min after the flash represented the normal Chlide composition indicated by the high ratio of Chl(ide) F683.5/ChlideF695 characteristic for completed Shibata shift process (Fig. 5A). In 74%-desiccated (RWC = 15 ± 1), this ratio was much smaller, suggesting the inhibition of the Shibata shift (Fig. 5C). In 40%-desiccated leaves, the deconvolution of the fluorescence emission spectra recorded 15 min after the illumination did not permit insertion of a 695-nm component without increasing the error tremendously (see Fig. 5B). The used deconvolution procedure indicated a component with maximum fluorescence emission at 692 nm instead of the ChlideF695 (Fig. 5B). Fluorescence spectra of control leaves showed that the major component 90 min following the illumination was Chl(ide) F684. In addition, the Chl(ide) F675.5 increased during this time, and the accumulation of photoactive Pchlide (PchlideF655) occurred through the regeneration process (Fig. 6A). In 40%-desiccated leaves 90 min after the flash, the participation of Chl(ide) F683.5 was diminished, which indicates an impaired Shibata-shift process (Fig. 6B). The relative contribution of the 675 nm component 90 min after the flash increased in parallel with the increased desiccation level, causing a blue-shift in the measured spectra from 683.5 nm in control to 680.5 nm in highly desiccated leaves (Fig. 6, B and C).
Figure 5.
Gaussian deconvolution of 77-K fluorescence-emission spectra 15 min after the flash. A, Control leaves. B, Forty percent-desiccated leaves. C, Seventy-four percent-desiccated leaves. The solid lines represent the experimental curves and the broken lines the Gaussian components of the deconvoluted spectra. Where necessary, the band positions are indicated. Inset, 77-K Fluorescence spectra of etiolated barley leaves before illumination and exposed to different levels of dehydration.
Figure 6.
Gaussian deconvolution of 77-K fluorescence emission spectra 90 min after the flash. A, Control. B, Forty percent-desiccated leaves. C, Seventy-four percent-desiccated leaves. Other details are the same as described in Figure 5 legend.
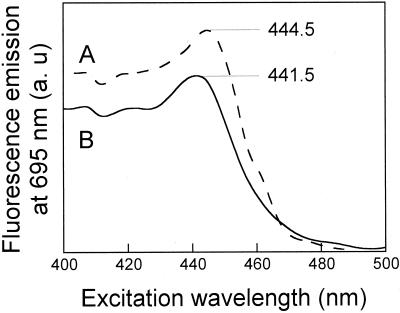
In order to distinguish the 692-nm Chlide from the 695-nm Chlide form (characteristic for the control), their fluorescence-excitation spectra were examined at 695 nm. We found excitation maxima at 441.5 and 444.5 nm for the desiccated and control leaves, respectively, indicating the presence of two different Chlide forms (Fig. 7).
Figure 7.
Excitation spectra measured for fluorescence emission at 695 nm. A, Control leaf 1 min after the flash. B, Forty-percent-desiccated leaf 15 min after the flash. Numbers indicate wavelengths of the excitation maxima.
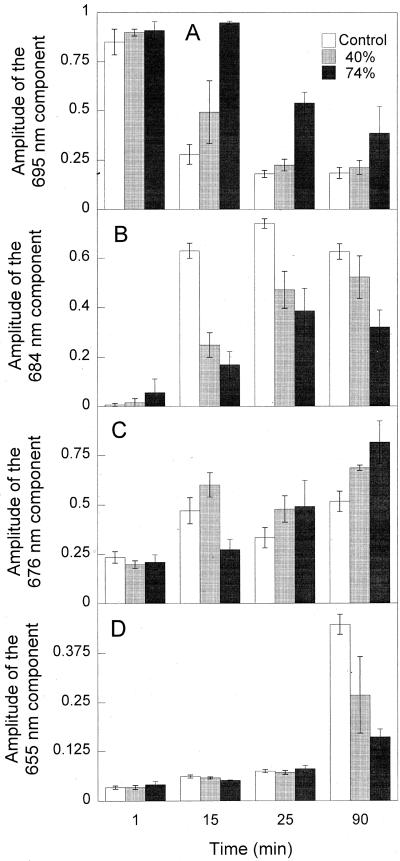
Relative participations of both ChlideF695 and Chl(ide) F684 from 1 to 90 min reveal that dehydration process slows down transformation of ChlideF695 into Chl(ide) F684 through the Shibata shift (Fig. 8, A and B). However, the participation of the so-called “free” Chlide form, Chl(ide) F676 was increased in dehydrated leaves compared with control leaves (Fig. 8C). Relative decrease of amplitude of PchlideF655 at 90 min following the flash indicates that dehydration of etiolated leaves significantly inhibits the regeneration process of photoactive Pchlide (Fig. 8D).
Figure 8.
Representation of the temporal evolution of 695 nm (A), 684 nm (B), 676 nm (C), and 655 nm (D) components by deconvolution analysis of the fluorescence spectra. sds are shown by error bars.
DISCUSSION
Evidence for Dehydration Effects on Chlide Transformation Process
In this study, we show that Chlide transformations are modified by water deficit at various levels but that the phototransformation step of active Pchlide into Chlide occurs normally. The activity of POR enzyme has been observed under extreme conditions, such as temperature as low as −70°C (Böddi, 1994) or in lyophilized leaves dehydrated to 85% weight loss (Dujardin, 1973). In this study, in contrast to lyophilized leaves, we observed the dark shifts after phototransformation even in severely desiccated leaves (78% weight loss).
In hydrated leaves (control samples), the Shibata shift is characterized by the existence of both the convergence region of absorption spectra and the symmetrical saddle on the topological representation. However, water deficit induced changes in the shape of the symmetrical saddle (Fig. 2, B and C) and the disappearance of the convergence region for highly desiccated leaves (Fig. 3C). Shibata (1957) interpreted the convergence region as a direct conversion of one substrate into its product. Therefore, we may interpret the loss of the convergence region and the change of the symmetrical saddle shape as a consequence of a modification of the Shibata shift process induced by dehydration.
Inhibition of Shibata shift, as shown by the persistence of its substrate (Chlide A684F695) in dehydrated plants (Fig. 8A), has already been observed after a low-temperature treatment at 0°C in etiolated barley leaves (Eullaffroy et al., 1995). It appeared that under water-deficit conditions, esterification of Chlide was inhibited (Le Lay et al., 2000). One can expect that the lack of consumption of Chlide through esterification process may cause the inhibition of the Shibata shift.
Deconvolution of the 77 K fluorescence emission spectra revealed a new Chlide form produced under some dehydration conditions, indicating a change of the Chlide transformation pathway. As shown, spectra recorded 15 min after a 35-ms flash for the leaves exposed to 40% desiccation indicated the presence of a Chlide form emitting at 692 nm, which is usually not found under normal conditions (Fig. 5B). The different identity of the Chlide form emitting at 692 nm compared with ChlideA684F695 was indicated by their difference in excitation bands (Fig. 7). We assume that the dehydration-induced Chlide form may represent an additional intermediate in the Shibata shift process produced via ChlideA684F695 transformation. The formation of this intermediate may be due to a change in the molecular environment of the Chlide molecule during dehydration treatment.
It appears that the effect of severe desiccation on the Chlide transformation is characterized by the increased formation of Chl(ide) A668F676 and by the diminished presence of the Chl(ide) A672F684 form. Under normal conditions, minor Chl(ide) A668F676 has been suggested to originate from ChlideA678F690 disaggregation (Litvin and Belyaeva, 1971; Franck et al., 1997). The Chlide A678F690 complex is also a precursor for the ChlideA684F695 as a major product (Franck et al., 1997). The inhibition of Chl(ide) A668F676 formation by substitution of H2O with D2O was assumed by Ignatov and Litvin (1998) to be the consequence of the stabilization of Chlide dimers (Mathis and Sauer, 1972, 1973). Therefore, we suppose that in dehydrated leaves, the ChlideA684F695, apart from being involved in the Shibata shift, may become a precursor for the Chl(ide) A668F676 formation through a disaggregation process.
Dehydration Effect on Regeneration of Photoactive Pchlide
During the Shibata shift process, simultaneous photoactive Pchlide regeneration takes place, which is characterized by the association of POR enzyme released during the Shibata shift with the newly synthesized PchlideA628F633 (Bogorad et al., 1968). Our results showed that the regeneration of photoactive Pchlide reached 80% and only 28% of the control level in 40%- and 78%-desiccated leaves, respectively. It was evident that the dehydration did not affect the formation of photoactive Pchlide during the first 30 min after illumination since, during this time, the pool of non-photoactive Pchlide serves as a precursor for photoactive Pchlide regeneration (Fig. 4A). Moreover, this suggests that binding of POR to its substrate (non-photoactive Pchlide) was not impaired by the desiccation. This could appear contradictory with our indications that dehydration effects may induce a weakening of pigment-protein bonds. However, according to Oliver and Griffiths (1982), Pchlide molecules show a much higher affinity for the POR enzyme compared with those between Chlide and POR.
One can suppose that decrease of re-accumulation of PchlideA650F655 form may involve degradation of POR protein and/or an inhibition of its synthesis. However, we have clearly shown that the amounts of POR enzyme in desiccated leaves during 90 min after the flash did not change compared with control (Fig. 4B). Therefore, the decrease in the amount of regenerated photoactive complexes from 30 to 90 min after the flash may only be due to inhibition of de novo accumulation of inactive Pchlide. Indeed, this has been shown very early by Virgin (1965) to be the main reason for the decrease in the Chl a accumulation under dehydration of etiolated barley leaves.
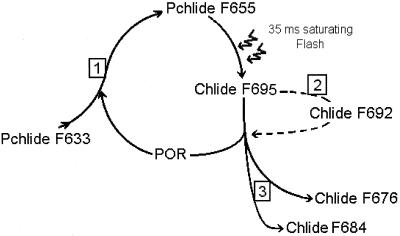
In summary, we may distinguish various steps during the Chlide transformation pathway affected by dehydration. It appears that water stress induces a decrease of de novo PchlideA628F633 synthesis necessary for the continuity of Chlide transformation and Chl synthesis process, as shown in Figure 9, site 1. It was found that impaired Shibata shift results in formation of ChlideF692 (Fig. 9, site 2). The preferential formation of Chl(ide) A668F676 induced by dehydration can be considered as another effect (Fig. 9, site 3). Therefore, our results show that dehydration effects on the Chlide transformation have complex aspects and demand further investigations in the future.
Figure 9.
Presentation of Chlide transformation pathway with indications of the sites of desiccation effects. See “Discussion” for further details.
MATERIALS AND METHODS
Plant Material and Experimental Conditions
We used etiolated barley (Hordeum vulgare var. Sophie) leaves from seedlings grown on moisturized vermiculite in darkness and at 25°C during 6 d. Four-cm-long pieces of leaves were used for experiments, and desiccation treatment of the leaves for 1 to 4 h was done with phosphorous pentoxide (P2O5) as a desiccant. The weight loss of the leaves was used as an indicator of dehydration degree. In order to define the leaf water status, we used a commonly employed physiological parameter, RWC, determined as follows: RWC = (fresh weight − dry weight)/(water-saturated weight − dry weight) (Turner, 1981). Fresh weight represents the leaf weight after desiccation treatment and water saturated weight of leaves represents the weight measured immediately after cutting the leaves with no previous exposure to water stress. Dry weight of the leaves was obtained with division of water-saturated weight by 10. This number represents the stable ratio between the weight of fully hydrated leaves and their dry weight obtained after drying them overnight at 80°C in an oven. Plants used for the experiments were from the same selected group and age. We insured that, under these experimental conditions, water loss of the leaves during this 90-min period of dark incubation did not exceed 5% of the initial weight. The water loss of 40%, 74%, and 78%, corresponds to RWC values of 54 ± 3, 15 ± 1, and 12 ± 1, respectively. We found no difference regarding absorption and fluorescence spectra between plants desiccated up to 74% or 78% weight loss. To avoid undesired light effects, all the manipulations were performed under weak green light. Saturating polychromatic flash of 35 ms obtained by a portable flash lamp (Rollei-E-Re, Rollei, Braunschweig, Germany) was used to trigger phototransformation of Pchlide into Chlide. The leaves were then incubated in the dark for different time periods up to 90 min before measurements.
Absorption Spectra and Topological Analysis
After the flash, the change of absorption spectra of the same leaf at room temperature was measured during 90 min by using a spectrophotometer (model UV-2101 PC, Shimadzu, Columbia, MD). For the baseline acquisition, opal-glass filters were used according to Shibata (1957). For these measurements, dark-grown leaf was fixed on a narrow beam window by using a glass cuvette as a sample holder. A cuvette with a beam window of the same size and with no leaf was used as a reference. In these experiments, by using a single leaf we were able to study the process from 1 to 90 min after the flash and to avoid the effects of the sample diversity introduced with the use of different leaves for each measurement. By recording successive spectra of the same unilluminated leaf, we carefully tested that the analytical light did not induce any photoreduction of photoactive Pchlide. Linear smoothing of the absorption spectra was repeated 300 times taking three points of the spectra and then was followed by a similar smoothing procedure with five points and with a repetition of 500 times. We found that this methodological procedure did not change the characteristics of the spectra. The results obtained from five leaves for every desiccation treatment were averaged. Topological projection of the absorption spectra was calculated by using the leaf absorption spectra measured at 5, 10, 15, 20, 25, 30, 45, 60, and 90 min after the flash. The data were drawn with the Surfer software (version 5.02, Surfer Software Inc., Oakton, VA).
Fluorescence Spectroscopy with Deconvolution
To measure emission spectra, the Chlide transformation process was interrupted by immersing the leaves into liquid nitrogen after 1-, 15-, 25-, or 90-min dark periods following the flash. The fluorescence emission spectra were recorded between 600 and 750 nm at 77 K by using a luminescence spectrometer (model LS 50-B, Perkin Elmer, Norwalk, CT). We used a low-pass green filter (λ < 580 nm; model 59070, Oriel, Stratford, CT) for excitation light and a high-pass filter (λ > 600 nm; model 59512, Oriel) for emitted light, and excitation wavelength was set up at 435 nm. The same experimental device was used for the excitation spectra between 350 and 500 nm and for an emission at 695 nm.
Before deconvolution, a baseline was subtracted and the fluorescence spectra were corrected for differential sensitivity of the photomultiplier. The fluorescence spectra were deconvoluted with the SPSERV program (Csaba Bagyinka, Biological Research Center of the Hungarian Academy of Sciences, Szeged, Hungary), where results obtained by deconvolution procedure were considered acceptable only when the difference of the sum of the Gaussian components from the experimental spectra did not exceed 1%. For more details, see Böddi and Franck (1997).
Protein Extraction and Western-Blot Analysis
A sample of five detached leaves was frozen in liquid nitrogen and ground to a powder with a mortar and pestle. To extract total proteins, the powder was mixed up with sample buffer (Laemmli, 1970) in the ratio 1:10 (w/v) and then heated to 65°C for 15 min. The buffer volume used for each sample was determined on the basis of the fresh weight of the leaves measured immediately after harvesting and before they were exposed to any desiccation treatment. After a centrifugation in a microcentrifuge at 16,000g for 15 min, aliquots of the protein extracts were diluted 10 times with the sample buffer. Volumes of 5 μL of each diluted extract were loaded onto 10% to 20% SDS-polyacrylamide gradient minigel and electrophoresed (Laemmli, 1970), and then separated proteins were electroblotted onto polyvinylidene difluoride membrane (Boehringer Mannheim, Mannheim, Germany). The western blots were blocked using 1% (w/v) albumine and then incubated with a rabbit antiserum containing polyclonal antibodies against POR from barley (Barthélémy et al., 2000) diluted 1:10,000 with the blocking buffer. The blots were washed and then incubated with a horseradish peroxidase conjugated to goat anti-rabbit IgG purchased from Pierce (Rockford, IL) and diluted 1:80,000 with the blocking buffer. The immunoreactive protein bands were then visualized by using a chemiluminescent substrate (Pierce) according to the manufacturer's instructions, and then they were recorded on x-ray film (Fuji, Tokyo).
ACKNOWLEDGMENT
We thank Fabrice Franck for the antiserum containing polyclonal antibodies against POR from barley.
Footnotes
This work was supported by the Natural Sciences and Engineering Council of Canada (grant no. GP0093404 awarded to R.P.) and by Fonds pour la Formation de Chercheurs et l'Aide à la Recherche (fellowships to P.L. and P.J.).
LITERATURE CITED
- Apel K, Santel H-J, Redlinger TE, Falk H. The protochlorophyllide holochrome of barley (Hordeum vulgare L.): isolation and characterization of the NADPH-protochlorophyllide oxydoreductase. Eur J Biochem. 1980;111:251–258. doi: 10.1111/j.1432-1033.1980.tb06100.x. [DOI] [PubMed] [Google Scholar]
- Barthélémy X, Bouvier G, Radunz A, Docquier S, Schmid GH, Franck F. Localization of NADPH-protochlorophyllide reductase in plastids of barley at different greening stages. Photosynth Res. 2000;64:63–76. doi: 10.1023/A:1026576319029. [DOI] [PubMed] [Google Scholar]
- Bhardwaj R, Singhal GS. Effect of water-stress on photochemical activity of chloroplasts during greening of etiolated barley seedlings. Plant Cell Physiol. 1981;22:155–162. [Google Scholar]
- Böddi B. Spectral, biochemical and structural changes connected to protochlorophyllide photoreduction in chlorophyll biosynthesis. Hum Environ Sci. 1994;3:39–55. [Google Scholar]
- Böddi B, Franck F. Room temperature fluorescence spectra of protochlorophyllide and chlorophyllide forms in etiolated bean leaves. J Photochem Photobiol B Biol. 1997;41:73–82. [Google Scholar]
- Bogorad L, Laber L, Gassman M. Aspects of chloroplast development: transitory pigment-protein complexes and protochlorophyllide regeneration. In: Shibata K, Takamiya A, Jagendorf A, Fuller RC, editors. Comparative Biochemistry and Biophysics. PA: University Park Press, State College; 1968. pp. 299–312. [Google Scholar]
- Bourque DP, Mc Millar PN, Cligenpeel WJ, Naylor AW. Ultrastructural effects of water-stress on chloroplast development in Jack bean (Canavalia ensiformis [L.] DC) Plant Physiol. 1975;56:160–163. doi: 10.1104/pp.56.1.160. [DOI] [PMC free article] [PubMed] [Google Scholar]
- Dujardin E. Pigments: lipoprotein complexes in the lyophilized etiolated leaf. Photosynthetica. 1973;7:121–131. [Google Scholar]
- El Hamouri B, Brouers M, Sironval C. Pathway from photoactive P633-628 protochlorophyllide to P696-682 chlorophyllide in cucumber etioplast suspensions. Plant Sci Lett. 1982;21:375–379. [Google Scholar]
- Eullaffroy P, Popovic R. Effect of heat treatment on protochlorophyllide phototransformation initiated by different light intensities. J Plant Physiol. 1997;151:293–298. [Google Scholar]
- Eullaffroy P, Salvetat R, Franck F, Popovic R. Temperature dependence of chlorophyll(ide) spectral shifts and photoactive protochlorophyllide regeneration after flash in etiolated barley leaves. J Photochem Photobiol B Biol. 1995;62:751–756. [Google Scholar]
- Ferrari-Iliou R, Thu Pham Thi A, Vieira da Silva J. Effect of water stress on the lipid and fatty acid composition of cotton (Gossypium hirsutum) chloroplasts. Physiol Plant. 1984;62:219–224. [Google Scholar]
- Franck F. Photosynthetic activities during early assembly of thylakoid membranes. In: Ryberg M, Sundqvist C, editors. Pigment-Protein Complexes in Plastids: Synthesis and Assembly. San Diego: Academic Press; 1993a. pp. 365–381. [Google Scholar]
- Franck F. On the formation of photosystem II chlorophyll-proteins after a short light flash in etiolated barley leaves, as monitored by in vivo fluorescence spectroscopy. J Photochem Photobiol B Biol. 1993b;18:35–40. [Google Scholar]
- Franck F, Eullaffroy P, Popovic R. Formation of long-wavelength chlorophyllide (Chlide695) is required for the assembly of Photosystem II in etiolated barley leaves. Photosynth Res. 1997;51:107–118. [Google Scholar]
- Giardi MT, Cona A, Geiken B, Kucera T, Masojídek J, Mattoo AK. Long-term drought stress induces structural and functional reorganization of photosystem II. Planta. 1996;199:118–125. [Google Scholar]
- Griffiths WT. Reconstitution of chlorophyllide formation by isolated etioplast membranes. Biochem J. 1978;174:681–692. doi: 10.1042/bj1740681. [DOI] [PMC free article] [PubMed] [Google Scholar]
- Henningsen KW, Thorne SW. Esterification and spectral shifts of chlorophyll(ide) in wild-type and mutant seedlings developed in darkness. Physiol Plant. 1974;30:82–89. [Google Scholar]
- Ignatov NV, Litvin FF. Photoinduced formation of pheophytin/chlorophyll-containing complexes during the greening of plant leaves. Photosynth Res. 1994;42:27–35. doi: 10.1007/BF00019055. [DOI] [PubMed] [Google Scholar]
- Ignatov NV, Litvin FF. A comparative study of the terminal stages of chlorophyll biosynthesis before and after heavy water (D2O) introduction into greening plant leaves. Photosynth Res. 1998;56:83–93. [Google Scholar]
- Juneau P, Eullaffroy P, Popovic R. Evidence of UVB effect on the photoconversion of active protochlorophyllides into chlorophyllides in etiolated barley leaves. Photochem Photobiol. 1997;65:564–569. [Google Scholar]
- Kahn A, Boardman NK, Thorne SW. Energy transfer between protochlorophyllide molecules: evidence for multiple chromophores in the photoactive protochlorophyllide-protein complex in vivo and in vitro. J Mol Biol. 1970;48:85–101. doi: 10.1016/0022-2836(70)90220-2. [DOI] [PubMed] [Google Scholar]
- Laemmli UK. Cleavage of structural proteins during the assembly of the head of bacteriophage T4. Nature. 1970;222:680–685. doi: 10.1038/227680a0. [DOI] [PubMed] [Google Scholar]
- Le Lay P, Eullaffroy P, Juneau P, Popovic R. Evidence of chlorophyll synthesis pathway alteration in desiccated barley leaves. Plant Cell Physiol. 2000;41:565–570. doi: 10.1093/pcp/41.5.565. [DOI] [PubMed] [Google Scholar]
- Litvin FF, Belyaeva OB. Sequence of photochemical and dark reactions in the terminal stage of chlorophyll biosynthesis. Photosynthetica. 1971;5:200–209. [Google Scholar]
- Mathis P, Sauer K. Circular dichroism studies on the structure and the photochemistry of protochlorophyllide and chlorophyllide holochrome. Biochim Biophys Acta. 1972;267:498–511. doi: 10.1016/0005-2728(72)90178-8. [DOI] [PubMed] [Google Scholar]
- Mathis P, Sauer K. Chlorophyll formation in greening bean leaves during early stages. Plant Physiol. 1973;51:115–119. doi: 10.1104/pp.51.1.115. [DOI] [PMC free article] [PubMed] [Google Scholar]
- Meyer S, de Kouchkovsky Y. Electron transport, photosystem-2 reaction centers and chlorophyll-protein complexes of thylakoids of drought resistant and sensitive Lupin plants. Photosynth Res. 1993;37:49–60. doi: 10.1007/BF02185438. [DOI] [PubMed] [Google Scholar]
- Oliver RP, Griffiths WT. Pigment-protein complexes of illuminated etiolated leaves. Plant Physiol. 1982;70:1019–1025. doi: 10.1104/pp.70.4.1019. [DOI] [PMC free article] [PubMed] [Google Scholar]
- Ryberg M, Artus N, Böddi B, Lindsten A, Wiktorsson B, Sundqvist C. Pigment-protein complexes of chlorophyll precursors. In: Argyroudi-Akoyunoglou JH, editor. Regulation of Chloroplast Biogenesis. New York: Plenum Press; 1992. pp. 217–224. [Google Scholar]
- Shibata K. Spectroscopic studies on chlorophyll formation in intact leaves. J Biochem. 1957;44:147–173. [Google Scholar]
- Sironval C, Michel-Wolwertz MR, Madsen A. On the nature and the possible functions of the 673- and 684 mm forms in vivo of chlorophyll. Biochim Biophys Acta. 1965;94:344–354. doi: 10.1016/0926-6585(65)90043-9. [DOI] [PubMed] [Google Scholar]
- Sundqvist C, Dahlin C. With chlorophyll pigments from prolamellar bodies to light-harvesting complexes. Physiol Plant. 1997;100:748–759. [Google Scholar]
- Turner NC. Techniques and experimental approaches for the measurement of plant water status. Plant Soil. 1981;58:339–366. [Google Scholar]
- Vapaavuori E, Nurmi A. Chlorophyll-protein complexes in Salix sp. “Aquatica Gigantea” under strong and weak light: II. Effect of water-stress on the chlorophyll-protein complexes and chloroplast ultrastructure. Plant Cell Physiol. 1982;23:791–801. [Google Scholar]
- Virgin HI. Chlorophyll formation and water deficit. Physiol Plant. 1965;18:994–1000. [Google Scholar]


