

Abstract
A minor phospholipid was isolated from potato (Solanum tuberosum L. cv Bintje) cells, chromatographically purified, and identified by electrospray ionization mass spectrometry as N-acylphosphatidylethanolamine (NAPE). The NAPE level was low in unstressed cells (13 ± 4 nmol g fresh weight−1). According to acyl chain length, only 16/18/18 species (group II) and 18/18/18 species (group III) were present. NAPE increased up to 13-fold in anoxia-stressed cells, but only when free fatty acids (FFAs) started being released, after about 10 h of treatment. The level of groups II and III was increased by unspecific N-acylation of phosphatidylethanolamine, and new 16/16/18 species (group I) appeared via N-palmitoylation. NAPE also accumulated in aerated cells treated with NaN3 plus salicylhydroxamate. N-acyl patterns of NAPE were dominated by 18:1, 18:2, and 16:0, but never reflected the FFA composition. Moreover, they did not change greatly after the treatments, in contrast with O-acyl patterns. Anoxia-induced NAPE accumulation is rooted in the metabolic homeostasis failure due to energy deprivation, but not in the absence of O2, and is part of an oncotic death process. The acyl composition of basal and stress-induced NAPE suggests the existence of spatially distinct FFA and phosphatidylethanolamine pools. It reflects the specificity of NAPE synthase, the acyl composition, localization and availability of substrates, which are intrinsic cell properties, but has no predictive value as to the type of stress imposed. Whether NAPE has a physiological role depends on the cell being still alive and its compartmentation maintained during the stress period.
N-Acylphosphatidylethanolamine (NAPE) is an unusual phospholipid class that occurs in very small amounts (<1% of total phospholipids) in a wide range of organisms. Its main characteristic is the presence of a third fatty acyl residue linked to the N atom of the ethanolamine head group by an amide bond. The biochemical properties of NAPE and of its derivatives have been extensively covered in the comprehensive monograph of Schmid et al. (1990), whereas Chapman (2000) has reviewed the younger research carried out in plants.
In mammalian tissues, a characteristic feature of NAPE is its propensity to accumulate under various pathological conditions involving degenerative membrane changes. This occurs, for instance, in the infarcted aeras of dog myocardial tissue (Epps et al., 1979, 1980), in ischemic rat brain (Moesgaard et al., 1999, 2000), in Glu- (Hansen et al., 1998, 1999) or in sodium azide-induced (Hansen et al., 2000) neurotoxicity, after UV-B irradiation of mouse epidermal cells (Berdyshev et al., 2000), and in models of rat brain necrosis but not apoptosis (Hansen et al., 2001). Several roles have been attributed to NAPE, including membrane bilayer protection (Newman et al., 1986; Domingo et al., 1993; Hansen et al., 1999) and stabilization (Akoka et al., 1988; Domingo et al., 1994; Lafrance et al., 1997), as an endocannabinoid precursor involved in cell signaling processes (Schmid et al., 1996; Schmid, 2000), and finally in response to stress (Berdyshev et al., 2000).
Similar roles have been postulated for plant NAPE. In rehydrating cotton (Gossypium hirsutum) seeds, NAPE was suggested to act as a membrane-protecting and -stabilizing compound (Sandoval et al., 1995). The involvement of NAPE in elicitor-induced signaling in tobacco (Nicotiana tabacum) cells (Chapman et al., 1995a, 1998) and leaves (Tripathy et al., 1999) was suggested from the modulation by N-acylethanolamine of short-term (e.g. inhibition of elicitor-induced medium alkalinization) and long-term (e.g. induction of Phe ammonia lyase gene expression) defense responses (Tripathy et al., 1999). Increased NAPE synthesis was also observed in post-germinative seedlings submitted to chilling stress (Chapman and Sprinkle, 1996). Together, these data point to a general involvement of NAPE in all those processes where cellular structures are either challenged or severely compromised.
In the course of our studies on the effects of anoxic stress on cultured potato (Solanum tuberosum L. cv Bintje) cells, we have recently reported the occurrence of a threshold in energy production rate below which cells were irreversibly committed to death. Two phases thus were identified during anoxia treatment: a prelytic phase, during which cells still cope with the decreasing energy supply and remain intact, followed by an autolytic phase, characterized by an extensive hydrolysis of membrane lipids consecutive to the activation of a lipolytic acyl hydrolase (LAH; Rawyler et al., 1999). However, this major event is not the only change in lipid composition identified in these cells.
Here, we present the first evidence to our knowledge that anoxic stress of potato cells induces the formation of NAPE. This effect occurs correlatively to the LAH-dependent release of free fatty acids (FFAs) from membrane lipids, and is mimicked by the use of metabolic inhibitors under normoxia, pointing out energy shortage as the common origin of these lipid changes. We also show that the N-acyl pattern of NAPE molecules generated under anoxia is essentially insensitive to the changes that occur simultaneously in the FFA pool, whereas the corresponding O-acyl pattern differs markedly from that prevailing under normoxic conditions. The significance of NAPE formation in anoxic plant cells is discussed with special reference to its involvement in membrane protection and as a stress marker for cell death caused by the failure of metabolic homeostasis.
RESULTS
Occurrence and Identification of NAPE in Potato Cells
When the phospholipids of normoxic cells were fractionated by thin-layer chromatography (TLC), a very faint spot, migrating ahead of diphosphatidylglycerol, was observed (Fig. 1, lane 1). After 14 h of O2 deprivation, lipid hydrolysis to FFAs had just started (Rawyler et al., 1999), reaching approximately 4% of total fatty acids, and an increased amount of this low polarity compound could be found in the phospholipid fraction of anoxic cells (Fig. 1, lane 2). This compound had a slightly higher mobility than N-palmitoyl-O-(1, 2-dipalmitoyl-sn-glycero-3-phosphoryl)-ethanolamine (Fig. 1, lane 3), a feature which can be ascribed to the presence of acyl chains longer than palmitate. A building block analysis of this compound revealed a fatty acid to phosphorus molar ratio close to 3, so we suspected it to be NAPE. An upscaled preparation of this phospholipid was started by incubating batch cultures of potato cells under anoxia for about 23 h. The putative NAPE was extracted and purified as described in “Materials and Methods.” Starting from 23 g cell fresh weight, we obtained approximately 1 mg of this compound, which cochromatographed with standard NAPE in two different solvent systems, had a fatty acid to phosphorus molar ratio of 2.81, and was judged pure because it produced a unique fluorescent spot after two-dimensional TLC analysis with the very sensitive primuline stain (not shown). A similar preparation was carried out with normoxic cells.
Figure 1.

One-dimensional TLC of the phospholipid fraction from normoxic and anoxic potato cells. Incubation was for approximately 14 h, at which time the FFA level was <1% under normoxia and 4% under anoxia. The plate was developed in chloroform:methanol:14% aqueous NH3 (80:20:2, v/v), and was visualized by spraying with 0.01% (w/v) primuline in acetone:water (1:1, v/v) followed by viewing under UV light (366 nm). Lane 1, Phospholipids from normoxic cells (50 mg cell fresh weight); lane 2, phospholipids from anoxic cells (51.5 mg cell fresh weight); lane 3, standard NAPE (approximately 30 nmol, higher spot), DPG (approximately 20 nmol, middle spot), and phosphatidylethanolamine (PE; approximately 40 nmol, lower spot). DPG, Diphosphatidylglycerol; PC, phosphatidylcholine; other PL, other phospholipids.
The purified phospholipids were then analyzed by electrospray ionization mass spectrometry (ESI-MS) in the negative mode. The instrument response was first checked with synthetic N-palmitoyl-O-(1, 2- dipalmitoyl-sn-glycero-3-phosphoryl)-ethanolamine. This standard NAPE gave a single [M-H]− (molecular mass minus proton) peak at m/z 928.59, in full agreement with the value of 928.74 computed from the sum of its constituents (not shown). Figure 2 shows that the high mass region of the spectrum (from m/z 920–1,040) presents several molecular ions that are perfectly consistent with a single phospholipid class showing the general NAPE structure. After protonation, the m/z value of all peaks in Figure 2 differed by less than 0.3‰ from their expected NAPE masses (Table I, columns 3 and 4). Two other phospholipid classes that also yield a fatty acid to phosphorus ratio of 3, acyl-phosphatidylglycerol and N-acyl-phosphatidyl-Ser, were examined. The former, despite a chromatographic behavior close to that of NAPE, could be excluded because none of its molecular species could account for any of the main peaks in Figure 2. The latter, in spite of presenting identical masses as some NAPE species, was discarded on the basis of its completely different chromatographic mobility (Schmid et al., 1990). Altogether, these data allow one to assign an unequivocal NAPE identity to this group of molecular ions.
Figure 2.

ESI-MS spectra of the putative NAPE class prepared from potato cells incubated either under normoxia or for 23 h under anoxia. The abcissa displays m/z values and the ordinate displays the relative abundance (in percent of the major peak). The ordinate scale was 6-fold higher in the lower portion than in the upper one (note also the difference in background noise). Numbers associated with peaks indicate [M-H]− (molecular mass minus proton) values in the negative mode. Shaded areas represent NAPE groups, each of them containing several species with different molecular masses (see Table I for additional details).
Table I.
ESI-MS identification, acyl composition, and relative amounts of the main NAPE molecular species found in potato cells under normoxia and after 23 h of anoxia
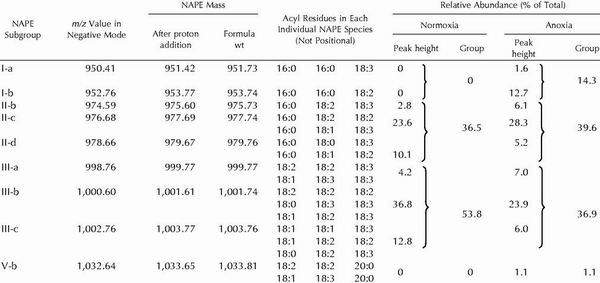 |
Labeled NAPE peaks of Figure 2 are described here by a group no. (Roman numerals) that refers to its total no. of acyl carbons and a lowercase letter associated to its own m/z value, and are listed as subgroups in the first column. The height of each labeled peak in Figure 2 was taken as a measure of its relative abundance. Groups were then made by summing the abundances of those species having the same number of acyl carbons. Note that in certain subgroups (II-c, II-d, III-a, III-b, III-c, and V-b), a single m/z value can yield more than one possible combination of acyl residues. Minor NAPE subgroups (II-a, II-d, II-f, III-d, and IV-a, accounting together for ≤10% of total NAPE) have been omitted for clarity.
From the m/z values reported in Figure 2, several NAPE species could be identified, which were divided in five groups according to their number of acyl carbons (Table I). Without any consideration of positional specificity of acyl residues, group I was made of 16/16/18 species, group II of 16/18/18 species, group III of 18/18/18 species, and group V of 18/18/20 species. Group IV, seldom encountered, was a minor set constituted of 16/18/20 species.
As shown by the shaded areas in Figure 2, a group can be constituted of peaks with different m/z values, called subgroups. More than one NAPE molecular species may be present in a subgroup because several combinations of acyl residues can give the same m/z value. For instance, subgroup III-b can be made of up to three individual NAPE species, 18:2/18:2/18:2, 18:1/18:2/18:3, and 18:0/18:3/18:3 (Table I), that all collected at m/z = 1,000.82 (Fig. 2, normoxia) and 1,000.60 (Fig. 2, anoxia). Most subgroups thus contained two or three individual species. Only three subgroups (I-a, I-b, and II-b) contained a single NAPE molecular species.
Level of NAPE in Potato Cells
As indicated in Table II, the NAPE level was very low under normoxia, not exceeding 0.2% of the total lipids. After 23 h of anoxia, the level of total lipids was not changed, but that of NAPE showed a 13-fold increase. It is interesting that ESI-MS analysis revealed that the basal NAPE was constituted of two groups only, namely groups II (approximately 37%) and III (approximately 54%), which were also the most prominent NAPE groups in anoxic cells (Table I). On the other hand, groups I, IV, and V were undetectable in normoxic cells, and appeared exclusively after anoxia treatment (Fig. 2). Among these newly synthesized NAPE molecules, those of group I (made of 16/16/18 species) accounted for 14% of total NAPE, whereas the minor groups V and IV represented 1% and less than 1%, respectively. In contrast with normoxia, group II became slightly more important than group III (Table I), suggesting that the formation of 16/18/18 species was also favored under anoxia. Because it was not possible (under our conditions) to distinguish between individual NAPE molecular species, the following results will deal essentially with the major NAPE subgroups, disregarding the minor ones.
Table II.
Amounts of total lipids (as total fatty acids) and NAPE in potato cells under normoxia or after 23 h of anoxia
| Lipids | Normoxia | Anoxia |
|---|---|---|
| Total fatty acids (μmol g fresh wt−1) | 21.9 ± 2.1 (8) | 22.5 ± 1.1 (3) |
| NAPE (nmol lipid P g fresh wt−1) | 13.8 ± 4.0 (10) | 179 ± 53 (3) |
| Relative NAPE level (in % of diacyl lipids) | 0.13 | 1.6 |
Values are mean ± sd and the no. of replicates is given in italics in parentheses. The amount of diacyl lipids (represented by the membrane phospho- and glycolipids) is calculated by dividing the total fatty acid level (given on a molar basis) by a factor of 2.
Time Course of NAPE Formation under Anoxia
It is clear that anoxia treatment of potato cells induced both quantitative and qualitative changes in the NAPE pool. Therefore, ESI-MS has been employed to follow in greater detail the changes in the level of various NAPE subgroups when potato cells were incubated under anoxia for up to 24 h (Fig. 3). The well-known LAH-catalyzed release of FFAs from membrane lipids in anoxic potato cells (Oberson et al., 1999; Rawyler et al., 1999; Pavelic et al., 2000) was monitored as an event marker and determined on the same samples. This autolytic event was initiated after a prelytic period of about 9 to 10 h of anoxia, and progressed steadily (Fig. 3A). The level of the NAPE class (Fig. 3B) followed a very similar kinetics, though on a approximately 20-fold lower scale, and increased more than 10 times after 24 h. The NAPE subgroups, whether present (Fig. 3, C and D) or not (Fig. 3, E and F) at the beginning of the treatment, remained constant up to the threshold time of about 9 to 10 h of anoxia, and only then increased in parallel to the FFA release, although with very different rates. For instance, after 12, 15, and 22 h of anoxia, the four main subgroups II-c (with its two species 16:0/18:2/18:2 and 16:0/18:1/18:3), II-d (with its two species 16:0/18:1/18:2 and 16:0/18:0/18:3), III-b (with its three species 18:2/18:2/18:2, 18:1/18:2/18:3 and 18:0/18:3/18:3), and I-b (with its unique species 16:0/16:0/18:2), accounted altogether for 74%, 76%, and 81% of all NAPE, whereas at least five other subgroups had to share the remaining 19% to 26% (Fig. 3, C–D). In addition, some NAPE species stopped their accumulation (Fig. 3C) or even started to decrease (Fig. 3, E and F) after 22 h of anoxia. Longer incubation times (up to 36 h) confirmed this trend (not shown), which must be primarily attributed to the simultaneous LAH activity.
Figure 3.

Levels of FFAs (A), of total NAPE (B) and of NAPE subgroups (C–F) in potato cells incubated up to 24 h under anoxia (black symbols). Normoxic controls appear as white symbols in A and B, but are omitted in C through F for clarity. In A, the total fatty acid level corresponding to 100% was 21.9 ± 2.1 μmol g fresh weight−1 (n = 8). The level of the various NAPE subgroups was estimated as follows. For each time point, data from ESI-MS measurements (as peak heights) were expressed as percentages of the total height of all NAPE peaks. These values were then converted to absolute amounts, taking the total NAPE amount (in nmol lipid P g fresh weight−1) measured independently as 100%. NAPE subgroups already present at zero time are represented in C (group II) and D (group III), whereas late-appearing NAPEs are depicted in E (group I) and F (group V). For clarity, minor NAPE subgroups (e.g. II-a, II-d, II-f, III-d, and IV-a, accounting for ≤10% of total NAPE) are omitted.
Under Anoxia, NAPE Production Is Correlated with the LAH-Catalyzed FFA Release from Membrane Lipids
The relation between FFA release (Fig. 3A) and NAPE accumulation (Fig. 3B) has been substantiated by incubating potato cells under anoxia so as to induce a range of hydrolysis extents and measuring the corresponding NAPE levels. A good correlation (r = 0.93) was obtained when NAPE formation and FFA release were expressed in a semilog plot (Fig. 4), which indicates that the efficiency of NAPE synthesis was maximal at low hydrolysis extents. As soon as the hydrolysis extent exceeded 30%, the correlationcoefficient decreased rapidly (not shown). This was likely due to the fact that in addition to the native membrane lipids, NAPE becomes a new hydrolyzable substrate for LAH. As expected from Figure 3, A and B, this correlation was inexistent in normoxic controls.
Figure 4.

Correlation between the levels of NAPE and of FFA (as a measure of the LAH-induced extent of lipid hydrolysis) in potato cells submitted to anoxia (●) or normoxia (○). Under anoxia, r = 0.930 and the correlation is valid for hydrolysis extents up to 30%, which corresponds to about 7,000 nmol FFA g fresh weight−1. Note the logarithmic scale in abcissa.
Effect of Respiratory Inhibitors
Potato cells were also treated with respiratory inhibitors under normoxia with the aim of creating a decrease in the cellular energy status that would mimic the effect of anoxia (Rawyler et al., 1999). Table III shows that incubating potato cells in the presence of both NaN3 and salicylhydroxamic acid (SHAM) for 12 and 14 h under normoxia resulted in a 2- to 4-fold increase in their NAPE level, which falls in the range of values observed in cells kept for an equivalent amount of time under anoxia (compare with Fig. 3B). Because FFAs were also released when the mitochondrial electron transport was inhibited in normoxic cells during this time range (Table III; see also Rawyler et al., 1999), these data suggest that NAPE synthesis is not due to the lack of O2 itself, but to the sudden availability of a rapidly increasing FFA pool.
Table III.
Effect of respiratory inhibitors on the FFA and NAPE levels of potato cells under normoxia
| Treatment (under Normoxia) | Time | FFA Level | NAPE Level |
|---|---|---|---|
| h | % of total fatty acids | nmol lipid P g fresh wt−1 | |
| Control | 0 | 1.1 ± 0.3 (10) | 13.8 ± 4.0 (10) |
| +NaN3/SHAM | 12 | 4.4 ± 1.0 (3) | 25.6 ± 5.0 (3) |
| +NaN3/SHAM | 14 | 5.9 ± 1.3 (3) | 53.5 ± 14.4 (3) |
Cell suspensions were aseptically fed with 2 mm each of NaN3 and salicylhydroxamic acid (SHAM) to inhibit mitochondrial electron transport and then incubated for 0, 12, and 14 h under normoxia. After washing, cells were extracted and FFA and NAPE amounts determined as described in “Materials and Methods.” Values are mean ± sd and the no. of replicates is given in bracketed italics.
N- and O-Acylation Patterns of NAPE
An important additional piece of information can be given by the N- and O-acylation patterns of NAPE. The latter should give insight into the type of phosphatidylethanolamine (PE) species that become acylated, whereas the former should provide information about the acylating pool of FFAs (Chapman and Moore, 1993a, 1993b; this report). To this end, we decided to use a chemical hydrolysis procedure (based on Kates, 1986), rather than an enzymatic one, because the former lent it itself better to serial quantitative analyses then the latter. The suitability of the procedure was verified by measuring the molar ratios of N-acyl and O-acyl groups to lipid phosphate in standard NAPE samples, which satisfactorily yielded values of 0.9 and 2.1, respectively.
In Figure 5, we have compared the acyl composition of the FFA fraction as well as the N-acyl and O-acyl patterns of NAPE obtained from normoxic potato cells with those from cells incubated under anoxia or under normoxia in the presence of NaN3 + SHAM. Measurements were carried out before starting (0 h) and 18 h after the treatments. These times were selected because at 0 h, the basal FFA pool is very small and rather rich in saturated chains (Fig. 5A, left) whereas after 18 h of anoxia or of normoxia in the presence of both respiratory inhibitors, the FFA pool is significantly increased under the action of LAH (see also Fig. 3A), and is thus much richer in unsaturated acyl chains (Fig. 5A, middle and right; see also Rawyler et al., 1999). Under no circumstances did the N-acyl pattern of the NAPE class resemble to FFA (compare Fig. 5, A with B). Rather, the N-acyl pattern was essentially independent of the treatments: The most important acyl residue was always 18:1, closely followed by 16:0 and 18:2 in rather similar amounts, then by smaller amounts of 18:0 and 18:3 (Fig. 5B). On the other hand, the corresponding O-acyl pattern of control NAPE differed from those observed after the treatments. Thus, in normoxic controls, the levels of most acyl residues were rather comparable, except for 18:3. However, after the treatments, 18:2 (with about 50 mol %) and 16:0 (with about 22 mol %) dominated markedly the O-acyl patterns at the expense of 18:0 and 18:1, whereas 18:3 remained essentially constant (Fig. 5C). It should be kept in mind, however, that the absolute amounts of each fatty acid in both N- and O-acyl patterns of NAPE from treated cells were much higher than those from control cells.
Figure 5.

Changes in the relative composition (in mol %) of the FFA fraction (A), of N-acyl groups (B), and of O-acyl groups of NAPE (C) isolated from potato cells incubated for 18 h either under anoxia or under normoxia in the presence of 2 mm each NaN3 and SHAM. Data are given as mean ± sd (n = 3). Note that in absolute terms, the sums of all N-acyl and O-acyl groups of NAPE after 18 h of treatment are much higher than those of normoxic controls. The same is true for the FFA fraction (see also Fig. 3).
Derived from the above data (Fig. 5, B and C), the global acyl composition of NAPE reflects essentially that of its PE precursor, which appears to depend on the physiological state of the cells. In normoxic cells, the basal NAPE thus was relatively rich in saturated fatty acids, whereas a marked increase in 18:2 occurred at the expense of 18:0 and 18:1 after both stress treatments. However, it is worth mentioning that 16- and 18-carbon fatty acids constituted the vast majority of NAPE acyl chains (see also Table I). Thus, arachidic acid, which represents about 0.2 mol % of total cell fatty acids, was found as a NAPE constituent only under anoxia, and in very small amounts. Shorter acyl chains (such as 12:0 and 14:0) were not encountered.
DISCUSSION
NAPE effectively occurs in cultured potato cells. This conclusion is supported by three lines of evidence. First, the purified compound cochromatographed in both one- and two-dimensional TLC with a standard NAPE (Fig. 1; text). Second, it had a fatty acid to phosphorus molar ratio close to 3, and the chemical hydrolysis procedure devised to split sequentially O-acyl then N-acyl groups yielded the expected fatty acid to phosphorus molar ratios (text). Third, and most importantly, analysis by ESI-MS of the purified compound yielded spectra that were fully consistent with the occurrence of several species exhibiting the general NAPE structure (Fig. 2; Table I). This conclusion is further strengthened by the experimental steps taken to prevent the formation of artifactual phospholipids in the lipid extraction procedure. Moreover, the two other possible candidates could be rejected on the basis of mass incompatibility (acyl-phosphatidylglycerol) or of completely different chromatographic mobility (N-acyl-phosphatidyl-Ser). Potato cells thus can be included in the growing list of plant systems that have already been shown to contain NAPE (Chapman, 2000).
The basal NAPE level of potato cells (Table II), comparable to that reported for tobacco cells by Chapman et al. (1995a), confirms and extends the general view that this phospholipid is a minor component of whole-cell membranes. This does not preclude, however, that NAPE could be enriched in some particular subcellular membranes of potato cells, for instance as reported by Chapman and Moore (1993a) for cottonseed microsomal membranes.
The most important outcome of this work is the marked augmentation of the NAPE level when cells are incubated under anoxia (Fig. 3; Table II) or treated with NaN3 plus SHAM under air (Table III). To date, stress-induced stimulations of plant NAPE synthesis have been observed after seed imbibition (Sandoval et al., 1995), after elicitor treatment of tobacco cells (Chapman et al., 1995a) and after chilling or abscisic acid treatment of cotton seedlings (Chapman and Sprinkle, 1996). Our results show that anoxic stress leads to a similar effect, although the increase in NAPE level is not due to the absence of O2 per se (Table III), but to the very unfavorable energetic status that prevails when respiration is either impossible or simply blocked by appropriate inhibitors under normoxic conditions (Rawyler et al., 1999).
In a recent review, Chapman (2000) concluded that like in animal systems, NAPE plays a dual role in plants, as a direct precursor for the N-acylethanolamine signaling pathway and as a bilayer-stabilizing component of membranes. Due to the way by which it is synthesized in plants (Chapman and Moore, 1993a, 1993b), NAPE could be particularly efficient in this stabilizing role: The levels of potentially lytic FFAs and of the metastable PE (Cullis and de Kruijff, 1979) are decreased, whereas that of the bilayer-forming (Newman et al., 1986) NAPE is increased. Our results suggest that the accumulation of NAPE under anoxia represents a modest attempt of the stressed potato cells to maintain the membrane properties that ensure subcellular compartmentation. As discussed below, this attempt will eventually fail.
We have previously reported that in potato cells, LAH activity is triggered whenever their ATP production rate falls below a threshold level, and thus leads to a progressive hydrolysis of membrane lipids to FFAs (Rawyler et al., 1999). It is clear that the formation of NAPE observed under anoxia (Figs. 1, 2, and 3B) can be ascribed to the increased availability of FFAs that prevails under this condition (Fig. 3A). The remarkable similarity of the time curves for both processes (compare Fig. 3, A with B) as well as the correlation depicted in Figure 4 support this suggestion. The same explanation can be given in the case of normoxic cells in which the bioenergetic competence has been altered by the presence of respiratory inhibitors (Table III). It has been shown that plant NAPE is synthesized exclusively by acylation of the amino group of PE with FFAs (Chapman and Moore, 1993a, 1993b). Our results are in good agreement with the pathway proposed by these authors. One should realize, however, that the stress-induced formation of NAPE is the resultant of several concurring processes. LAH provides FFAs by hydrolyzing PE as well as other membrane lipids (Rawyler et al., 1999). Therefore, one of the two substrates of the acylation reaction becomes more abundant, whereas the other progressively decreases. This imposes a first restriction to the extent of NAPE synthesis under prolonged anoxia. A second restriction is the specific lipid requirement of the membrane-bound NAPE synthase (McAndrew and Chapman, 1998) because this enzyme is surrounded by a constantly changing microenvironment during lipid hydrolysis. In addition, the cytoplasmic acidification that occurs under anoxia (Gout et al., 2001) may create suboptimal conditions for NAPE synthase (Chapman and Moore, 1993b) while favoring LAH activity (Galliard, 1971). Finally, NAPE is itself a substrate for the very unspecific LAH (Galliard, 1973; Huang, 1987) and for the phospholipase D that promotes its hydrolysis to N-acylethanolamine (Chapman et al., 1995b, 1998). Altogether, the correlation loss between NAPE synthesis and FFA release at hydrolysis extents higher than 30% (Fig. 4), the leveling off (Fig. 3C) and the actual decrease (Fig. 3, E and F) of several NAPE subgroups during incubation under anoxia support this interpretation.
Nevertheless, it is intriguing that PE and FFAs can coexist in normoxic cells and that no increase in NAPE level could be detected during the first 9 to 10 h of the anoxic incubation (Fig. 3B). During this prelytic phase, the FFA pool, though small (<1% of total fatty acids) and constant, represents about 250 nmol g fresh weight−1. This amount, if dispersed in the 10% to 15% of the cell volume that is non-vacuolized (Espie and Colman, 1981), would correspond to a cytoplasmic FFA concentration of at least 2.0 to 2.5 mm, which is much higher than the micromolar apparent one-half-saturation concentrations required by microsomal NAPE synthase (Chapman and Moore, 1993b; McAndrew and Chapman, 1998). In addition, PE is the second most abundant phospholipid of non-photosynthetic tissues (Galliard, 1973). We suggest that in normoxic cells, both NAPE synthase and the basal FFAs are spatially segregated as distinct pools within distinct membranes. Most basal FFAs thus would be unavailable to NAPE synthase under normal conditions. This suggestion is supported by subcellular localization studies showing that the NAPE synthase is restricted to endoplasmic reticulum, Golgi, and plasma membranes (Chapman and Sriparameswaran, 1997). Thus, one should wait for the generation of stress-induced FFA pools by LAH (Fig. 3A) to launch the accumulation of NAPE (Fig. 3B).
Another important feature of the response of potato cells to anoxic stress is that the augmentation of the NAPE pool is not only quantitative, via a general increase in the amount of the pre-existing species of groups II and III, but also qualitative, via the appearance of the completely new species belonging to groups I and V (Fig. 2; Table I). The data of Table I are not intended to give a complete picture of each individual NAPE species encountered in potato cells. Thus, groups II (16/18/18) and III (18/18/18) together may contain up to 13 possible species. That there are so many molecular species is not surprising in view of the recent report of Holmback et al. (2001) that lists up to 50 NAPE species in oat (Avena sativa). In our case, however, the acyl positioning remains in most cases undefined. In addition, some species might not be present. Within these limitations, we can conclude that the stress-induced accumulation of group I species obviously represents a specific N-palmitoylation of the two species 16:0/18:2-PE and 16:0/18:3-PE because no 16:0/16:0-PE can be found in higher plants for biosynthetic reasons (Frentzen, 1990; Browse and Somerville, 1991). It is also worth mentioning that these two PE species are among the most abundant in plant PE (Galliard, 1973). Because each species of group II contains a single 16:0 residue (Table I) and because 16:0 is also present in all N-acyl patterns (Fig. 5B), it is concluded that group II species originate from both the N-palmitoylation of 18/18-PE species and the N-octadeca(e) noylation of 16/18-PE species. All NAPE molecules belonging to group III (Table I) obviously are N-acylated with 18 carbon fatty acids. These results present two striking differences with those reported by Sandoval et al. (1995). First, osmotic stress did not induce the synthesis of new NAPE species upon imbibition of cottonseeds, but only increased the level of preexisting species peaking at m/z 952 and 976 and corresponding to our subgroups I-b and II-c. Second, imbibed cottonseeds were poor in 18/18/18-NAPE species (Sandoval et al., 1995) whereas these species represent one of the major NAPE groups in both normoxic and anoxic potato cells (group III, Table I).
Although built from FFAs, the heterogenous N-acyl patterns of potato NAPE (Fig. 5B) cannot be explained by a randomized extraction of acyl chains from the increasing and changing FFA pool (Fig. 5A). Rather, they might reflect a property of the potato NAPE synthase, as suggested by the preferential incorporation of the otherwise minor substrate 18:1 under all conditions (Fig. 5B), and also reported earlier on (Chapman and Moore, 1993b). They alternatively could also reflect some differences in substrate availability with respect to the localization of NAPE synthase.
On the other hand, the O-acyl patterns of potato NAPE (Fig. 5C) suggest that the PE species used for basal NAPE synthesis in normoxic cells differs markedly from those used under energy shortage, which resemble closely to bulk PE (Galliard, 1973). If we assume that the lack of specificity for PE species reported for the cottonseed NAPE synthase (McAndrew and Chapman, 1998) is also a property of the potato enzyme, then the difference in O-acyl patterns should be explained by the segregation of PE species into distinct pools. Whether these pools are laterally segregated within the same membrane and/or present in distinct membranes cannot be decided yet.
A survey of the recent plant NAPE literature reveals that noticeable differences in the N-acyl patterns exist according to treatments and conditions. Thus, in unstressed cottonseed seedlings, the pattern was (16:0 > 18:0 > 18:1 ∼ 14:0; Chapman and Moore, 1993a). In dry seeds of several species, NAPE showed a pattern (18:2 > 18:1 ∼ 18:0 ∼ 16:0) that was not greatly affected during the first hours of seed imbibition (Chapman et al., 1999). On the contrary, following treatment with pathogen elicitors, the N-acylethanolamines released from NAPE presented the completely different pattern (12:0 > 14:0) pattern in tobacco cells challenged with xylanase (Chapman et al., 1998) and a remarkable 14:0 enrichment in leaves treated with xylanase or cryptogein (Tripathy et al., 1999). Last, we observed a pattern (18:1 ∼ 18:2 ∼ 16:0 > 18:0 > 18:3) in energy-deprived potato cells (Fig. 5B, middle and right). Thus, one may wonder whether NAPE (via its acyl composition and level) can tell us something about the type of stress experienced by plant cells.
To answer this question, let us consider the factors involved in NAPE synthesis and their interactions. Unstressed cells contain only basal NAPE in a low and stable level. The O-acyl pattern of basal NAPE originates from the basal PE pool, which is itself a characteristic of the cells, whereas the N-acyl pattern is determined by the acyl chain specificity of NAPE synthase and the composition of the small basal FFA pool, both being also characteristic of the cells. When cells are submitted to stress treatments able to induce NAPE synthesis under prelytic conditions, they can do it because there are still enough fatty acids available in the basal FFA pool to N-acylate additional PE molecules. At this stage, cells are stressed but alive and the extra NAPE species synthesized under these conditions may play active roles as precursors for signal molecules (Chapman et al., 1995a, 1998; Tripathy et al., 1999) and as membrane protectants (Sandoval et al., 1995; Chapman and Sprinkle, 1996). These properties were apparently not required when the energetic competence of potato cells was progressively decreased because no net NAPE formation could be evidenced during the prelytic phase of the anoxic treatment (Fig. 3B). When the exposure to the stress is long enough, eventually lipid hydrolysis starts and FFAs accumulate in membranes where they soon reach lethal concentrations. This autolytic condition occurs under different types of stress such as chilling (Borochov et al., 1987), water deficit (Crowe et al., 1989; van Bilsen et al., 1994), pathogen attack (Slusarenko et al., 1991), and anoxia (Rawyler et al., 1999; this report). At this stage, the overstressed cells are committed to death and any further NAPE synthesis will do nothing but delay the rupture of cell compartmentation by scavenging a few of the FFAs released. The acyl composition of both basal and stress-induced NAPE thus appears to be devoid of any predictive potential as to the type of stress imposed to the plant cell. It merely reflects the specificity of the NAPE synthase, the acyl composition, localization, and availability of PE and FFA pools, which are all intrinsic properties of cells. Whether NAPE has a physiological role under a given stress will depend essentially on the cell being still alive and its compartmentation maintained during the stress period.
In animal cells, increased NAPE synthesis (Schmid et al., 1990) was not the only modification affecting the lipid moiety under ischemia. In brain tissues, for instance, hydrolysis of membrane lipids also occurred, leading to the accumulation of FFAs (Ikeda et al., 1986; Sun et al., 1992; Sun and Gilboe, 1994). Moreover, a coupling was established between energy failure in ischemic neocortex, loss of ion homeostasis, and phospholipase activation (Katsura et al., 1993), in an obviously nonapoptotic process (Levin et al., 1999). In potato cells experiencing energy shortage under anoxia, NAPE accumulation occurs only during the autolytic phase (Fig. 3, A and B), as a result of the failure of metabolic homeostasis (Rawyler et al., 1999). The demise of potato cells under prolonged anoxia, therefore, is defined appropriately as oncotic cell death (Jones, 2000).
Finally, the significance of NAPE synthesis depends on the moment at which potato cells are relieved from the anoxic stress by re-aeration. If re-aeration takes place until the onset of the autolytic phase, where cell recovery is still complete (Pavelic et al., 2000), NAPE synthesis is expected to play a key role in cell recovery by scavenging FFAs. This contribution of NAPE synthesis would be even more crucial for membrane repair and maintenance as postanoxic lipid peroxidation is not an important issue for cultured potato cells (Pavelic et al., 2000). It is only when reaeration occurs too late that NAPE synthesis would become simply one of the biochemical changes that take place in dying cells.
MATERIALS AND METHODS
Chemicals
Except where indicated, chemicals were high purity products of Fluka and Sigma (Buchs, Switzerland).
Cells
Potato (Solanum tuberosum L. cv Bintje) cells were cultured in a Murashige and Skoog medium (Rawyler et al., 1999). Cells (4 to 5 d old) were harvested in their mid-log phase.
Anaerobic Conditions
Cells were incubated under the 10% (v/v) H2 + 90% (v/v) N2 atmosphere of an anaerobic workbench (Forma Scientific, Type 1029, Marietta, OH), in the presence of a Pd catalyst. The O2 level, monitored with a Toray LF-700 oxygen analyzer (Lippke, Neuwied, Germany), never exceeded the detection limit of 0.001%.
Cell Treatments
Sterile vessels containing cell suspensions (about 15–20 mg cell fresh weight mL−1) were closed with compressed cellulose plugs allowing gas exchange while maintaining aseptic conditions, and placed in the anaerobic workbench. Under these conditions, cell suspensions became anoxic within 10 to 15 min. Normoxic cell suspensions were also aseptically supplemented with both 2 mm NaN3 and 2 mm SHAM and incubated under air. All suspensions were incubated in darkness at 24°C to 26°C, for up to 24 h, in a rotary shaker. Cells were collected by filtration under reduced pressure (and under anaerobic conditions whenever required), immediately frozen in liquid N2, and stored at −80°C until use. Additional experimental details are given in the legends to figures and tables.
General Lipid Analyses
A total lipid extract was prepared, from which total fatty acids and FFAs were determined by a combination of TLC and gas chromatography (GC) as described by Rawyler et al. (1999). The lipid phosphorus (lipid P) content of total lipid extracts was determined by the procedure of Rouser et al. (1970) after mineralization in 70% (w/v) HClO4 at 200°C for 1 h.
NAPE Purification and Analytical Characterization
Cells were first treated with hot isopropanol to inactivate phospholipases (Kates, 1970) and then extracted as described by Chapman and Moore (1993). The total lipid extract in chloroform was then loaded on a 200-mg silica cartridge (Macherey-Nagel, Oensingen, Switzerland). After washing successively with 5 mL of chloroform, 7 mL of acetone:acetic acid (99:1, v/v), and 7 mL of chloroform:methanol (95:5, v/v), phospholipids were finally eluted with 7 mL of chloroform:methanol (1:1, v/v).
The phospholipid fraction was then separated by one-dimensional TLC on a silicagel 60-coated glass plate (10 × 20 cm) developed with chloroform:methanol:14% aqueous ammonia (80:20:2, v/v). The fully resolved NAPE spot was scraped and its lipid P content determined as above. In an alternate manner, NAPE was extracted and washed (Chapman and Moore, 1993a) and submitted either to controlled chemical hydrolysis for the determination of O-acyl and N-acyl groups by GC or to MS analysis. Confirmation of the purity of the isolated NAPE was obtained by two-dimensional TLC analysis on a silicagel 60-coated glass plate (10 × 10 cm) developed with chloroform:methanol:25% aqueous ammonia (65:25:5, v/v) in the first direction, dried under N2 and redeveloped in the perpendicular direction with chloroform:acetone:methanol:acetic acid:water (30:40:10:7:5, v/v).
The controlled chemical hydrolysis procedures given by Kates (1986) were used for the identification of O- and N-acyl groups. NAPE was dissolved in 2 mL of fresh 0.1 m NaOH in chloroform:methanol (1:4, v/v) and submitted to a mild alkaline methanolysis (20 min at 30°C), yielding N-acyl-glycerylphosphorylethanolamine together with fatty acid methylesters from O-acyl groups. After adding 2 mL of chloroform:methanol (4:1, v/v) followed by 1.8 mL of water, the tubes were briefly shaken and centrifuged. The lower phase contained the methylesters derived from O-acyl groups, which could be analyzed by GC after addition of internal standard (50 μg of nonadecanoic acid). The upper phase, containing the N-acyl derivatives, was neutralized with Dowex 50 H+, centrifuged, and the supernatant was made approximately 1.1 m HCl by the addition of 0.4 mL of 37% (w/v) HCl. After addition of internal standard, amide bonds were hydrolyzed by heating 1 h at 100°C. Fatty acids were extracted with 1.8 mL of pentane, dried, and methylated for GC analysis (Rawyler et al., 1999). Tubes were flushed throughout the procedure with N2 to avoid oxidation risks. The residue left by the pentane extraction was dried and mineralized for determination of its phosphate content (Rouser et al., 1970). The global acyl composition of NAPE was calculated directly from the N-acyl and O-acyl compositions, owing to the high recoveries (85% to 95%) of the chemical hydrolysis procedure described above.
ESI-MS Analysis of NAPE
ESI-MS analysis was carried out in the negative mode with a Micromass VG platform, single-stage quadrupole system. Cone and capillary voltages were −60 V and 3.5 kV, respectively, with a source temperature of 60°C. Samples were introduced as approximately 50 μm solutions in dichloromethane/methanol/triethanolamine (80:20:1, v/v), at a rate of 10 μL min−1. Synthetic N-palmitoyl-O- (1,2-dipalmitoyl-sn-glycero-3-phosphoryl)-ethanolamine was used as a standard.
ACKNOWLEDGMENTS
We thank Prof. J. Schaller and Mr. A. Schindler (Department of Organic Chemistry, University of Bern) for carrying out the ESI-MS analyses of NAPE.
Footnotes
This work was supported by the Swiss National Science Foundation (grant no. Nr 31/53722–98).
LITERATURE CITED
- Akoka S, Tellier C, LeRoux C, Marion D. A phosphorous magnetic resonance spectroscopy and a differential calorimetry study of the physical properties of N-acylphosphatidylethanolamines in aqueous dispersions. Chem Phys Lipids. 1988;46:43–50. [Google Scholar]
- Berdyshev EV, Schmid PC, Dong ZG, Schmid HHO. Stress-induced generation of N-acylethanolamines in mouse epidermal JB6-P+ cells. Biochem J. 2000;346:369–374. [PMC free article] [PubMed] [Google Scholar]
- Borochov A, Walker MA, Kendall EJ, Pauls KP, McKersie BD. Effect of a freeze-thaw cycle on properties of microsomal membranes from wheat. Plant Phsiol. 1987;84:131–134. doi: 10.1104/pp.84.1.131. [DOI] [PMC free article] [PubMed] [Google Scholar]
- Browse J, Somerville C. Glycerolipid synthesis: biochemistry and regulation. Annu Rev Plant Physiol Plant Mol Biol. 1991;42:467–506. [Google Scholar]
- Chapman KD. Emerging physiological roles for N-acylphosphatidylethanolamine metabolism in plants: signal transduction and membrane protection. Chem Phys Lipids. 2000;108:221–230. doi: 10.1016/s0009-3084(00)00198-5. [DOI] [PubMed] [Google Scholar]
- Chapman KD, Conyers-Jackson A, Moreau RA, Tripathy S. Increased N-acylphosphatidylethanolamine biosynthesis in elicitor-treated tobacco cells. Physiol Plant. 1995a;95:120–126. [Google Scholar]
- Chapman KD, Lin I, DeSouza AD. Metabolism of cottonseed microsomal N-acyl-phosphatidylethanolamine. Arch Biochem Biophys. 1995b;318:401–407. doi: 10.1006/abbi.1995.1246. [DOI] [PubMed] [Google Scholar]
- Chapman KD, Moore TS. N-Acylphosphatidylethanolamine synthesis in plants: occurrence, molecular composition, and phospholipid origin. Arch Biochem Biophys. 1993a;301:21–33. doi: 10.1006/abbi.1993.1110. [DOI] [PubMed] [Google Scholar]
- Chapman KD, Moore TS. Catalytic properties of a newly discovered acyltransferase that synthesizes N-acylphosphatidylethanolamine in cottonseed (Gossypium hirsutum L.) microsomes. Plant Physiol. 1993b;102:761–769. doi: 10.1104/pp.102.3.761. [DOI] [PMC free article] [PubMed] [Google Scholar]
- Chapman KD, Sprinkle WB. Developmental, tissue-specific and environmental factors regulate the biosynthesis of N-acylphosphatidylethanolamine in cotton (Gossypium hirsutum L.) J Plant Physiol. 1996;149:277–284. [Google Scholar]
- Chapman KD, Sriparameswaran A. Intracellular localization of N-Acylphosphatidylethanolamine synthesis in cotyledons of cotton seedlings. Plant Cell Physiol. 1997;38:1359–1367. [Google Scholar]
- Chapman KD, Tripathy S, Venables B, DeSouza AD. N-Acylethanolamines: formation and molecular composition of a new class of plant lipids. Plant Physiol. 1998;116:1163–1168. doi: 10.1104/pp.116.3.1163. [DOI] [PMC free article] [PubMed] [Google Scholar]
- Chapman KD, Venables FJ, Markovic R, Blair RW. N-Acylethanolamines in seeds: quantification of molecular species and their degradation upon imbibition. Plant Physiol. 1999;120:1157–1164. doi: 10.1104/pp.120.4.1157. [DOI] [PMC free article] [PubMed] [Google Scholar]
- Crowe JH, Hoekstra FA, Crowe LM. Membrane phase transitions are responsible for imbibitional damage in dry pollen. Proc Natl Acad Sci USA. 1989;86:520–523. doi: 10.1073/pnas.86.2.520. [DOI] [PMC free article] [PubMed] [Google Scholar]
- Cullis PR, de Kruijff B. Lipid polymorphism and the functional roles of lipids in biological membranes. Biochim Biophys Acta. 1979;559:399–420. doi: 10.1016/0304-4157(79)90012-1. [DOI] [PubMed] [Google Scholar]
- Domingo J, Mora M, de Madariaga MA. Incorporation of N-acylethanolamine phospholipids into egg phosphatidylcholine vesicles: characterization and permeability properties of the binary system. Biochim Biophys Acta. 1993;1148:308–316. doi: 10.1016/0005-2736(93)90144-o. [DOI] [PubMed] [Google Scholar]
- Domingo J, Mora M, de Madariaga MA. Role of headgroup structure in the phase behavior of N-acylethanolamine phospholipids: hydrogen bonding ability and headgroup size. Chem Phys Lipids. 1994;69:229–240. doi: 10.1016/0009-3084(94)90004-3. [DOI] [PubMed] [Google Scholar]
- Epps DE, Natarajan V, Schmid PC, Schmid HHO. Accumulation of N-acylethanolamine glycerophospholipids in infarcted myocardium. Biochim Biophys Acta. 1980;618:420–430. doi: 10.1016/0005-2760(80)90260-x. [DOI] [PubMed] [Google Scholar]
- Epps DE, Schmid PC, Natarajan V, Schmid HHO. N-Acylethanolamine accumulation in infarcted myocardium. Biochem Biophys Res Commun. 1979;90:628–633. doi: 10.1016/0006-291x(79)91281-6. [DOI] [PubMed] [Google Scholar]
- Espie GS, Colman B. The intracellular pH of isolated photosynthetically active Asparagus mesophyll cells. Planta. 1981;153:210–216. doi: 10.1007/BF00383889. [DOI] [PubMed] [Google Scholar]
- Frentzen M. Comparison of certain properties of membrane-bound and solubilized acyltransferase activities of plant microsomes. Plant Sci. 1990;69:39–48. [Google Scholar]
- Galliard T. The enzymic deacylation of phospholipids and galactolipids in plants: purification and properties of a lipolytic acyl hydrolase from potato tubers. Biochem J. 1971;121:379–390. doi: 10.1042/bj1210379. [DOI] [PMC free article] [PubMed] [Google Scholar]
- Galliard T. Phospholipid metabolism in photosynthetic plants. In: Ansell GB, Hawthorne JN, Dawson RMC, editors. Form and Function of Phospholipids. Ed 2. Amsterdam: Elsevier Scientific Publishing Company; 1973. pp. 253–288. [Google Scholar]
- Gout E, Boisson AM, Aubert S, Douce R, Bligny R. Origin of the cytoplasmic pH changes during anaerobic stress in higher plant cells: carbon-13 and phosphorous-31 nuclear magnetic resonance studies. Plant Physiol. 2001;125:912–925. doi: 10.1104/pp.125.2.912. [DOI] [PMC free article] [PubMed] [Google Scholar]
- Hansen HH, Hansen SH, Schousboe A, Hansen HS. Determination of the phospholipid precursor of anandamide and other N-acylethanolamine phospholipids before and after sodium azide-induced toxicity in cultured neocortical neurons. J Neurochem. 2000;75:861–871. doi: 10.1046/j.1471-4159.2000.0750861.x. [DOI] [PubMed] [Google Scholar]
- Hansen HH, Ikonomidou C, Bittigau P, Hansen SH, Hansen HS. Accumulation of the anandamide precursor and other N-acylethanolamine phospholipids in infant rat models of in vivo necrotic and apoptotic neuronal death. J Neurochem. 2001;76:39–46. doi: 10.1046/j.1471-4159.2001.00006.x. [DOI] [PubMed] [Google Scholar]
- Hansen HS, Lauritzen L, Moesgaard B, Strand AM, Hansen HH. Formation of N-acylphosphatidylethanolamines and N-acylethanolamines: proposed role in neurotoxicity. Biochem Pharmacol. 1998;55:719–725. doi: 10.1016/s0006-2952(97)00396-1. [DOI] [PubMed] [Google Scholar]
- Hansen HS, Moesgaard B, Hansen HH, Schousboe A, Petersen G. Formation of N-acylethanolamine (including anandamide) during glutamate-induced neurotoxicity. Lipids. 1999;34:327–330. doi: 10.1007/BF02562333. [DOI] [PubMed] [Google Scholar]
- Holmback J, Karlsson AA, Arnoldsson KC. Characterization of N-acylphosphatidylethanolamine and acylphosphatidylglycerol in oats. Lipids. 2001;36:153–165. doi: 10.1007/s11745-001-0702-z. [DOI] [PubMed] [Google Scholar]
- Huang AHC. Lipases. In: Stumpf PK, editor. The Biochemistry of Plants, Lipids: Structure and Function. Vol. 9. Orlando, FL: Academic Press; 1987. pp. 91–119. [Google Scholar]
- Ikeda M, Yoshida S, Busto R, Santiso M, Ginsberg MD. Polyphosphoinositides as a probable source of brain free fatty acids accumulated at the onset on ischemia. J Neurochem. 1986;47:123–132. doi: 10.1111/j.1471-4159.1986.tb02839.x. [DOI] [PubMed] [Google Scholar]
- Jones A. Does the plant mitochondrion integrate cellular stress and regulate programmed cell death? Trends Plant Sci. 2000;5:225–230. doi: 10.1016/s1360-1385(00)01605-8. [DOI] [PubMed] [Google Scholar]
- Kates M. Plant phospholipids and glycolipids. Adv Lipid Res. 1970;8:225–265. [Google Scholar]
- Kates M. Techniques of lipidology. In: Burdon RH, van Knippenberg RH, editors. Laboratory Techniques in Biochemistry and Molecular Biology. Ed 2. 3, Part 2. Amsterdam: Elsevier; 1986. pp. 112–185. [Google Scholar]
- Katsura K, Rodriguez de Turco EB, Folbergrova J, Bazan NG, Siesjo BK. Coupling among energy failure, loss of ion homeostasis, and phospholipase A2 and C activation during ischemia. J Neurochem. 1993;61:1677–1684. doi: 10.1111/j.1471-4159.1993.tb09803.x. [DOI] [PubMed] [Google Scholar]
- Lafrance CP, Blochet JE, Pezolet M. N-Acylphosphatidylethanolamines: effect of the N-acyl chain length on its orientation. Biophys J. 1997;72:2559–2568. doi: 10.1016/S0006-3495(97)78899-4. [DOI] [PMC free article] [PubMed] [Google Scholar]
- Levin S, Bucci TJ, Cohen SM, Fix AS, Hardisty JF, Le-Grand EK, Maronpot RR, Trump BF. The nomenclature of cell death: recommendations of an ad hoc Committee of the Society of Toxicologic Pathologists. Toxicol Pathol. 1999;27:484–490. doi: 10.1177/019262339902700419. [DOI] [PubMed] [Google Scholar]
- McAndrew RS, Chapman KD. Enzymology of cottonseed microsomal N-acyl-phosphatidylethanolamine synthase: kinetic properties and mechanism-based inactivation. Biochim Biophys Acta. 1998;1390:21–36. doi: 10.1016/s0005-2760(97)00166-5. [DOI] [PubMed] [Google Scholar]
- Moesgaard B, Jaroszewski JW, Hansen HS. Accumulation of N-acyl-ethanolamine phospholipids in rat brains during post-decapitative ischemia: a P-31 NMR study. Lipid Res. 1999;40:515–521. [PubMed] [Google Scholar]
- Moesgaard B, Peterson G, Jaroszewski JW, Hansen HS. Age dependent accumulation of N-acyl-ethanolamine phospholipids in ischemic rat brain: a P-31 NMR and enzyme activity study. Lipid Res. 2000;41:985–990. [PubMed] [Google Scholar]
- Newman JL, Stiers DL, Anderson WH, Schmid HHO. Phase behavior of synthetic N-acylethanolamine phospholipids. Chem Phys Lipids. 1986;42:249–60. doi: 10.1016/0009-3084(86)90084-8. [DOI] [PubMed] [Google Scholar]
- Oberson J, Pavelic D, Braendle R, Rawyler A. Nitrate increases membrane stability of potato cells under anoxia. J Plant Physiol. 1999;155:792–794. [Google Scholar]
- Pavelic D, Arpagaus S, Rawyler A, Braendle R. Impact of post-anoxia stress on membrane lipids of anoxia-pretreated potato cells: a reappraisal. Plant Physiol. 2000;124:1285–1292. doi: 10.1104/pp.124.3.1285. [DOI] [PMC free article] [PubMed] [Google Scholar]
- Rawyler A, Pavelic D, Gianinazzi C, Oberson J, Braendle R. Membrane lipid integrity relies on a threshold of ATP production rate in potato cell cultures submitted to anoxia. Plant Physiol. 1999;120:293–300. doi: 10.1104/pp.120.1.293. [DOI] [PMC free article] [PubMed] [Google Scholar]
- Rouser G, Fleischer S, Yamamoto A. Two-dimensional thin-layer chromatographic separation of polar lipids and determination of phospholipids by phosphorus analysis of spots. Lipids. 1970;5:494–496. doi: 10.1007/BF02531316. [DOI] [PubMed] [Google Scholar]
- Sandoval JA, Huang ZH, Garrett DC, Gage DA, Chapman KD. N-Acylphosphatidyl-ethanolamine in dry and imbibing cottonseeds: amounts, molecular species and enzymatic synthesis. Plant Physiol. 1995;109:269–275. doi: 10.1104/pp.109.1.269. [DOI] [PMC free article] [PubMed] [Google Scholar]
- Schmid HH. Pathways and mechanisms of N-acylethanolamine biosynthesis: can anandamide be generated selectively? Chem Phys Lipids. 2000;108:71–87. doi: 10.1016/s0009-3084(00)00188-2. [DOI] [PubMed] [Google Scholar]
- Schmid HHO, Schmid PC, Natarajan V. N-Acylated glycerophospholipids and their derivatives. Prog Lipid Res. 1990;29:1–43. doi: 10.1016/0163-7827(90)90004-5. [DOI] [PubMed] [Google Scholar]
- Schmid HHO, Schmid PC, Natarajan V. The N-acylation-phosphodiesterase pathway and cell signaling. Chem Phys Lipids. 1996;80:133–142. doi: 10.1016/0009-3084(96)02554-6. [DOI] [PubMed] [Google Scholar]
- Slusarenko AJ, Croft PK, Voisey CR. Biochemical and molecular events in the hypersensitive response of bean to Pseudomonas syringae pv phaseolica. In: Smith C, editor. Biochemistry and Molecular Biology of Plant-Pathogen Interactions. Oxford: Clarendon Press; 1991. pp. 126–143. [Google Scholar]
- Sun D, Gilboe DD. Ischemia-induced changes in cerebral mitochondrial free fatty acids, phospholipids, and respiration in the rat. J Neurochem. 1994;62:1921–1928. doi: 10.1046/j.1471-4159.1994.62051921.x. [DOI] [PubMed] [Google Scholar]
- Sun GY, Lu FL, Lin SE, Ko MR. Decapitation ischemia-induced release of free fatty acids in mouse brain: relationship with diacylglycerols and lysophospholipids. Mol Chem Neuropathol. 1992;17:39–50. doi: 10.1007/BF03159980. [DOI] [PubMed] [Google Scholar]
- Tripathy S, Venables BJ, Chapman KD. N-Acylethanolamines in signal transduction of elicitor perception: attenuation of the alkalinization response and activation of defense gene expression. Plant Physiol. 1999;121:1299–1308. doi: 10.1104/pp.121.4.1299. [DOI] [PMC free article] [PubMed] [Google Scholar]
- van Bilsen DG, Hoekstra FA, Crowe LM, Crowe JH. Altered phase behavior in membranes of aging dry pollen may cause imbibitional leakage. Plant Physiol. 1994;104:1193–1199. doi: 10.1104/pp.104.4.1193. [DOI] [PMC free article] [PubMed] [Google Scholar]