

Summary
The limited efficacy of immunotherapies against glioblastoma underscores the urgency in better understanding immunity in the central nervous system. We found that treatment with αCTLA-4, but not αPD-1, prolonged survival in a mouse model of mesenchymal-like glioblastoma. This effect was lost upon depletion of CD4+ T cells, but not CD8+ T cells. aCTLA-4 treatment increased frequencies of intra-tumoral IFNγ-producing CD4+ T cells and IFNg blockade negated the therapeutic impact of aCTLA-4. The anti-tumor activity of CD4+ T cells did not require tumor-intrinsic MHC-II expression, but rather required conventional dendritic cells as well as MHC-II expression on microglia. CD4+ T cells interacted directly with microglia, promoting IFNg-dependent microglia activation and phagocytosis via the AXL/MER tyrosine kinase receptors, which were necessary for tumor suppression. Thus, αCTLA-4 blockade in mesenchymal-like glioblastoma promotes a CD4+ T cell-microglia circuit, wherein IFNγ triggers microglia activation and phagocytosis, and microglia in turn act as antigen presenting cells fueling the CD4+ T cell response.
Keywords: CD4+ T cell, microglia, glioblastoma, MHC-II, immunotherapy, CTLA-4, AXL, MER
Graphical Abstract

eTOC Blurb
Immunotherapies against glioblastoma exhibit limited efficacy.. Chen et al. examine the impact of immunotherapy in mesenchymal glioblastomas and find that αCTLA-4 treatment promotes tumor suppression in a manner dependent on CD4+ T cells. Mechanistically, microglia serve as essential MHC-II antigen presenting cells that sustain anti-tumor IFNγ+ CD4+ T cells, which in turn stimulate microglial phagocytic function via AXL-MER signaling.
Introduction
Glioblastoma is the most common and deadliest form of brain cancer with no effective therapy available 1,2. Glioblastoma is composed of heterogeneous populations of glioma stem cells (GSCs) that demonstrate strong resistance to most conventional and targeted therapies 3. Four dominant subpopulations of cancer cells have been identified: neural progenitor-like (NPC-like), oligodendrocyte progenitor-like (OPC-like), astrocyte-like (AC-like), and mesenchymal-like (MES-like).4,5. While all GSC subtypes are deadly, MES gliomas are the most aggressive 6–8 and therefore, identifying more effective therapies to target heterogeneous glioblastoma GSCs is an unmet clinical need. Immune checkpoint blockade (ICB) has shown impressive clinical efficacy for various tumor types including melanoma and lung cancer 9–13, but little clinical benefit was observed in ICB-treated late-stage glioblastoma patients 14–20. The present failures of ICB in glioblastoma highlight the need to better understand the nature of the immune response to glioblastoma, what types of immune responses may provide protection against glioblastoma and how this will vary across the different glioblastoma subtypes.
Eliciting protective anti-tumor T cell response during ICB depends on interactions with antigen-presenting cells (APCs) 21,22, such as dendritic cells (DCs), to prime and activate antigen-specific CD8+ or CD4+ T cells 23,24. The brain parenchyma does not typically harbor DCs in the resting state, yet a higher percentage of DCs in a glioma favors more protective immune responses 25–27, which indicates the importance of APCs to successful immunotherapy. Microglia, which regulate neuronal activity, synaptic plasticity and memory, also serve critical roles in host defense against central nervous system (CNS) infections acting as APCs to T cells, engulfing microbes and infected cells 28–32. However, microglia can also play immunosuppressive roles and promote glioma progression 33–36. Converting these immunosuppressive glioblastoma-associated microglia (GAMs) towards more pro-inflammatory states has potential clinical implications35 but doing so requires a deeper mechanistic understanding of what signals and cell types cause microglia to switch between immuno-supportive and -suppressive states in glioblastoma.
Glioblastoma tumor microenvironments (TMEs) are often devoid of T cells and considered immunologically “cold” 18,37. However, MES-like gliomas tend to be more inflamed 5, which opens up the possibility of unleashing anti-tumor immunity via appropriately targeted immunotherapies. There are limited number of mouse syngeneic glioma models, such as GL261 and CT2A, which were created by chemical carcinogens and do not generate identifiable GSCs. These models have a high tumor mutation burden (TMB) and respond to αPD-1 38, unlike human gliomas 20. In contrast, the 005-glioma model, derived from lentiviral transduction of hippocampal neuronal stem cells, produces heterogeneous GSCs enriched with MES-like states that are more similar to human glioblastoma 4,39,40. Given the severe aggressiveness and more inflamed of mesenchymal gliomas, we sought to determine if immune responses can be generated against 005 GSCs by ICB, and if so, how a protective immune response could be orchestrated in the brain to better inform human glioblastoma immunotherapy trials.
We found that a protective response to αCTLA-4 therapy depended on a mutualistic relationship between microglia and CD4+ T cells in MES-like glioblastomas. Suppression of gliomas by CD4+ T cells did not require tumor-intrinsic MHC-II expression, but rather was dependent on the expression of MHC-II and antigen presentation by local microglia that in turn, sustained CD4+ T cell tumoricidal effector functions. CD4+ T cell secretion of IFNγ rendered glioma cells vulnerable to enhanced tumor surveillance and phagocytosis by microglia via the AXL/MER tyrosine kinase receptors that were necessary for tumor suppression. Collectively, our data reveal that the partnership between microglia and CD4+ T cells is a key driver for glioblastoma control, particularly of mesenchymal subtypes, offering new therapeutic avenues for treating such a formidable disease.
Results
Anti-CTLA-4 treatment suppressed tumor growth and increased the ratio of CD4+ T helper cells in glioblastoma.
To ascertain if anti-tumor immune responses against MES-like GSCs could be elicited by ICB we established gliomas in mice using 005 cells that generate tumors containing MES-like stem cells 41 (Figure S1A) and administered αPD-1 and αCTLA-4 monoclonal antibodies (mAbs) every 3 days for three weeks. As seen in human clinical trials, αPD-1 mAbs had no effect on median survival in 005 tumors; however, αCTLA-4 treatment significantly (p ≤ 0.001) extended survival by 2–3 fold (Figure 1A) and reduced tumor burden (Figures S1B–C). We also examined the effects of ICB on the immunogenic GL261 glioma model 38,42,43 and again observed greater therapeutic effects by αCTLA-4 treatment compared to αPD-1 therapy (Figure 1B). These results suggested that glioblastoma may be resistant to αPD-1 therapy and more intrinsically responsive to αCTLA-4.
Figure 1. αCTLA-4 therapy prolongs glioblastoma survival in a CD4+ T-cell dependent manner.
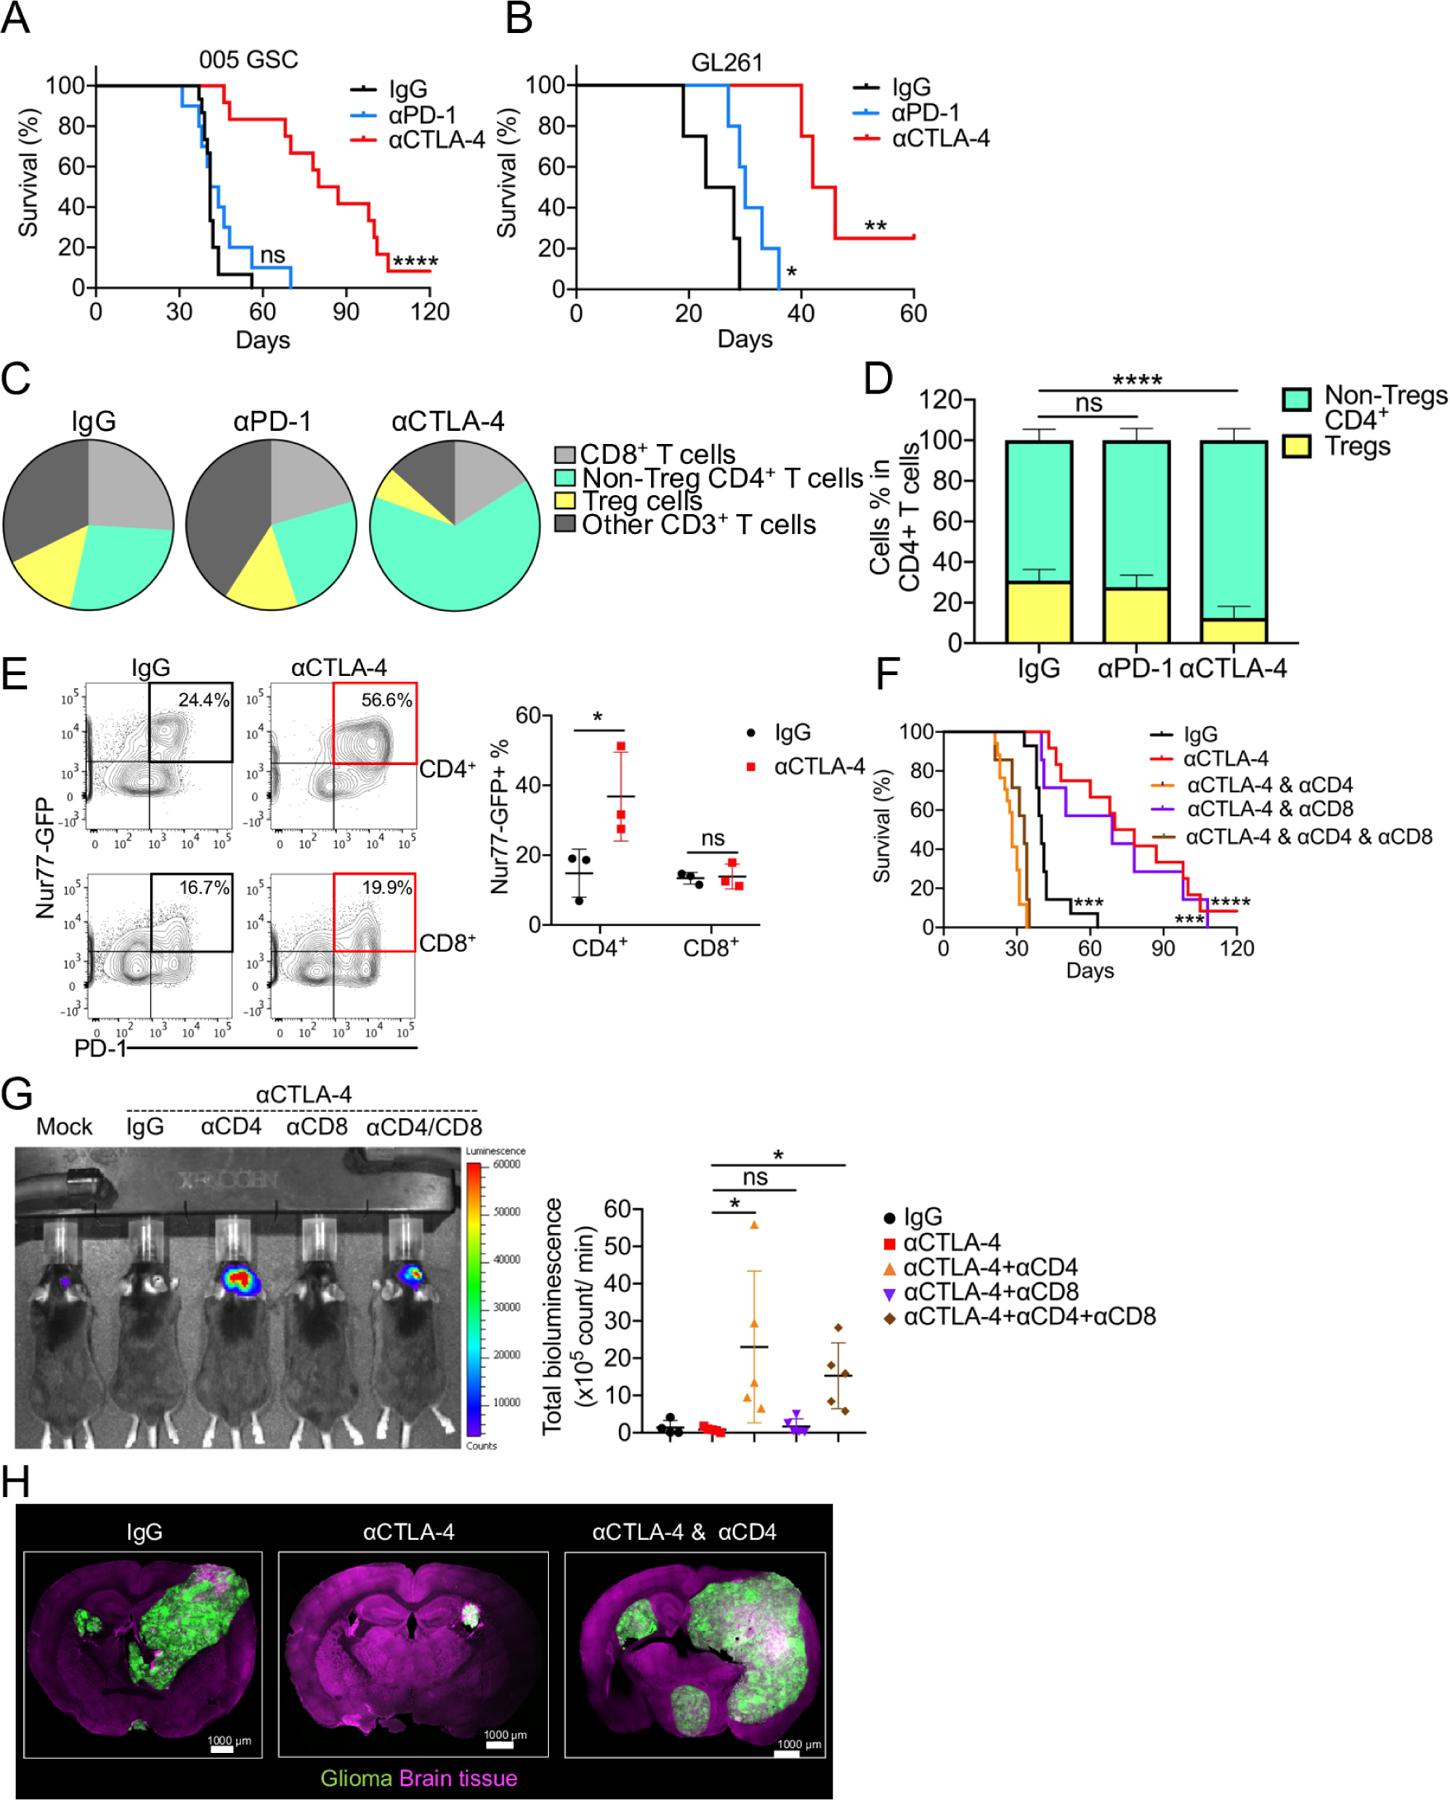
(A) Median survival of IgG (41 days; n = 15) was compared with αCTLA-4 (83.5 days; n = 12, p = 0.000002), αPD-1 (42.5 days; n = 10, p = 0.2632) by log-rank analysis. (B) Median survival of IgG (25.5 days; n = 5) was compared with αCTLA4 (44 days; n = 6, p = 0.0067), αPD-1 (30 days; n = 5, p = 0.044) by log-rank analysis. (C) Pie charts showing the relative proportion of T cell subpopulation changes. (D) Frequency of Treg and non-Treg CD4+ T cells in CD4+ T cells. (E) Representative flow plots and summarized frequencies of Nur77-GFP expression in CD4+ or CD8+ T cells. (F) Median survival of IgG (40 days; n = 14) was compared with αCTLA-4 (74 days; n = 11, p = 0.000008). Similarly, αCTLA-4 was compared with αCTLA-4 combined with αCD4 (30 days; n = 13, p < 0.000001), αCTLA-4 combined with αCD8 (69 days; n = 7, p = 0.6107), and αCTLA4 combined with αCD8 and αCD4 (33 days; n = 7, p=0.000002) by log-rank analysis. (G) 005-Luc GSCs-bearing mice were imaged on day 35. Bioluminescence was quantified. (H) The localization of 005 cells in the brain was analyzed by immunofluorescence confocal imaging. All scale bars indicate 1000 μm. All results were pooled from or representative of 2–4 experiments with n = 4 mice / group (C), n = 5–13 mice / group (D), n = 3 mice / group (E), n = 5 mice / group (G), n = 4 mice / group (H).
To examine the immune cell types that correlate with ICB-response or resistance, we used flow cytometry to profile T cells in 005 tumors after αPD-1or αCTLA-4 treatment. αPD-1 had minimal effects on the composition and frequencies of T cells compared to the IgG control (Figures 1C and S1D). In contrast, αCTLA-4 treatment substantially increased the frequency of tumor-infiltrating CD4+ T helper cells and reduced the frequency of regulatory T (Treg) cells (Figures 1C–D, and S1D–E). Using the Nur77GFP reporter mouse 44, a transcriptional reporter for T cell receptor activation, we observed a profound increase in the percentage of Nur77-GFP+ CD4+ T cells relative to CD8+ T cells after αCTLA-4 treatment (Figure 1E), demonstrating the more selective influence of αCTLA-4 treatment on tumor-reactive CD4+ T helper cells as seen in other tumor models 45.
To examine if the therapeutic effects of αCTLA-4 ICB were dependent on T cells, we depleted CD4+ or CD8+ T cells. Depletion of CD4+ T cells abrogated the therapeutic effects of αCTLA-4 therapy, but depletion of CD8+ T cells did not (Figures 1F and S1F). The requirement of CD4+ T cells in glioma regression following αCTLA-4 treatment was also evident by imaging of luciferase+ or GFP+ 005 using IVIS (Figure 1G) or confocal microscopy (Figure 1H), respectively. Together, these results indicate that harnessing CD4+ T cell function can be a highly protective and critical form of anti-tumor immunity in preclinical models of glioma that better resemble MES subtypes of human glioblastoma.
Th1-like CD4+ T helper cells were essential for anti-tumor immunity and longer-term survival in glioblastoma.
Since CD4+ T cells played a critical role in anti-tumor immunity in glioma-bearing mice, we next profiled intra-tumoral T cell repertoire after αCTLA-4 treatment using paired single-cell (sc) T cell receptor (TCR)- and RNA-sequencing. Three primary T cell clusters were distinguished: (1) CD8+ T cells, (2) Treg, and (3) Non-Treg CD4+ T cells (Figures 2A and S2A). Several expanded clonotypes were observed in CD8+ and Non-Treg CD4+ T cell subsets after αCTLA-4 treatment (Figure 2B). Most CD4+ T cell TCR clonotypes expanded by αCTLA-4 treatment were not present in IgG control-treated mice (Figure 2C). However, one TCR clonotype [CAASGGSNYKLTF_CASSSGEDTQYF] present in IgG group expanded to become the predominant clonotype in αCTLA-4 treated tumors (Figure 2C) and this clonotype has also been reported in GL261 glioma model 46, highlighting a possible shared MHC-II-restricted glioma-associated antigen. Moreover, examination of the top 10 most abundant clones after αCTLA-4 treatment showed predominant Ifng and T-bet (Tbx21) expression within these cells, indicating expansion of tumor specific effector T helper 1 (Th1) cells after ICB (Figure 2D). Accordingly, several hallmark Th1 genes expressed in CD4+ tumor-infiltrating lymphocytes (TILs) were induced by αCTLA-4 therapy relative to IgG controls including cytokine and chemokine genes (Ifng, Il2, Il21, Csf2, Cxcl13), chemokine receptors (Cxcr3, Cxcr6, Ccr8), co-stimulatory genes (Cd28, Cd40lg), and transcription factors (Tbx21, Bhlhe40, Nr4a1, Id2) (Figure 2E). Whereas CD8+ T cells and Treg cells from αCTLA-4 treated gliomas also displayed unique TCR repertoires compared to IgG control-treated tumors (Figure S2B), fewer significant changes in gene expression were observed in CD8+ TILs and Treg cells (Figure 2E).
Figure 2. Th1 cells are essential for anti-tumor immunity and long-term survival in glioblastoma.

(A) Uniform manifold approximation and projection (UMAP) of single-cell RNA-seq from IgG and αCTLA-4 treated 005 tumors. (B) The highly expanded clonotypes was displayed overlaid with the UMAP in each subset from A. (C) Shared clonotype analysis in non-Treg CD4+ T cells between IgG vs. αCTLA-4 treatment by alluvial clonotypes. (D) Feature plot showed Ifng and Tbx21 in the different clusters between IgG vs. αCTLA-4 as defined in A. (E) Heatmap of expression dynamics of transcription factors, cytokines and others enriched in the different clusters between IgG vs. αCTLA-4. (F) The expression of IFNγ, TNF, IL-2 in CD4+ T cells from harvested brains. (G) Tbx21+/+ or Tbx21−/− mice were implanted 005 GSCs and with indicated treatment. Median survival of IgG (53 days; n = 5) was compared with αCTLA-4 (77.5 days; n = 6, p = 0.00369). Median survival of Tbx21−/− (37 days, n=5) was compared with Tbx21−/− treated with αCTLA-4 (33 days; n = 7, p = 0.85176). Similarly, comparison of αCTLA-4 treatment of wild-type B6 mice with that of Tbx21−/− (33 days; n = 7, p = 0.00036), as well as the corresponding comparison in αCTLA-4 combined with αIFNγ (43 days; n = 9, p = 0.00045), were done by log-rank analysis. All the results were pooled from or representative of 2–4 experiments with n = 3–5 mice / group (A-E), n = 4–11 mice / group (F).
In agreement with the mRNA expression analyses, αCTLA-4 treatment, but not αPD-1 treatment, increased the proportion of PD-1+ T-bet+ CD4+ TILs that produce interferon-γ (IFNγ), tumor necrosis factor (TNF) and interleukin-2 (IL-2) (Figure 2F). Further, treatment with αCTLA-4 increased the amount of IFNγ and TNF produced on a per cell basis (mean fluorescent intensity (MFI)) within CD4+ T cells (Figure S2C). CD8+ TILs also showed increased TNF and only modestly increased granzyme B (GzmB) and IFNγ with αCTLA-4, despite not being required for the therapeutic effects (Figure S2D). To test if T-bet or IFNγ were required for the protective effects of anti-glioblastoma CD4+ T cells, we implanted 005 GSC tumors in T-bet depleted mice (Tbx21−/−) and treated them with or without αCTLA-4. Therapeutic benefit of αCTLA-4 was lost in Tbx21−/− mice (Figure 2G) and correlated with a lack of IFNγ+ CD4+ T cells in the tumors (Figure S2E). Similarly, IFNγ blockade abrogated the response to αCTLA-4 (Figure 2G). Collectively, these results show that the immune protection provided by αCTLA-4 treatment in glioblastoma is largely based on a dominant and robust IFNγ-producing Th1 CD4+ T cell response consisting of a largely novel TCR repertoire.
Microglia and CD11c+ cells are required for anti-glioblastoma CD4+ T cell responses and repress glioma growth.
In order to generate and sustain a protective CD4+ T cell response to ICB, we next asked which cell types express MHC-II in the brain. Examination of the scRNA-seq identified infiltrating DCs, B-cells, macrophages and brain-resident microglia as the four primary MHC-II expressing cell populations (Figures 3A–B and S3A), which we confirmed by flow cytometry. Interestingly, while microglia did not express the highest overall amounts of MHC-II, these cells showed the highest fold-induction following αCTLA-4 therapy (Figure 3C). To interrogate which of these populations supported the protective anti-tumor CD4+ T cell response, we systematically examined the role of each MHC-II expressing population. First, to separate the role of conventional DCs (cDCs) from initial priming vs. sustaining CD4+ T cell responses in the CNS, we implanted tumors into CD11cDTR or littermate control (DTR-negative) mice and began αCTLA-4 treatment 7 days later. We allowed two weeks for T cell priming to initiate and then on day 14 post implantation, treated both groups of mice with diphtheria toxin (DT) to deplete CD11c+ cells (Figures 3D–E). Depletion of cDCs minimally affected the density of CD4+ T cells during αCTLA-4 (Figure 3F), but substantially reduced the function of IFNγ-producing CD4+ T cells (Figure 3G), showing that CD11c+ cDCs are important for CD4+ T cell anti-glioma functions. Second, depletion of CD169+ macrophages using CD169DTR mice (Figures 3D–E and 3H–I) or impairment of monocyte-derived macrophage recruitment using Ccr2−/− mice (Figures 3J–K) did not influence the density or function of CD4+ T cells. Lastly, αCTLA-4 treatment to muMT− (B cell deficient) mice had minimal impact on efficacy of αCTLA-4 and IFNγ production of CD4+ TILs (Figures S3B–C). Together, these data suggest that CD11c+ cDCs, but not B cells or bone marrow-derived monocytes/macrophages, promoted IFNγ+ CD4+ TIL responses during αCTLA-4 treatment.
Figure 3. Anti-glioblastoma immune response depends on CD11c+ cells, but not depends on monocytes/macrophages.

(A) tSNE plot of005 tumors. (B) Feature plots from (A) of H2-ab1 gene. (C) MFI of MHC-II in different subsets from normal brain or IgG vs. αCTLA-4 treated glioma. (D-I) CD11cDTR or CD169DTR mice or littermate control (DTR-negative) mice were transplanted 005 GSCs and with indicated treatment. On day 14, all mice were administered 5 μg/kg DT (i.p.) twice/week for 2 weeks. The efficacy of depletion of CD11c+ or CD169+ cells was assessed by flow cytometry (E). The density of CD4+ T cells (F, H), and the percentages of PD-1+IFNγ+ of CD4+ cells (G, I), in brain tumor tissues from different treatment groups were measured and quantified by flow cytometry. (J-K) The density of CD4+ T cells (J) and the frequency of PD-1+IFNγ+ CD4+ T cells (K) were measured by flow cytometry on day 35 in C57BL/6 or Ccr2−/− mice. (L) CD4+ T cells (CD45hiCD4+), microglia (CD45intCX3CR1+), and CD11b+ myeloid (CD45hiCD11b+) cells were isolated from glioma-bearing brains and co-cultured in-vitro in the presence of GolgiPlug for 6 hours as indicated. IFNγ production was measured by flow cytometry. (M) Mice from different groups received control chow or PLX3397 chow (290 mg/kg) for 14 days before tumor implantation (Pre-PLX3397), or 14 days post tumor implantation (Post-PLX3397). Kaplan-Meier curves showed median survival of the different groups: (1) IgG (33 days; n = 11), (2) αCTLA-4 (54.5 days; n = 8, p = 0.014669 compared to IgG), (3) Pre-treated PLX3397 (26 days; n = 11, p = 0.042352 compared to IgG), (4) Pre-PLX3397 with αCTLA-4 (23.5 days; n = 14, p = 0.000018 compared to αCTLA-4), (5) post-PLX3397 (28 days; n = 5, p = 0.1489 compared to IgG), (6) post-PLX3397 with αCTLA-4 (24 days; n = 4, p = 0.003591 compared to αCTLA-4) by log-rank analysis. (N) Representative flow plots and cumulative bar graphs of the frequency of IFNγ+TNFα+ in CD4+ T cells. All results were pooled from or representative of 2–4 experiments with n = 3–5 mice / group (A-B), n = 5 mice / group (C), n = 3–7 mice / group (E-G), n = 3–6 mice / group (H-I), n = 3 mice / group (J-K), n = 5–7 mice / group (L), n = 3–10 mice / group (N).
Given that microglia had the highest fold induction of MHC-II after αCTLA-4 therapy, we next compared the ability of microglia or other local myeloid cells to present tumor antigens to tumor-infiltrating CD4+ T cells in vitro. To this end, we sorted CD45int CX3CR1+ microglia and total CD45hi CD11b+ myeloid cells from the brains of tumor bearing mice and incubated them for 6 hours with CD4+ T cells sorted from the same tumor bearing mice. Interestingly, only microglia induced the robust reactivation of CD4+ T cells based on IFNγ production (Figure 3L). To further examine the role of microglia in supporting anti-tumor CD4+ TIL functions, we depleted microglia using a CSF1R inhibitor (PLX3397). Mice implanted with 005 cells were fed PLX3397 chow 14 days before or after tumor implantation and then treated with αCTLA-4 (Figure S3D). Both early and late PLX3397 treatment caused a complete loss of CD45int CX3CR1+ microglia (Figures S3E–F) and actually increased the infiltration of Ly6G+ neutrophils (Figure S3G), but had minimal effects on the infiltration of CD45hi Ly6C+ monocytes or CD45hi F4/80+ macrophages (Figures S3H–I). Importantly, depletion of microglia either before or after tumor implantation abrogated the effects of αCTLA-4 therapy and significantly reduced survival (Figure 3M), enhanced glioma growth (Figures S3J–K), and impaired the infiltration of IFNγ+ TNF+ CD4+ T cells (Figure 3N). Collectively, these results demonstrate that microglia can directly stimulate CD4+ TILs and, along with cDCs, are important for sustaining the function of anti-glioblastoma CD4+ T cells upon αCTLA-4 treatment in the brain.
Glioma-associated microglia correlate with increased IFNG and MHC-II expression in human gliomas
Since the above data pointed to a strong correlation between microglia, antigen-presentation and IFNγ+ CD4+ TILs (Figure 3N), we next examined if these correlates were observed in human gliomas. Analysis of human glioblastoma transcriptomes deposited into the cancer genome atlas (TCGA) 47,48 showed that gliomas with the greatest infiltration of CD4+ TILs, based on CD4 mRNA expression, were strongly enriched with microglial signature genes (P2RY12, TMEM119, AXL, MERTK) and MHC-II genes (HLA-DRA, -DQA1, -DQB1, -DMB), but not CD8A or MHC-I genes (HLA-A, -B) (Figures 4A–E). Furthermore, patients whose tumors had a higher ratio of microglia-specific transcripts (P2RY12 or TMEM119) to tumor associated macrophage (TAM)-specific transcripts (CD163) displayed longer overall survival (Figure 4F and data not shown). These correlations suggest that microglia are a positive prognostic indicator in human gliomas, in line with other recent studies 49–54.
Figure 4. The correlation of microglia with IFNG from T cells and survival of glioma patients.

(A-E) Correlation plots between TMEM119 vs. CD4 (A, r=0.7), TMEM119 vs. HLA-DMB (B, r=0.586), HLA-DMB vs. CD4 (C, r=0.733), TMEM119 vs. CD8 (D, r=0.223) (A-D) and heat map of indicated genes (E) within Glioblastoma Multiforme samples from The Cancer Genome Atlas (TCGA) datasets47,48. (F) Overall Survival (OS) analysis of glioma patients from TCGA datasets47,48 whose tumors display low (red) or high (blue) ratios of P2RY12/CD163 mRNAs. (G) UMAP with 13 annotated clusters from scRNA-seq of human gliomas (GEO: GSE182109)54. (H) Nine myeloid clusters in the UMAP. (I) Feature plot showing P2RY12 in the microglia and CD163 in the macrophage clusters. (J) Dot plot showing expression of selected marker genes in microglia and macrophages. (K-N) Box plot displaying the ratio of Microglia/Macrophages (K), the ratio of P2RY12+ cells/CD163+ cells (L), the percent of CD4+ T cells/immune cells (M), and the expression level of IFNG from T cells (N) in every fragment stratified by four different glioma cellular states. Error bars indicate standard deviation (SD), and the pairwise difference between averages (red dots) is significant by Games-Howell test (significant adjusted P value <0.05, only significant one is shown). (O) Quantification of the expression level of IFNG in T cells and the ratio of P2RY12 level in microglia and CD163 in macrophages in each Fragment from ndGBM samples (new diagnosed GBM). Pearson correlation is indicated between the expression level of IFNG in T cells and the ratio of P2RY12 in microglia / CD163 in macrophages from ndGBM samples.
To more closely examine microglia in human glioblastoma, we analyzed single-cell RNA-sequencing datasets from Abdelfattah’s recent report 54. This identified 12 cell clusters with distinct gene expression patterns as visualized by UMAP, and the immune cells were annotated as previously described 54 (Figures 4G–H and S4A). We classified each glioma based on the prevailing types of GSCs present using published algorithm 4,54 into MES-, AC-, OPC-, and NPC-like (Figures S4B–C). Notably, MES-like gliomas displayed the highest immune cell infiltration (Figure S4D), consistent with previous reports of being an inflamed TMEs 4. Since increased P2RY12:CD163 was a biomarker of overall survival in glioblastoma patients (Figure 4F), we separated apart the clusters of CD163+ tumor associated macrophages from P2YR12+ microglia (Figure 4I–J) and then compared the ratio of microglia:macrophages and P2RY12:CD163 within each glioma subtype. This showed that MES-like tumors had the lowest ratios of microglia:macrophages (Figures 4K–L and S4E–F). Furthermore, MES-like and OPC-like gliomas contained the fewest CD4+ and CD8+ T cells (Figures 4M and S4G) and MES-like tumors had the lowest IFNG-expression in T cells (Figure 4N). Lastly, P2RY12 was positively correlated with IFNG from T cells (r=.58, p=0.02) whereas CD163 was negatively correlated (Figure S4H–I, (r=−0.08, p=0.78)). Hence, tumors with the highest microglia:macrophage (P2RY12:CD163) ratios also had the strongest correlation with IFNG-expressing TILs (Figure 4O, (r=.57, p=0.03)), and this was associated with significantly better overall survival (Figure 4F). Thus, in human glioblastoma the presence of microglia and reduced infiltration of TAMs correlate the strongest with IFNγ+ T cells and overall survival.
Microglia directly interact with CD4+ TILs via MHC-II to sustain their anti-glioblastoma effector responses during ICB
We observed that microglia increase expression of MHC-II and IL-12 in response to αCTLA-4 therapy (Figures 5A–B and S5A) and can stimulate CD4+ TILs (Fig. 3L), suggesting microglia provide support to Th1 effector functions in the brain. To explore whether microglial MHC-II was required to sustain anti-glioblastoma CD4+ TILs, we crossed Tmem119 Cre-ERT2 mice 55 to those carrying a floxed H2-ab1 allele and then treated H2-ab1fl/fl Tmem119CreERT2/+ mice with tamoxifen one week before glioma implantation to delete MHC-II selectively in CD45int CX3CR1+microglia (Figures 5C and S5B). We then implanted 005 tumors into H2-ab1fl/fl Tmem119CreERT2/+ mice and littermate controls (H2-ab1+/+ Tmem119CreERT2/+) and treated with αCTLA-4 and tamoxifen for an additional 2 weeks (Figure 5C). We validated that MHC-II expression was absent from CD45int microglia, but remained expressed by the other bone-marrow derived APCs that infiltrate the brain (Figures 5C and S5B–C). Importantly, selective depletion of MHC-II in microglia ablated the therapeutic response to αCTLA-4 therapy (Figure 5D), and significantly reduced the density of IFNγ+PD-1+CD4+ T cells (Figures 5E–F). Similar results were also observed using brain-protected irradiated bone marrow chimeras (BMCs) (Figures 5G–H and S5D–F) wherein MHC-II− animals that received WT BM maintain MHC-II− microglia and reconstitute MHC-II+ peripheral antigen-presenting cells (APCs), while WT animals receiving WT BM retain normal MHC-II+ microglia and generate MHC-II+ peripheral APCs (Figure S5D). In BMCs lacking MHC-II+ microglia (i.e., WT➔MHC-II−/− BMCs), CD4+ T cell density within CNS was strongly diminished, whereas CD8+ T cell density was only slightly reduced (Figure S5E). The TMEs from BMCs lacking MHC-II+ microglia, showed higher neutrophils infiltration, but no changes in monocytes numbers (Figure S5F). Moreover, absence of MHC-II in microglia impaired the expression of T-bet and IFN-γ on CD4+ T cells (Figure 5H). Altogether, these findings demonstrate that MHC-II+ microglia have a superior ability to present tumor antigens to CD4+ T cells compared to other myeloid cells in gliomas and that local MHC-II+ microglia are necessary to sustain protective IFNγ-producing anti-tumor CD4+ TILs.
Figure 5. MHC-II on microglia is required for CD4+ T cells activation and tumor control.
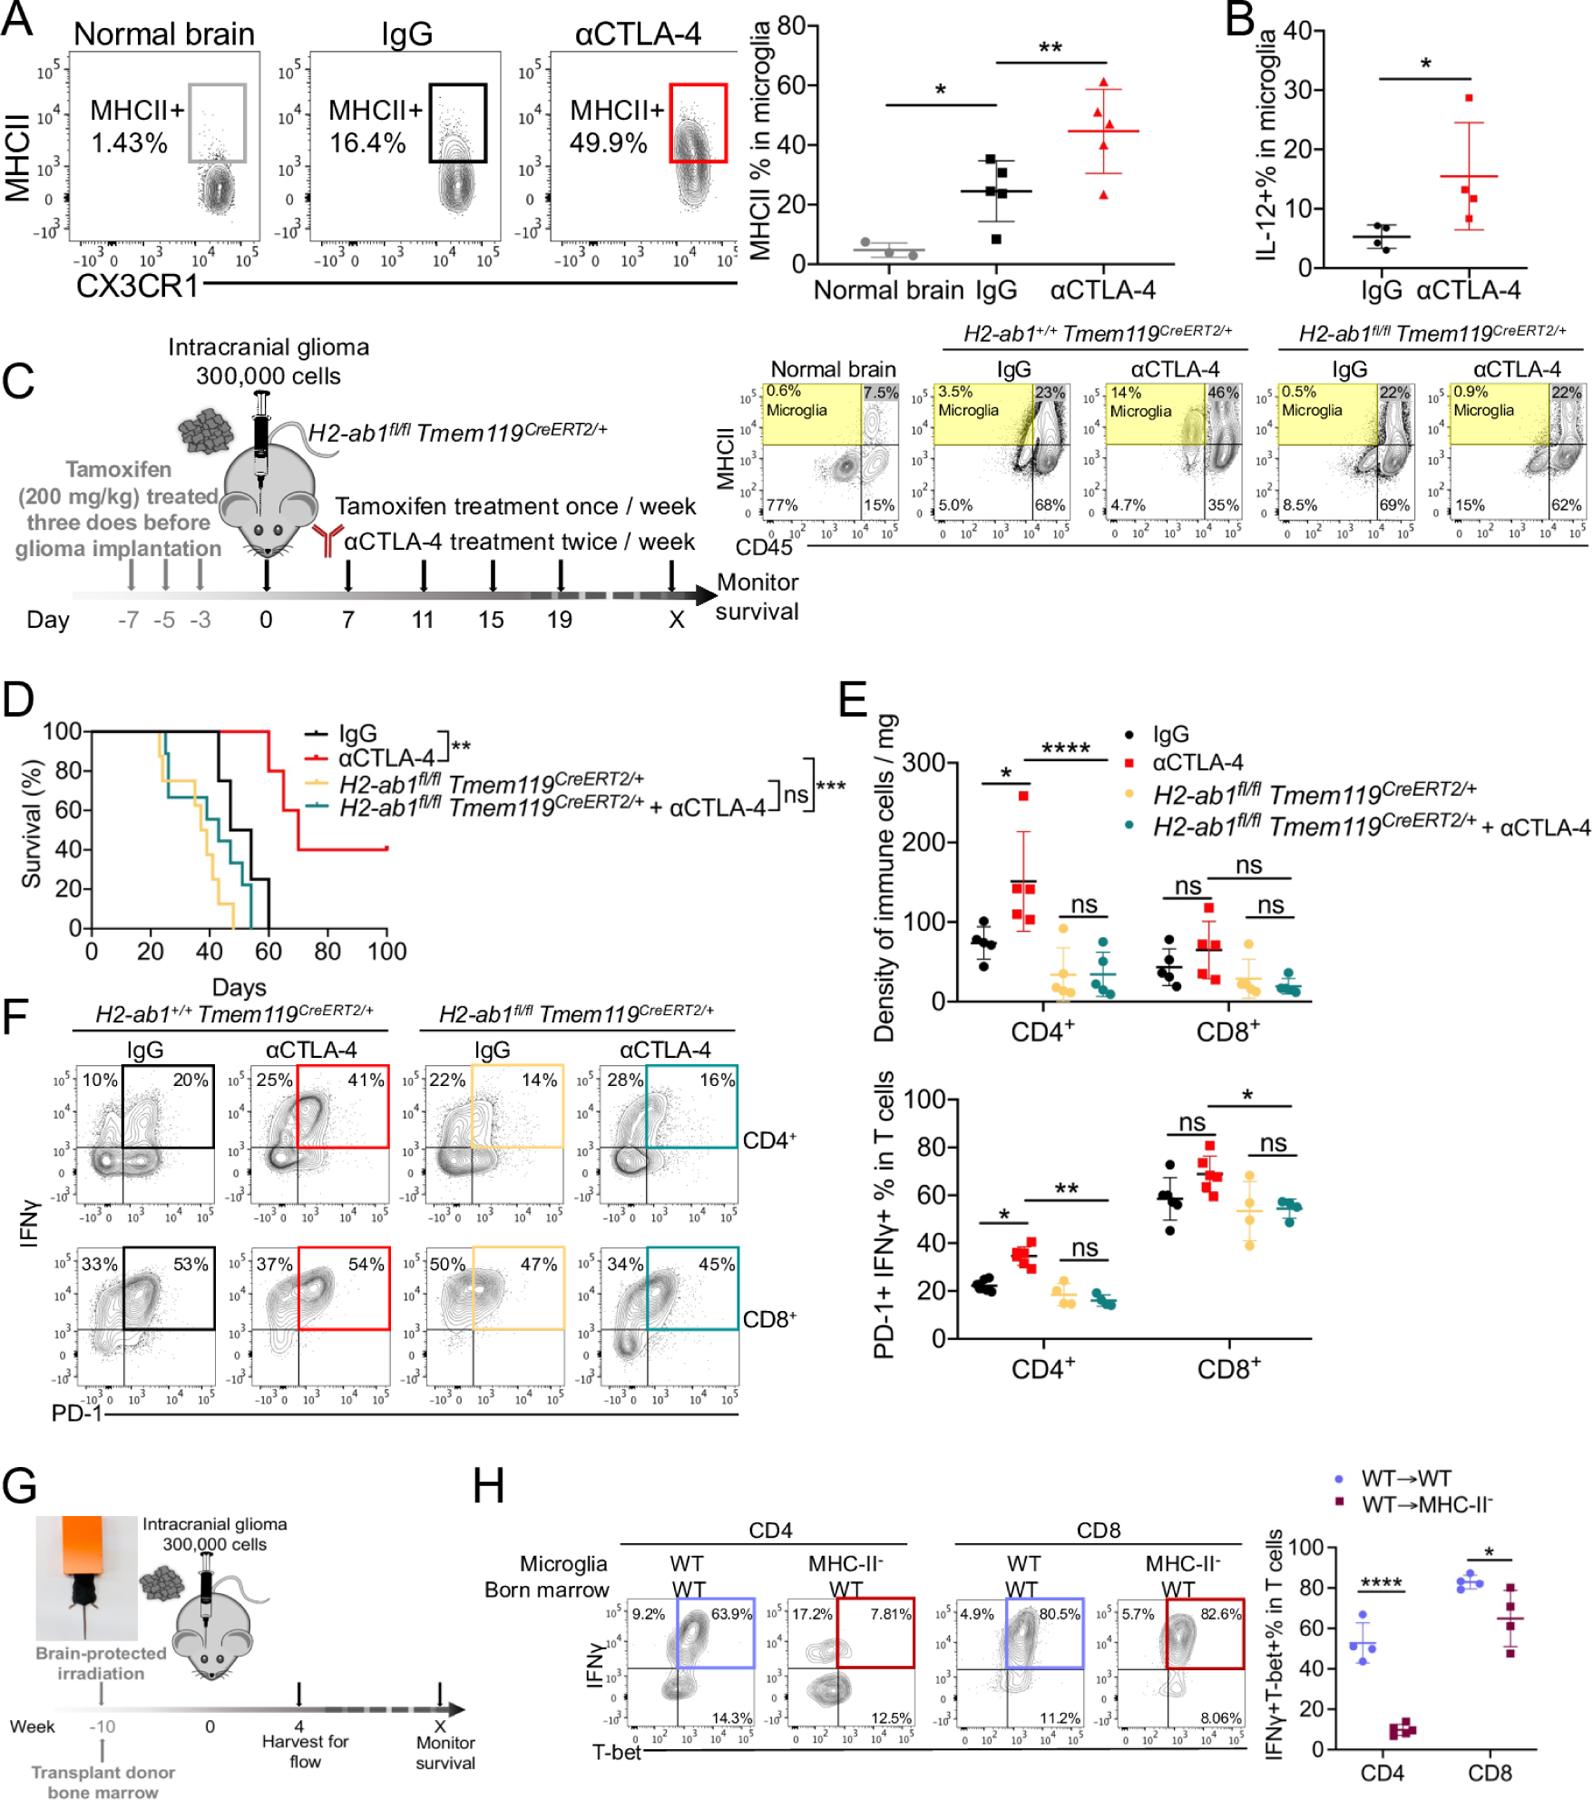
(A) The expression of MHC-II was measured and quantified in microglia. (B) The percentage of IL-12 in microglia was quantified from IL-12YFP reporter mice. (C-F) H2-ab1fl/flTmem119CreERT2/+ mice were treated with 200 mg/kg tamoxifen for 1 week, and then implanted with 3 × 10⁵ 005 GSCs on day 0, and with indicated treatment. The efficacy of depletion of MHC-II on microglia was checked by flow cytometry (C). Median survival of IgG (50.5 days; n = 4) was compared with αCTLA-4 (70 days; n = 5, p = 0.00717). Median survival of H2-ab1fl/flTmem119CreERT2/+ (39 days, n=7) was compared with H2-ab1fl/flTmem119CreERT2/+ treated with αCTLA-4 (49 days; n = 6, p = 0.022187). Similarly, wild-type B6 mice treated with αCTLA-4 was compared with H2-ab1fl/flTmem119CreERT2/+ treated with αCTLA-4 (p = 0.00191) by log-rank analysis (D). The density CD4+ and CD8+ T cells (E), and PD-1+ IFNγ+ of CD4+ or CD8+ T cells (F) in brain tumor tissues from different treatment groups were measured by flow cytometry. (G-H) Bone marrow (BM) chimeras were generated by using C57BL/6 (Ly5.1) BM injected into Ly5.1 or MHC-II− mice at 5 × 10⁶ cells per recipient 4 hours after lead shield brain-protected 1200 Rads irradiation (G). Brain tissues were harvested on day 35 after 005 implantation, and T-bet+ IFNγ+ of CD4+ or CD8+ T cells (H) in brain tumor tissues were measured by flow cytometry. All results were pooled from or representative of 2–4 experiments with n = 3–5 mice / group (A), n = 4 mice / group (B), n = 4–6 mice / group (E-F), n = 4 mice / group (G-H).
IFNγ+ CD4+ T cells, but not CD8+ T cells, are necessary to increase MHC-II in glioma associated microglia.
Next, we asked if the increased expression of MHC-II on microglia in gliomas depended on CD4+ T cells and IFNγ production. First, we compared the differentially expressed genes (DEGs) between microglia isolated from (i) αCTLA-4 vs. (ii) IgG vs. (iii) αCTLA-4 + αCD4+ T cell depletion treated animals. Expression of MHC-II genes (H2-Ab1, H2-Eb1, H2-Aa, Cd74) was highest in microglia after αCTLA-4 treatment (Figure S6A) and this was dependent on CD4+ T cells (Figure 6A and S6B). DEGs from αCTLA-4 vs. αCTLA-4+αCD4 in microglia were highly enriched in antigen processing and presentation, response to IFNγ and regulation to defense response (Figure 6B)56. The dependence on CD4+ T cells for microglial MHC-II upregulation was confirmed by flow cytometry (Figure 6C) and NicheNet analysis 57,58, which computationally predicts putative cell-cell interactions using scRNA-sequencing data, highlighted IFNγ from CD4+ T cells as a potential signal regulating H2-Eb1 and Ifitm3 in microglia (Figure S6C). Interestingly, induction of MHC-II by CD4+ T cells during ICB was slightly downregulated on macrophages, but such decline was more restricted to microglia because expression of MHC-II on DCs, or B cells in the brain did not significantly decrease in the absence of CD4+ T cells (Figures 6D–E).
Figure 6. CD4+ T cells regulate MHC-II expression on microglia.

(A) Volcano plots of genes present the magnitude (log2 (fold change), x-axis) and significance (− log10 (adjusted P value), y-axis) for microglia from αCTLA-4 vs. αCTLA-4+αCD4 from sc-RNAseq. Each spot represents a transcript. Two vertical dashed lines represent the threshold of fold changes (log2 (fold change)>1 or< −1). (B) Bar chart of clustered enrichment ontology categories was performed by Metascape on all (differentially expressed genes) DEGs in microglia from αCTLA-4 versus αCTLA-4+αCD4. (C) Representative flow plots of the expression of MHC-II on microglia. (D) tSNE plots of antigen presentation associated markers (Cd74, H2-Ab1, Cd 86, Tap1) from all the clusters in each condition (Normal brain, IgG, αCTLA-4, and αCTLA-4+αCD4). (E) Heatmap showed the expression dynamics of selected genes enriched in the different myeloid clusters from each condition. (F-G) The MHC-II expression on microglia (F) or macrophages (G) were measured in indicated condition. (H) The localization of Iba1+, CD4+, MCHII+ cells in the brain were analyzed by immunofluorescence confocal imaging. Top scale bars indicate 150 μm, and bottom scale bars indicate 30 μm. All results were pooled from or representative of 2–4 experiments with n = 3–5 mice / group (A-B, D-E), n = 6–11 mice / group (C), n = 5–8 mice / group (F-G), n = 4 mice / group (H).
Second, we examined whether IFNγ-producing Th1 CD4+ T cells were important for microglia MHC-II expression using Tbx21−/− mice or blocking IFNγ in mice containing 005 gliomas that were treated with αCTLA-4. Both of these approaches showed that IFNγ-producing Th1 cells were necessary for induction of MHC-II on microglia (Figure 6F and S6D), but only partially needed for CD45hi CD1b+ macrophages during ICB (Figure 6G). Interestingly, depletion of CD8+ T cells did not impact microglial MHC-II expression after αCTLA-4 treatment, which was surprising because the CD8+ T cells present in the 005 gliomas and produced IFNγ similar proportions to the CD4+ T cells (Figures 2F and S2D). To more directly compare the effects of CD4+ and CD8+ T cells in regulating microglial antigen presentation in gliomas we implanted 005 glioma stem cells into Rag1−/− mice which lack T and B cells, and then individually transferred WT or Ifng−/− CD4+ or CD8+ T cells (Figure S6E–F). Importantly, CD4+ T cells and CD8+ T cells produce almost equal levels of IFNγ (Figure S6F), however, adoptive transfer of WT CD4+ T cells, but not CD8+ T cells or Ifng−/− CD4+ T cells, into Rag1−/− mice induced MHC-II on microglia (Figures S6G).
These intimate interactions between CD4+ T cells and microglia were directly confirmed by confocal microscopy that showed that most CD4+ T cells found in 005 gliomas after αCTLA-4 treatment are concentrated around ionized calcium-binding adaptor molecule 1 (Iba1+) and MHC-II+ microglia (Figure 6H). In contrast, IgG control gliomas displayed very little MHC-II-expressing microglia and the CD4+ T cells were more loosely scattered throughout the gliomas. Lastly, in addition to enhancing MHC-II and antigen presentation on microglia, CD4+ T cells were also essential during αCTLA-4 treatment for maintaining microglial abundance (Figure S6H) and the recruitment of Ly6cint monocytes and B220+ B cells while limiting the infiltration of Ly6chi monocytes and neutrophils into the brain (Figures S6I–L). Since depletion of B cells or monocytes did not influence the therapeutic efficacy of αCTLA-4 (Figures 3J–K and S3B–C), the role of these cells in the TMEs have yet to be determined. Altogether, these results indicate that IFNγ-producing CD4+ TILs remodel the TMEs and selectively develop a mutualistic partnership with microglia in gliomas wherein they support the generation of MHC-II+ antigen-presenting microglia, which in turn sustain the anti-tumor Th1 functions.
Microglial activation induced by CD4+ T cells promotes tumor phagocytosis via AXL/MER signaling
Given the pivotal role of CD4+ TILs and microglia in conferring protection against glioma, we next asked if the anti-tumor effects of CD4+ T cells depended on their direct recognition of the tumor cells or killing by IFNγ. We depleted Ciita to disrupt MHC-II expression, even though MHC-II was virtually undetectable on 005 cells in vivo or in vitro (including after IFNγ stimulation (Figures S7A), or Ifngr1 to disrupt IFNγ-signaling in 005 cells (Figures S7A–C), and examined if the tumors were sensitive or resistant to ICB. CIITA-deficient tumor cells were as sensitive to αCTLA-4 as scramble control tumor cells (Figure 7A), demonstrating that the protective effect of αCTLA-4 therapy did not require direct CD4+ T cell recognition of glioma cells via MHC-II. In contrast, IFNγR-deficient tumors were resistant to αCTLA-4 therapy, altogether suggesting that the protective effects of αCTLA-4 were dependent on tumor cell-intrinsic IFNγR signaling (Figure 7B), but not direct peptide-MHCII interactions.
Figure 7. Tumoricidal activities of microglia are dependent on TAM receptor (AXL/MER).

(A) Median survival of IgG (29 days; n = 7) was compared with αCTLA-4 (45 days; n = 5, p = 0.009). Median survival of Ciita sgRNA (27.5 days, n=5) was compared with Ciita sgRNA treated with αCTLA-4 (39 days; n = 9, p = 0.0085). Similarly, comparison of αCTLA-4 treatment of WT 005 with that of Ciita sgRNA 005 (p = 0.876) were done by log-rank analysis. (B) Median survival of IgG (27 days; n = 4) was compared with αCTLA-4 (49.5 days; n = 4, p = 0.00673). Median survival of Ifngr1 sgRNA (21 days, n=9) was compared with Ifngr1 sgRNA treated with αCTLA-4 (21 days; n = 9, p = 0.4679). Similarly, comparison of αCTLA-4 treatment of WT 005 with that of Ifngr1 sgRNA 005 (p = 0.00213) were done by log-rank analysis. (C) tdTomato 005 GSCs cells were treated with IFNγ (10 ng/ml) or Rotenone (100 nM) overnight. Microglia isolated from Cx3cr1GFP/+ mice were co-cultured with tdTomato 005 GSCs from different conditions in-vitro for 4 hours. tdTomato signal from microglia was measured by flow cytometry. (D) Heatmap showing the level of apoptotic cell clearance associated genes in microglia from bulk RNA-seq in different treatment among IgG vs. αCTLA-4 vs. αCTLA-4+ αCD4. (E) The localization of Iba1+, AXL+ cells in the brain were analyzed by immunofluorescence confocal imaging. The colocalization of Iba1+ and AXL+ was indicated as white. The average MFI of AXL was quantified. (F) Rag1−/− recipient mice were transferred with or without CD4+ T cells (1×10⁶) cells on day 0. All Rag1−/− mice were implanted with 3 × 10⁵ 005 GSCs on day 1. AXL expression on microglia within tumor tissue were analyzed and quantified on day 35. (G) AxlF/FMertkF/FCx3cr1CreERT mice were treated with 150 mg/kg tamoxifen for two doses 48 hours apart. The efficiency of AXL and MER depletion was checked. (H) tdTomato 005 GSCs cells were treated with IFNγ (10 ng/ml) overnight and then incubated with microglia isolated from Axl−/−Mertk−/−Cx3cr1GFP/+or Cx3cr1GFP/+ mice for 4 hours and the tdTomato signal from microglia was measured. (I) AxlF/FMertkF/FCx3cr1CreERT mice were treated with 150 mg/kg tamoxifen for two doses 48 hours apart 1 week before, and then implanted with 3 × 10⁵ 005 GSCs on day 0 with indicated treatment. The efficacy of depletion of AXL and MER on microglia was checked by flow cytometry (left). Median survival of IgG (27 days; n = 5) was compared with αCTLA-4 (45 days; n = 5, p = 0.019). Median survival of AxlF/FMertkF/FCx3cr1CreERT (29 days, n=8) was compared with AxlF/FMertkF/FCx3cr1CreERT treated with αCTLA-4 (25.5 days; n = 9, p = 0.8502). Similarly, wild-type B6 mice treated with αCTLA-4 was compared with AxlF/FMertkF/FCx3cr1CreERT treated with αCTLA-4 (p = 0.016) by log-rank analysis (right). All results were pooled from or representative of 2–4 experiments with n = 3 mice / group (D), n = 3 mice / group (E), n = 4–6 mice / group (F). Data are expressed as mean ± SEM.
IFNγ can sensitize tumors to killing by CD8+ T cells or NK cells, but αCTLA-4 therapy was independent of CD8+ T cells (Figure 1F) and depleting B2m on 005 cells also had no impact on αCTLA-4 therapy (Figure S7D). Similarly, depletion of NKs also did not affect overall survival (Figure S7E). Therefore, we tested the hypothesis that IFNγ kills the MES-GSCs directly. Control and Ifngr1 depletion 005 cells were treated with IFNγ for 72 hours, and while this did not induce overt cell death or stall proliferation or growth, it did induce the early apoptotic marker phosphatidyl serine (PtdSer) based on Annexin V staining in an Ifngr1-dependent manner (Figure S7F), suggesting that IFNγ–signaling makes 005 cells vulnerable to killing by another cell type such as microglia or macrophages.
Exposure of PtdSer on the surface of cells triggers efferocytosis via binding to the ligands growth arrest-specific gene 6 (GAS6) and Protein S (PROS) that activate the phagocytic TYRO-AXL-MER (TAM) receptor system on microglia and macrophages 59,60. To test if IFNγ sensitizes tumor cells to phagocytosis by microglia, IFNγ-treated or untreated 005-tdTomato cells were cultured with microglia. As a positive control, we cultured the microglia with tumor cells treated with rotenone (a mitochondrial poison) to induce tumor cell apoptosis. Both IFNγ and rotenone treatment induced microglial phagocytosis of tumor cells (Figure 7C), showing that IFNγ may sensitize tumor cells to be phagocytosed by microglia in vitro. Additionally, comparison of DEGs and Gene Set Enrichment Analysis (GSEA) from bulk RNA-sequencing of microglia isolated from gliomas treated with IgG vs. αCTLA-4 vs. αCTLA-4 + αCD4 showed induction of genes involved in phagocytosis after αCTLA-4 therapy that were dependent on CD4+ T cells including Axl, Mertk, Gas6, Marco, Tyrobp, Cd36 (Figures 7D and S7G). Concordantly, AXL was selectively induced in microglia surrounding the edges and within the tumor masses based on confocal microscopy, and this was further upregulated by αCTLA-4 therapy (Figure 7E). Further, transfer 005 cells into Rag1−/− mice followed by the transfer of CD4+ T cells showed that AXL expression was preferentially increased on MHC-II+ microglia in a CD4+ T cell-dependent manner (Figure 7F).
To investigate whether TAM receptors signaling was essential for IFNγ-driven phagocytosis of tumor cells, we obtained AxlF/FMertkF/FCx3cr1CreERT2 mice that are doubly-deficient in Axl and Mertk in microglia (Axl/Mer−/−) 59 (Figure 7G). We then exposed 005-tdTomato cells to IFNγ and cultured them with WT or Axl/Mer−/− microglia, and this showed that the ability of microglia to phagocytose 005 cells was highly dependent on AXL and MER (Figure 7H). Importantly, the therapeutic benefit of αCTLA-4 in glioblastoma in vivo was entirely dependent on Axl/Mertk signaling in microglia (Figure 7I), indicating that phagocytic function of microglia is critical for ICB-mediated tumor regression. In conclusion, these data show that MES-GSCs can become sensitive to immune attack during ICB by creating a critical partnership between CD4+ T cells and microglia (Figure S7H). Th1 CD4+ T cells are necessary to induce microglial antigen-presentation capacity via IFNγ-signaling that in turn sustains (1) local CD4+ T cell effector functions, (2) potentiates the phagocytic functions of microglia via upregulation of phagocytic receptors like AXL/MER and (3) sensitizes tumor cells to immunosurveillance and removal by myeloid cells via increased phosphatidylserine (PtdSer). This microglia-CD4+ T cell crosstalk reveals an axis that enables robust protective anti-tumor immunity in preclinical models of glioblastoma and provides new insights for developing therapeutic strategies against human glioblastoma.
Discussion
Despite several immunotherapy clinical trials with ICB, little-to-no clinical benefit has been observed in glioblastoma patients 20. It remains to be determined if a protective immune response can be raised against glioblastoma, and if so, what is required to do so. Our studies show that brain-infiltrating CD4+ T cells are pivotal regulators of tumor clearance and anti-tumor function regulated by microglia in MES-like glioblastomas. Such a co-dependency between CD4+ T cells and microglia to target brain cancer highlights a fundamental axis that may lead to curative anti-tumor immune responses via ICB in human glioblastoma.
Our findings match clinical reports showing that decreased frequencies of anti-tumor CD4+ T cells in high-grade glioma patients are associated with adverse overall survival outcomes 61,62. In orthotopic glioma models, CD4+ CAR-T cells are effective in facilitating long-term anti-tumor response due to their outperformance over CD8+ CAR-T 63. Furthermore, a vaccine targeting mutant isocitrate dehydrogenase 1 (IDH1) is effective against IDH1R132H glioma, which correlated with vaccine-induced IDH1R132H-specific CD40LG+ CXCL13+ CD4+ T cells but not CD8+ T cells 45,64. Our sc-RNAseq data also showed that both Cd40lg and Cxcl13, in addition to Cxcr3 and Cxcr6, were upregulated in CD4+ population after αCTLA-4 treatment, in agreement with prior reports showing CD4+ T cells with these properties could traffic from the perivascular space to the parenchyma and provide anti-glioma protection 64,65. A recent report by Arrieta et al. showed that a small subset of recurrent glioblastoma patients with high pERK1/2 responded to αPD-1 blockade and relevant to our study, these high pERK tumor cells are mainly colocalized with MHC-II+ microglia and other genes associated with antigen presentation 66. While this finding is suggestive of a role for microglia in tumor-antigen presentation, our report shows that indeed, MHC-II+ microglia can present tumor antigens to intratumoral CD4+ T cells and sustain anti-tumor immunity to glioblastoma after ICB. Collectively, these findings demonstrate how CD4+ T cells can suppress glioblastoma in partnership with microglia, and therefore, we suggest that future clinical trials in glioblastoma should place more emphasis on αCTLA-4 ICB alone or with other therapies that stimulate CD4+ T cells and microglia.
It is not clear why treatment with ICB has failed in glioblastoma, but the blood–brain barrier (BBB) could be a significant hindrance to mAb entry67. However, in melanoma patients with brain metastases, the combination of αPD-1 and αCTLA-4 has clinically meaningful intracranial efficacy68–71. Moreover, bevacizumab, a VEGF-specific antibody, is able to penetrate into the brain parenchyma72. Although it is unclear if anti-CTLA-4 and anti-PD-1 cross the BBB, some efficacy has been demonstrated against glioblastoma66,73 pointing to the need of further investigation to assess whether anti-CTLA-4 mAb treatment provides therapeutic benefit to glioma patients locally or systemically. Novel strategies such as intracerebral administration or engineered antibodies could help acquire adequate brain penetration and increasing potency.
Glioblastomas are heterogeneous based on the subtypes of GSCs and other cells present within the TMEs4,5,74. Notably, in both humans and the murine 005 model, microglia were associated with significantly better survival, while monocyte-derived macrophages were associated with worse survival49,54. On this note, it may be more important to reprogram microglia, for example by inducing AXL, rather than deplete them for treating glioblastoma. Indeed, a phase II clinical trial of PLX3397 did not show significant efficacy in glioblastoma patients75, and similarly our data as well as that of 76 showed depletion of microglia promoted tumor growth. It is unclear why these results conflict with those prior in a RCAS-hPDGF-B murine model77,78, but it likely stems from functional differences in the macrophages found in the various subtypes of GSCs 78,79. For example, Rao et al., also showed that hPDGFB-driven GBM proneural (NPC-like) model is markedly inhibited by PLX3397 76,77,80, but the opposite was seen in the RAS-driven models characteristic of MES-like gliomas (like 005, that is driven by Kras 5). To move the field forward, comparisons between PDGFB-driven proneural81, EGFR-driven astrocytic4,82,83, and RAS-driven mesenchymal5,39 glioma models are needed to determine how the different types of GSCs in gliomas respond to different types of immunotherapies.
Lastly, our data demonstrate that CD4+ T cells, but not CD8+ T cells were uniquely situated to communicate with microglia via IFNγ-signaling for reasons that are still unclear. While both CD4+ and CD8+ T cells secrete IFNγ during glioblastoma pathogenesis, only IFNγ derived from CD4+ T cells led to MHC-II upregulation on microglia. One possible explanation for our findings is that there might exist quantitative differences in the amounts of IFNγ secreted from CD4+ versus CD8+ T cells that is not detected by intracellular cytokine staining. Another possibility is that CD4+ T cells may exist in closer spatial proximity and adhere more tightly to microglia than CD8+ T cells. A third possibility is that CD4+ T cells might have unique, unidentified features that are required to either activate microglia directly or recruit other cell types to stimulate microglia. Consistent with our finding, a CD4+ T cell-microglia interaction has also been reported in neonatal development whereby microglia require CD4+ T cells to complete the fetal-to-adult maturation in the CNS 84,85. In summary, our study extends from the CD4+ T cell/microglia partnership by uncovering new ways in which such cooperation can be co-opted to develop more effective immunotherapies against human glioblastoma.
Limitations of the study
It is important to emphasize that while our data implicate a critical partnership of CD4+ T cells and microglia that contribute to effective immunotherapy against mesenchymal glioblastomas, our current study focused on mainly one MES-glioblastoma model. As glioblastomas are heterogeneous based on the subtypes of GSCs present, and each subtype will have different TMEs, we would therefore need to further examine how the tumors and TMEs vary by GSCs types, and how such types will dictate a glioblastoma’s response to various therapies, including immunotherapies. Also, the human glioma scRNA-seq data supports that microglia are protective against glioblastoma, but additional investigation into the expression of MHC-II and AXL/MER on glioma-associated microglia in human gliomas treated with ICB will be more informative of the clinical relevance of these pathways.
We have tried subcutaneous flank model of the 005 glioma to test whether αCTLA-4 is more effective than αPD-1 in brain tumor is because of inefficient drug delivery across the BBB, but unfortunately these tumors are unable to grow in the dermis. Whether ICB antibodies benefit locally or systemically, the penetration of immunotherapy antibodies in brain and cerebrospinal fluid (CSF) needs to be further investigated in pending immunotherapy clinical trials.
STAR Methods
RESOURCE AVAILABILITY
Lead Contact
Further information and requests for resources and reagents should be directed to and will be fulfilled by the lead contact, Susan M. Kaech (skaech@salk.edu).
Materials Availability
This study did not generate new unique reagents.
Data and Code Availability
All sequencing data from this paper are available in the GEO database under accession GSE233869.
EXPERIMENTAL MODEL AND SUBJECT DETAILS
Mice
B6 (C57BL/6J), Ly5.1 (B6.SJL-Ptprca Pepcb/BoyJ), muMT− (B6.129S2-Ighmtm1Cgn/J), Nur77GFP (C57BL/6-Tg(Nr4a1-EGFP/cre)820Khog/J), Ccr2−/− (B6.129S4-Ccr2tm1Ifc/J), Tbx21−/− (B6.129S6-Tbx21tm1Glm/J), IL-12YFP (C.129S4(B6)-Il12btm1.1Lky/J), MHC-II− (B6.129S2-H2dlAb1-Ea/J), CD11c-DTR (B6.FVB-1700016L21RikTg(Itgax-DTR/EGFP)57Lan/J), CX3CR1GFP (B6.129P2(Cg)-Cx3cr1tm1Litt/J), H2-Ab1-flox (B6.129X1-H2-Ab1tm1Koni/J), Tmem119-Cre ERT2 (C57BL/6-Tmem119em1(cre/ERT2)Gfng/J), and Rag1−/− (B6.129S7-Rag1tm1Mom/J) mice were purchased from Jackson Laboratories. H2-Ab1fl/flTmem119CreERT2/+ mice were generated by crossing H2-Ab1-flox mice with Tmem119-Cre ERT2 mice. CD169-DTR (Siglec1tm1(HBEGF)Mtka) 87 were kindly provided by Dr. Masato Tanaka at the Tokyo University of Pharmacy and Life Sciences (Tokyo, Japan). AxlF/FMertkF/FCx3ct1CreERT mice 59 and Axl−/−Mertk−/−Cx3cr1GFP/+ mice 88 were kindly provided by Dr. Greg Lemke at Salk Institute for Biological Studies (La Jolla, USA). All mice were maintained under specific-pathogen-free facilities at the Salk Institute and all experimental studies were approved and performed in accordance with guidelines and regulations implemented by the Salk Institute Animal Care and Use Committee.
Cell Lines
Mouse 005 glioma stem cells (GSCs) (Marumoto et al., 2009) or 005-Luciferase (005-Luc) GSCs were cultured as spheres in serum free stem cell medium composed of advanced DMEM/F12 medium (Corning), supplemented with 2 mM L-glutamine (Corning), 1% penicillin-streptomycin (Corning), 1% N2 supplement (Gibco), 40 mg/mL heparin (Sigma-Aldrich), recombinant human EGF (20 ng/mL; PeproTech), and recombinant human FGF-basic (20 ng/mL; PeproTech). Spheres were dissociated with TrypLE™ Express (ThermoFisher) for passaging. All the rest of the genetically-modified cell lines, including Ciita depletion 005 GSCs, β2m depletion 005 GSCs, Ifngr1 depletion 005 GSCs, and tdTomato overexpression (OE) 005 GSCs were all generated based on 005 GSCs cells. GL261 glioma cell line was a gift from Jeremy N. Rich (University of Pittsburgh) and was cultured in Dulbecco’s Modified Eagle Medium (DMEM) (ThermoFisher) with 10% fetal bovine serum and 1% penicillin-streptomycin. Cells were dissociated with 0.25% Trypsin-EDTA (ThermoFisher). Both 005 GSCs and GL261 were cultured at 37 °C in 5% CO2.
METHOD DETAILS
Intracranial Glioma Mouse Model
Single cell suspension of glioma cell lines was stereotactically injected into the hippocampus of 8- to 12-week-old C57BL/6J mice or other mice stains mentioned in the Mice Section above. Briefly, 005 GSCs (3×10⁵ cells) or 005-Luc GSCs (3×10⁵ cells) or GL261 (5×10⁴ cells) suspended in 3 μL PBS were loaded on a Hamilton microliter syringe with 26-gauge needle, and injected at a speed of 0.1uL/30s-1min using the following coordinate: 2.0 mm posterior, 1.5 mm lateral, and 2.3 mm dorsal to the bregma. Upon completing injection, the needle was left in place for 3 min, then withdrawn slowly in 2 min to help reduce cells reflux. 7 days after tumor implantation, mice were randomly divided into groups and injected with antibodies αPD-1 (clone RMP1-14; 10 mg/kg), or αCTLA-4 (Syrian hamster clone 9H10; 10 mg/kg). Isotype control antibodies rat IgG2a (clone LTF-2) or Syrian hamster IgG were purchased from BioXcell and administered 6 times intraperitoneally (i.p.) starting 7 days after glioma implantation. For depletion/blockade studies, C57Bl/6 mice were implanted with 005 GSCs and 7 days after implantation mice were treated with depletion antibodies aCD4 (clone GK1.5), aCD8 (2.43), NK1.1 (clone PK136), IFNγ blockade (clone XMG1.2) or rat IgG at 10 mg/kg. Mice were followed for neurological symptoms and euthanized before becoming moribund.
Tumor digestion and cell isolation
All mice were perfused with ice-cold PBS after euthanasia to reduce the influence of peripheral blood derived cells. All the brains were collected in ice-cold PBS, and then mechanically and enzymatically dissociated using a papain-based neural tissue dissociation kit P (Miltenyi Biotec) supplemented with 0.1% type I collagenase (Thermo Fisher Scientific) in a C-tube (Miltenyi Biotec), and then dissociated with a gentleMACS Qcto Dissociator using program 37C_NTDK_1 for 30 min, followed by filtration with 70 μm cell strainers. Filtered cells were incubated with ACK lysis buffer (Invitrogen) to lyse red blood cells. For glioma single cell suspension, filtered cells were resuspended with 0.9 M sucrose, spun down to remove supernatant, and the pellet containing tumor cells was saved for later use. For immune cell suspension, filtered cells were resuspended in 5 mL 37% Percoll, and slowly added beneath the 70% Percoll, and then centrifuged with brakes off. The immune cells were isolated from the interface of 37% and 70% Percoll and transferred into excessive RPMI 1640 medium containing 10% fetal bovine serum for later use.
Flow cytometry, cell sorting and antibodies
Single cell suspensions were incubated with Fc receptor-blocking anti-CD16/32 (BioLegend) on ice for 10 min before staining. Cell suspensions were first stained with Red Dead Cell Stain Kit (ThermoFisher) for 10 min on ice. Surface proteins were then stained in FACS buffer (PBS containing 2% FBS and 0.1% sodium azide) for 30 min at 4°C. To detect cytokine production ex-vivo, cell suspensions were re-suspended in RPMI 1640 containing 10% FBS, and then stimulated by 50 ng/ml PMA and 3 μM Ionomycin in the presence of 2.5 μg/ml Brefeldin A (BioLegend #420601) for 4 h at 37°C. Cells were processed for surface marker staining as described above. For intracellular cytokine staining, cells were fixed in BD Cytofix/Cytoperm (BD #554714) for 30 min at 4 °C, then washed with 1× Permeabilization buffer (Invitrogen #00-8333-56). For transcription factor staining, cells were fixed in Foxp3 / Transcription Factor Fixation/Permeabilization buffer (Invitrogen #00-5521-00) for 30 min at 4 °C, then washed with 1× Permeabilization buffer. Cells were then stained with intracellular antibodies for 30 min at 4 °C. Samples were processed on LSR-II flow cytometer (BD Biosciences) and data were analyzed with FlowJo V10 (TreeStar). For sorting experiments, cells were sorted either on FACSAria™ III sorter or Fusion sorter (BD Biosciences). The following antibodies against mouse proteins were used: anti-CD45 (30-F11), anti-CD3ε (145-2C11), anti-CD4 (GK1.5), anti-CD8a (53–6.7), anti-PD-1 (29F.1A12), anti-CX3CR1 (SA011F11), anti-Ly5.1 (A20), anti-Ly5.2 (104), anti-CD25 (PC61.5), anti-CD49b (DX5), anti-NKp46 (29A1.4), anti-I-A/I-E (MHC-II) (M5/114.15.2), anti-CD80 (16-10A1), anti-CD86 (GL-1), anti-PD-L1 (10F.9G2), anti-CD11b (M1/170), anti-CD11c (N418), anti-CD169 (3D6.112), anti-F4/80 (BM8), anti-Ly6c (HK1.4), anti-Ly6G (1A8), anti-B220 (RA3-6B2), anti-CD19 (1D3/CD19), anti-MER (DS5MMER), anti-CD74 (In1/CD74), anti-AXL (175128), anti-P2RY12 (S16007D), anti-H-2Kb/H-2Db (MHC-I) (28-8-6), anti-FoxP3 (FJK-16S), anti-IFN-γ (XMG1.2), anti-TNF-α (MP6-XT22), anti-GZMB (GB11), anti-IL-2 (JES6-5H4), anti-GM-CSF (MP1-22E9), and anti-T-bet (4B10). These antibodies were purchased from Invitrogen, BioLegend, Cell Signaling, or eBiosciences.
Tissue sectioning and Immunohistochemistry
Mice were euthanized and transcardially perfused with PBS followed by 2% paraformaldehyde (PFA). Dissected brains were fixed in 2% PFA overnight at 4°C followed by ten-minute washes for three times in PBS. Brains were mounted for sectioning using 4% low melting point agarose (Sigma, A9414) dissolved in water. Serial coronal sections (75μm) were taken using a vibratome (Leica VT1000S). Brain sections were incubated in blocking buffer (1× PBS, 0.03% Triton X-100, 0.015% Tween20, 2% BSA) for 2 hours at room temperature. Primary antibody incubations were done in blocking buffer for 2 days at 4°C on a shaker. Excess primary antibodies were rinsed out by thirty-minute washes for three times with wash buffer (1× PBS, 0.03% Triton X100, 0.015% Tween20). Secondary antibody incubations were done overnight at 4°C. Excess antibodies were removed by thirty-minute washes for three times with wash buffer. After labeling, all sections were mounted in several drops of Fluormount (Sigma, F4680) on standard 75mm × 25mm microscope slides (Corning, 2947) and sealed with a #1 coverslip and nail polish. The following antibodies against mouse proteins were used: Goat anti mouse AXL (AF854, R&D Systems), Rabbit anti mouse Iba1 (A19776, AB clonal), Anti-mouse CD4-PE (100407, Biolegend), Anti-mouse I-A/I-E (MHC Class II)-BV421 (107631, BioLegend), Donkey anti goat IgG AF594 (A-11058, Thermo Scientific), and Donkey anti rabbit IgG AF647 (A-31573, Thermo Scientific).
Microscopy and quantification
Brain sections were imaged with a Zeiss LSM 880 with a 20X air objective. Zeiss Zen Black software was used to set up confocal imaging parameters within the “Smart Setup” (“Best Signal” mode) feature based on the fluorophores used in immunofluorescence experiments. AXL expression was quantified from 4 to 5 sections per brain taken at least 150 μm apart. AXL fluorescence was measured from the tenth optical section within the z-stack of the tumor area from the brain section. All measurements of expression were done in Fiji (ImageJ) 97. Mean fluorescence intensity (MFI) was calculated for the optical sections via Fiji (Image J) by calculating mean fluorescence on the AXL+ region of interest (ROI). Within the “Set Measurements” menu of the Fiji Results tab, we selected area, mean gray value, integrated density, and limit to threshold. The MFI of AXL expression was taken by setting an ROI from within the tumor border using the rectangle tool in Fiji from the 594nm detection channel used to image AXL expression. Background fluorescence was measured from an ROI outside the tumor border lacking AXL+ microglia. The MFI of the section was corrected by subtracting the MFI of the background ROI from the MFI of the AXL+ ROI within the tumor. The average MFI was determined by averaging corrected MFI measurements among the optical sections of a given brain. Statistical analysis of AXL expression was performed using GraphPad Prism (v9.3). Representative confocal images of tumors and associated immune cells were deconvoluted and prepared using Imaris (v9.8).
IVIS imaging
Glioma bearing mice were injected i.p. with 150 mg/kg D-Luciferin Firefly (Biosynth Carbosynth) in PBS. After 10 min the mice were anaesthetized with 2% isoflurane, and were imaged using the IVIS Spectrum In Vivo Imaging System (Xenogen).
Brain-protected bone marrow chimeric model
Ly5.1 or MHC-II− (Ly5.2) recipient mice were irradiated at 1200 rads with lead shield brain-protection and reconstituted with 5 million bone marrow cells per mouse isolated from tibias and femurs of Ly5.1 donor mice. After ten weeks of reconstitution, immune chimeras were generated as previously described 86.
CRISPR/Cas9 depletion in primary T cells and Adoptive T cell transfer
Naïve T cells were harvested from spleen and LNs. Naive CD4+ or CD8+ T cells were enriched using the EasySep Mouse CD4+/CD8+ T Cell Isolation Kit (STEMCELL Technologies) according to the manufacturer’s protocol. Cells were counted and resuspended at 5×10⁶ cells in PBS in a 1.5 mL Eppendorf tube per sgRNA target. For sgRNA/Cas9 ribonucleoprotein (RNP) complex formation, 0.6 μl of Cas9 protein (IDT) was combined with 1 μl of target sgRNA1, 1 μl of target sgRNA2 (0.3 nM, Synthego) and 2.4 μl of nuclease free water (CRISPRevolution kit) to a final volume of 5 μl in PCR tubes, and the mixture was incubated for 10 minutes at room temperature for complex formation. After complex formation, T cells were spun down, with supernatant removed from cell pellet. T cells were then resuspended in 20 μL of P3 buffer (16.4 μL P3 + 3.6 μL regent 1) (P3 Primary Cell 4D-Nucleofector™ X Kit S), with addition of 5 μl of RNP followed by gentle mixing. 25 μL of RNP/cell mix were then transferred to the bottom hole of a well of a Lonza nucleofector strip. Cells were electroporated by Lonza nucleofector using a pre-established DN100 program. Immediately after electroporation, 150 μL of 37 °C pre-warmed 10% RPMI were added and cells were let to rest for 10 minutes in the incubator. 1×10⁶ CD4+ or CD8+ cells per mice were adoptively transferred to Rag1−/− mice 1 day before glioma implantation. The sequences of sgRNA are shown below: Ifng sgRNA1 (UCUAUGCCACUUGAGUUCUG), Ifng sgRNA1 (UCAAGACUUCAAAGAGUCUG); Ciita sgRNA1 (AGCUCGACUAAGGCUCCGGG), Ciita sgRNA2 (UCCAGUGUCCUAAUCUACCA); B2m sgRNA1 (AUUUGGAUUUCAAUGUGAGG), B2m sgRNA2 (ACUCACUCUGGAUAGCAUAC). Ifngr1 sgRNA1 (UAUGUGGAGCAUAACCGGAG), Ifngr1 sgRNA2 (GGUAUUCCCAGCAUACGACA).
Microglia isolation
Primary microglia were isolated by using Neural Tissue Dissociation Kit (P) (Miltenybiotec # 130-092-628) according to the manufacturer’s protocol. Briefly, brain tissues were collected from CX3CR1GFP (B6.129P2(Cg)-Cx3cr1tm1Litt/J) mice, and they were washed in cold Dulbecco’s phopshate-buffered saline (D-PBS). Brains were then cut into small pieces and transferred into C tubes (Miltenybiotec # 130-093-237) containing 1900 μL buffer X, 50 μL enzyme P, 20 μL buffer Y and 10 μL enzyme A, and then dissociated with gentleMACS Program 37C_ABDK_01. After termination of the program, samples were resuspended and strained through 70 μm nylon strainer placed on a 50 mL tube. Filtered cells were centrifuged at 300×g for 5 minutes at 4 °C, and were resuspended in 5 mL 37% Percoll. These resuspended cells were slowly added beneath the 70% Percoll, and then centrifuged with brakes off. The immune cells were isolated from the interface of 37% and 70% Percoll and transferred into DMEM medium containing 10% fetal bovine serum for later use.
TCGA Survival analysis
RTCGA was used to obtain glioblastoma patients survival statistics and matched RNA expression values. The ratio of expression values for P2RY12 divided by CD163 was calculated for each patient. Patient samples were categorized into either high (greater than 50th percentile) or low (lower than 50th percentile) groups according to the P2RY12/CD163 ratio, and survival curves were plotted using the ggplot2 package in R.
Single-cell RNA sequencing
Microglia (CD45intCX3CR1+), myeloid cells (CD45hiCD11b+), T cells (CD45hiCD3+) and all remaining immune cells (CD45hiCD11b−CD3−) were sorted from normal brain and 005 glioma-bearing brains treated with IgG, αCTLA-4, or αCTLA-4 combined with CD4 depletion. Cells from each treatment group were pooled at equal ratios and then subjected to scRNA-seq. Sorted cells were partitioned into an emulsion of nanoliter-sized droplets using a 10x Genomics Chromium Single Cell Controller and RNA sequencing libraries were constructed using the Chromium Single Cell 3′ Library & Gel Bead Kit v2 (10X Genomics, Cat# PN-120237). Briefly, droplets containing individual cells, reverse transcription reagents and a gel bead were loaded with poly(dT) primers that include a 16 base cell barcode and a 10-base unique molecular index (UMI). Reverse transcription reactions were engaged to generate barcoded full-length cDNA followed by the disruption of emulsions using the recovery agent and cDNA clean up with DynaBeads MyOne Silane Beads (Thermo Fisher Scientific, Cat# 37002D). Bulk cDNA was amplified, and indexed sequencing libraries were constructed using the reagents from the Chromium Single Cell 3′ v2 Reagent Kit. Libraries were sequenced on NextSeq 500 Sequencing System (Illumina Cambridge). We recovered 1,420 immune cells from normal brain, 1,484 immune cells from IgG group, 1,874 immune cells from αCTLA-4 groups, and 3,916 immune cells from αCTLA-4 combined with CD4 depletion groups.
Single-cell V(D)J sequencing
scRNAseq and scTCRseq were performed in brain harvested T cells from 005 bearing mice treated with IgG or αCTLA-4 (35 days post implantation). CD3+ cells were sorted and immediately loaded onto a 10x Chromium Chip G using reagents from the Chromium Single-Cell 5’ Library and Gel Bead Kit v1.1 (10x Genomics) according to the manufacturer’s protocol. 5’ gene expression libraries were generated using 10X Genomics Chromium Single Cell 5’ Library Construction Kits according to manufacturer protocols. TCR enrichment libraries were prepared following mouse T cell Single Cell V(D)J Enrichment Kits (10x Genomics). The final libraries were profiled using the Bioanalyzer High Sensitivity DNA Kit (Agilent Technologies) and quantified using the Kapa Library Quantification Kit (Kapa Biosystems). Each single-cell RNA-seq library was sequenced in one lane of NovaSeq6000 (Illumina) to obtain a minimum of 20,000 paired-end reads (26 × 91 bp) per cell. Single-cell TCR V (D)J libraries were multiplexed and sequenced in one lane of NovaSeq6000 (Illumina) to obtain minimum of 5000 paired-end reads (26 × 91 bp) per cell. The sequencing specifications for both single-cell RNA-seq and TCR V(D)J libraries were determined according to the manufacturer’s specification (10x Genomics).
Bulk RNA sequencing
Microglia (CD45intCX3CR1+) were sorted from the glioma bearing mice in different treatment groups (IgG vs. αCTLA-4 vs. αCTLA-4+αCD4). Glioma (CD45−GFP+) were sorted from the glioma bearing mice. Total RNA was isolated using Trizol–Qiagen RNAeasy Micro kit and sent to Salk next generation sequencing core for ultra-low input RNA-Seq cDNA library preparation and sequencing run on Illumina Hiseq2500.
Bulk RNA-seq analysis
RNA sequencing was performed using the Illumina HiSeq 2500 platform on 51-bp single-end libraries prepared using the IlluminaTruSeq RNA sample preparation kit. Reads were mapped and aligned using STAR to the Mus musculus genome mm10. Reads were quantified and normalized using HOMER to generate raw counts and fragments per kilobase of exon per million mapped fragments (FPKM). Resulting FPKM values were processed by DESeq2 package 92 to perform statistical analysis (Log2Fold change and p value). To identify enriched pathways, Gene Set Enrichment Analysis (GSEA) was performed using fgsea package 93 on differentially expressed genes with L2FC>1.5 and p value<0.05.
Processing of scRNA/scTCR seq data
Raw sequencing data was processed and aligned mm10 mouse reference genome with CellRanger (10x Genomics) v 3.0.1. Resulting filtrated matrices (count matrices) of molecular counts were used as input for further processing with Seurat package V3.0.3 89 running under R studio. First, quality control was performed to create Seurat object with min features >200 and removal of cells having <200 or >5000 expressed genes or >7% mitochondrial counts. The total number of recovered cells was 8,139 cells from scRNA-seq, and 5,514 T lymphocytes from V(D)J combination information for αCTLA-4 treated group, and 9,746 cells from scRNA-seq data and 3,279 T lymphocytes from V(D)J combination information for IgG treated group. Variable features using FindVariableFeatures (using RNA and vst as an assay and selection method as parameters) and normalization using scTransform functions were performed. Further sc-transformed objects were integrated using PrepSCTIntegration, FindIntegrationAnchors and IntegrateData with normalization method set to “SCT”. This integrated data is scaled using ScaleData function using all genes and “RNA” as assay method. Principal Component Analysis was performed on top variable features using RunPCA and first 30 Principal components were chosen for computing shared nearest neighbors (SNN) using FindNeighbors function. FindClusters function with resolutions obtained from 0 to 1 in gradients of 0.1 was applied to our analysis. Finally, non-linear dimensional reduction such as UMAP/tSNE analysis was performed to visualize the data using RunUMAP and RunTSNE functions, respectively. To identify cell types, FindAllMarkers function was performed to determine differentially expressed features (cluster specific makers) and cluster names were manually curated. This was later confirmed using singleR package 90 and singlecellexperiment function. Top 5 genes from each cluster were used to further generate heatmap using DoHeatmap function. For each cluster, all differentially expressed genes (DEGs) were obtained by comparing different conditions using FindMarkers function (with assay = “RNA” and logfc.threshold = 0), which performs Wilcoxon Rank Sum test. This table is further used to generate volcano plot using ggplot package in Seurat. For plotting specific genes of interest, either DoHeatmap or DittoHeatmap function of dittoseq package is used (assay = “RNA”). Specific gene of interest was plotted on the Uniform Manifold Approximation and Projection (UMAP) using FeaturePlot package (slot = “scaled.data”) within Seurat.
NicheNet analysis
Cell interactions NicheNet Ligand-receptor interactions between populations from scRNA dataset were performed using nichenetr package 58. Required data that include NicheNet networks and ligand-target matrix were loaded. Ableit ligand target matrix was modified to include mouse antigen presenting genes. Receiver was set to microglial cluster, in order to determine the cell type contributing to the gene expression changes in microglia. Clusters representing CD8+ T cells, CD4+ helper T cells, Myeloid cells, Tregs and others are considered as sender cells. Nichenet analysis was performed as described in (https://github.com/saeyslab/nichenetr/blob/master/vignettes/seurat_wrapper_circos.md). The analysis was carried out especially on differentially expressed genes in microglia compared between αCTLA-4 and IgG using FindMarkers function of Seurat package (with min.pct = 0.30 and assay = “RNA”). Finally, Circos plots using circos.par, chordDiagram, circos.track functions of circlize package were used to plot the ligand-receptor interactions.
scTCR seq analysis
scTCR and scRNA seq analysis was performed by combining Seurat and scRepertoire packages 91. For reading scTCR seq data, Read10X_h5 function of Seurat package was used and clonotype information was added to the single cell object using add_clonotype function. Following similar data processing as described above and upon removing cells having <200 or > 4000 expressed genes or >10% mitochondrial counts, objects were integrated, normalized (SCTransform) and scaled to determine principal components and SNN. TCR information (after combining filtered contig annotations of IgG and αCTLA-4) was merged to integrated Seurat object using combineExpression function of scRepertoire package. Information of clonal expansion for each cell was determined and added to the Seurat object. Thus, “Hyperexpanded” cells are cells with clones between 100 – 500. Based on the number of clones, remaining cells were characterized as “Large” (20–100), “Medium” (5 – 20), “Small” (1 – 5), or “Single” (0 −1). Cells with no TCR information are labelled as “NA”. Clonotypes within CD4 T cells/CD8 T cells/Treg were separately compared between IgG and αCTLA-4 using alluvialClonotypes function. Specific TCR gene or amino acid sequence or non-TCR gene was plotted on the UMAP using highlightClonotypes function from scRepertorire package or FeaturePlot package of Seurat.
Processing of published scRNA-seq data
scRNA-seq dataset of human glioblastoma and cell types and sub-cell types were identified as described 54, in which 201,893 cells from 18 glioma patients were sequenced. Nine myeloid clusters with unique gene expression patterns were displayed in the UMAP, consisting of DCs and 4 microglia subsets including homeostatic microglia (h-microglia), inflammatory microglia (i-microglia), activated microglia (a-microglia), and antigen-presenting microglia (AP-microglia), as well as 4 macrophages subsets including suppressive macrophages 1 (s-mac 1), suppressive macrophages 2 (s-mac 2), myeloid-derived suppressor cells (MDSC), and proliferating macrophages (Proliferating).To analyze macrophages vs. microglia, we collapsed proliferating myeloid cells, s-mac 1 and s-mac 2 defined from dataset annotation into one group of macrophages.
Assignment of GBM subtypes
To annotate glioma cell subtypes in human GBM scRNA-seq dataset, we first leveraged meta-modules defined by Neftel et al. 4 (MES1-like, MES2-like, NPC1-like, NPC2-like, AC-like, and OPC-like) and annotations edited by Nourhan et al. 54 (MES-like, NPC-like, AC-like and OPC-like). Notably, we also added PDPN to MES-like gene list and PDGFRA to OPC-like gene list. Next, we used JLaffy/scrabble:: score function to calculate meta-module scores of four subtype and JLaffy/scrabble::hierarchy function to assign the position of each dot on the butterfly plot.
We further annotated fragment GBM subtypes (MES-like, NPC-like, OPC-like, AC-like) based on dominant glioma subtypes with two criteria. (1) Glioma cells of dominant subtype take more than 50% of total glioma cells in the fragment. (2) Glioma cells of second dominant subtype are less than 40%. Fragment satisfying the criteria was annotated by dominant glioma subtype, with one exception. Fragments with NPC-dominant glioma more than 40% irrespective of second dominant subtype proportion were assigned as NPC-like subtype.
Glioma subtype scores of 005 GSCs
Reads from bulk RNA-seq of 005 GSCs were aligned to the GRCm39/mm39 mouse genome using STAR. Expression values were TMM-normalized using edgeR::calcNormFactors, followed by conversion to log counts per million with edgeR::cpm.
Glioma subtype scores of in-vitro 005 GSCs were calculated using the JLaffy/scrabble R packages as described above.
QUANTIFICATION AND STATISTICAL ANALYSIS
Statistical analyses were performed using the two-tailed, unpaired, Student’s t-test unless otherwise specified. Each point represented a biological replicate and all data were presented as the mean ± SEM. The P values were represented as follows: ns, not significant, ****P < 0.0001, ***P < 0.001, **P < 0.01 and *P < 0.05.
Supplementary Material
| REAGENT or RESOURCE | SOURCE | IDENTIFIER |
|---|---|---|
| Antibodies | ||
| Brilliant Violet 711™ anti-mouse CD45 | BioLegend | Cat# 103147; RRID: AB_2564383 |
| PerCP/Cyanine5.5 anti-Mouse CD3 | BioLegend | Cat# 100328; RRID: AB_1595597 |
| BUV737 anti-mouse CD4 | BD | Cat# 612761; RRID: AB_2870092 |
| BUV395 anti-mouse CD8a | BD | Cat# 563786; RRID: AB_2732919 |
| Brilliant Violet 421 anti-mouse CX3CR1 | BioLegend | Cat# 149023; RRID: AB_1937328 |
| Brilliant Violet 605 anti-mouse PD-1 | BioLegend | Cat# 135220; RRID: AB_2562616 |
| PE anti-mouse CD25 | eBioscience | Cat# 12-0251-83; RRID: AB_2716208 |
| Brilliant Violet 421anti-mouse CD45.1 | BioLegend | Cat# 110722; RRID: AB_10896425 |
| PerCP-Cy5.5 anti-mouse CD45.2 | BioLegend | Cat# 109828; RRID: AB_893350 |
| BUV737 anti-mouse CD11b | BD | Cat# 612800; RRID: AB_2571945 |
| BUV395 anti-mouse CD11c | BD | Cat# 744180; RRID: AB_2571945 |
| PE anti-mouse F4/80 | BioLegend | Cat# 123110; RRID: AB_2737732 |
| PerCP anti-mouse I-A/I-E | BioLegend | Cat# 107624; RRID: AB_2737763 |
| Brilliant Violet 605 anti-mouse Ly-6C | BD | Cat# 128036; RRID: AB_2742834 |
| Anti-mouse CD16/32 | BioLegend | Cat# 101302; RRID: AB_312801 |
| BUV395 anti-mouse Ly-6G | BD | Cat# 563978; RRID: AB_10855034 |
| Brilliant Violet 421anti-mouse B220 | BioLegend | Cat# 103240; RRID: AB_893299 |
| PE anti-mouse MER | Invitrogen | Cat# 12-5751-82; RRID: AB_2566032 |
| Alexa Fluor 488 anti-mouse CD80 | BioLegend | Cat# 104716; RRID: AB_10900421 |
| Alexa Fluor 488 anti-mouse CD86 | BioLegend | Cat# 105018; RRID: AB_10916390 |
| Brilliant Violet 605™ anti-mouse CD274 | BioLegend | Cat# 124321; RRID: AB_2563212 |
| Alexa Fluor 647 anti-mouse H-2Kb/H-2Db | BioLegend | Cat# 114612; RRID: AB_2814228 |
| Brilliant Violet 421anti-mouse T-bet | BioLegend | Cat# 644816; RRID: AB_1311204 |
| PE anti-mouse GM-CSF | BioLegend | Cat# 505406; RRID: AB_2033978 |
| APC anti-mouse IL-2 | BioLegend | Cat# 503810; RRID: AB_1548821 |
| Brilliant Violet 421 anti-mouse CD335 | BioLegend | Cat# 137612; RRID: AB_2139682 |
| PE anti-mouse DX5 | BioLegend | Cat# 108908; RRID: AB_2139682 |
| APC anti-mouse AXL | eBioscience | Cat# 17-1084-82; RRID: AB_2139682 |
| Alexa Fluor 647 anti-mouse CD74 | BioLegend | Cat# 151004; RRID: AB_2139682 |
| PE/Cy7 anti-mouse IFN-γ | BioLegend | Cat# 505826; RRID: AB_2295770 |
| PE anti-mouse TNF | BioLegend | Cat# 506306; RRID: AB_315426 |
| FTIZ anti-mouse GZMB | BioLegend | Cat# 515403; RRID: AB_2114575 |
| APC anti-mouse P2RY12 | BioLegend | Cat# 848006; RRID: AB_2114575 |
| APC anti-mouse Annexin V | BioLegend | Cat# 640920; RRID: AB_2561515 |
| eBioscience™ Fixable Viability Dye eFluor™ 780 | ThermoFisher Scientific |
Cat# 65-0865-14 |
| Bacterial and virus strains | ||
| Chemicals, peptides, and recombinant proteins | ||
| DMEM | GIBCO | Cat# 11965118 |
| DMEM/F-12 | Corning | Cat# 10-092-CV |
| PBS | GIBCO | Cat# 20012–068 |
| RPMI 1640 Medium | GIBCO | Cat# 21875034 |
| Non-essential amino acids | GIBCO | Cat# 11140–035 |
| Fetal bovine serum | Sigma-Aldrich | Cat# F0804 |
| 2-Mercaptoethanol | GIBCO | Cat# 21985023 |
| L-Glutamine | GIBCO | Cat# 25030081 |
| Recombinant Murine IFNγ | R&D Systems | Cat# 485-MI-100 |
| Recombinant Murine IL-2 | PEPROTECH | Cat# 212–12 |
| Recombinant Human FGF-basic | PEPROTECH | Cat# GMP100-18B |
| Recombinant Human EGF | PEPROTECH | Cat# AF-100-15 |
| Rotenone | Sigma | Cat# 557368 |
| DnaseI | Sigma | Cat# DN25-5G |
| N-2 Supplement | ThermoFisher | Cat# 17502–048 |
| Penicillin-streptomycin | Invitrogen | Cat#15140148 |
| 10× Permeabilization buffer | Invitrogen | Cat# 00–8333-56 |
| BD Cytofix/Cytoperm | BD | Cat# 554714 |
| Foxp3/Transcription factor staining buffer set | eBioscience | Cat# 00–5523-00 |
| ACK buffer | Thermo | Cat# A1049201 |
| Percoll | GE Healthcare | Cat# 17-0891-01 |
| HBSS | GIBCO | Cat# 14025092 |
| PMA (Phorbol 12-myristate 13-acetate) | Sigma | Cat# P8139-1MG |
| Ionomycin | Sigma | Cat# 10634-1MG |
| Brefeldin A | BioLegend | Cat# 420601 |
| BD GolgiPlug™ Protein Transport Inhibitor | BD | Cat# 555029 |
| Alt-R S.p. Cas9 Nuclease V3 | IDT | Cat# 1081059 |
| Critical commercial assays | ||
| Single Cell 3′ Library & Gel Bead Kit v2 | 10X Genomics | Cat# PN-120237 |
| Single Cell 5’ Library & Gel Bead Kit v1.1 | 10X Genomics | Cat# PN-1000165 |
| Chromium Single Cell V(D)J Enrichment Kit, Mouse T Cell | Cat# PN-1000071 | |
| RNeasy Plus Micro Kit | QIAGEN | Cat# 74034 |
| Neural Tissue Dissociation Kit (P) | Miltenyi Biotec | Cat# 130-092-628 |
| P3 Primary Cell 4D X Kit S (32 RCT) | Lonza | Cat# V4XP-3032 |
| Deposited data | ||
| Raw and analyzed data | This paper | GEO: GSE233869 |
| Experimental models: Organisms/strains | ||
| Mouse: C57BL/6J | Jackson | RRID: IMSR_JAX:000664 |
| Mouse: B6.SJL-Ptprca Pepcb/BoyJ | Jackson | RRID: IMSR_JAX:002014 |
| Mouse: B6.129S2-Ighmtm1Cgn/J | Jackson | RRID: IMSR_JAX:002288 |
| Mouse: C57BL/6-Tg(Nr4a1-EGFP/cre)820Khog/J | Jackson | RRID: IMSR_JAX:016617 |
| Mouse: B6.129S4-Ccr2tm1Ifc/J | Jackson | RRID: IMSR_JAX:004999 |
| Mouse: B6.129S6-Tbx21tm1Glm/J | Szabo et al., 2002 | RRID: IMSR_JAX:004648 |
| Mouse: C.129S4(B6)-Il12btm1.1Lky/J | Jackson | RRID: IMSR_JAX:015864 |
| Mouse: B6.129S2-H2dlAb1-Ea/J | Jackson | RRID: IMSR_JAX:003374 |
| Mouse: B6.FVB-1700016L21RikTg(Itgax-DTR/EGFP)57Lan/J | Jackson | RRID: IMSR_JAX:004509 |
| Mouse: B6.129P2(Cg)-Cx3cr1tm1Litt/J | Jackson | RRID: IMSR_JAX:005582 |
| Mouse: B6.129X1-H2-Ab1tm1Koni/J | Jackson | RRID: IMSR_JAX:013181 |
| Mouse: C57BL/6-Tmem119em1(cre/ERT2)Gfng/J | Jackson | RRID: IMSR_JAX:031820 |
| Mouse: B6.129S7-Rag1tm1Mom/J | Jackson | RRID: IMSR_JAX:002216 |
| Mouse: Siglec1tm1(HBEGF)Mtka | 86,87 | MGI:3720841 |
| Mouse: AxlF/FMertkF/FCx3cr1CreERT | 59 | N/A |
| Mouse: Axl−/−Mertk−/−Cx3cr1GFP/+ | 88 | N/A |
| Oligonucleotides | ||
| sgRNA targeting sequence: Ifng #1: UCUAUGCCACUUGAGUUCUG | This paper | N/A |
| sgRNA targeting sequence: Ifng #2: UCAAGACUUCAAAGAGUCUG | This paper | N/A |
| sgRNA targeting sequence: Ciita #1: AGCUCGACUAAGGCUCCGGG | This paper | N/A |
| sgRNA targeting sequence: Ciita #2: UCCAGUGUCCUAAUCUACCA | This paper | N/A |
| sgRNA targeting sequence: B2m #1: AUUUGGAUUUCAAUGUGAGG | This paper | N/A |
| sgRNA targeting sequence: B2m #2: ACUCACUCUGGAUAGCAUAC | This paper | N/A |
| sgRNA targeting sequence: Ifngr1 #1: UAUGUGGAGCAUAACCGGAG | This paper | N/A |
| sgRNA targeting sequence: Ifngr1 #2: GGUAUUCCCAGCAUACGACA | This paper | N/A |
| Recombinant DNA | ||
| Software and algorithms | ||
| Flowjo | FlowJo, LLC | https://www.flowjo.com/ |
| R 3.6.1 | CRAN | https://cran.r-project.org/mirrors.html |
| RStudio 1.2 | RStudio | https://rstudio.com/ |
| IDEAS V6 | Aminis | https://www.luminexcorp.com/ |
| Seurat V3 | 89 | https://satijalab.org/seurat/v3.0/ |
| singleR | 90 | https://bioconductor.org/packages/release/bioc/html/SingleR.html |
| scRepertoire | 91 | https://github.com/ncborcherding/scRepertoire |
| nichenetr | 58 | https://github.com/saeyslab/nichenetr |
| DESeq2 | 92 | https://bioconductor.org/packages/release/bioc/html/DESeq2.html |
| fgsea | 93 | https://bioconductor.org/packages/release/bioc/html/fgsea.html |
| Limma | 94 | https://www.bioconductor.org/packages/release/bioc/html/limma.html |
| scCustomize | 95 | https://samuel-marsh.github.io/scCustomize/ |
| JLaffy/scrabble | https://github.com/jlaffy/scrabble | |
| ggstatsplot | 96 | https://indrajeetpatil.github.io/ggstatsplot/ |
Highlights.
αCTLA-4 therapy induces protective CD4+ Th1 cells against mesenchymal glioblastomas.
Th1-derived IFNγ induces MHC-II+ microglia that sustains Th1 anti-glioma immunity.
Th1 cells promote microglia phagocytosis of gliomas via AXL-MER receptor signaling.
Microglia and MHC-II expression are protective correlates in human glioblastoma.
Acknowledgements
We thank the Kaech lab for helpful discussion. 005 GSCs were kindly provided by Dr. Inder M. Verma. PLX3397 chow were kindly provided by Dr. Lara Labarta Bajo and Dr. Nicola Allen. CD169DTR were kindly provided by Dr. Masato Tanaka. AxlF/FMertkF/FCx3cr1CreERT mice were kindly provided by Dr. Carla Rothlin and Dr. Greg Lemke. The TCGA research network contributed to this study. This work was supported by the Flow Cytometry Core Facility of the Salk Institute with funding from NIH-NCI CCSG: P30 014195 and Shared Instrumentation Grant S10-OD023689 (Aria Fusion cell sorter) and by the NGS Core Facility of the Salk Institute with funding from NIH-NCI CCSG: P30 014195, the Chapman Foundation and the Helmsley Charitable Trust. This work was supported by the NIH (NCI CA195613 to I.M.V. and T.H.), and Salk innovation grant (to S.M.K.), Salk Accelerators Fellowship Award (D.C.), the NOMIS Center (D.C., and S.K.V.), as well as the following postdoc fellowships from the Cancer Research Institute (S.K.V., and S.M.), Damon Runyon Cancer Research Foundation (T.M.), National Cancer Center fellowship (S.K.V.).
Footnotes
Publisher's Disclaimer: This is a PDF file of an unedited manuscript that has been accepted for publication. As a service to our customers we are providing this early version of the manuscript. The manuscript will undergo copyediting, typesetting, and review of the resulting proof before it is published in its final form. Please note that during the production process errors may be discovered which could affect the content, and all legal disclaimers that apply to the journal pertain.
Declaration of Interests
S.M.K. is on the scientific advisory boards and has equity in EvolveImmune Therapeutics, Affini-T Therapeutics, Arvinas, and Pfizer.
Inclusion and Diversity
One or more of the authors of this paper self-identifies as an underrepresented ethnic minority in their field of research or within their geographical location.
References
- 1.Taylor OG, Brzozowski JS, and Skelding KA (2019). Glioblastoma Multiforme: An Overview of Emerging Therapeutic Targets. Front Oncol 9, 963. 10.3389/fonc.2019.00963. [DOI] [PMC free article] [PubMed] [Google Scholar]
- 2.Tan AC, Ashley DM, Lopez GY, Malinzak M, Friedman HS, and Khasraw M (2020). Management of glioblastoma: State of the art and future directions. CA Cancer J Clin 70, 299–312. 10.3322/caac.21613. [DOI] [PubMed] [Google Scholar]
- 3.Qazi MA, Vora P, Venugopal C, Sidhu SS, Moffat J, Swanton C, and Singh SK (2017). Intratumoral heterogeneity: pathways to treatment resistance and relapse in human glioblastoma. Ann Oncol 28, 1448–1456. 10.1093/annonc/mdx169. [DOI] [PubMed] [Google Scholar]
- 4.Neftel C, Laffy J, Filbin MG, Hara T, Shore ME, Rahme GJ, Richman AR, Silverbush D, Shaw ML, Hebert CM, et al. (2019). An Integrative Model of Cellular States, Plasticity, and Genetics for Glioblastoma. Cell 178, 835–849 e821. 10.1016/j.cell.2019.06.024. [DOI] [PMC free article] [PubMed] [Google Scholar]
- 5.Hara T, Chanoch-Myers R, Mathewson ND, Myskiw C, Atta L, Bussema L, Eichhorn SW, Greenwald AC, Kinker GS, Rodman C, et al. (2021). Interactions between cancer cells and immune cells drive transitions to mesenchymal-like states in glioblastoma. Cancer Cell 39, 779–792 e711. 10.1016/j.ccell.2021.05.002. [DOI] [PMC free article] [PubMed] [Google Scholar]
- 6.Wang Q, Hu B, Hu X, Kim H, Squatrito M, Scarpace L, deCarvalho AC, Lyu S, Li P, Li Y, et al. (2017). Tumor Evolution of Glioma-Intrinsic Gene Expression Subtypes Associates with Immunological Changes in the Microenvironment. Cancer Cell 32, 42–56 e46. 10.1016/j.ccell.2017.06.003. [DOI] [PMC free article] [PubMed] [Google Scholar]
- 7.Ma H, Zhao C, Zhao Z, Hu L, Ye F, Wang H, Fang Z, Wu Y, and Chen X (2020). Specific glioblastoma multiforme prognostic-subtype distinctions based on DNA methylation patterns. Cancer Gene Ther 27, 702–714. 10.1038/s41417-019-0142-6. [DOI] [PubMed] [Google Scholar]
- 8.Kim Y, Varn FS, Park SH, Yoon BW, Park HR, Lee C, Verhaak RGW, and Paek SH (2021). Perspective of mesenchymal transformation in glioblastoma. Acta Neuropathol Commun 9, 50. 10.1186/s40478-021-01151-4. [DOI] [PMC free article] [PubMed] [Google Scholar]
- 9.Farkona S, Diamandis EP, and Blasutig IM (2016). Cancer immunotherapy: the beginning of the end of cancer? BMC Med 14, 73. 10.1186/s12916-016-0623-5. [DOI] [PMC free article] [PubMed] [Google Scholar]
- 10.Bonaventura P, Shekarian T, Alcazer V, Valladeau-Guilemond J, Valsesia-Wittmann S, Amigorena S, Caux C, and Depil S (2019). Cold Tumors: A Therapeutic Challenge for Immunotherapy. Front Immunol 10, 168. 10.3389/fimmu.2019.00168. [DOI] [PMC free article] [PubMed] [Google Scholar]
- 11.Zhang Y, and Zhang Z (2020). The history and advances in cancer immunotherapy: understanding the characteristics of tumor-infiltrating immune cells and their therapeutic implications. Cell Mol Immunol 17, 807–821. 10.1038/s41423-020-0488-6. [DOI] [PMC free article] [PubMed] [Google Scholar]
- 12.Sade-Feldman M, Yizhak K, Bjorgaard SL, Ray JP, de Boer CG, Jenkins RW, Lieb DJ, Chen JH, Frederick DT, Barzily-Rokni M, et al. (2018). Defining T Cell States Associated with Response to Checkpoint Immunotherapy in Melanoma. Cell 175, 998–1013 e1020. 10.1016/j.cell.2018.10.038. [DOI] [PMC free article] [PubMed] [Google Scholar]
- 13.Hellmann MD, Ciuleanu TE, Pluzanski A, Lee JS, Otterson GA, Audigier-Valette C, Minenza E, Linardou H, Burgers S, Salman P, et al. (2018). Nivolumab plus Ipilimumab in Lung Cancer with a High Tumor Mutational Burden. N Engl J Med 378, 2093–2104. 10.1056/NEJMoa1801946. [DOI] [PMC free article] [PubMed] [Google Scholar]
- 14.Muftuoglu Y, and Liau LM (2020). Results From the CheckMate 143 Clinical Trial: Stalemate or New Game Strategy for Glioblastoma Immunotherapy? JAMA Oncol 6, 987–989. 10.1001/jamaoncol.2020.0857. [DOI] [PubMed] [Google Scholar]
- 15.Lim M, Xia Y, Bettegowda C, and Weller M (2018). Current state of immunotherapy for glioblastoma. Nat Rev Clin Oncol 15, 422–442. 10.1038/s41571-018-0003-5. [DOI] [PubMed] [Google Scholar]
- 16.Curry WT, and Lim M (2015). Immunomodulation: checkpoint blockade etc. Neuro Oncol 17 Suppl 7, vii26–vii31. 10.1093/neuonc/nov174. [DOI] [PMC free article] [PubMed] [Google Scholar]
- 17.Huang J, Liu F, Liu Z, Tang H, Wu H, Gong Q, and Chen J (2017). Immune Checkpoint in Glioblastoma: Promising and Challenging. Front Pharmacol 8, 242. 10.3389/fphar.2017.00242. [DOI] [PMC free article] [PubMed] [Google Scholar]
- 18.Jackson CM, Choi J, and Lim M (2019). Mechanisms of immunotherapy resistance: lessons from glioblastoma. Nat Immunol 20, 1100–1109. 10.1038/s41590-019-0433-y. [DOI] [PubMed] [Google Scholar]
- 19.Reardon DA, Brandes AA, Omuro A, Mulholland P, Lim M, Wick A, Baehring J, Ahluwalia MS, Roth P, Bahr O, et al. (2020). Effect of Nivolumab vs Bevacizumab in Patients With Recurrent Glioblastoma: The CheckMate 143 Phase 3 Randomized Clinical Trial. JAMA Oncol 6, 1003–1010. 10.1001/jamaoncol.2020.1024. [DOI] [PMC free article] [PubMed] [Google Scholar]
- 20.Omuro A, Vlahovic G, Lim M, Sahebjam S, Baehring J, Cloughesy T, Voloschin A, Ramkissoon SH, Ligon KL, Latek R, et al. (2018). Nivolumab with or without ipilimumab in patients with recurrent glioblastoma: results from exploratory phase I cohorts of CheckMate 143. Neuro Oncol 20, 674–686. 10.1093/neuonc/nox208. [DOI] [PMC free article] [PubMed] [Google Scholar]
- 21.Bandola-Simon J, and Roche PA (2019). Dysfunction of antigen processing and presentation by dendritic cells in cancer. Mol Immunol 113, 31–37. 10.1016/j.molimm.2018.03.025. [DOI] [PMC free article] [PubMed] [Google Scholar]
- 22.Sabado RL, Balan S, and Bhardwaj N (2017). Dendritic cell-based immunotherapy. Cell Res 27, 74–95. 10.1038/cr.2016.157. [DOI] [PMC free article] [PubMed] [Google Scholar]
- 23.Cohen M, Giladi A, Barboy O, Hamon P, Li B, Zada M, Gurevich-Shapiro A, Beccaria CG, David E, Maier BB, et al. (2022). The interaction of CD4(+) helper T cells with dendritic cells shapes the tumor microenvironment and immune checkpoint blockade response. Nat Cancer. 10.1038/s43018-022-00338-5. [DOI] [PubMed] [Google Scholar]
- 24.Schenkel JM, Herbst RH, Canner D, Li A, Hillman M, Shanahan SL, Gibbons G, Smith OC, Kim JY, Westcott P, et al. (2021). Conventional type I dendritic cells maintain a reservoir of proliferative tumor-antigen specific TCF-1(+) CD8(+) T cells in tumor-draining lymph nodes. Immunity 54, 2338–2353 e2336. 10.1016/j.immuni.2021.08.026. [DOI] [PMC free article] [PubMed] [Google Scholar]
- 25.Srivastava S, Jackson C, Kim T, Choi J, and Lim M (2019). A Characterization of Dendritic Cells and Their Role in Immunotherapy in Glioblastoma: From Preclinical Studies to Clinical Trials. Cancers (Basel) 11. 10.3390/cancers11040537. [DOI] [PMC free article] [PubMed] [Google Scholar]
- 26.Liau LM, Ashkan K, Tran DD, Campian JL, Trusheim JE, Cobbs CS, Heth JA, Salacz M, Taylor S, D’Andre SD, et al. (2018). First results on survival from a large Phase 3 clinical trial of an autologous dendritic cell vaccine in newly diagnosed glioblastoma. J Transl Med 16, 142. 10.1186/s12967-018-1507-6. [DOI] [PMC free article] [PubMed] [Google Scholar]
- 27.Datsi A, and Sorg RV (2021). Dendritic Cell Vaccination of Glioblastoma: Road to Success or Dead End. Front Immunol 12, 770390. 10.3389/fimmu.2021.770390. [DOI] [PMC free article] [PubMed] [Google Scholar]
- 28.Goddery EN, Fain CE, Lipovsky CG, Ayasoufi K, Yokanovich LT, Malo CS, Khadka RH, Tritz ZP, Jin F, Hansen MJ, and Johnson AJ (2021). Microglia and Perivascular Macrophages Act as Antigen Presenting Cells to Promote CD8 T Cell Infiltration of the Brain. Front Immunol 12, 726421. 10.3389/fimmu.2021.726421. [DOI] [PMC free article] [PubMed] [Google Scholar]
- 29.Moseman EA, Blanchard AC, Nayak D, and McGavern DB (2020). T cell engagement of cross-presenting microglia protects the brain from a nasal virus infection. Sci Immunol 5. 10.1126/sciimmunol.abb1817. [DOI] [PMC free article] [PubMed] [Google Scholar]
- 30.Shaked I, Porat Z, Gersner R, Kipnis J, and Schwartz M (2004). Early activation of microglia as antigen-presenting cells correlates with T cell-mediated protection and repair of the injured central nervous system. J Neuroimmunol 146, 84–93. 10.1016/j.jneuroim.2003.10.049. [DOI] [PubMed] [Google Scholar]
- 31.Schetters STT, Gomez-Nicola D, Garcia-Vallejo JJ, and Van Kooyk Y (2017). Neuroinflammation: Microglia and T Cells Get Ready to Tango. Front Immunol 8, 1905. 10.3389/fimmu.2017.01905. [DOI] [PMC free article] [PubMed] [Google Scholar]
- 32.Byram SC, Carson MJ, DeBoy CA, Serpe CJ, Sanders VM, and Jones KJ (2004). CD4-positive T cell-mediated neuroprotection requires dual compartment antigen presentation. J Neurosci 24, 4333–4339. 10.1523/JNEUROSCI.5276-03.2004. [DOI] [PMC free article] [PubMed] [Google Scholar]
- 33.Zhai H, Heppner FL, and Tsirka SE (2011). Microglia/macrophages promote glioma progression. Glia 59, 472–485. 10.1002/glia.21117. [DOI] [PMC free article] [PubMed] [Google Scholar]
- 34.Geribaldi-Doldan N, Fernandez-Ponce C, Quiroz RN, Sanchez-Gomar I, Escorcia LG, Velasquez EP, and Quiroz EN (2020). The Role of Microglia in Glioblastoma. Front Oncol 10, 603495. 10.3389/fonc.2020.603495. [DOI] [PMC free article] [PubMed] [Google Scholar]
- 35.Poon CC, Sarkar S, Yong VW, and Kelly JJP (2017). Glioblastoma-associated microglia and macrophages: targets for therapies to improve prognosis. Brain 140, 1548–1560. 10.1093/brain/aww355. [DOI] [PubMed] [Google Scholar]
- 36.Wei J, Gabrusiewicz K, and Heimberger A (2013). The controversial role of microglia in malignant gliomas. Clin Dev Immunol 2013, 285246. 10.1155/2013/285246. [DOI] [PMC free article] [PubMed] [Google Scholar]
- 37.Frederico SC, Hancock JC, Brettschneider EES, Ratnam NM, Gilbert MR, and Terabe M (2021). Making a Cold Tumor Hot: The Role of Vaccines in the Treatment of Glioblastoma. Front Oncol 11, 672508. 10.3389/fonc.2021.672508. [DOI] [PMC free article] [PubMed] [Google Scholar]
- 38.Oh T, Fakurnejad S, Sayegh ET, Clark AJ, Ivan ME, Sun MZ, Safaee M, Bloch O, James CD, and Parsa AT (2014). Immunocompetent murine models for the study of glioblastoma immunotherapy. J Transl Med 12, 107. 10.1186/1479-5876-12-107. [DOI] [PMC free article] [PubMed] [Google Scholar]
- 39.Marumoto T, Tashiro A, Friedmann-Morvinski D, Scadeng M, Soda Y, Gage FH, and Verma IM (2009). Development of a novel mouse glioma model using lentiviral vectors. Nat Med 15, 110–116. 10.1038/nm.1863. [DOI] [PMC free article] [PubMed] [Google Scholar]
- 40.Khalsa JK, Cheng N, Keegan J, Chaudry A, Driver J, Bi WL, Lederer J, and Shah K (2020). Immune phenotyping of diverse syngeneic murine brain tumors identifies immunologically distinct types. Nat Commun 11, 3912. 10.1038/s41467-020-17704-5. [DOI] [PMC free article] [PubMed] [Google Scholar]
- 41.Friedmann-Morvinski D, Narasimamurthy R, Xia Y, Myskiw C, Soda Y, and Verma IM (2016). Targeting NF-kappaB in glioblastoma: A therapeutic approach. Sci Adv 2, e1501292. 10.1126/sciadv.1501292. [DOI] [PMC free article] [PubMed] [Google Scholar]
- 42.Tritz ZP, Ayasoufi K, and Johnson AJ (2021). Anti-PD-1 checkpoint blockade monotherapy in the orthotopic GL261 glioma model: the devil is in the detail. Neurooncol Adv 3, vdab066. 10.1093/noajnl/vdab066. [DOI] [PMC free article] [PubMed] [Google Scholar]
- 43.Genoud V, Marinari E, Nikolaev SI, Castle JC, Bukur V, Dietrich PY, Okada H, and Walker PR (2018). Responsiveness to anti-PD-1 and anti-CTLA-4 immune checkpoint blockade in SB28 and GL261 mouse glioma models. Oncoimmunology 7, e1501137. 10.1080/2162402X.2018.1501137. [DOI] [PMC free article] [PubMed] [Google Scholar]
- 44.Moran AE, Holzapfel KL, Xing Y, Cunningham NR, Maltzman JS, Punt J, and Hogquist KA (2011). T cell receptor signal strength in Treg and iNKT cell development demonstrated by a novel fluorescent reporter mouse. J Exp Med 208, 1279–1289. 10.1084/jem.20110308. [DOI] [PMC free article] [PubMed] [Google Scholar]
- 45.Wei SC, Levine JH, Cogdill AP, Zhao Y, Anang NAS, Andrews MC, Sharma P, Wang J, Wargo JA, Pe’er D, and Allison JP (2017). Distinct Cellular Mechanisms Underlie Anti-CTLA-4 and Anti-PD-1 Checkpoint Blockade. Cell 170, 1120–1133 e1117. 10.1016/j.cell.2017.07.024. [DOI] [PMC free article] [PubMed] [Google Scholar]
- 46.Mohme M, Maire CL, Geumann U, Schliffke S, Duhrsen L, Fita K, Akyuz N, Binder M, Westphal M, Guenther C, et al. (2020). Local Intracerebral Immunomodulation Using Interleukin-Expressing Mesenchymal Stem Cells in Glioblastoma. Clin Cancer Res 26, 2626–2639. 10.1158/1078-0432.CCR-19-0803. [DOI] [PubMed] [Google Scholar]
- 47.Ceccarelli M, Barthel FP, Malta TM, Sabedot TS, Salama SR, Murray BA, Morozova O, Newton Y, Radenbaugh A, Pagnotta SM, et al. (2016). Molecular Profiling Reveals Biologically Discrete Subsets and Pathways of Progression in Diffuse Glioma. Cell 164, 550–563. 10.1016/j.cell.2015.12.028. [DOI] [PMC free article] [PubMed] [Google Scholar]
- 48.Brennan CW, Verhaak RG, McKenna A, Campos B, Noushmehr H, Salama SR, Zheng S, Chakravarty D, Sanborn JZ, Berman SH, et al. (2013). The somatic genomic landscape of glioblastoma. Cell 155, 462–477. 10.1016/j.cell.2013.09.034. [DOI] [PMC free article] [PubMed] [Google Scholar]
- 49.Woolf Z, Swanson MEV, Smyth LC, Mee EW, Schweder P, Heppner P, Kim BJH, Turner C, Oldfield RL, Curtis MA, et al. (2021). Single-cell image analysis reveals a protective role for microglia in glioblastoma. Neurooncol Adv 3, vdab031. 10.1093/noajnl/vdab031. [DOI] [PMC free article] [PubMed] [Google Scholar]
- 50.Sarkar S, Doring A, Zemp FJ, Silva C, Lun X, Wang X, Kelly J, Hader W, Hamilton M, Mercier P, et al. (2014). Therapeutic activation of macrophages and microglia to suppress brain tumor-initiating cells. Nat Neurosci 17, 46–55. 10.1038/nn.3597. [DOI] [PubMed] [Google Scholar]
- 51.Sarkar S, Li Y, Mirzaei R, Rawji KS, Poon CC, Wang J, Kumar M, Bose P, and Yong VW (2020). Demeclocycline Reduces the Growth of Human Brain Tumor-Initiating Cells: Direct Activity and Through Monocytes. Front Immunol 11, 272. 10.3389/fimmu.2020.00272. [DOI] [PMC free article] [PubMed] [Google Scholar]
- 52.Chicoine MR, Zahner M, Won EK, Kalra RR, Kitamura T, Perry A, and Higashikubo R (2007). The in vivo antitumoral effects of lipopolysaccharide against glioblastoma multiforme are mediated in part by Toll-like receptor 4. Neurosurgery 60, 372–380; discussion 381. 10.1227/01.NEU.0000249280.61761.2E. [DOI] [PubMed] [Google Scholar]
- 53.Hwang SY, Yoo BC, Jung JW, Oh ES, Hwang JS, Shin JA, Kim SY, Cha SH, and Han IO (2009). Induction of glioma apoptosis by microglia-secreted molecules: The role of nitric oxide and cathepsin B. Biochim Biophys Acta 1793, 1656–1668. 10.1016/j.bbamcr.2009.08.011. [DOI] [PubMed] [Google Scholar]
- 54.Abdelfattah N, Kumar P, Wang C, Leu JS, Flynn WF, Gao R, Baskin DS, Pichumani K, Ijare OB, Wood SL, et al. (2022). Single-cell analysis of human glioma and immune cells identifies S100A4 as an immunotherapy target. Nat Commun 13, 767. 10.1038/s41467-022-28372-y. [DOI] [PMC free article] [PubMed] [Google Scholar]
- 55.Kaiser T, and Feng G (2019). Tmem119-EGFP and Tmem119-CreERT2 Transgenic Mice for Labeling and Manipulating Microglia. eNeuro 6. 10.1523/ENEURO.0448-18.2019. [DOI] [PMC free article] [PubMed] [Google Scholar]
- 56.Zhou Y, Zhou B, Pache L, Chang M, Khodabakhshi AH, Tanaseichuk O, Benner C, and Chanda SK (2019). Metascape provides a biologist-oriented resource for the analysis of systems-level datasets. Nat Commun 10, 1523. 10.1038/s41467-019-09234-6. [DOI] [PMC free article] [PubMed] [Google Scholar]
- 57.Bonnardel J, T’Jonck W, Gaublomme D, Browaeys R, Scott CL, Martens L, Vanneste B, De Prijck S, Nedospasov SA, Kremer A, et al. (2019). Stellate Cells, Hepatocytes, and Endothelial Cells Imprint the Kupffer Cell Identity on Monocytes Colonizing the Liver Macrophage Niche. Immunity 51, 638–654 e639. 10.1016/j.immuni.2019.08.017. [DOI] [PMC free article] [PubMed] [Google Scholar]
- 58.Browaeys R, Saelens W, and Saeys Y (2020). NicheNet: modeling intercellular communication by linking ligands to target genes. Nat Methods 17, 159–162. 10.1038/s41592-019-0667-5. [DOI] [PubMed] [Google Scholar]
- 59.Huang Y, Happonen KE, Burrola PG, O’Connor C, Hah N, Huang L, Nimmerjahn A, and Lemke G (2021). Microglia use TAM receptors to detect and engulf amyloid beta plaques. Nat Immunol 22, 586–594. 10.1038/s41590-021-00913-5. [DOI] [PMC free article] [PubMed] [Google Scholar]
- 60.Seitz HM, Camenisch TD, Lemke G, Earp HS, and Matsushima GK (2007). Macrophages and dendritic cells use different Axl/Mertk/Tyro3 receptors in clearance of apoptotic cells. J Immunol 178, 5635–5642. 10.4049/jimmunol.178.9.5635. [DOI] [PubMed] [Google Scholar]
- 61.Grossman SA, Ye X, Lesser G, Sloan A, Carraway H, Desideri S, Piantadosi S, and Consortium NC (2011). Immunosuppression in patients with high-grade gliomas treated with radiation and temozolomide. Clin Cancer Res 17, 5473–5480. 10.1158/1078-0432.CCR-11-0774. [DOI] [PMC free article] [PubMed] [Google Scholar]
- 62.Fecci PE, Mitchell DA, Whitesides JF, Xie W, Friedman AH, Archer GE, Herndon JE 2nd, Bigner DD, Dranoff G, and Sampson JH (2006). Increased regulatory T-cell fraction amidst a diminished CD4 compartment explains cellular immune defects in patients with malignant glioma. Cancer Res 66, 3294–3302. 10.1158/0008-5472.CAN-05-3773. [DOI] [PubMed] [Google Scholar]
- 63.Wang D, Aguilar B, Starr R, Alizadeh D, Brito A, Sarkissian A, Ostberg JR, Forman SJ, and Brown CE (2018). Glioblastoma-targeted CD4+ CAR T cells mediate superior antitumor activity. JCI Insight 3. 10.1172/jci.insight.99048. [DOI] [PMC free article] [PubMed] [Google Scholar]
- 64.Platten M, Bunse L, Wick A, Bunse T, Le Cornet L, Harting I, Sahm F, Sanghvi K, Tan CL, Poschke I, et al. (2021). A vaccine targeting mutant IDH1 in newly diagnosed glioma. Nature 592, 463–468. 10.1038/s41586-021-03363-z. [DOI] [PMC free article] [PubMed] [Google Scholar]
- 65.Wilson EH, Weninger W, and Hunter CA (2010). Trafficking of immune cells in the central nervous system. J Clin Invest 120, 1368–1379. 10.1172/JCI41911. [DOI] [PMC free article] [PubMed] [Google Scholar]
- 66.Arrieta VA, Chen AX, Kane JR, Kang SJ, Kassab C, Dmello C, Zhao J, Burdett KB, Upadhyayula PS, Lee-Chang C, et al. (2021). ERK1/2 phosphorylation predicts survival following anti-PD-1 immunotherapy in recurrent glioblastoma. Nat Cancer 2, 1372–1386. 10.1038/s43018-021-00260-2. [DOI] [PMC free article] [PubMed] [Google Scholar]
- 67.Wang W, Wang EQ, and Balthasar JP (2008). Monoclonal antibody pharmacokinetics and pharmacodynamics. Clin Pharmacol Ther 84, 548–558. 10.1038/clpt.2008.170. [DOI] [PubMed] [Google Scholar]
- 68.Gampa G, Vaidhyanathan S, Sarkaria JN, and Elmquist WF (2017). Drug delivery to melanoma brain metastases: Can current challenges lead to new opportunities? Pharmacol Res 123, 10–25. 10.1016/j.phrs.2017.06.008. [DOI] [PMC free article] [PubMed] [Google Scholar]
- 69.Tawbi HA, Forsyth PA, Algazi A, Hamid O, Hodi FS, Moschos SJ, Khushalani NI, Lewis K, Lao CD, Postow MA, et al. (2018). Combined Nivolumab and Ipilimumab in Melanoma Metastatic to the Brain. N Engl J Med 379, 722–730. 10.1056/NEJMoa1805453. [DOI] [PMC free article] [PubMed] [Google Scholar]
- 70.van Bussel MTJ, Beijnen JH, and Brandsma D (2019). Intracranial antitumor responses of nivolumab and ipilimumab: a pharmacodynamic and pharmacokinetic perspective, a scoping systematic review. BMC Cancer 19, 519. 10.1186/s12885-019-5741-y. [DOI] [PMC free article] [PubMed] [Google Scholar]
- 71.Long GV, Atkinson V, Lo S, Sandhu S, Guminski AD, Brown MP, Wilmott JS, Edwards J, Gonzalez M, Scolyer RA, et al. (2018). Combination nivolumab and ipilimumab or nivolumab alone in melanoma brain metastases: a multicentre randomised phase 2 study. Lancet Oncol 19, 672–681. 10.1016/S1470-2045(18)30139-6. [DOI] [PubMed] [Google Scholar]
- 72.Walker EJ, Su H, Shen F, Degos V, Amend G, Jun K, and Young WL (2012). Bevacizumab attenuates VEGF-induced angiogenesis and vascular malformations in the adult mouse brain. Stroke 43, 1925–1930. 10.1161/STROKEAHA.111.647982. [DOI] [PMC free article] [PubMed] [Google Scholar]
- 73.Cloughesy TF, Mochizuki AY, Orpilla JR, Hugo W, Lee AH, Davidson TB, Wang AC, Ellingson BM, Rytlewski JA, Sanders CM, et al. (2019). Neoadjuvant anti-PD-1 immunotherapy promotes a survival benefit with intratumoral and systemic immune responses in recurrent glioblastoma. Nat Med 25, 477–486. 10.1038/s41591-018-0337-7. [DOI] [PMC free article] [PubMed] [Google Scholar]
- 74.Martinez-Lage M, Lynch TM, Bi Y, Cocito C, Way GP, Pal S, Haller J, Yan RE, Ziober A, Nguyen A, et al. (2019). Immune landscapes associated with different glioblastoma molecular subtypes. Acta Neuropathol Commun 7, 203. 10.1186/s40478-019-0803-6. [DOI] [PMC free article] [PubMed] [Google Scholar]
- 75.Butowski N, Colman H, De Groot JF, Omuro AM, Nayak L, Wen PY, Cloughesy TF, Marimuthu A, Haidar S, Perry A, et al. (2016). Orally administered colony stimulating factor 1 receptor inhibitor PLX3397 in recurrent glioblastoma: an Ivy Foundation Early Phase Clinical Trials Consortium phase II study. Neuro Oncol 18, 557–564. 10.1093/neuonc/nov245. [DOI] [PMC free article] [PubMed] [Google Scholar]
- 76.Rao R, Han R, Ogurek S, Xue C, Wu LM, Zhang L, Zhang L, Hu J, Phoenix TN, Waggoner SN, and Lu QR (2022). Glioblastoma genetic drivers dictate the function of tumor-associated macrophages/microglia and responses to CSF1R inhibition. Neuro Oncol 24, 584–597. 10.1093/neuonc/noab228. [DOI] [PMC free article] [PubMed] [Google Scholar]
- 77.Quail DF, Bowman RL, Akkari L, Quick ML, Schuhmacher AJ, Huse JT, Holland EC, Sutton JC, and Joyce JA (2016). The tumor microenvironment underlies acquired resistance to CSF-1R inhibition in gliomas. Science 352, aad3018. 10.1126/science.aad3018. [DOI] [PMC free article] [PubMed] [Google Scholar]
- 78.Pyonteck SM, Akkari L, Schuhmacher AJ, Bowman RL, Sevenich L, Quail DF, Olson OC, Quick ML, Huse JT, Teijeiro V, et al. (2013). CSF-1R inhibition alters macrophage polarization and blocks glioma progression. Nat Med 19, 1264–1272. 10.1038/nm.3337. [DOI] [PMC free article] [PubMed] [Google Scholar]
- 79.Yan D, Kowal J, Akkari L, Schuhmacher AJ, Huse JT, West BL, and Joyce JA (2017). Inhibition of colony stimulating factor-1 receptor abrogates microenvironment-mediated therapeutic resistance in gliomas. Oncogene 36, 6049–6058. 10.1038/onc.2017.261. [DOI] [PMC free article] [PubMed] [Google Scholar]
- 80.Herting CJ, Chen Z, Pitter KL, Szulzewsky F, Kaffes I, Kaluzova M, Park JC, Cimino PJ, Brennan C, Wang B, and Hambardzumyan D (2017). Genetic driver mutations define the expression signature and microenvironmental composition of high-grade gliomas. Glia 65, 1914–1926. 10.1002/glia.23203. [DOI] [PMC free article] [PubMed] [Google Scholar]
- 81.Hambardzumyan D, Amankulor NM, Helmy KY, Becher OJ, and Holland EC (2009). Modeling Adult Gliomas Using RCAS/t-va Technology. Transl Oncol 2, 89–95. 10.1593/tlo.09100. [DOI] [PMC free article] [PubMed] [Google Scholar]
- 82.Holland EC, Hively WP, DePinho RA, and Varmus HE (1998). A constitutively active epidermal growth factor receptor cooperates with disruption of G1 cell-cycle arrest pathways to induce glioma-like lesions in mice. Genes Dev 12, 3675–3685. 10.1101/gad.12.23.3675. [DOI] [PMC free article] [PubMed] [Google Scholar]
- 83.Schmid RS, Simon JM, Vitucci M, McNeill RS, Bash RE, Werneke AM, Huey L, White KK, Ewend MG, Wu J, and Miller CR (2016). Core pathway mutations induce de-differentiation of murine astrocytes into glioblastoma stem cells that are sensitive to radiation but resistant to temozolomide. Neuro Oncol 18, 962–973. 10.1093/neuonc/nov321. [DOI] [PMC free article] [PubMed] [Google Scholar]
- 84.Pasciuto E, Burton OT, Roca CP, Lagou V, Rajan WD, Theys T, Mancuso R, Tito RY, Kouser L, Callaerts-Vegh Z, et al. (2020). Microglia Require CD4 T Cells to Complete the Fetal-to-Adult Transition. Cell 182, 625–640 e624. 10.1016/j.cell.2020.06.026. [DOI] [PMC free article] [PubMed] [Google Scholar]
- 85.Locatelli G, and Engelhardt B (2020). Microglia Get a Little Help from “Th”-eir Friends. Immunity 53, 484–486. 10.1016/j.immuni.2020.08.011. [DOI] [PubMed] [Google Scholar]
- 86.Low JS, Farsakoglu Y, Amezcua Vesely MC, Sefik E, Kelly JB, Harman CCD, Jackson R, Shyer JA, Jiang X, Cauley LS, et al. (2020). Tissue-resident memory T cell reactivation by diverse antigen-presenting cells imparts distinct functional responses. J Exp Med 217. 10.1084/jem.20192291. [DOI] [PMC free article] [PubMed] [Google Scholar]
- 87.Asano K, Nabeyama A, Miyake Y, Qiu CH, Kurita A, Tomura M, Kanagawa O, Fujii S, and Tanaka M (2011). CD169-positive macrophages dominate antitumor immunity by crosspresenting dead cell-associated antigens. Immunity 34, 85–95. 10.1016/j.immuni.2010.12.011. [DOI] [PubMed] [Google Scholar]
- 88.Fourgeaud L, Traves PG, Tufail Y, Leal-Bailey H, Lew ED, Burrola PG, Callaway P, Zagorska A, Rothlin CV, Nimmerjahn A, and Lemke G (2016). TAM receptors regulate multiple features of microglial physiology. Nature 532, 240–244. 10.1038/nature17630. [DOI] [PMC free article] [PubMed] [Google Scholar]
- 89.Stuart T, Butler A, Hoffman P, Hafemeister C, Papalexi E, Mauck WM 3rd, Hao Y, Stoeckius M, Smibert P, and Satija R (2019). Comprehensive Integration of Single-Cell Data. Cell 177, 1888–1902 e1821. 10.1016/j.cell.2019.05.031. [DOI] [PMC free article] [PubMed] [Google Scholar]
- 90.Aran D, Looney AP, Liu L, Wu E, Fong V, Hsu A, Chak S, Naikawadi RP, Wolters PJ, Abate AR, et al. (2019). Reference-based analysis of lung single-cell sequencing reveals a transitional profibrotic macrophage. Nat Immunol 20, 163–172. 10.1038/s41590-018-0276-y. [DOI] [PMC free article] [PubMed] [Google Scholar]
- 91.Borcherding N, Bormann NL, and Kraus G (2020). scRepertoire: An R-based toolkit for single-cell immune receptor analysis. F1000Res 9, 47. 10.12688/f1000research.22139.2. [DOI] [PMC free article] [PubMed] [Google Scholar]
- 92.Love MI, Huber W, and Anders S (2014). Moderated estimation of fold change and dispersion for RNA-seq data with DESeq2. Genome Biol 15, 550. 10.1186/s13059-014-0550-8. [DOI] [PMC free article] [PubMed] [Google Scholar]
- 93.Korotkevich G, Sukhov V, Budin N, Shpak B, Artyomov MN, and Sergushichev A (2021). Fast gene set enrichment analysis. BioRxiv, 060012. [Google Scholar]
- 94.Ritchie ME, Phipson B, Wu D, Hu Y, Law CW, Shi W, and Smyth GK (2015). limma powers differential expression analyses for RNA-sequencing and microarray studies. Nucleic acids research 43, e47. 10.1093/nar/gkv007. [DOI] [PMC free article] [PubMed] [Google Scholar]
- 95.SE M (2021). scCustomize: Custom Visualizations & Functions for Streamlined Analyses of Single Cell Sequencing. 10.5281/zenodo.5706430. [DOI] [Google Scholar]
- 96.Patil I (2021). Visualizations with statistical details: The ‘ggstatsplot’ approach. The Journal of Open Source Software. 10.21105/joss.03167. [DOI] [Google Scholar]
- 97.Shihan MH, Novo SG, Le Marchand SJ, Wang Y, and Duncan MK (2021). A simple method for quantitating confocal fluorescent images. Biochem Biophys Rep 25, 100916. 10.1016/j.bbrep.2021.100916. [DOI] [PMC free article] [PubMed] [Google Scholar]
Associated Data
This section collects any data citations, data availability statements, or supplementary materials included in this article.
Supplementary Materials
Data Availability Statement
All sequencing data from this paper are available in the GEO database under accession GSE233869.