

Abstract
Aims
Women with previous gestational diabetes mellitus (GDM) have an increased risk for later development of type 2 diabetes. During pregnancy, GDM affects the cardio‐metabolic protein profile; however, it is unknown how GDM affects the cardio‐metabolic protein profile in the long term and if it is associated with type 2 diabetes after GDM. We hypothesise that the cardio‐metabolic protein profile is affected long term and is associated with the development of type 2 diabetes after GDM.
Materials and Methods
A case–control follow‐up study based on the Odense GDM Follow‐Up Study (OGFUS) cohort, which included women with previous GDM (n = 128) and matched controls without previous GDM (n = 70). Blood samples from a follow‐up assessment 8–10 years after delivery were analysed using a 29‐plex panel of apolipoproteins, transport and inflammation/immune proteins using multiple‐reaction‐monitoring mass spectrometry.
Results
Apolipoprotein A‐I, D and M were significantly lower in women with previous GDM compared to controls (all p < 0.001), while apolipoprotein L‐I, H, vitamin D binding protein, CRP, vitronectin, transthyretin and complement factors 3 and B were significantly higher (p = 0.008, p < 0.001, p < 0.001, p < 0.001, p < 0.001, p = 0.005, respectively). All associations remained significant after adjustment for multiple testing except CRP, whereas apolipoprotein D, vitronectin and complement factors 3 and B were associated with the development of type 2 diabetes in women with previous GDM (p = 0.02, p = 0.001, p < 0.001, p = 0.004, respectively).
Conclusions
The cardio‐metabolic protein profile 8–10 years after pregnancy is altered in women with previous GDM. Apolipoprotein D, vitronectin and complement factors 3 and B are candidate risk markers of type 2 diabetes after GDM pregnancy.
Keywords: cohort study, dyslipidaemia, gestational diabetes, insulin resistance, type 2 diabetes
1. INTRODUCTION
Gestational diabetes mellitus (GDM) is defined as glucose intolerance with first onset or recognition during pregnancy. 1 GDM increases the risk of neonatal and obstetric complications, that is macrosomia, preeclampsia and preterm birth and maternal adverse cardiometabolic outcomes later in life. 2 A recent meta‐analysis found a 10‐fold higher risk of development of type 2 diabetes (T2D) for women with previous GDM. 3 Various preventive interventions focusing on lifestyle changes and weight loss have been shown to be effective in preventing or delaying the development of T2D after GDM. 4 , 5 , 6 As the prevalence of GDM is rising worldwide and these interventions are costly, 7 previous studies have focused on the identification of women with previous GDM with a high risk of developing T2D post‐partum. 8 , 9 , 10 , 11 Some studies have found that the severity of GDM, based on the need for insulin treatment, was associated with a higher risk of T2D. 6 , 12 However, there is currently no precise method for risk stratification regarding the risk of developing T2D after GDM. 13
Both GDM and T2D are characterized by dyslipidemia and an inflammatory response involving oxidative stress, 2 therefore cardio‐metabolic proteins (apolipo‐, transport‐, inflammation‐ and innate immune proteins) involved in lipid metabolism and the inflammatory response have been studied in relation to GDM and T2D. 14 , 15 Complement‐related proteins were found to be elevated in the second trimester in GDM pregnancies, but these proteins were not independently associated with GDM. 16 Lower serum levels of apolipoprotein D (ApoD) and higher levels of vitronectin (VN) were identified as possible early biomarkers in pregnancy for the prediction of GDM. 17 , 18 , 19 Additionally, serum apolipoprotein E (ApoE) was lower in GDM compared to women without GDM, whereas placental ApoE negatively correlated with oxidative stress in GDM women. 20 In a postpartum study, apolipoprotein ratios predicted the development of T2D in women with previous GDM. 21
Because of the shared pathophysiology of GDM and T2D, it is possible that risk markers may be common for the two conditions and could be of clinical value. Such biomarkers may have the potential to predict future development of T2D and thus help to identify high‐risk women.
Therefore, we hypothesised that the long‐term impact on the cardio‐metabolic protein profile after GDM is associated with the progression to T2D. To test this, we evaluated the cardio‐metabolic protein profile in the Odense GDM Follow‐Up Study (OGFUS) cohort with a mean follow‐up time of 8 to 10 years.
2. MATERIALS AND METHODS
2.1. Study population
This case–control follow‐up study consists of data from the OGFUS cohort. 22 In this study population, women with previous GDM (pGDM) were included from 1997 to 2010 and were invited for a follow‐up assessment between 2011 and 2014. A control group of women without previous GDM (non‐GDM) was matched to the pGDM group and invited for a similar follow‐up assessment as the pGDM group. A 2‐h 75 g Oral Glucose Tolerance Test (OGTT) was performed at the follow‐up assessment and both fasting and OGTT indices of insulin sensitivity and beta‐cell function were calculated as described previously in Jacobsen et al 22 An overview of the inclusion is presented in Figure S1. In total, 128 women with pGDM were matched to 70 non‐GDM women on age (±3 years), pre‐pregnancy BMI (±1), and parity (similar), and all lived in the same geographical area. For 20 cases, no matches on age were found, and were instead matched at age ±7 years, the mean follow‐up period was 7.8 years for women with pGDM and 10.0 for the non‐GDM. 22
Inclusion criteria for the pGDM group were index pregnancy between 1995 and 2010 and participation in a postpartum assessment. Additionally, they had to participate in the follow‐up assessment from 2011 to 2014, where blood samples were collected to analyse the protein profile. Exclusion criteria were: current pregnancy, non‐Danish speaking, severe mental illness, gastric bypass, type 1 diabetes, or MODY. GDM was diagnosed during the index pregnancy based on Danish diagnostic criteria by a 2‐h 75 g OGTT with plasma glucose ≥9 mmol/L at 2 h. 23 At follow‐up, T2D diagnosis was based on the WHO criteria published in 2006 and the addendum concerning HbA1c published in 2011. 22 A biobank of blood samples from the OGFUS study was stored at minus 80°C.
The OGFUS study was approved by the regional ethics committee (M‐20110239) and reported to the Danish Data Protection Agency.
2.2. Targeted proteomics analysis of cardio‐metabolic protein profile
This study used multiple‐reaction‐monitoring mass spectrometry (MRM‐MS) to measure a pre‐specified 29‐plex panel of cardio‐metabolic proteins. The assay includes 15 apolipoproteins; Apo(a) [Lp(a)KIV‐2, Lp(a)PeptidaseS1], A‐I, A‐II, A‐IV, B‐100, C‐I, C‐II, C‐III, D, E, H, J, L‐I and M; nine transport and inflammation proteins; corticosteroid‐binding globulin (CBG), vitamin D‐binding protein (VDP), VN, transthyretin (TTR), serotransferrin (transferrin [TFE]), zinc‐alpha‐2‐glycoprotein (AZGP1), ceruloplasmin (CERU), C‐reactive protein (CRP) and retinol‐binding protein 4 (RBP‐4); five innate immunity proteins; and complement factor B (Bb total), C3, C4b, C9 and H. The cardio‐metabolic protein panel includes proteins that were previously assessed as risk markers of GDM, T2D or cardiovascular disease 17 , 18 and an expanded functional description is provided in Table S1.
Sample preparation for MRM‐MS analysis was performed equally for the groups, according to Steffensen et al., 24 with the following modifications: Serum samples (10 μL) were prediluted in 190 μL 50 mM ammonium bicarbonate (ABC), and 7.5 μL was transferred to a 96‐well plate. A premix of trifluoroethanol/dithiothreitol/beta‐galactosidase (22.5 μL) was added to the plate (50% trifluoroethanol, 7 mM dithiothreitol and 1.25 μg Escherichia coli beta‐galactosidase, as digestion control) and the mix was incubated for 1 h at 65°C. Samples were alkylated in 25 mM iodoacetamide for 30 min at room temperature in the dark and then diluted by 150 μL trypsin premix (25 mM ABC, 1.25 μg trypsin) and digested for 21 h at 37°C. Digestion was terminated in 1% formic acid. For each sample, 5 μL digest was mixed with 10 μL buffer A (0.1% formic acid, FA) and 5 μL balanced mix of 54 heavy peptides (0.1% FA, 15% acetonitrile).
All assay peptides are listed in Table S2. The mix corresponding to 0.5 μg protein was loaded onto an Evotip according to the manufacturer's instructions. The samples were analysed using an integrated microflow Evosep One HPLC/TSQ Altis triple quadrupole mass spectrometry system equipped with an EASY‐Spray ion source (Evosep Biosystems and Thermo Fisher Scientific). The Evosep One was mounted with an 8‐cm analytical column, and samples were analysed in scheduled selected reaction monitoring (SRM) mode using a 60‐sample per‐day liquid chromatography (LC) method using solvent buffer A and solvent buffer B (100% acetonitrile, 0.1% FA). Serum pool quality controls (QCs) were prepared (×5) and distributed evenly across each 96‐well plate. The mean inter‐assay CV was 7.7% (range: 1.6–19.6).
2.3. Data analysis and statistics
All MRM‐MS raw files were processed in Skyline 25 and further processed in RStudio (RStudio Team [2020]) and all statistical calculations were performed in STATA version 16.0 (StataCorp). Each raw peptide light/heavy (L/H) ratio was normalized to the mean L/H ratio of three albumin peptides. Finally, normalized L/H ratios of multiple peptides from the same protein were averaged to obtain a single protein value. Fold change was calculated by dividing the protein level of the case group (pGDM) by the protein level of the reference group (non‐GDM).
All MRM‐MS data were log2 transformed. 26 For parametric distributed data, two‐group comparisons were performed using an unpaired t‐test, and multiple group comparisons were performed by one‐way ANOVA analysis with post hoc testing whereas Mann–Whitney U‐tests were used for non‐parametric distributed data. Benjamini–Hochberg correction (false discovery rate) was used to correct for multiple testing. Bivariate associations were established by pairwise Spearman correlation analyses of continuous variables and Pearsons's correlation. Multivariate analyses of binary outcomes were performed using logistic regression and adjusted for age at follow‐up and for HDL‐cholesterol (for HDL‐associated apolipoproteins). A significance level of p < 0.05 was applied for all statistical tests.
3. RESULTS
3.1. Group characteristics
Characteristics of the pGDM and non‐GDM groups are presented in Table 1. For additional group characteristics, see Jacobsen et al. 22 The pGDM and non‐GDM groups were well matched on pre‐pregnancy BMI and parity. At follow‐up, the pGDM group had a higher BMI than the non‐GDM group albeit the difference was not statistically significant. Both at gestation and at follow‐up, the non‐GDM women were slightly older than the pGDM women. To account for this difference, multivariate models were adjusted for age at follow‐up. The pGDM women were more insulin resistant and displayed an altered lipid profile with higher plasma triglycerides and lower HDL‐cholesterol (Table 1).
TABLE 1.
Characteristics and comparisons between women with previous GDM (pGDM) and women without GDM (non‐GDM).
| pGDM (n = 128) | Non‐GDM (n = 70) | p‐value | |||
|---|---|---|---|---|---|
| Valid n | Median (IQR) or n (%) | Valid n | Median (IQR) or n (%) | ||
| Follow‐up time (years) | 128 | 7.8 (6.3–10.9) | 63 | 10.0 (7.8–12.1) | 0.004 |
| Caucasian ethnicity | 127 | 115 (89.8 | 70 | 70 (100) | 0.005 |
| Family history of type 2 diabetes | 127 | 42 (32.8) | 68 | 12 (17.1) | 0.019 |
| Age at delivery at index pregnancy (years) a | 128 | 33.4 (4.4) | 63 | 35.3 (4.1) | 0.003 b |
| Age at follow‐up (years) a | 128 | 42.0 (4.9) | 70 | 45.3 (4.6) | <0.001 b |
| Pre‐pregnancy BMI (kg/m2) | 123 | 28.2 (24.1–33.1) | 59 | 27.2 (24.2–30.2) | 0.28 |
| BMI at follow‐up (kg/m2) | 128 | 29.4 (25.5–33.8) | 70 | 27.7 (25–31.9) | 0.18 |
| Weight (kg) | 128 | 78.7 (68.1–92.3) | 70 | 80.1 (68–91) | 0.83 |
| Height (cm) a | 128 | 164.3 (6.9) | 70 | 167.9 (6.3) | <0.001 b |
| Plasma‐total cholesterol a | 126 | 4.9 (0.9) | 69 | 4.9 (0.8) | 0.90 b |
| LDL‐cholesterol (mmol/L) a | 126 | 3.0 (0.8) | 69 | 3.0 (0.7) | 0.82 b |
| HDL‐cholesterol (mmol/L) | 127 | 1.3 (1.1–1.5) | 69 | 1.4 (1.3–1.7) | <0.001 |
| Triglycerides (mmol/L) | 127 | 1.2 (0.84–1.6) | 69 | 0.94 (0.72–1.16) | <0.001 |
| HbA1c (mmol/mol) | 127 | 38 (34–42) | 69 | 34 (32–36) | <0.001 |
| HbA1c (%) | 127 | 5.6 (5.3–6.0) | 69 | 5.3 (5.1–5.4) | <0.001 |
| HOMA‐IR | 128 | 3.23 (1.81–5.26) | 69 | 1.95 (1,28–2.8) | <0.001 |
| BIGTT‐SI | 116 | 3.4 (1.24–7.2) | 70 | 6.72 (3.69–9.82) | <0.001 |
| HOMA‐beta | 128 | 107.5 (74–155) | 70 | 87.4 (64.3–121.9) | <0.001 |
| BIGTT‐AIR | 116 | 2281 (1556–3158) | 70 | 2375 (1768–3207) | 0.53 |
Abbreviations: BIGTT‐AIR, BIGTT acute insulin response; BIGTT‐SI, BIGTT sensitivity index; BMI, body mass index; HbA1c, glycated haemoglobin; HDL, high‐density lipoprotein; HOMA‐beta, homeostatic model assessment of beta cell function; HOMA‐IR, homeostatic model assessment of insulin resistance; LDL, low‐density lipoprotein.
Presented as mean (SD).
Differences were tested with t‐test instead of Mann–Whitney U test.
3.2. Comparison of the cardio‐metabolic protein profile between pGDM and non‐GDM women
Univariate analyses were performed to identify differences in the cardio‐metabolic protein profile, presented in Table 2. ApoA‐I, ApoD and ApoM were significantly lower in the pGDM group than in the non‐GDM group (all p < 0.001). In contrast, in comparison to the non‐GDM group, the pGDM group had higher ApoH (p = 0.008), L‐I (p < 0.001), VDP (p < 0.001), VN (p < 0.001), TTR (p < 0.001), C3 (p < 0.001) and CFB (p = 0.005). CRP was significantly increased in the pGDM group; however, after adjustment for multiple testing, this difference was no longer significant. All protein differences were significant in a logistic regression after adjustment for age and HDL at follow‐up except for ApoA‐I (Table S3).
TABLE 2.
Cardio‐metabolic protein profiles of women with previous GDM (pGDM) compared to women without previous GDM (non‐GDM).
| Protein | pGDM (n = 128) mean (SD) | Non‐GDM (n = 70) mean (SD) | Fold change | p‐value |
|---|---|---|---|---|
| Apolipoproteins | ||||
| Lp(a) KIV‐2 | −0.92 (1.74) | −0.72 (1.60) | 0.94 | 0.43 |
| Lp(a) Peptidase S1 | −0.70 (1.89) | −0.49 (1.76) | 0.96 | 0.43 |
| ApoA‐I | 0.15 (0.28) | 0.29 (0.24) | 0.91 | <0.001 a |
| ApoA‐II | 0.33 (0.33) | 0.30 (0.30) | 1.02 | 0.53 |
| ApoA‐IV | −0.57 (0.40) | −0.48 (0.35) | 0.95 | 0.14 |
| ApoB‐100 | −0.21 (0.38) | −0.23 (0.38) | 1.02 | 0.74 |
| ApoC‐I | 0.92 (0.24) | 0.97 (0.22) | 0.95 | 0.12 |
| ApoC‐II | −0.96 (0.56) | −1.11 (0.46) | 1.12 | 0.06 |
| ApoC‐III | −0.61 (0.54) | −0.69 (0.42) | 1.08 | 0.27 |
| ApoD | −0.88 (0.37) | −0.55 (0.28) | 0.81 | <0.001 a |
| ApoE | −0.75 (0.46) | −0.87 (0.33) | 1.13 | 0.067 |
| ApoH | 0.08 (0.43) | −0.10 (0.49) | 1.13 | 0.008 a |
| ApoJ | 0.51 (0.28) | 0.46 (0.23) | 1.04 | 0.179 |
| ApoL‐I | −0.23 (0.4) | −0.43 (0.38) | 1.16 | <0.001 a |
| ApoM | 1.07 (0.24) | 1.21 (0.21) | 0.91 | <0.001 a |
| Transport proteins | ||||
| CBG | 0.24 (0.22–0.27) | 0.24 (0.22–0.28) | 1.04 | 0.67b |
| VDP | 0.48 (0.44–0.52) | 0.44 (0.41–0.50) | 1.09 | <0.001 a , b |
| VN | 0.04 (0.35) | −0.19 (0.36) | 1.18 | <0.001 a |
| AZGP1 | −4.24 (0.23) | −4.21 (0.23) | 0.98 | 0.33 |
| TTR | −0.41 (0.26) | −0.55 (0.28) | 1.10 | <0.001 a |
| TFE | 0.03 (0.3) | 0.01 (0.25) | 1.02 | 0.68 |
| RBP‐4 | −2.82 (0.32) | −2.83 (0.33) | 1.00 | 0.90 |
| Complement and inflammation markers | ||||
| CRP | −2.13 (1.69) | −2.65 (1.48) | 1.68 | 0.033 |
| CERU | 0.30 (0.26–0.35) | 0.32 (0.29–0.38) | 0.97 | 0.071b |
| C3 | 0.50 (0.34) | 0.3 (0.31) | 1.15 | <0.001 a |
| C4b | 0.12 (0.46) | 0.1 (0.48) | 1.01 | 0.72 |
| C9 | −1.54 (0.4) | −1.53 (0.32) | 1.01 | 0.85 |
| CFB | −0.29 (0.38) | −0.45 (0.33) | 1.12 | 0.005 a |
| CFH | −0.36 (0.32) | −0.42 (0.30) | 1.05 | 0.18 |
Note: Significant p < 0.05; fold change: calculated by protein‐albumin ratio instead of log2 transformed protein ratios.
Abbreviations: Apo, apolipoprotein; AZGP1, zinc‐alpha‐2‐glycoprotein; C3, complement factor 3; C4b, complement factor 4b; C9, complement factor 9; CBG, corticosteroid‐binding globulin; CERU, ceruloplasmin; CFB, complement factor B; CFH, complement factor H; CRP, c‐reactive protein; Lp(a) KIV‐2 and Lp(a) Peptidase S1, variants of apo(a); RBP‐4, retinol‐binding protein 4; TFE, serotransferrin (transferrin); TTR, transthyretin; VDP, vitamin D‐binding protein; VN, vitronectin.
Significant p‐value after adjusting for multiple testing.
Treated non‐parametric and listed as median (IQR). Differences were tested with Mann–Whitney U test instead of t‐test.
3.3. Association to type 2 diabetes progression
As previously reported (ref Jacobsen), 25.7% (n = 33) of the women with pGDM developed T2D during the follow‐up period of 8–10 years, 48.5% (n = 16) of these women were diagnosed prior to the follow‐up assessment, while 51.5% (n = 17) were diagnosed during the follow‐up assessment. None of the controls developed T2D during the 8–10‐year follow‐up period. We examined the core set of significantly changed proteins by ANOVAs between (1) pGDM group with T2D, (2) pGDM group without T2D and (3) controls (non‐GDM) (Table 3). After adjustment for age and HDL (only apolipoproteins), there were significant differences in the cardio‐metabolic protein profile between the three groups; ApoD was significantly lower for the pGDM + T2D group compared to pGDM without T2D (p = 0.02) additionally, the pGDM + T2D group had higher VN (p = 0.001), C3 (p < 0.001) and CFB (p = 0.004) compared to the pGDM without T2D. Comparison between the non‐GDM group and the pGDM group without T2D also showed lower ApoD (p = <0.001) and higher VN (p = 0.044) in the pGDM without T2D; additionally, significant differences in ApoL‐I (p = 0.039) and ApoM (p = 0.014) were present, but no significant differences in C3 (p = 0.11) and CFB (p = 0.22).
TABLE 3.
Subgroup analyses of cardio‐metabolic profiles.
| pGDM T2DM n = 33, mean (SD) | pGDM nonT2DM n = 95, mean (SD) | Non‐GDM n = 70, mean (SD) | p‐value | p1 | p2 | |
|---|---|---|---|---|---|---|
| ApoA‐I | 0.1 (0.33) | 0.16 (0.26) | 0.29 (0.24) | 0.001 | 0.27 a | 0.064 a |
| ApoD | −1.07 (0.40) | −0.81 (0.34) | −0.55 (0.28) | <0.001 | 0.02 a | <0.001 a |
| ApoH | 0.22 (0.38) | 0.04 (0.44) | −0.10 (0.49) | 0.004 | 0.12 a | 0.07 a |
| ApoL‐I | −0.18 (0.40) | −0.25 (0.4) | −0.43 (0.38) | 0.003 | 0.30 a | 0.039 a |
| ApoM | 1.10 (0.20) | 1.06 (0.25) | 1.21 (0.21) | <0.001 | 0.08 a | 0.014 a |
| VDP b | −1.03 (−1.08: 0.92) | −1.07 (−1.20: −0.94) | −1.17 (−1.3 to 1.01) | 0.001 | 0.14 | 0.91 |
| VN | 0.21 (0.28) | −0.01 (0.36) | −0.19 (0.36) | <0.001 | 0.001 | 0.044 |
| TTR | −0.34 (0.26) | −0.43 (0.26) | −0.55 (0.28) | 0.001 | 0.11 | 0.015 |
| C3 | 0.70 (0.28) | 0.43 (0.33) | 0.30 (0.31) | <0.001 | <0.001 | 0.11 |
| CFB | 0.14 (0.33) | −0.35 (0.38) | −0.45 (0.33) | <0.001 | 0.004 | 0.22 |
Note: The case group: previous GDM (pGDM) was divided into two subgroups: pGDM nonT2DM: pGDM women without type 2 diabetes development at follow‐up (n = 95); pGDM T2DM: pGDM women with type 2 diabetes development at follow‐up (n = 33). p‐value: differences between all three groups calculated by ANOVA with Bonferroni correction. p1:differences between group pGDM nonT2DM and pGDM T2DM, adjusted for age at follow‐up. Only VDP was tested non‐parametric. p2: differences between group non‐GDM and pGDM nonT2DM, adjusted for age at follow‐up. Only VPD was tested non‐parametric.
Abbreviations: Apo, apolipoprotein; C3, complement factor 3; CFB, complement factor B; TTR, transthyretin; VDP, vitamin D‐binding protein; VN, vitronectin.
adjusted for HDL and maternal age
defined as median [IQR]
Associations of cardio‐metabolic proteins, GDM status and T2D are presented in Figure 1; for data, see Table S4.
FIGURE 1.
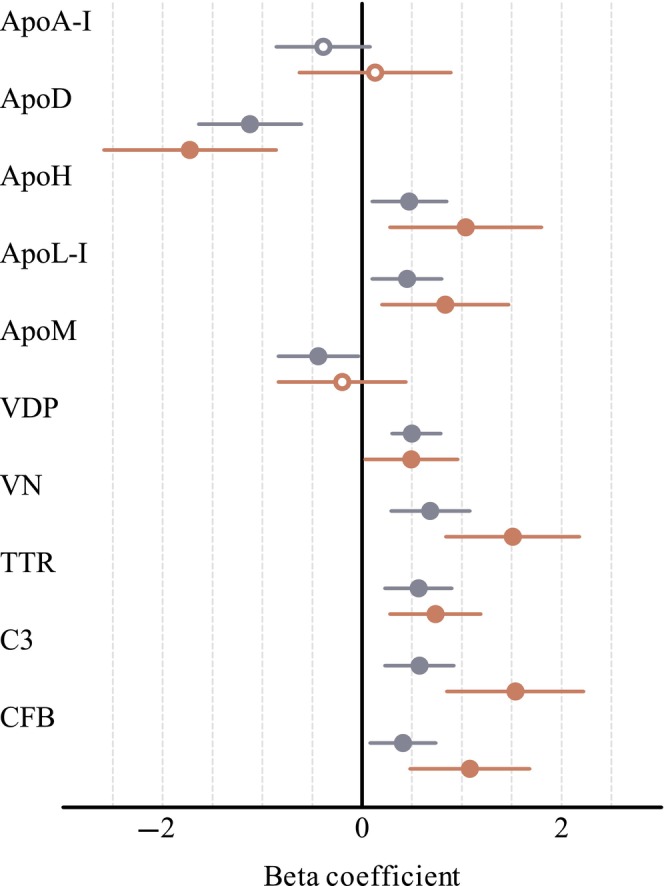
Forest plot displaying beta coefficients with 95% CI for association of cardio‐metabolic proteins to previous GDM (pGDM) and to pGDM and type 2 diabetes. Previous pregnancy with GDM (pGDM) (n = 128) compared with non‐GDM (n = 70) (blue circle). Previous GDM and type 2 diabetes development at follow‐up (n = 33) compared with non‐GDM (n = 70) (red circle). Filled circles p < 0.05; Open circles non‐significant. Lipoproteins were adjusted for HDL at follow‐up. Beta coefficients were calculated using log2 protein ratios transformed to z‐score. Apo, apolipoprotein; C3, complement factor 3; CFB, complement factor B; TTR, transthyretin; VDP, vitamin D‐binding protein; VN, vitronectin.
In further sensitivity analysis, we examined if differences in the protein profile were dependent on treatment for T2D. For women who were diagnosed before the follow‐up assessment (n = 16), it was assumed that treatment for T2D would have been initiated in the majority of cases. On the contrary, for the women with T2D diagnosed during the follow‐up assessment (n = 17), treatment prior to follow‐up was considered unlikely. However, these groups displayed no significant differences in the cardio‐metabolic profile (Table S5).
3.4. Correlation matrix analysis
A correlation matrix analysis was performed to investigate associations between cardio‐metabolic protein profile variables and indices of insulin resistance and insulin sensitivity (Figure 2A,B, Table S6A,B). There was a tendency of negative correlation (r = −0.7 to −0.1) between the transport/inflammation/immune proteins and insulin sensitivity (BIGTT‐SI), especially for VN, C3, and CFH (Figure 2A). Among proteins, complement factors correlated with each other (r = 0.4 to 0.8) and with CRP and VN (r = 0.3 to 0.8). ApoB100 was strongly positively correlated with LDL (r = 0.9) and total cholesterol (r = 0.8), whereas ApoA‐I was strongly positively correlated with HDL (r = 0.7) (Figure 2B). ApoD correlated with HDL (r = 0.7) and both ApoD and HDL correlated positively with BIGTT‐SI (r = 0.5, r = 0.5) and negatively with HOMA‐beta (r = −0.3, r = −0.4) and HOMA‐IR (r = −0.5, r = −0.5). All the above correlations were statistically significant (p < 0.05; Table S6A,B).
FIGURE 2.
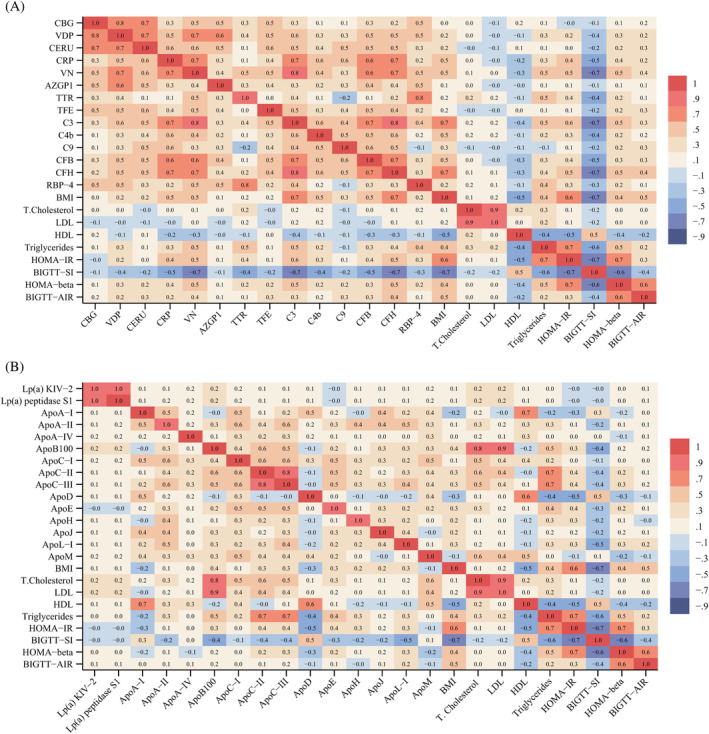
Correlation matrix table. (A) Transport inflammation and innate immunity proteins and markers of lipid metabolism and indices of beta‐cell function, insulin resistance and insulin sensitivity. (B) Apolipoproteins and markers of lipid metabolism and indices of beta‐cell function, insulin resistance and insulin sensitivity. Data are presented as Pearson correlation coefficient (r). HOMA‐IR: Homeostatic model assessment of insulin resistance, BIGTT‐SI: BIGTT sensitivity index, HOMA‐beta: Homeostatic model assessment of beta cell function, BIGTT‐AIR: BIGTT acute insulin response. Apo, apolipoprotein; AZGP1, zinc‐alpha‐2‐glycoprotein; C3, complement factor 3; C4b, complement factor 4b; C9, complement factor 9; CBG, corticosteroid‐binding globulin; CERU, ceruloplasmin; CFB, complement factor B; CFH, complement factor H; CRP, c‐reactive protein; Lp(a) KIV‐2 and Lp(a) KIV‐peptidase S1, variants of apo(a); RBP‐4, retinol‐binding protein 4; TFE, serotransferrin (transferrin); TTR, transthyretin; VDP, vitamin D‐binding protein; VN, vitronectin.
4. DISCUSSION
This study investigated differences in the long‐term cardio‐metabolic profile of women with and without previous GDM and the possible differences between women with and without subsequent T2D. We found significant differences in levels of apolipoproteins, transport proteins and complement in women with previous GDM. In the adjusted analysis, a subset of proteins (i.e. ApoD, C3, CFB, VN) was associated with previous GDM, with these associations being stronger in the group of women who progressed to T2D in the follow‐up period.
This subset of proteins has previously been reported as early pregnancy risk markers of GDM. 16 , 17 , 18 , 27
While this is the first study to investigate a cardio‐metabolic protein profile in relation to T2D after GDM, a number of studies have prospectively explored the relationship between apolipoprotein levels and incident T2D. 14 In contrast to our findings regarding ApoM and T2D, a large prospective cohort study, found plasma ApoM levels to be lower in individuals with T2D and, for individuals carrying a single nucleotide polymorphism in APOM (variant rs1266078), plasma ApoM was reduced. 28 However, no causal association was established between plasma ApoM and the risk of T2D. In our study we found lower ApoM in the pGDM group but not for the women with pGDM and T2D development, which could be a result of the large difference in sample size between the two studies or due to differences in aetiology regarding previous GDM.
In line with previous cardio‐metabolic protein profile studies of GDM in early pregnancy, in our study, ApoD, a lipocalin family hydrophobic molecule transporter, was lower in the pGDM group than in the non‐GDM group. 17 A study investigating umbilical cord blood, reported higher levels of ApoD in GDM pregnancies compared to non‐GDM pregnancies, 29 , 30 indicating a defence mechanism in the placenta to protect the fetus against oxidative stress. 30 Moreover, a previous study among offspring of mothers with and without type 1 diabetes, ApoD was reduced in female adolescent offspring of mothers with type 1 diabetes. 31 Adult and adolescent offspring of mothers with type 1 diabetes, had a higher BMI and a higher frequency of prediabetes, linked to later development of T2D. 32 , 33
ApoD is a multi‐ligand multi‐function protein involved in lipid metabolism and serves as a component of HDL particles; a transport protein for progesterone and arachidonic acid. 34 , 35 Human and animal studies have indicated that ApoD may also be related to oxidative stress and inflammation. 34 , 35 , 36 It has been proposed that ApoD's potential as an antioxidant and anti‐inflammatory agent is due to its ability to bind and control the release of arachidonic acid, which is prone to oxidative stress and lipid peroxidation reaction. 35 Additionally, it was demonstrated that a higher level of ApoD was associated with lower levels of oxidative stress and inflammation in both human and animal studies. 29 , 35
The low level of ApoD found in the pGDM group in our study could imply inadequate antioxidant and anti‐inflammatory capacity through the lower binding capacity of arachidonic acid. Hence, this could lead to an increase in oxidative stress and inflammation, considered a hallmark of T2D. 14 Mice models with leptin receptor deficiency have shown impaired lipid metabolism together with low ApoD levels, 37 whereas ApoD knockout resulted in increased levels of triglyceride. 38 Taken together, ApoD plays an important but yet to be clarified role in lipid and glucose metabolism, and increasing evidence supports its role as a risk marker of T2D. We speculate that ApoD in HDL partially explains the correlation visualized in the correlation matrix between HDL and insulin sensitivity/resistance since we found a significant association between ApoD and T2D, even when adjusted for HDL. In contrast to ApoD, ApoL‐I, another component in HDL particles, was no longer significantly related to previous GDM status after HDL adjustment.
In the present study, we demonstrated a higher level of VN in the pGDM group and an association between high levels of VN and the development of T2D after GDM. Ravnsborg et al. used untargeted and targeted proteomics to show higher early pregnancy VN serum levels in women who developed GDM 18 and that VN was an independent predictor of GDM in the first trimester of pregnancy. 18
VN is known to have several functions, including a role in the immune response. 39 The higher level of VN might be a sign of an increased inflammatory state in pGDM women, which is supported by the association with T2D, where inflammation and oxidative stress are known to be higher. 40 This also aligns with the elevated levels of C3 and CFB found in the pGDM group as they are associated with inflammation. 41
The exact association between VN, GDM and T2D is not fully understood and is complicated by the fact that VN is a highly abundant multi‐functional plasma protein with multiple interactions (plasminogen‐activator inhibitor‐1, thrombin‐antithrombin II, complement C5b‐C9) and has been found enhanced in several inflammatory pathologies. 42 , 43 Nevertheless, VN could be regarded as a risk marker for future development of T2D and may, together with other markers, that is ApoD, be used for multi‐marker prediction models to assess the risk of developing T2D.
Lastly, C3 was higher in the pGDM group, in addition it was highest in the pGDM group of women who developed T2D in our study which is in line with previous findings. Wlazlo et al. found that C3 was associated with insulin resistance and T2D development. 44 Furthermore, Ramanjaneya et al. found C3 to be higher in GDM pregnancies, probably due to inflammation associated with GDM. 16 Likewise, associations have been reported regarding CFB, which has been found elevated in patients with T2D, likely driven by the underlying inflammation in T2D. 45
This study has several strengths and limitations. The OGFUS cohort consists of a well‐matched control group concerning pre‐pregnancy BMI, parity and BMI at the follow‐up assessment.
The women with GDM were assessed using the less strict Danish GDM diagnostic criteria compared to the WHO2013 diagnostic criteria, which may affect the applicability of these results.
It would be highly valuable to validate the impact of the protein profile and its association with T2D in a larger study population using WHO2013 diagnostic criteria. This would enable the generalization of findings to other populations with similar diagnostic criteria. According to our study objective, we analysed the pGDM and T2D groups in comparison to non‐GDM. The incidence of pre‐diabetes in the OGFUS cohort was 10.2% in the pGDM group and this group was too small for subgroup analysis. Nevertheless, we anticipate that women with pre‐diabetes have altered cardio‐metabolic profile as compared to the non‐GDM controls. The lack of a post‐partum biobank, that is 3 months postpartum, however, prevented us from examining if women with previous GDM already had an unfavourable cardio‐metabolic profile right after pregnancy, thus limiting a more thorough investigation of a causal association.
The identification of common protein markers of GDM and T2D to determine the relevant cardio‐metabolic protein profile at follow‐up was based on different study populations (previous studies and this study) and, as such, constitutes an external validation. To this end, a poor cardio‐metabolic protein profile in women who develop GDM may already be present prior to pregnancy. It might be part of the vicious circle of diabetes, possibly as a component of the genetic risk, 46 and/or caused by GDM per se. Accordingly, prospective cohorts with biobanks from (pre)pregnancy, post‐partum and at long‐term follow‐up are needed to further elucidate these possible associations.
In our study, we demonstrated that biomarkers were also associated with the indices of insulin resistance and insulin sensitivity. Three proteins, ApoD, VN and C3 showed strong correlations to insulin resistance and insulin sensitivity. Further studies are needed to strengthen the evidence of these proteins as proxy markers for the development of T2D in women with previous GDM pregnancies and investigation of the protein profile short term after birth in a more diverse study population. From a clinical perspective, it would be beneficial to achieve a more precise risk stratification for women with GDM to categorize them into high‐risk and low‐risk groups for the subsequent development of T2D. This stratification could be based on a combination of known risk factors and biomarkers. Implementing more comprehensive follow‐up assessments after GDM could facilitate this process. Additionally, providing targeted preventive interventions for those in the high‐risk group may help to reduce the incidence of T2D following a GDM pregnancy.
In conclusion, we found significant differences in the cardio‐metabolic protein profile between women with and without previous GDM. We identified four proteins related to previous GDM and T2D: ApoD, vitronectin and complement factors 3 and B. All these proteins have been associated with GDM in previous studies, which suggest an overlap of the cardio‐metabolic profile of GDM and the progression into T2D after GDM.
AUTHOR CONTRIBUTIONS
Simone J. Hallig conducted data analysis, interpretation and drafting of the manuscript. Jori Aalders, Maria H. Christensen, Fidelma Dunne and Kurt Højlund contributed to data analysis, interpretation and critical revision of the manuscript. Christina A. Vinter and Marianne S. Andersen contributed to the conception and design of the OGFUS cohort and contributed to data interpretation and critical revision of the manuscript. Dorte M. Jensen was responsible for the design of the OGFUS cohort, data interpretation and critical revision of the manuscript. Martin Overgaard developed the MRM‐MS assay and conducted the MRM blood sample analyses in this study. Martin Overgaard contributed to the conception, design and supervision of this study as well as data interpretation and drafting of the manuscript. All authors critically revised the manuscript and approved the final version for publication. Martin Overgaard is the guarantor of this work and, as such, has full access to all the data in the study and takes responsibility for the integrity of the data and the accuracy of the data analysis.
CONFLICT OF INTEREST STATEMENT
The authors declare no conflicts of interest.
PEER REVIEW
The peer review history for this article is available at https://www.webofscience.com/api/gateway/wos/peer‐review/10.1111/dom.16148.
Supporting information
Data S1. Supporting Information.
ACKNOWLEDGEMENTS
This study was supported by the Odense University Hospital Free Research Fund (11/28764). Technical facilities of OPEN (Open Patient data Explorative Network), Odense University Hospital, Odense, Denmark, was used. We would like to thank the women participating in the OGFUS study for their participation and Amalie Bøgsted for excellent technical assistance in performing the laboratory analysis.
Hallig SJ, Aalders J, Christensen MH, et al. The cardio‐metabolic protein profile is associated with development of type 2 diabetes at long term follow‐up after gestational diabetes mellitus: Results from the OGFUS study. Diabetes Obes Metab. 2025;27(3):1456‐1465. doi: 10.1111/dom.16148
DATA AVAILABILITY STATEMENT
Data are available from the corresponding author upon reasonable request.
REFERENCES
- 1. Rani PR, Begum J. Screening and diagnosis of gestational diabetes mellitus, where do we stand. J Clin Diagn Res. 2016;10(4):Qe01‐4. doi: 10.7860/jcdr/2016/17588.7689 [DOI] [PMC free article] [PubMed] [Google Scholar]
- 2. Plows JF, Stanley JL, Baker PN, Reynolds CM, Vickers MH. The pathophysiology of gestational diabetes mellitus. Int J Mol Sci. 2018;19(11): 1‐5. doi: 10.3390/ijms19113342 [DOI] [PMC free article] [PubMed] [Google Scholar]
- 3. Vounzoulaki E, Khunti K, Abner SC, Tan BK, Davies MJ, Gillies CL. Progression to type 2 diabetes in women with a known history of gestational diabetes: systematic review and meta‐analysis. BMJ. 2020;369:m1361. doi: 10.1136/bmj.m1361 [DOI] [PMC free article] [PubMed] [Google Scholar]
- 4. Peacock AS, Bogossian F, McIntyre HD, Wilkinson S. A review of interventions to prevent type 2 diabetes after gestational diabetes. Women Birth. 2014;27(4):e7‐e15. doi: 10.1016/j.wombi.2014.09.002 [DOI] [PubMed] [Google Scholar]
- 5. Guo J, Chen JL, Whittemore R, Whitaker E. Postpartum lifestyle interventions to prevent type 2 diabetes among women with history of gestational diabetes: a systematic review of randomized clinical trials. J Womens Health (Larchmt). 2016;25(1):38‐49. doi: 10.1089/jwh.2015.5262 [DOI] [PubMed] [Google Scholar]
- 6. Adam S, McIntyre HD, Tsoi KY, et al. Pregnancy as an opportunity to prevent type 2 diabetes mellitus: FIGO best practice advice. Int J Gynaecol Obstet. 2023;160(Suppl 1):56‐67. doi: 10.1002/ijgo.14537 [DOI] [PMC free article] [PubMed] [Google Scholar]
- 7. Kautzky‐Willer A, Bancher‐Todesca D. Gestational diabetes. Wien Med Wochenschr. 2003;153(21‐22):478‐484. doi: 10.1007/s10354-003-0039-7 [DOI] [PubMed] [Google Scholar]
- 8. Rayanagoudar G, Hashi AA, Zamora J, Khan KS, Hitman GA, Thangaratinam S. Quantification of the type 2 diabetes risk in women with gestational diabetes: a systematic review and meta‐analysis of 95,750 women. Diabetologia. 2016;59(7):1403‐1411. doi: 10.1007/s00125-016-3927-2 [DOI] [PMC free article] [PubMed] [Google Scholar]
- 9. Zhou T, Du S, Sun D, et al. Prevalence and trends in gestational diabetes mellitus among women in the United States, 2006–2017: a population‐based study. Front Endocrinol. 2022;13:868094. doi: 10.3389/fendo.2022.868094 [DOI] [PMC free article] [PubMed] [Google Scholar]
- 10. Alwash SM, Huda MM, McIntyre HD, Mamun AA. Time trends and projections in the prevalence of gestational diabetes mellitus in Queensland, Australia, 2009–2030: evidence from the Queensland perinatal data collection. Aust N Z J Obstet Gynaecol. 2023;63(6):811‐820. doi: 10.1111/ajo.13734 [DOI] [PubMed] [Google Scholar]
- 11. Noctor E, Crowe C, Carmody LA, et al. Abnormal glucose tolerance post‐gestational diabetes mellitus as defined by the International Association of Diabetes and Pregnancy Study Groups criteria. Eur J Endocrinol. 2016;175(4):287‐297. doi: 10.1530/eje-15-1260 [DOI] [PubMed] [Google Scholar]
- 12. Sokup A, Ruszkowska‐Ciastek B, Góralczyk K, Walentowicz M, Szymański M, Rość D. Insulin resistance as estimated by the homeostatic method at diagnosis of gestational diabetes: estimation of disease severity and therapeutic needs in a population‐based study. BMC Endocr Disord. 2013;13:21. doi: 10.1186/1472-6823-13-21 [DOI] [PMC free article] [PubMed] [Google Scholar]
- 13. Semnani‐Azad Z, Gaillard R, Hughes AE, Boyle KE, Tobias DK, Perng W. Precision stratification of prognostic risk factors associated with outcomes in gestational diabetes mellitus: a systematic review. Commun Med. 2024;4(1):9. doi: 10.1038/s43856-023-00427-1 [DOI] [PMC free article] [PubMed] [Google Scholar]
- 14. Zhang P, Gao J, Pu C, Zhang Y. Apolipoprotein status in type 2 diabetes mellitus and its complications (review). Mol Med Rep. 2017;16(6):9279‐9286. doi: 10.3892/mmr.2017.7831 [DOI] [PubMed] [Google Scholar]
- 15. Sriboonvorakul N, Hu J, Boriboonhirunsarn D, Ng LL, Tan BK. Proteomics studies in gestational diabetes mellitus: a systematic review and meta‐analysis. J Clin Med. 2022;11(10): 1‐12. doi: 10.3390/jcm11102737 [DOI] [PMC free article] [PubMed] [Google Scholar]
- 16. Ramanjaneya M, Butler AE, Alkasem M, et al. Association of complement‐related proteins in subjects with and without second trimester gestational diabetes. Front Endocrinol. 2021;12:641361. doi: 10.3389/fendo.2021.641361 [DOI] [PMC free article] [PubMed] [Google Scholar]
- 17. Ravnsborg T, Andersen LL, Trabjerg ND, Rasmussen LM, Jensen DM, Overgaard M. First‐trimester multimarker prediction of gestational diabetes mellitus using targeted mass spectrometry. Diabetologia. 2016;59(5):970‐979. doi: 10.1007/s00125-016-3869-8 [DOI] [PubMed] [Google Scholar]
- 18. Ravnsborg T, Svaneklink S, Andersen LLT, Larsen MR, Jensen DM, Overgaard M. First‐trimester proteomic profiling identifies novel predictors of gestational diabetes mellitus. PLoS One. 2019;14(3):e0214457. doi: 10.1371/journal.pone.0214457 [DOI] [PMC free article] [PubMed] [Google Scholar]
- 19. Yin H, Shi R. Comment on “role of increased plasminogen activator inhibitor‐1 and vitronectin in gestational diabetes mellitus”. Rev Assoc Med Bras (1992). 2024;70(4):e20231607. doi: 10.1590/1806-9282.20231607 [DOI] [PMC free article] [PubMed] [Google Scholar]
- 20. Li M, Hou X, Zhang R, Zheng X, Dang W. Role of apolipoprotein E in suppressing oxidative stress in gestational diabetes mellitus patients and mouse model. Int J Gynaecol Obstet. 2022;159(1):204‐212. doi: 10.1002/ijgo.14076 [DOI] [PubMed] [Google Scholar]
- 21. Lappas M, Georgiou HM, Velagic A, Willcox JC, Permezel M, Shub A. Do postpartum levels of Apolipoproteins prospectively predict the development of type 2 diabetes in women with previous gestational diabetes mellitus? Exp Clin Endocrinol Diabetes. 2019;127(6):353‐358. doi: 10.1055/a-0577-7700 [DOI] [PubMed] [Google Scholar]
- 22. Jacobsen KH, Aalders J, Sølling K, et al. Long‐term metabolic outcomes after gestational diabetes mellitus (GDM): results from the Odense GDM follow‐up study (OGFUS). J Diabetes Res. 2022;2022:4900209. doi: 10.1155/2022/4900209 [DOI] [PMC free article] [PubMed] [Google Scholar]
- 23. Danish Society of Obstetrics and Gynaecology . National guideline report: “Gestational diabetes mellitus: screening and diagnosis” 2014. 2014. https://gynobsguideline.dk/wp/wp-content/uploads/2013/02/GDM-Sandbjerg-2014-godkendt-2014.pdf
- 24. Steffensen LB, Larsen JH, Hansen DR, et al. Profiling the plasma apolipoproteome of normo‐ and hyperlipidemic mice by targeted mass spectrometry. J Proteome Res. 2023;22(5):1385‐1393. doi: 10.1021/acs.jproteome.2c00189 [DOI] [PubMed] [Google Scholar]
- 25. MacLean B, Tomazela DM, Shulman N, et al. Skyline: an open source document editor for creating and analyzing targeted proteomics experiments. Bioinformatics. 2010;26(7):966‐968. doi: 10.1093/bioinformatics/btq054 [DOI] [PMC free article] [PubMed] [Google Scholar]
- 26. Grund B, Sabin C. Analysis of biomarker data: logs, odds ratios, and receiver operating characteristic curves. Curr Opin HIV AIDS. 2010;5(6):473‐479. doi: 10.1097/COH.0b013e32833ed742 [DOI] [PMC free article] [PubMed] [Google Scholar]
- 27. Shen Y, Li J, Tian H, et al. High level of complement factor Ba within first prenatal test of gestation increases the risk of subsequent gestational diabetes: a propensity score‐matched study. Gynecol Endocrinol. 2022;38(2):158‐163. doi: 10.1080/09513590.2021.1989400 [DOI] [PubMed] [Google Scholar]
- 28. Hajny S, Christoffersen M, Dalila N, Nielsen LB, Tybjærg‐Hansen A, Christoffersen C. Apolipoprotein M and risk of type 2 diabetes. J Clin Endocrinol Metab. 2020;105(9):3046‐3057. doi: 10.1210/clinem/dgaa433 [DOI] [PubMed] [Google Scholar]
- 29. Kopylov AT, Papysheva O, Gribova I, et al. Molecular pathophysiology of diabetes mellitus during pregnancy with antenatal complications. Sci Rep. 2020;10(1):19641. doi: 10.1038/s41598-020-76689-9 [DOI] [PMC free article] [PubMed] [Google Scholar]
- 30. Navarro A, Alonso A, Garrido P, et al. Increase in placental apolipoprotein D as an adaptation to human gestational diabetes. Placenta. 2010;31(1):25‐31. doi: 10.1016/j.placenta.2009.11.002 [DOI] [PMC free article] [PubMed] [Google Scholar]
- 31. Overgaard M, Ravnsborg T, Lohse Z, et al. Apolipoprotein D and transthyretin are reduced in female adolescent offspring of women with type 1 diabetes: the EPICOM study. Diabet Med. 2022;39(7):e14776. doi: 10.1111/dme.14776 [DOI] [PubMed] [Google Scholar]
- 32. Vlachová Z, Bytoft B, Knorr S, et al. Increased metabolic risk in adolescent offspring of mothers with type 1 diabetes: the EPICOM study. Diabetologia. 2015;58(7):1454‐1463. doi: 10.1007/s00125-015-3589-5 [DOI] [PubMed] [Google Scholar]
- 33. Clausen TD, Mathiesen ER, Hansen T, et al. High prevalence of type 2 diabetes and pre‐diabetes in adult offspring of women with gestational diabetes mellitus or type 1 diabetes: the role of intrauterine hyperglycemia. Diabetes Care. 2008;31(2):340‐346. doi: 10.2337/dc07-1596 [DOI] [PubMed] [Google Scholar]
- 34. Rassart E, Desmarais F, Najyb O, Bergeron KF, Mounier C. Apolipoprotein D. Gene. 2020;756:144874. doi: 10.1016/j.gene.2020.144874 [DOI] [PMC free article] [PubMed] [Google Scholar]
- 35. Fyfe‐Desmarais G, Desmarais F, Rassart É, Mounier C. Apolipoprotein D in oxidative stress and inflammation. Antioxidants (Basel). 2023;12(5): 2‐17. doi: 10.3390/antiox12051027 [DOI] [PMC free article] [PubMed] [Google Scholar]
- 36. Bajo‐Grañeras R, Sanchez D, Gutierrez G, et al. Apolipoprotein D alters the early transcriptional response to oxidative stress in the adult cerebellum. J Neurochem. 2011;117(6):949‐960. doi: 10.1111/j.1471-4159.2011.07266.x [DOI] [PubMed] [Google Scholar]
- 37. Perdomo G, Kim DH, Zhang T, et al. A role of apolipoprotein D in triglyceride metabolism. J Lipid Res. 2010;51(6):1298‐1311. doi: 10.1194/jlr.M001206 [DOI] [PMC free article] [PubMed] [Google Scholar]
- 38. Jimenez‐Palomares M, Cozar‐Castellano I, Ganfornina MD, Sanchez D, Perdomo G. Genetic deficiency of apolipoprotein D in the mouse is associated with nonfasting hypertriglyceridemia and hyperinsulinemia. Metabolism. 2011;60(12):1767‐1774. doi: 10.1016/j.metabol.2011.04.013 [DOI] [PubMed] [Google Scholar]
- 39. Schvartz I, Seger D, Shaltiel S. Vitronectin. Int J Biochem Cell Biol. 1999;31(5):539‐544. doi: 10.1016/s1357-2725(99)00005-9 [DOI] [PubMed] [Google Scholar]
- 40. Oguntibeju OO. Type 2 diabetes mellitus, oxidative stress and inflammation: examining the links. Int J Physiol Pathophysiol Pharmacol. 2019;11(3):45‐63. [PMC free article] [PubMed] [Google Scholar]
- 41. Winnicki W, Pichler P, Mechtler K, et al. A novel approach to immunoapheresis of C3a/C3 and proteomic identification of associates. PeerJ. 2019;7:e8218. doi: 10.7717/peerj.8218 [DOI] [PMC free article] [PubMed] [Google Scholar]
- 42. Ekmekçi OB, Ekmekçi H. Vitronectin in atherosclerotic disease. Clin Chim Acta. 2006;368(1–2):77‐83. doi: 10.1016/j.cca.2005.12.015 [DOI] [PubMed] [Google Scholar]
- 43. Zuchtriegel G, Uhl B, Pick R, et al. Vitronectin stabilizes intravascular adhesion of neutrophils by coordinating β2 integrin clustering. Haematologica. 2021;106(10):2641‐2653. doi: 10.3324/haematol.2019.226241 [DOI] [PMC free article] [PubMed] [Google Scholar]
- 44. Wlazlo N, van Greevenbroek MM, Ferreira I, et al. Complement factor 3 is associated with insulin resistance and with incident type 2 diabetes over a 7‐year follow‐up period: the CODAM study. Diabetes Care. 2014;37(7):1900‐1909. doi: 10.2337/dc13-2804 [DOI] [PubMed] [Google Scholar]
- 45. Moin ASM, Nandakumar M, Diboun I, et al. Hypoglycemia‐induced changes in complement pathways in type 2 diabetes. Atheroscler Plus. 2021;46:35‐45. doi: 10.1016/j.athplu.2021.11.002 [DOI] [PMC free article] [PubMed] [Google Scholar]
- 46. Alejandro EU, Mamerto TP, Chung G, et al. Gestational diabetes mellitus: a harbinger of the vicious cycle of diabetes. Int J Mol Sci. 2020;21(14): 6‐11. doi: 10.3390/ijms21145003 [DOI] [PMC free article] [PubMed] [Google Scholar]
Associated Data
This section collects any data citations, data availability statements, or supplementary materials included in this article.
Supplementary Materials
Data S1. Supporting Information.
Data Availability Statement
Data are available from the corresponding author upon reasonable request.