

Abstract
Purpose
A prolonged time to treatment initiation (TTI) correlates with an adverse prognosis in different cancer types including resectable pancreatic cancer (PC). Only limited evidence on the correlation between TTI and prognosis in advanced PC exists.
Methods
Consecutive PC patients (n = 368) who were diagnosed or treated at our high-volume comprehensive cancer center were included in a prospectively maintained database. We retrospectively analyzed time from first imaging showing advanced PC to initiation of palliative first-line chemotherapy. Lead time bias and waiting time paradox were addressed by landmark analysis and correlation of tumor burden with TTI.
Results
Two hundred and ninety-seven patients met the pre-specified in- and exclusion criteria of our study. Median TTI was 29 days (range: 1–124 days). Most common reasons for prolonged TTI (> 21 days) were referral from an external treatment center (39%) and a second biopsy (31%). A TTI above the median-, 75th or 90th percentile (43 or 60 days, respectively) had no impact on overall survival. Furthermore, no correlation between levels of carbohydrate antigen 19-9 (CA 19-9) at time of treatment initiation and TTI was observed.
Conclusion
While a timely work-up of advanced PC patients remains important, delays in treatment initiation due to repeated biopsies, inclusion in a clinical study or transfer to a specialized cancer center appear to be justified in light of the absence of a strong adverse effect of prolonged TTI on prognosis in advanced PC patients.
Electronic supplementary material
The online version of this article (10.1007/s00432-019-03061-4) contains supplementary material, which is available to authorized users.
Keywords: Ductal adenocarcinoma, Time to treatment initiation, Pancreatic cancer, Treatment delay, Waiting time paradox, Lead time bias
Background
Despite a declining overall cancer mortality in the western world, pancreatic cancer (PC)-related mortality has been on the rise in recent years (Ferlay et al. 2013; Siegel et al. 2015). A further increase in incidence is predicted to make PC the second leading cause of cancer-related mortality by 2030 in the US and Europe, respectively (Quante et al. 2016; Rahib et al. 2014). Treatment options for other solid malignancies were substantially expanded by the advent of targeted therapy and immunotherapy in recent years. For advanced PC patients, treatment efficacy was only modestly improved by the development of two intensified chemotherapy regimens, resulting in a median overall survival of still less than 1 year for patients with good performance status without significant comorbidities (Conroy et al. 2011; Javed et al. 2019; Von Hoff et al. 2013). This leaves patients and physicians in a dissatisfactory situation with limited therapeutic options.
Prognostic factors susceptible to modification are therefore of special interest. One such potential factor is time to treatment initiation (TTI). For different cancer types including breast cancer, colorectal cancer, head and neck cancer, testicular cancer and melanoma there is clear evidence that increasing TTI correlates with an adverse prognosis (Neal et al. 2015). However, up to now, its significance for advanced PC patients remains unclear (Neal et al. 2015). Given the fact that PC is a rapidly progressing disease with a progression time from early to late stage disease of roughly more than 1 year, an adverse correlation between time to treatment initiation and prognosis seems likely (Yu et al. 2015). Indeed, for resectable PC, several studies suggest that TTI is an independent predictor of overall survival, resection rate and unanticipated metastasis encountered during surgery (Glant et al. 2011; Gobbi et al. 2013; Khorana et al. 2019; Neal et al. 2015; Raptis et al. 2010; Sanjeevi et al. 2015; Yun et al. 2012). As reported recently, the few existing studies on the correlation between TTI and prognosis in advanced PC have several important shortcomings (Pitter et al. 2018). Besides the use of a single cutoff for TTI, prior studies on the correlation between TTI and prognosis in advanced PC did not refer to “lead time bias” or the “waiting time paradox” (Abdel-Rahman et al. 2018; Jooste et al. 2016; Lee et al. 2019; Suzuki et al. 2019). Additionally, none of the aforementioned studies addressed the question what causes a prolonged TTI (Abdel-Rahman et al. 2018; Jooste et al. 2016; Lee et al. 2019; Suzuki et al. 2019).
We therefore conducted a retrospective study of advanced PC patients treated at our cancer center to answer the following questions: what are the reasons causing a delay in treatment initiation? Is there a causative link between prolonged TTI and adverse prognosis? Is there evidence that the previous studies on TTI in advanced PC might have been biased?
Methods
Study design
From 2002 to 2015, patients who were diagnosed and/or treated with PC at our high-volume comprehensive cancer center were prospectively included in a patient database. For the current study, medical records were retrospectively analyzed to screen for eligible patients. Inclusion criteria were: histologically or cytologically confirmed advanced PC patients (locally advanced or metastatic disease) who received palliative chemotherapy. Exclusion criteria were: histology other than pancreatic adenocarcinoma, second malignancy, surgery in palliative intent, no imaging study prior to initiation of palliative chemotherapy or insufficient data quality. The following data were evaluated: patient and tumor characteristics including age, performance status, carbohydrate antigen 19-9 (CA 19-9) levels at time of initial diagnosis of advanced PC, date of first imaging study (e.g. ultrasound, CT or MRI scan) showing a suspicion of advanced PC, treatment of PC (surgery, radiotherapy, chemotherapy). Patients treated outside of clinical trials received chemotherapy based on the decision of the supervising medical oncologists (SB and VH) until disease progression, unacceptable toxicity or patient refusal. TTI was calculated as time from first imaging study showing advanced PC to time of first receipt of chemotherapy in palliative intent. Survival status was determined by (a) review of medical records at our institution, (b) consultation of patient’s primary care physician or (c) consultation of patient’s civil registrar office. All living patients were followed up for survival status until February 2017. The study was approved by the local ethics committee of Ludwig-Maximilians-University of Munich (approval number 134-15). This report was written according to the most recent reporting recommendations for tumour MARKer prognostic studies (REMARK) (Sauerbrei et al. 2018).
Statistical analyses
Overall survival from the first imaging study showing suspicion of advanced PC to death from any cause was selected as primary study endpoint. Patients that did not die were censored at their last follow-up. Survival analyses were performed using the Kaplan–Meier method; differences in overall survival according to different cutoff points for time to treatment initiation (median, 75th percentile, 90th percentile) were calculated using the log-rank test or the cox proportional hazards model. To test for significance for the difference in TTI with different stages of disease at initial diagnosis (relapse after prior resection in curative intent versus initial presentation with advanced disease) a Chi-squared test was used. To control for a potential lead time bias, we performed a landmark analysis: only patients who lived longer than the selected cutoff points for TTI were included in the respective analysis. To evaluate a potential relationship between tumor burden and TTI, we correlated levels of CA 19-9 with TTI using a Spearman’s rank correlation coefficient analysis. The following analyses were pre-defined prior to study initiation: cox proportional hazards model including age, gender, stage at initial diagnosis, ECOG, CA 19-9 and different cutoffs for TTI (more than 21 days; median TTI, 75th percentile and 90th percentile of TTI, respectively); log-rank analysis of overall survival and progression-free survival for different TTI cutoff points as defined above; comparison of patient characteristics with a TTI of ≤ 21 days versus patients with a TTI > 21 days; correlation of TTI with CA 19-9. All other analyses were performed explorative. We did not use a pre-specified hypothesis or perform a power-calculation prior to initiation of our study. Statistical analyses were performed using SAS Version 9.4 (SAS Institute, Cary, NC, USA.) and Graphpad Prism 7.01 (GraphPad Software Inc, La Jolla, CA USA). A p value of 0.05 or lower was considered statistically significant.
Results
Patient characteristics
Between 2002 and 2015 a total of 368 patients were included in our prospective database. Of those, 297 patients fulfilled the inclusion criteria for our study (Fig. 1). Median age at diagnosis was 65 years. A majority of patients were male (54%; n = 161); had a good performance status (ECOG 0–1: 89%; n = 263) and initially presented with synchronous metastatic disease (57%; n = 169) (Table 1). Most patients were treated with single-agent gemcitabine or gemcitabine-containing combination chemotherapy (n = 168, 57%), followed by 5-FU-based regimens (n = 94, 31%). One hundred and seven (36%) of all patients were treated within in a clinical trial. Overall, 188 patients (63%) of the study population received second-line therapy of any kind after failure of first-line chemotherapy. At the time of final analyses nearly all patients had died (n = 267, 90%); median overall survival (calculated from the start of palliative first-line chemotherapy to death from any cause) in the entire study cohort was estimated with 9.3 months.
Fig. 1.

CONSORT diagram
Table 1.
Patient characteristics at time of initiation of palliative first-line chemotherapy (n = 297)
| Age (years) | n | % |
|---|---|---|
| Median | 65 | |
| Range | 38–85 | |
| Gender | ||
| Male | 161 | 54 |
| Female | 136 | 46 |
| Stage of disease | ||
| Metastatic (relapse after surgery in curative intent) | 78 | 26 |
| Metastatic (synchronous) | 169 | 57 |
| Locally advanced | 50 | 17 |
| Primary tumor site | ||
| Head of pancreas | 179 | 60 |
| Body of pancreas | 56 | 19 |
| Tail of pancreas | 60 | 20 |
| Missing | 2 | 1 |
| Performance status | ||
| ECOG 0 | 109 | 37 |
| ECOG 1 | 154 | 52 |
| ECOG 2 | 23 | 8 |
| ECOG 3 | 3 | 1 |
| Missing | 8 | 2 |
| Histology | ||
| Ductal adenocarcinoma | 288 | 97 |
| Adenosquamous carcinoma | 3 | 1 |
| Mucinous adenocarcinoma | 4 | 1 |
| Cytology only | 2 | 1 |
| CA 19-9 prior to initiation of first-line chemotherapy | ||
| Median (n = 262) | 817 U/ml | |
| Range (n = 262) | 0–928 000 U/ml | |
| Missing | 35 | 12 |
| First-line chemotherapy | ||
| Chemoradiotherapy | 22 | 7 |
| Gemcitabine monotherapy | 62 | 21 |
| Gemcitabine-based combinational chemotherapy | 106 | 36 |
| 5-FU or capecitabine monotherapy | 15 | 5 |
| 5-FU-based combinational chemotherapy | 79 | 26 |
| Other | 3 | 1 |
| Missing | 10 | 4 |
CA 19-9 carbohydrate antigen 19-9, ECOG Eastern Cooperative Oncology Group
Time to treatment initiation (TTI)
We calculated TTI as time from first imaging study showing a suspicion of advanced PC administration of the first cycle of palliative chemotherapy. The median time to treatment initiation was 29 days (range: 1–124 days), with a 75th and 90th percentile of 43 and 60 days, respectively (Table 2). Prior to the conduct of our study, we assumed that a TTI interval of more than 21 days represents a “treatment delay”. Applying this strict definition, a delay in treatment initiation was found in 198 patients (66%). Treatment delay was significantly more frequent in patients who initially presented with synchronous metastatic disease than in patients who relapsed after surgery in curative intent (Table 2). Most common reason for a treatment delay was referral from an external treatment center (n = 51; 39%) or the necessity to perform an additional biopsy (n = 41; 31%) (Table 2).
Table 2.
Time to treatment initiation (TTI)
| Time to treatment initiation | |
|---|---|
| Median TTI | 29 days |
| Range TTI | 1–124 days |
| 75th percentile | 43 days |
| 90th percentile | 60 days |
| Treatment delay (TTI > 21 days) according to initial stage of disease | No treatment delay (TTI ≤ 21 days) (n) | Treatment delay (TTI > 21 days) (n) | |
|---|---|---|---|
| All patients | 100 (34%) | 197 (66%) | p < 0.001 |
| Initial presentation with advanced disease | 58 (26%) | 161 (74%) | |
| Relapse after surgery in curative intent | 42 (54%) | 36 (46%) |
| Reasons for treatment delay (TTI > 21 days) | n | % |
|---|---|---|
| Additional biopsy (initial biopsy inconclusive) | 41 | 20 |
| Additional diagnostic studies to establish pancreas as cancer primary | 10 | 5 |
| Comborbidities | 24 | 12 |
| Initially deemed resectable on preoperative staging | 5 | 3 |
| Patient’s request | 1 | 1 |
| Referal from tertiary cancer center | 51 | 26 |
| No specific reason | 65 | 33 |
TTI time to treatment initiation
Association of TTI with prognosis
To evaluate a potential relation between prolonged TTI and treatment outcome we calculated hazard ratios for known prognostic factors and TTI using the Cox proportional hazards model. Because two-thirds of all patients had a TTI of 21 days or longer (our predefined cutoff for “treatment delay”), we focused on more significant delays in treatment (i.e. median, 75th percentile and 90th percentile of TTI in the whole cohort). To exclude lead time bias that might potentially mask an effect of prolonged waiting time on survival we performed a landmark analysis that only included patients that lived longer than 29, 43 or 60 days, respectively. After 29, 43, and 60 days one, four and five patients in the whole cohort had died, respectively (Table 3). Stage of disease, ECOG performance status > 1 and a high CA 19-9 value were all indicators of an adverse prognosis (Table 3). A timely treatment initiation had no impact on overall survival, even when compared to substantial treatment delays (75th percentile and 90th percentile of TTI) (Table 3). Similar results were obtained when overall survival was plotted according to TTI using the Kaplan–Meier method (Fig. 2). For progression-free survival during first-line chemotherapy, similar results were obtained (Supplementary Figure 1).
Table 3.
Univariate analysis of prognostic factors for overall survival
| n | Hazard ratio (95% CI) | p | |
|---|---|---|---|
| Age | |||
| ≤ 65 years | 151 | 1.15 (0.91 – 1.47) | 0.249 |
| > 65 years | 146 | 1 | |
| Gender | |||
| Male | 161 | 1.13 (0.88 – 1.44) | 0.344 |
| Female | 136 | 1 | |
| Stage | |||
| LAPC | 50 | 1.10 (0.75 – 1.62) | 0.624 |
| Metastatic (synchronous)a | 169 | 1.55 (1.15 – 2.08) | 0.004 |
| Metastatic (metachronus)a | 78 | 1 | |
| ECOG | |||
| 0–1 | 236 | 0.48 (0.32 – 0.74) | 0.001 |
| 2–5 | 26 | 1 | |
| CA 19-9 | |||
| ≤ 792 U/ml | 130 | 0.58 (0.45 – 0.75) | < 0.001 |
| > 792 U/ml | 132 | 1 | |
| TTI medianb | |||
| ≤ 29 days | 153 | 1.12 (0.88 – 1.42) | 0.362 |
| > 29 days | 143 | 1 | |
| TTI 75th percentileb | |||
| ≤ 43 days | 221 | 1.03 (0.77 – 1.36) | 0.856 |
| > 43 days | 72 | 1 | |
| TTI 90th percentileb | |||
| ≤ 60 days | 264 | 1.04 (0.69 – 1.57) | 0.861 |
| > 60 days | 28 | 1 | |
Significant p values are given in bold
CA 19-9 carbohydrate antigen 19-9, ECOG Eastern Cooperative Oncology Group
aSynchronous metastatic stage: patients presented with metastatic disease at initial diagnosis of PC, metachronus metastatic stage: patients relapsed with metastic disease after surgery in curative intent
bTTI Median: one patient excluded by landmark analysis, TTI 75th percentile: four patients excluded by landmark analysis, TTI 90th percentile: five patients excluded by landmark analysis
Fig. 2.

Overall survival according to time to treatment initiation (TTI). Patients (n = 297) were divided into groups according to different cutoffs for TTI (median TTI, 75th and 90th percentile). After 29, 43 and 60 days one, four and five patients in the whole cohort had died, respectively, and were excluded by landmark analysis. Overall survival was calculated from the date of first imaging showing advanced pancreatic cancer. The log-rank test was used to test for a survival difference between groups
Addressing the “waiting time paradox”: correlation of CA 19-9 with TTI and characterization of patients with a TTI > 60 days
When studying the potential relation between TTI and prognosis it is important to address the “waiting time paradox” (Neal et al. 2015). This paradox refers to studies reporting improved survival in cancer patients with prolonged TTI. The most likely explanation for this paradox is that therapy is initiated more promptly in patients with adverse prognosis caused by aggressive tumor biology or high tumor burden (Crawford et al. 2002). In PC, tumor burden and prognosis closely correlate with serum levels of CA 19-9 (Haas et al. 2013; Sakahara et al. 1986). We therefore correlated serum levels of CA 19-9 with TTI (Fig. 3). Using a Spearman correlation analysis, we did not find any significant correlation between CA 19-9 and TTI (p = 0.17). Further, we performed an explorative analysis of baseline characteristics for patients with a markedly prolonged TTI (more than 60 days) (Supplementary Table 1). Interestingly, more patients with locally advanced PC had a very long TTI (compared to patients with metastatic PC).
Fig. 3.
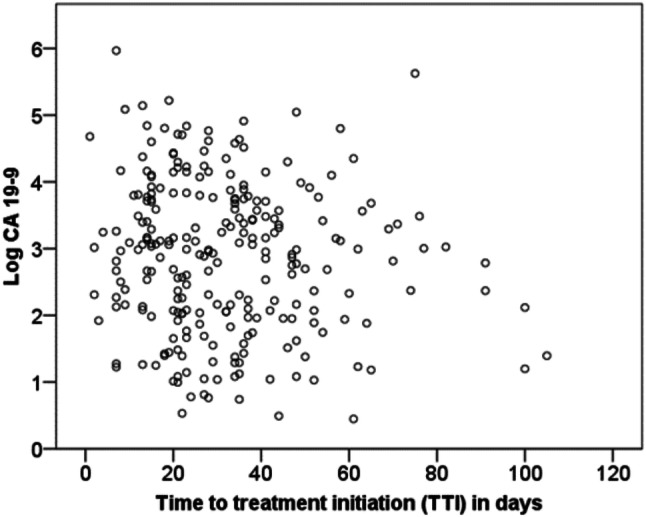
Correlation of CA 19-9 with time to treatment initiation (TTI). Levels of CA 19-9 determined prior to initiation of palliative chemotherapy are plotted against TTI for individual patients (n = 262). CA 19-9 levels are shown using a logarithmic scale
Discussion
To the best of our knowledge, we report the first analysis of TTI in advanced PC controlled for lead time bias and waiting-time paradox. After extensive analysis of our data, we neither found an indicator for a strong prognostic effect of TTI on progression-free or overall survival nor clear evidence for a potential bias caused by lead time bias or the waiting time paradox. Further, we provide data on reasons for treatment delay and a detailed characterization of patients with prolonged TTI.
Median TTI in our study was 29 days. This is longer than we expected prior to the initiation of our study (our predefined cutoff for treatment delay was 21 days). We identified four other studies that reported TTI in advanced PC patients (Abdel-Rahman et al. 2018; Jooste et al. 2016; Lee et al. 2019; Suzuki et al. 2019). In the most recent study, median TTI for patients with advanced PC was reported to be only 14 days, but the definition of TTI differed from the one used in our study (Lee et al. 2019). Definitions of total TTI were comparable between the three remaining reports and our study (Abdel-Rahman et al. 2018; Jooste et al. 2016; Suzuki et al. 2019). Median total TTI in those studies was similar to the TTI interval in our patient cohort (27.5, 29 and 33 days). This is especially remarkable because the three studies investigated patient cohorts from completely different health care systems (France, Japan and Canada, respectively) (Abdel-Rahman et al. 2018; Jooste et al. 2016; Suzuki et al. 2019).
In our cohort, the two most prevalent reasons for treatment delay were referral from an external treatment center and the necessity to perform a second biopsy. Referral from a non-specialized (e.g. community) hospital to a high-volume comprehensive cancer center has been previously reported as a common factor for prolonged TTI in different cancer types including PC (Khorana et al. 2019; Murphy et al. 2016; Murphy et al. 2015). For resectable PC a prolonged TTI correlates with an adverse prognosis for patients treated at low but not high volume cancer centers (Yun et al. 2012). Because of the monocentric design of our study, it is unclear, whether the effect of TTI in advanced PC does also vary between low- and high-volume cancer centers. It is therefore important to note that our results should be only translated with caution to patients exclusively treated at tertiary centers. For patients transferred from local hospitals to high-volume cancer centers, the absence of a strong correlation between TTI and prognosis in our study is reassuring. Prognosis of advanced PC has been reported to depend on size of the treating cancer center (Faluyi et al. 2017). If possible, advanced PC patients should therefore be referred to a specialized cancer center irrespective of a possible TTI prolongation.
It was previously reported by Jooste and co-workers that TTI is not related to an adverse prognosis in advanced PC (Jooste et al. 2016). Several important limitations of this study were later highlighted in a letter from Pitter and colleagues, including the use of a single cut-off for TTI and a complex multivariate regression model including both patients with resectable as well as advanced PC (Pitter et al. 2018). Similar limitations can be found in more recent studies on the correlation between TTI and prognosis in advanced PC (Abdel-Rahman et al. 2018; Lee et al. 2019; Suzuki et al. 2019). Using an isolated cohort of advanced PC patients, we did not find a correlation between prognosis and TTI for different cut-offs, including a markedly prolonged TTI (90th percentile or 60 days).
Besides the aforementioned limitations, studies on the prognostic significance of TTI are also prone to the waiting time paradox. The waiting time paradox was first described for patients with endometrial cancer (Crawford et al. 2002). For advanced PC a recent study focusing on the use of different chemotherapeutic regimens in Europe also reported an improved outcome for patients with longer treatment delay upon univariate but not multivariate analysis, highlighting a similar risk of bias for studies on advanced PC (Javed et al. 2019). Possible explanations for the waiting time paradox include also a lead time bias where patients with a very poor prognosis will be excluded from the study if they die before treatment initiation. However, if treatment is initiated rapidly in those patients with a very poor prognosis, they will appear in the group of patients with short TTI and pose a potential risk for bias. A further explanation for the waiting time paradox could be the implicit attempt of clinicians to treat patients with a high tumor burden (and already apparent physical impairment) in a timelier manner than less symptomatic patients. Using a landmark analysis, a correlation of tumor marker levels with TTI and an explorative comparison of patient characteristics for patients with different TTI intervals we did not find any strong evidence for bias in our study. It must, however, be noted that we found some imbalances in patients characteristics according to TTI: patients with a relapse after surgery in curative intent (where a repeated histological confirmation of PC relapse is currently no standard) started chemotherapy in a more timely manner than patients with primary metastatic disease and in the subgroup of patients with a very long TTI (90th percentile or 60 days) patients with locally advanced PC were overrepresented. Due to the small number of patients in these subgroups and the explorative nature of our analyses, these results should be interpreted with caution and no definite conclusion on a potential hazard for bias can be drawn. In accordance with previous studies mentioned above, our study indicates the absence of a strong correlation between TTI and an adverse prognosis in advanced PC (Abdel-Rahman et al. 2018; Jooste et al. 2016; Lee et al. 2019; Suzuki et al. 2019).
Our study has several limitations, most important its retrospective and monocentric design with a limited number of patients. Further, due to the presence of an imbalance in the subgroup of patients with a very long TTI, it remains unclear whether a very long TTI negatively affects treatment outcome. However, we believe that our study is of important value for the daily clinical management of advanced PC patients. While a timely work-up of advanced PC patients remains important, delays in treatment due to biopsies, inclusion in a clinical study or transfer to a specialized cancer center appear to be justified in light of the absence of a strong adverse effect of prolonged TTI on prognosis. Specifically in locally advanced PC obtaining a tumor specimen (e.g. by endoscopic ultrasound-guided needle biopsy) can be technically difficult and in some cases repeating the procedure may be necessary for cytological or histological disease confirmation. Additionally, obtaining tissue for molecular analyses becomes more and more important in PC. When discussing risks and benefits of such procedures with our patients including the participation in clinical trials where for example a central biomarker assessment (that causes a delay in TTI) is necessary for study inclusion the presented data may add evidence that some delay in TTI may be acceptable and may not lead to an impairment of the patient’s prognosis regarding progression-free and overall survival.
Electronic supplementary material
Below is the link to the electronic supplementary material.
Suppl. Figure 1 Progression-free survival (PFS) according to time to treatment initiation (TTI). Data on PFS was available for 268 patients. Patients were divided into groups according to different cutoffs for TTI (median TTI, 75th and 90th percentile). After 29, 43 and 60 days one, three and four patients in the whole cohort had died, respectively, and were excluded by landmark analysis. Progression-free survival was calculated from the date of first imaging showing advanced pancreatic cancer. The log-rank test was used to test for a survival difference between groups. (EPS 112 kb)
Author contribution
Writing of the manuscript and conception of the study: SK and SB. Assistance in writing the manuscript: SebK. Data analysis: SK, KS and AC. Analysis of tumor material (to confirm diagnosis of PC): SO, TK. Inclusion of patients: SK, MH, JS, JM, JGDH, WGK, JR, MI, LG, CBW, MvB, JW, VH, SB.
Funding
Stephan Kruger is supported by the “Else Kröner-Forschungskolleg: Cancer Immunotherapy”.
Data availability
Not applicable.
Compliance with ethical standards
Conflict of interest
The authors declare no conflict of interest.
Ethical approval
The study was approved by the local ethics committee of Ludwig-Maximilians-University of Munich (approval number 134-15). The study was performed in accordance with the Declaration of Helsinki.
Informed consent
Not applicable.
Footnotes
Publisher's Note
Springer Nature remains neutral with regard to jurisdictional claims in published maps and institutional affiliations.
References
- Abdel-Rahman O, Xu Y, Tang PA, Lee-Ying RM, Cheung WY (2018) A real-world, population-based study of patterns of referral, treatment, and outcomes for advanced pancreatic cancer. Cancer Med 7:6385–6392. 10.1002/cam4.1841 [DOI] [PMC free article] [PubMed] [Google Scholar]
- Conroy T et al (2011) FOLFIRINOX versus gemcitabine for metastatic pancreatic cancer. N Engl J Med 364:1817–1825. 10.1056/NEJMoa1011923 [DOI] [PubMed] [Google Scholar]
- Crawford SC, Davis JA, Siddiqui NA, de Caestecker L, Gillis CR, Hole D, Penney G (2002) The waiting time paradox: population based retrospective study of treatment delay and survival of women with endometrial cancer in Scotland. BMJ 325:196 [DOI] [PMC free article] [PubMed] [Google Scholar]
- Faluyi OO, Connor JL, Chatterjee M, Ikin C, Wong H, Palmer DH (2017) Advanced pancreatic adenocarcinoma outcomes with transition from devolved to centralised care in a regional Cancer Centre. Br J Cancer 116:424–431. 10.1038/bjc.2016.406 [DOI] [PMC free article] [PubMed] [Google Scholar]
- Ferlay J et al (2013) Cancer incidence and mortality patterns in Europe: estimates for 40 countries in 2012. Eur J Cancer 49:1374–1403. 10.1016/j.ejca.2012.12.027 [DOI] [PubMed] [Google Scholar]
- Glant JA et al (2011) Does the interval from imaging to operation affect the rate of unanticipated metastasis encountered during operation for pancreatic adenocarcinoma? Surgery 150:607–616. 10.1016/j.surg.2011.07.048 [DOI] [PubMed] [Google Scholar]
- Gobbi PG, Bergonzi M, Comelli M, Villano L, Pozzoli D, Vanoli A, Dionigi P (2013) The prognostic role of time to diagnosis and presenting symptoms in patients with pancreatic cancer. Cancer Epidemiol 37:186–190. 10.1016/j.canep.2012.12.002 [DOI] [PubMed] [Google Scholar]
- Haas M et al (2013) Prognostic value of CA 19-9, CEA, CRP, LDH and bilirubin levels in locally advanced and metastatic pancreatic cancer: results from a multicenter, pooled analysis of patients receiving palliative chemotherapy. J Cancer Res Clin Oncol 139:681–689. 10.1007/s00432-012-1371-3 [DOI] [PMC free article] [PubMed] [Google Scholar]
- Javed MA et al (2019) Impact of intensified chemotherapy in metastatic pancreatic ductal adenocarcinoma (PDAC) in clinical routine in Europe. Pancreatology 19:97–104. 10.1016/j.pan.2018.10.003(Official journal of the International Association of Pancreatology) [DOI] [PubMed] [Google Scholar]
- Jooste V, Dejardin O, Bouvier V, Arveux P, Maynadie M, Launoy G, Bouvier AM (2016) Pancreatic cancer: wait times from presentation to treatment and survival in a population-based study. Int J Cancer 139:1073–1080. 10.1002/ijc.30166 [DOI] [PubMed] [Google Scholar]
- Khorana AA et al (2019) Time to initial cancer treatment in the United States and association with survival over time: an observational study. PloS One 14:e0213209. 10.1371/journal.pone.0213209 [DOI] [PMC free article] [PubMed] [Google Scholar]
- Lee SH et al (2019) Association of time interval between cancer diagnosis and initiation of palliative chemotherapy with overall survival in patients with unresectable pancreatic cancer. Cancer Med. 10.1002/cam4.2254 [DOI] [PMC free article] [PubMed] [Google Scholar]
- Murphy CT, Galloway TJ, Handorf EA, Wang L, Mehra R, Flieder DB, Ridge JA (2015) Increasing time to treatment initiation for head and neck cancer: an analysis of the National Cancer Database. Cancer 121:1204–1213. 10.1002/cncr.29191 [DOI] [PubMed] [Google Scholar]
- Murphy CT et al (2016) Survival impact of increasing time to treatment initiation for patients with head and neck cancer in the United States. J Clin Oncol 34:169–178. 10.1200/JCO.2015.61.5906 [DOI] [PMC free article] [PubMed] [Google Scholar]
- Neal RD et al (2015) Is increased time to diagnosis and treatment in symptomatic cancer associated with poorer outcomes? Systematic review. Br J Cancer 112(Suppl 1):S92–S107. 10.1038/bjc.2015.48 [DOI] [PMC free article] [PubMed] [Google Scholar]
- Pitter JG, Lukacs G, Csanadi M, Voko Z (2018) Clinical impact of treatment delay in pancreatic cancer patients revisited. Int J Cancer 142:2621–2622. 10.1002/ijc.31263 [DOI] [PubMed] [Google Scholar]
- Quante AS et al (2016) Projections of cancer incidence and cancer-related deaths in Germany by 2020 and 2030. Cancer Med 5:2649–2656. 10.1002/cam4.767 [DOI] [PMC free article] [PubMed] [Google Scholar]
- Rahib L, Smith BD, Aizenberg R, Rosenzweig AB, Fleshman JM, Matrisian LM (2014) Projecting cancer incidence and deaths to 2030: the unexpected burden of thyroid, liver, and pancreas cancers in the United States. Cancer Res 74:2913–2921. 10.1158/0008-5472.can-14-0155 [DOI] [PubMed] [Google Scholar]
- Raptis DA, Fessas C, Belasyse-Smith P, Kurzawinski TR (2010) Clinical presentation and waiting time targets do not affect prognosis in patients with pancreatic cancer. Surgeon 8:239–246. 10.1016/j.surge.2010.03.001(Journal of the Royal Colleges of Surgeons of Edinburgh and Ireland) [DOI] [PubMed] [Google Scholar]
- Sakahara H et al (1986) Serum CA 19-9 concentrations and computed tomography findings in patients with pancreatic carcinoma. Cancer 57:1324–1326 [DOI] [PubMed] [Google Scholar]
- Sanjeevi S et al (2015) Impact of delay between imaging and treatment in patients with potentially curable pancreatic cancer. Br J Surg. 10.1002/bjs.10046 [DOI] [PubMed] [Google Scholar]
- Sauerbrei W, Taube SE, McShane LM, Cavenagh MM, Altman DG (2018) Reporting recommendations for tumor marker prognostic studies (REMARK): an abridged explanation and elaboration. J Natl Cancer Inst 110:803–811. 10.1093/jnci/djy088 [DOI] [PMC free article] [PubMed] [Google Scholar]
- Siegel RL, Miller KD, Jemal A (2015) Cancer statistics, 2015. CA Cancer J Clin 65:5–29. 10.3322/caac.21254 [DOI] [PubMed] [Google Scholar]
- Suzuki R et al (2019) An observation study of the prognostic effect of waiting times in the management of pancreatic ductal adenocarcinoma. Oncol Lett 17:587–593. 10.3892/ol.2018.9626 [DOI] [PMC free article] [PubMed] [Google Scholar]
- Von Hoff DD et al (2013) Increased survival in pancreatic cancer with nab-paclitaxel plus gemcitabine. N Engl J Med 369:1691–1703. 10.1056/NEJMoa1304369 [DOI] [PMC free article] [PubMed] [Google Scholar]
- Yu J, Blackford AL, Dal Molin M, Wolfgang CL, Goggins M (2015) Time to progression of pancreatic ductal adenocarcinoma from low-to-high tumour stages. Gut 64:1783–1789. 10.1136/gutjnl-2014-308653 [DOI] [PMC free article] [PubMed] [Google Scholar]
- Yun YH et al (2012) The influence of hospital volume and surgical treatment delay on long-term survival after cancer surgery. Ann Oncol 23:2731–2737. 10.1093/annonc/mds101 [DOI] [PubMed] [Google Scholar]
Associated Data
This section collects any data citations, data availability statements, or supplementary materials included in this article.
Supplementary Materials
Suppl. Figure 1 Progression-free survival (PFS) according to time to treatment initiation (TTI). Data on PFS was available for 268 patients. Patients were divided into groups according to different cutoffs for TTI (median TTI, 75th and 90th percentile). After 29, 43 and 60 days one, three and four patients in the whole cohort had died, respectively, and were excluded by landmark analysis. Progression-free survival was calculated from the date of first imaging showing advanced pancreatic cancer. The log-rank test was used to test for a survival difference between groups. (EPS 112 kb)
Data Availability Statement
Not applicable.