

Abstract
Purpose
Lung cancer has the highest morbidity and mortality among all cancer types. Reliable prognostic biomarkers are needed to identify high-risk patients apart from TNM system for precision medicine. The present study is designed to identify robust prognostic biomarkers in lung adenocarcinoma (LUAD) based on integration of multiple GEO datasets, The Cancer Genome Atlas (TCGA) database and Clinical Proteomic Tumor Analysis Consortium (CPTAC) database.
Methods
Four LUAD GEO datasets (GSE10072, GSE2514, GSE43458, and GSE32863) and TCGA database were implemented to analyze the differently expressed genes (DEGs). Gene ontology, KEGG pathway, and protein–protein interaction network (PPI) were conducted based on the above DEGs. Hub genes were selected based on connectivity degree in the PPI network. Expression analysis and Kaplan–Meier survival analysis were conducted in CPTAC lung adenocarcinomas cohort. Kaplan–Meier survival analysis and Cox proportional hazards regression were performed on these hub genes using TCGA and our own cohort.
Results
A total of 430 shared genes in all five datasets were identified as DEGs. Based on their PPI network, nine hub genes were selected and all of them were significantly associated with overall survival using GEPIA analysis. Two hub genes, TOP2A and UBE2C, were further combined and showed poorer prognosis in both TCGA dataset and our validated cohort. Analysis in CPTAC revealed that TOP2A and UBE2C were significantly highly expressed in tumor sample. Multivariable analysis suggested TOP2A and UBE2C as independent prognostic factors in LUAD.
Conclusion
Using data mining approach, we identified TOP2A and UBE2C as two robust prognostic factors in LUAD. We also demonstrated the TOP2A/UBE2C co-expression status in LUAD, and TOP2A/UBE2C co-expression correlated with poorer prognosis. More in-depth research is needed for transforming this result into clinical setting.
Electronic supplementary material
The online version of this article (10.1007/s00432-020-03147-4) contains supplementary material, which is available to authorized users.
Keywords: Lung adenocarcinoma, TOP2A, UBE2C, Prognosis, Biomarker
Purpose
Non-small cell lung cancer (NSCLC) accounts for 85% of all lung cancer (Siegel et al. 2018), which has the highest morbidity and mortality among all cancer types (Chen et al. 2016; Siegel et al. 2015). Given the intrinsic heterogeneity and difficulties in treatment of progressive of NSCLC, it’s reasonable to identify more biomarkers to estimate disease prognosis which can in turn guider further interventions (Jamal-Hanjani et al. 2017; Rolfo et al. 2017). In current clinical practice, treatment decisions for NSCLC patients mainly depend on the American Joint Committee on Cancer (AJCC) staging system which is developed by large cohorts and recognized as the very by far the very best predicting system of prognosis for NSCLC patients up to now (Goldstraw et al. 2016; Travis et al. 2016; Eberhardt et al. 2015). However, it has certain deficiencies in some subsets of patients. For example, the 5-year survival of stage I patients ranged from 50 to 76%, which means great difference of prognosis still exist even with same stage (Asamura et al. 2015). Thus, identification of prognostic biomarkers would provide great help for guiding management of NSCLC.
The reduction of gene sequence cost and availability of open-access databases bring great opportunities to identified reliable biomarker for lung cancer (Meyerson et al. 2010; Ozsolak and Milos 2011; Stark et al. 2019; Byron et al. 2016). Several studies have put forward gene expression-based biomarkers (Gao et al. 2016; Li et al. 2017; Wang et al. 2019; Zheng et al. 2019; Huang et al. 2019; Su et al. 2019). However, none of these results has been sufficiently validated and incorporated into routine clinical practice. There are some possible reasons that lead to such failures. First, NSCLCs contain several cancer types, including adenocarcinomas (LUADs), squamous cell cancers (LUSCs), and large cell cancers. Although latest guidelines still consider NSCLC as a tumor classification benchmark (Osmani et al. 2018), several studies revealed great distinctions at transcriptomics, genomics, and histopathology between LUAD and LUSC (Relli et al. 2019; Kalemkerian et al. 2018; Rybarczyk-Kasiuchnicz and Ramlau 2018; Bui et al. 2018). Thence, investigating these subgroups separately may be more effective. Second, a few studies utilized relatively small sample size as discovery cohort and lack of extrapolation. The above problems can partly be solved by effectively integrating public resources for biomarker discover and validation in independent cohorts.
The purpose of the present study was to develop robust prognostic mRNA markers in LUAD. Multiple gene expression datasets were combined to the identified co-existing differential expression genes and two hub genes (TOP2A and UBE2C) were concentrated by implementing several bioinformatic tools. Then, the prognostic values of TOP2A and UBE2C were evaluated in TCGA database, CPTAC database, and validated in our own LUAD cohort. Moreover, we also demonstrated the TOP2A/UBE2C co-expression status in LUAD, and TOP2A/UBE2C co-expression correlated with poorer prognosis. The result provided improvement of LUAD prognostic estimation and revealed potential targets for further research.
Methods
Differential expression gene analysis
Four datasets from GEO database (GSE10072, GSE2514, GSE43458, and GSE32863) and TCGA database were enrolled to identify the high confidence differential expression gene (DEG) in lung adenocarcinoma at the tissue level. The four GEO datasets were analyzed by GEO2R online, adjustment p values < 0.01 (Benjamini & Hochberg) and fold change > 1.5 as the key parameters to select DEGs for each datasets. The Mann–Whitney U test was used to identify the DEGs for the TCGA dataset, also with the p values < 0.01 and fold change > 1.5. Only the DEGs appeared in all of the five datasets and with the same trend were taken as the high confidence differential expression genes.
Gene Ontology (GO) and KEGG enrichment analysis
Gene ontology (GO) enrichment analysis and KEGG pathway analysis of the DEGs were implemented by the clusterProfiler developed by Yu et al. (2012), which is a R package used for analyze and visualize functional profiles of genomic coordinates. KEGG (Kotera et al. 2004) is a database resource for understanding high-level functions and utilities of the biological system, such as the cell, the organism and the ecosystem, from molecular-level information, especially large-scale molecular datasets generated by genome sequencing and other high-throughput experimental technologies (https://www.genome.jp/kegg/).The clusterProfiler package employs the latest online data from https://www.genome.jp/kegg/catalog/org_list.html.
PPI network construction and hub gene identification
The PPI network of DEGs was analyzed on The STRING database (https://string-db.org/). Interactions with the minimum required interaction score > 0.7 were taken as the high confidence interactions. Cytoscape (version 3.7.2) was used to visualize the PPI network, and the hub genes were identified using the CytoHubba plug-in (degree ≥ 24).
Hub gene expression analysis and survival analysis based on GEPIA and the Kaplan–Meier plotter
GEPIA (Tang et al. 2017) is a web server for analyzing the RNA sequencing expression data of 9736 tumors and 8587 normal samples from the TCGA and the GTEx projects, using a standard processing pipeline. In the present study, GEPIA database was exploited to compare hub gene expressions between LUAD and normal lung tissues. In addition, overall survival (OS) analysis based on these gene expressions and correlation analysis between TOP2A and UBE2C were conducted on GEPIA.
Expression and survival analysis of TOP2A and UBE2C in CPTAC
CPTAC (https://proteomics.cancer.gov/data-portal) is a centralized repository contained proteomic sequence datasets and clinical data for multiple cancers. LUAD proteome dataset with corresponding clinical information was downloaded from CPTAC. Unshared log-ratio values of TOP2A and UBE2C were extracted from both tumor and normal samples. Co-expression and survival analysis were conducted with these two genes.
Patients
A total of 578 patients with LUAD who underwent R0 resection between June 2006 and June 2014 at the National Cancer Center/Cancer Hospital, Chinese Academy of Medical Sciences (NCC cohort). All patients provided informed consent before surgery. The clinicopathological data, including age, gender, tumor location, tumor differentiation status, T stage, lymph node metastasis, and TNM stage of LUAD patients were recorded. All of the specimens were pathologically confirmed by two pathologists. The pathological classification of the primary tumor and the degree of lymph node metastasis were confirmed according to the eighth TNM stage. The study was conducted in accordance with the Declaration of Helsinki. The Clinical Research Ethics Committee of National Cancer Center/Cancer Hospital, CAMS approved this study. The patients were followed up in the outpatient department every 3 months for the first 2 years after surgery and then annually. The follow-up included documentation of the patients’ medical history, physical examinations, and chest computed tomography. The last follow-up was on March 4, 2019.
Tissue microarrays (TMAs) and immunohistochemical analysis
The TMAs were constructed by tissue blocks of 578 cases from biobank of our hospital. A serial of 4-μm-thick sections were cut and transferred to adhesive slides according to manufacturer’s instructions. Then, immunohistochemical staining was performed on the TMAs and using an anti-UBE2C polyclonal antibody (1:1000, HPA054975, Sigma-Aldrich, St Louis, MO, USA) or an anti-TOP2A antibody (1:200, HPA006458, Sigma-Aldrich, St Louis, MO, USA) at 4 °C overnight and then incubated with polyclonal peroxidase-conjugated anti-rabbit IgG (Zhongshanjinqiao, Beijing, China) at room temperature for 20 min according to the manufacturer's instructions. Two experienced pathologists who were blinded to the clinical data independently scored each tissue sample based on the percentage of tumor cells stained and staining intensity, range from 0 to 3. The scoring distribution is defined as the following: 0–1 negative staining, 2–3 positive staining.
Statistical analysis
All statistical analyses were performed using R (version 3.5.3; https://www.r-project.org/). Prognostic value of gene expression was evaluated using log-rank test and Kaplan–Meier curves were displayed. Chi-square test and Wilcoxon test were used to analyze the relationship between gene expression and LUAD clinicopathological features. Co-expression survival analysis was conducted in TCGA LUAD dataset using the median of gene expression as the grouping threshold. Univariate and multivariate analysis were performed using Cox proportional hazards regression model to identify significant factors. p < 0.05 was considered statistically significant.
Results
Identification of DEGs
Four gene expression profiles (GSE10072, GSE2514, GSE43458, and GSE32863) and TCGA database were selected in the present study. Among them, GSE10072 contained 58 LUAD samples and 49 normal samples, GSE2514 contained 19 LUAD samples and 20 normal samples, GSE43458 contained 80 LUAD samples and 30 normal samples, and GSE32863 included 60 LUAD samples and 60 normal samples (Table 1).
Table 1.
Statistics of the four microarray databases derived from the GEO databases
| Dataset | LUAD | Normal | Platform | Type |
|---|---|---|---|---|
| GSE10072 | 49 | 58 | Affymetrix Human Genome U133A Array | Expression profiling by array |
| GSE2514 | 19 | 20 | GPL81 HG_ | Expression profiling by array |
| GSE43458 | 80 | 30 | Affymetrix Human Gene 1.0 ST Array | Expression profiling by array |
| GSE32863 | 60 | 60 | Illumina HumanWG-6 v3.0 expression beadchip | Expression profiling by array |
Compared with the normal samples, 430 DEGs were significantly differentially expressed among all four databases, of which 128 were significantly upregulated genes and 302 were downregulated (Fig. 1).
Fig. 1.
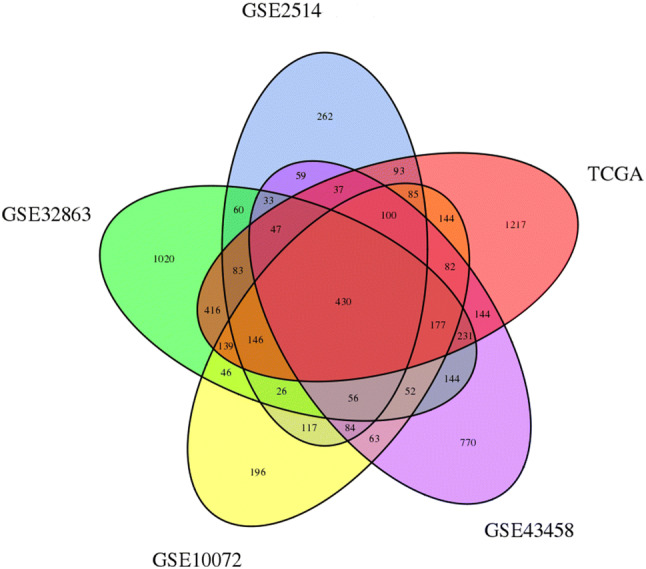
Venn diagram showing the overlapped DEGs in four databases. DEGs differentially expressed genes
Functional enrichment analyses of DEGs
GO function and KEGG pathway enrichment analysis were performed to reveal the functions and mechanisms of the 430 DEGs (Fig. 2a, Table 2). The enriched GO terms were divided into BP, CC, and MF ontologies. The results of GO analysis showed that DEGs were mainly enriched in BP term, including extracellular matrix organization, extracellular structure organization, response to oxygen levels, circulatory system process, cell-substrate adhesion, regulation of body fluid levels, response to decreased oxygen levels, response to hypoxia, blood circulation, renal system development etc. CC analysis indicated that the DEGs were significantly enriched in extracellular matrix, collagen-containing extracellular matrix, focal adhesion, cell-substrate adherens junction, cell-substrate junction, cytoplasmic vesicle lumen, vesicle lumen, extracellular matrix component, external side of plasma membrane, collagen trimer etc. MF analysis showed that the DEGs were significantly enriched in growth factor binding, extracellular matrix structural constituent, cell adhesion molecule binding, glycosaminoglycan binding, heparin binding, sulfur compound binding, transmembrane receptor protein kinase activity, transforming growth factor beta binding, peptidase regulator activity and integrin binding. In addition, the results of KEGG pathway analysis demonstrated that the 430 DEGs were mainly enriched in 13 pathways including PI3K–Akt signaling pathway, focal adhesion, ECM–receptor interaction, amoebiasis, FoxO signaling pathway, protein digestion and absorption, leukocyte transendothelial migration, complement and coagulation cascades, and African trypanosomiasis.
Fig. 2.

The results of the GO and pathway enrichment analyses of the overlapping DEGs. a Top ten Go terms in cellular components, biological processes, and molecular function. b KEGG pathway the DEGs significantly enriched in. DEGs differentially expressed genes, BP biological process, CC cellular component, MF molecular function, KEGG Kyoto Encyclopedia of Genes and Genomes, GO gene ontology
Table 2.
Significantly enriched GO terms and KEGG pathways of DEGs
| Category | Term | Description | n | Adjusted p value |
|---|---|---|---|---|
| BP term | GO:0030198 | Extracellular matrix organization | 44 | 5.11E−17 |
| BP term | GO:0043062 | Extracellular structure organization | 47 | 5.11E−17 |
| BP term | GO:0070482 | Response to oxygen levels | 34 | 1.56E−09 |
| BP term | GO:0003013 | Circulatory system process | 41 | 1.56E−09 |
| BP term | GO:0031589 | Cell-substrate adhesion | 33 | 1.98E−09 |
| BP term | GO:0050878 | Regulation of body fluid levels | 40 | 2.46E−09 |
| BP term | GO:0036293 | Response to decreased oxygen levels | 32 | 2.46E−09 |
| BP term | GO:0001666 | Response to hypoxia | 31 | 4.41E−09 |
| BP term | GO:0008015 | Blood circulation | 39 | 7.12E−09 |
| BP term | GO:0072001 | Renal system development | 28 | 4.55E−08 |
| CC term | GO:0031012 | Extracellular matrix | 47 | 5.09E−15 |
| CC term | GO:0062023 | Collagen-containing extracellular matrix | 35 | 2.64E−12 |
| CC term | GO:0005925 | Focal adhesion | 31 | 1.61E−07 |
| CC term | GO:0005924 | Cell-substrate adherens junction | 31 | 1.61E−07 |
| CC term | GO:0030055 | Cell-substrate junction | 31 | 1.63E−07 |
| CC term | GO:0060205 | Cytoplasmic vesicle lumen | 26 | 1.92E−06 |
| CC term | GO:0031983 | Vesicle lumen | 26 | 1.92E−06 |
| CC term | GO:0044420 | Extracellular matrix component | 10 | 4.46E−06 |
| CC term | GO:0009897 | External side of plasma membrane | 25 | 1.70E−05 |
| CC term | GO:0005581 | Collagen trimer | 12 | 1.70E−05 |
| MF term | GO:0019838 | Growth factor binding | 25 | 8.78E−13 |
| MF term | GO:0005201 | Extracellular matrix structural constituent | 22 | 4.45E−09 |
| MF term | GO:0050839 | Cell adhesion molecule binding | 39 | 4.93E−09 |
| MF term | GO:0005539 | Glycosaminoglycan binding | 25 | 1.55E−08 |
| MF term | GO:1901681 | Sulfur compound binding | 22 | 7.34E−06 |
| MF term | GO:0008201 | Heparin binding | 18 | 7.34E−06 |
| MF term | GO:0019199 | Transmembrane receptor protein kinase activity | 12 | 3.72E−05 |
| MF term | GO:0050431 | Transforming growth factor beta binding | 7 | 3.90E−05 |
| MF term | GO:0061134 | Peptidase regulator activity | 19 | 8.47E−05 |
| MF term | GO:0005178 | Integrin binding | 14 | 0.000 |
| KEGG | hsa04974 | Protein digestion and absorption | 12 | 0.013 |
| KEGG | hsa04510 | Focal adhesion | 18 | 0.013 |
| KEGG | hsa04512 | ECM–receptor interaction | 11 | 0.013 |
| KEGG | hsa04610 | Complement and coagulation cascades | 10 | 0.017 |
| KEGG | hsa05144 | Malaria | 7 | 0.038 |
| KEGG | hsa04926 | Relaxin signaling pathway | 12 | 0.038 |
| KEGG | hsa04670 | Leukocyte transendothelial migration | 11 | 0.038 |
| KEGG | hsa05143 | African trypanosomiasis | 6 | 0.038 |
| KEGG | hsa04068 | FoxO signaling pathway | 12 | 0.038 |
| KEGG | hsa04151 | PI3K–Akt signaling pathway | 23 | 0.039 |
| KEGG | hsa04933 | AGE–RAGE signaling pathway in diabetic complications | 10 | 0.040 |
| KEGG | hsa05146 | Amoebiasis | 10 | 0.040 |
| KEGG | hsa00360 | Phenylalanine metabolism | 4 | 0.040 |
| KEGG | hsa05418 | Fluid shear stress and atherosclerosis | 12 | 0.040 |
PPI network construction and hub gene identification
A total of 154 nodes and 529 edges were involved in the PPI network, as presented in Fig. 3a. The top nine genes evaluated by connectivity degree in the PPI network were identified (Table 3). The results showed that cyclin-dependent kinases 1 (CDK1) was the most outstanding gene with connectivity degree = 28, followed by ubiquitin conjugating enzyme E2 C (UBE2C; degree = 25), cyclin B1 (CCNB1; degree = 21), DNA topoisomerase II alpha (TOP2A; degree = 24), kinesin family member 11 (KIF11; degree = 24), aurora kinase B (AURKB; degree = 24), cell division cycle 20 (CDC20; degree = 24), cyclin B2 (CCNB2; degree = 24), and cyclin A2 (CCNA2; degree = 24). These nine hub genes can form a module and all of them were upregulated in LUAD (Fig. 3b).
Fig. 3.

Protein–protein interaction network constructed with the DEGs. a The PPI network constructed by 430 DEGs. b Top nine genes with high degree calculated by cytoHubba (degree > 24). DEGs differentially expressed genes. Note: red nodes represent upregulated genes, and blue nodes represent downregulated genes. More red color represents higher degree
Table 3.
Top nine hub genes with higher degree of connectivity
| Gene symbol | Gene description | Degree |
|---|---|---|
| CDK1 | Cyclin dependent kinase 1 | 28 |
| UBE2C | Ubiquitin Conjugating Enzyme E2 C | 25 |
| CCNB1 | Cyclin B1 | 25 |
| TOP2A | DNA Topoisomerase II Alpha | 24 |
| KIF11 | Kinesin family member 11 | 24 |
| AURKB | Aurora kinase B | 24 |
| CDC20 | Cell division cycle 20 | 24 |
| CCNB2 | Cyclin B2 | 24 |
| CCNA2 | Cyclin A2 | 24 |
Survival analysis of these nine hub genes in GEPIA database and the Kaplan–Meier plotter database
To investigate the prognostic values of these hub genes, the GEPIA bioinformatics analysis platform was used. A total of 478 lung adenocarcinoma patients were available for the analysis of overall survival. We found that high expression of all these hub genes was associated with unfavorable overall survival of LUAD patients (Fig. 4, Table 4).
Fig. 4.

Kaplan–Meier overall survival analyses for the top nine hub genes expressed in lung adenocarcinoma patients in GEPIA database. Note: see Table 2 for gene description
Table 4.
Multivariate cox regression analysis of overall survival (the Kaplan–Meier plotter mRNA lung cancer database)
| Gene symbol | Probe ID | Hazard ratio (HR) | p value |
|---|---|---|---|
| CDK1 | 2.3 (1.8–2.95) | 2.3 (1.8–2.95) | < 0.001 |
| UBE2C | 202954_at | 2.53 (1.97–3.23) | < 0.001 |
| CCNB1 | 214710_s_at | 2.04 (1.6–2.61) | < 0.001 |
| TOP2A | 201292_at | 1.76 (1.38–2.23) | < 0.001 |
| KIF11 | 204444_at | 1.23 (0.98–1.56) | < 0.001 |
| AURKB | 209464_at | 2.7 (2.1–3.46) | < 0.001 |
| CDC20 | 202870_s_at | 2.39 (1.87–3.05) | < 0.001 |
| CCNB1 | 214710_s_at | 2.04 (1.6–2.61) | < 0.001 |
| CCNA2 | 213226_at | 1.34 (1.06–1.69) | 0.014 |
Based on the mean fold change from four datasets, TOP2A and UBE2C displayed the richest variation among nine genes (Supplementary Table 1). In addition, no large-scale cohort study has been performed to demonstrate the prognostic value of TOP2A and UBE2C in LUAD patients. Thus, these two genes were selected for further verification. Expression analysis showed that TOP2A and UBE2C are significantly high expressed in 25 and 28 types of tumors, respectively (Fig. 5a, b). In pair-wise gene expression correlation analysis, GEPIA showed significantly large correlation (R = 0.8, p < 0.001) between these two gene expressions (Fig. 5c).
Fig. 5.

UBE2C and TOP2A expression analysis in 33 cancer type in GEPIA database. Note: red color represents significantly high expression in tumor. Green color represents significantly low expression in tumor. Black color represents non-significant expression between tumor and paired normal tissue
Correlations between UBE2C and TOP2A expression and clinical parameters in TCGA LUAD cohort
To explore the relationship between hub gene expression and clinical parameters, parameters including age, gender, race, smoke history, N stage, and pathological stage were extracted for analysis. As shown in Figs. 6 and 7, UBE2C and TOP2A expressions were significantly different in every global comparison (p < 2.2e−16). For two-group comparison setting “normal” as reference group, significantly higher expressions of UBE2C and TOP2A were observed in both male and female, smoker or non-smoker, every age range, race, and stage (p < 0.05). These results suggested that UBE2C and TOP2A were consistently highly expressed in LUAD in different subgroups.
Fig. 6.

The relationship between TOP2A expression and clinical parameters. Association between TOP2A expression and, a age, b gender, c race, d smoke history, e lymph node metastasis, f stage. *p < 0.05, **p < 0.01, ***p < 0.001
Fig. 7.

The relationship between UBE2C expression and clinical parameters. Association between UBE2C expression and, a age, b gender, c race, d smoke history, e lymph node metastasis, f stage. *p < 0.05, **p < 0.01, ***p < 0.001
UBE2C and TOP2A co-expression survival analysis, multivariate analysis, and correlation analysis with mutation in TCGA database
To explore the combined effect for prognostic prediction, the TCGA LUAD patients were first divided into four groups according to the relative expression level of UBE2C and TOP2A, we found significant (p < 0.01) difference with overall survival of LUAD patients between four groups (Fig. 8a). Further, we merged patients with at least one low expression gene into “other” group. The “co-expression” group was significantly (p = 0.028) associated with unfavorable overall survival compared with “other” group (Fig. 8b). To exclude the influence of other prognostic factors, we further conducted multivariate analysis considering TNM staging system. The result showed that both UBE2C and TOP2A were independent prognostic factors (p < 0.05) in the multivariate cox model (Tables 5 and 6).
Fig. 8.

Kaplan–Meier curves of overall survival in LUAD TCGA datasets. Patients are stratified by TOP2A and UBE2C expression (low vs high). a Overall survival analysis of four subgroups stratified by TOP2A and UBE2C expression; b overall survival analysis between TOP2A and UBE2C co-expression samples and others. c, d Association between TOP2A and UBE2C expression and EGFR status. e, f Association between TOP2A and UBE2C expression and KRAS status. g, h Association between TOP2A and UBE2C expression and ALK status. i, j Association between TOP2A and UBE2C expression and BRAF status. Both_H samples with both TOP2A and UBE2C high expression, both_L samples with both TOP2A and UBE2C low expression, H_L samples with TOP2A high expression and UBE2C low expression, L_H samples with TOP2A low expression and UBE2C high expression. Note: p values were calculated with the log-rank test
Table 5.
Multivariate cox regression analysis of TOP2A on TCGA LUAD overall survival
| Variables | Hazard ratio | 95% CI | p value |
|---|---|---|---|
| T | |||
| T1 vs T2 vs T3 vs T4 | 1.33 | 1.096–1.615 | 0.004 |
| N | |||
| N0 vs N1–3 | 2.252 | 1.659–3.059 | 0 |
| M | |||
| M0 vs M1 | 1.528 | 0.853–2.739 | 0.154 |
| TOP2A expression | 1.178 | 1.012–1.372 | 0.034 |
Table 6.
Multivariate cox regression analysis of UBE2C on TCGA LUAD overall survival
| Variables | Hazard ratio | 95% CI | p value |
|---|---|---|---|
| T | |||
| T1 vs T2 vs T3 vs T4 | 1.32 | 1.088–1.602 | 0.005 |
| N | |||
| N0 vs N1–3 | 2.225 | 1.637–3.025 | 0 |
| M | |||
| M0 vs M1 | 1.555 | 0.870–2.781 | 0.136 |
| UBE2C expression | 1.183 | 1.032–1.357 | 0.016 |
Additionally, the association between UBE2C and TOP2A expressions and key driver gene mutation were analyzed in TCGA LUAD cohort (Fig. 8c–j). The results showed that UBE2C was significantly highly expressed in EGFR-WT LUAD patients (p = 0.01) (Fig. 8d) and TOP2A was significantly highly expressed in ALK-mutated LUAD patients (p = 0.0035) (Fig. 8g). No significant relationship was observed between TOP2A and UBE2C expressions and KRAS mutation status and BRAF mutation status.
Protein analysis of UBE2C and TOP2A in CPTAC
To further verify the expression level of these two proteins, mass spectrometry data from 111 LUAD paired tissue were extracted. Both UBE2C and TOP2A showed significantly high expression in tumors compared with paired normal samples (Fig. 9a, b). For survival analysis, no statistical significance with overall survival of LUAD patients was observed. However, poor prognosis can be seen in the high expression group (Fig. 9c–e) of both gene which is consistent with the results in TCGA LUAD cohort. Correlation analysis in CPTAC again showed significantly large correlation (R = 0.8, p < 2.2e−16) of UBE2C and TOP2A (Fig. 9f). Thus, during multivariate analysis, these two genes were modeled separately.
Fig. 9.

Protein expression and survival analysis in CPTAC. a Expression of TOP2A in lung adenocarcinomas and paired normal tissue. b Expression of UBE2C in lung adenocarcinomas and paired normal tissue. c Overall survival analysis of TOP2A by Kaplan–Meier survival analysis (n = 104). d Overall survival analysis of UBE2C by Kaplan–Meier survival analysis (n = 104). e Overall survival analysis of TOP2A and UBE2C co-expression by Kaplan–Meier survival analysis (n = 104). f Correlation analysis of TOP2A and UBE2C expression using Spearman's coefficient
Correlations between UBE2C and TOP2A expression and clinicopathological parameters of LUAD patients in NCC cohort
The whole enrollment process was clearly shown in Fig. 10. Among these patients, 20 patients received preoperative chemotherapy and (or) radiotherapy; 15 patients had incomplete medical data; and 35 patients were lost to follow-up. Finally, our independent NCC cohort contained 578 LUAD patients in total.
Fig. 10.

The flowchart of the enrollment process
Immunohistochemical staining comparison of TOP2A and UBE2C between paired LUAD and adjacent normal tissues was performed to validate previous results. Both TOP2A and UBE2C were highly expressed in tumor which was consistent with the results in GEO and TCGA (Fig. 11a, b). Representative stained pictures of tumor and adjacent normal tissues were shown in Fig. 11c, f.
Fig. 11.

Comparison of gene expression between tumor and adjacent normal tissue. a Staining score of TOP2A in paired LUAD and adjacent normal tissue. b Staining score of UBE2C in paired LUAD and adjacent normal tissue. c, d Representative photomicrographs stained with TOP2A in LUAD and adjacent normal tissue. e, f Representative photomicrographs stained with UBE2C in LUAD and adjacent normal tissue
In Fig. 12, we illustrated the representing IHC staining of TOP2A or UBE2C in the specimens. The expression status of TOP2A measured by IHC was significantly associated with several parameters including gender (p = 0.007), smoking (p = 0.000), tumor length (p = 0.003), T stage (p = 0.000), N stage (p = 0.027), and TNM stage (p = 0.005) (Table 7). In addition, the expression status of UBE2C measured was significantly associated with gender (p = 0.007), smoking (p = 0.000), tumor length (p = 0.003), T stage (p = 0.000), N stage (p = 0.027), and TNM stage (p = 0.005) (Table 8).
Fig. 12.

Representative photomicrographs of lung adenocarcinoma (LUAD) TMA sections. a Representative photomicrographs stained with TOP2A which score = 0. b Representative photomicrographs stained with TOP2A which score = 1. c Representative photomicrographs stained with TOP2A which score = 2. d Representative photomicrographs stained with UBE2C which score = 3. e Representative photomicrographs stained with UBE2C which score = 0. f Representative photomicrographs stained with UBE2C which score = 1. g Representative photomicrographs stained with UBE2C which score = 2. h Representative photomicrographs stained with UBE2C which score = 3
Table 7.
Correlations between TOP2A expression and clinicopathological parameters of 578 patients with LUAD
| Category | Cases (number, %) | TOP2A expression | p value | |
|---|---|---|---|---|
| 578 (100%) | Low (315) | High (263) | ||
| Age (years) | 0.181 | |||
| ≤ 60 | 291 (50.3) | 167 | 124 | |
| > 60 | 287 (49.7) | 148 | 139 | |
| Gender | 0.007 | |||
| Male | 325 (56.2) | 161 | 164 | |
| Female | 253 (43.8) | 154 | 99 | |
| Smoking | 0 | |||
| Ever | 275 (47.6) | 126 | 149 | |
| Never | 303 (52.4) | 189 | 114 | |
| Tumor length (cm) | 0.003 | |||
| ≤ 4 | 395 (68.3) | 232 | 163 | |
| > 4 | 183 (31.7) | 83 | 100 | |
| Differentiation | 0.16 | |||
| Well | 117 (20.2) | 59 | 58 | |
| Moderate | 249 (43.1) | 147 | 102 | |
| Poor | 212 (36.7) | 109 | 103 | |
| T stage | 0 | |||
| T1 | 210 (36.3) | 135 | 75 | |
| T2 | 263 (45.5) | 139 | 124 | |
| T3 | 63 (10.9) | 22 | 41 | |
| T4 | 42 (7.3) | 19 | 23 | |
| N stage | 0.027 | |||
| N0 | 254 (43.9) | 154 | 100 | |
| N1 | 156 (27.0) | 80 | 76 | |
| N2 | 168 (29.1) | 81 | 87 | |
| TNM stage | 0.005 | |||
| I | 218 (37.7) | 135 | 83 | |
| II | 152 (26.3) | 84 | 68 | |
| III | 208 (45.5) | 96 | 112 | |
p < 0.05 is significant (Marked with bold values)
Table 8.
Correlations between UBE2C expression and clinicopathological parameters of 578 patients with LUAD
| Category | Cases (number, %) | UBE2C expression | p value | |
|---|---|---|---|---|
| 578 (100%) | Low (275) | High (303) | ||
| Age (years) | 0.004 | |||
| ≤ 60 | 291 (50.3) | 156 | 135 | |
| > 60 | 287 (49.7) | 119 | 168 | |
| Gender | 0 | |||
| Male | 325 (56.2) | 129 | 196 | |
| Female | 253 (43.8) | 146 | 107 | |
| Smoking | 0 | |||
| Ever | 275 | 106 | 169 | |
| Never | 303 | 169 | 134 | |
| Tumor length (cm) | 0.004 | |||
| ≤ 4 | 395 (68.3) | 204 | 191 | |
| > 4 | 183 (31.7) | 71 | 112 | |
| Differentiation | 0.007 | |||
| Well | 117 (20.2) | 54 | 63 | |
| Moderate | 249 (43.1) | 136 | 113 | |
| Poor | 212 (36.7) | 85 | 127 | |
| T stage | 0.003 | |||
| T1 | 210 (36.3) | 112 | 98 | |
| T2 | 263 (45.5) | 127 | 136 | |
| T3 | 63 (10.9) | 17 | 46 | |
| T4 | 42 (7.3) | 19 | 23 | |
| N stage | 0.035 | |||
| N0 | 254 (43.9) | 134 | 120 | |
| N1 | 156 (27.0) | 74 | 82 | |
| N2 | 168 (29.1) | 67 | 101 | |
| TNM stage | 0 | |||
| I | 218 (37.7) | 121 | 97 | |
| II | 152 (26.3) | 70 | 82 | |
| III | 208 (36.0) | 84 | 124 | |
p < 0.05 is significant (Marked with bold values)
Survival analysis of TOP2A and UBE2C expression for LUAD patients in NCC cohort
To confirm the result from TCGA analysis, we performed Cox proportional hazards regression and Kaplan–Meier curves in our own cohort. Cox analysis showed that both TOP2A (HR = 2.580, p = 0.001) and UBE2C (HR = 1.996, p = 0.001) were significantly associated with overall survival in univariate analysis (Table 9). In multivariate analysis, both TOP2A (HR = 2.325, p = 0.001) and UBE2C (HR = 1.735, p = 0.001) were significantly associated with overall survival, which suggested TOP2A and UBE2C as independent prognostic factors. Co-expression of both TOP2A and UBE2C (HR = 1.990, p = 0.001) also showed significant association with overall survival. For Kaplan–Meier survival analysis, stratifying samples by TOP2A and UBE2C expression demonstrated that a higher level of gene expression was significant associated with worse overall survival for both genes (Fig. 13).
Table 9.
Univariate and multivariable analysis of factors associated with overall survival
| Univariate analysis | Multivariate analysis | |||||
|---|---|---|---|---|---|---|
| p value | HR | 95% CI | p value | HR | 95% CI | |
| Age | ||||||
| (≤ 60, > 60 years) | 0.002 | 1.423 | 1.144–1.769 | 0.001 | 1.464 | 1.174–1.827 |
| Gender | ||||||
| (Female, male) | 0.009 | 1.157 | 1.036–1.292 | 0.892 | 1.023 | 0.732–1.430 |
| Smoking | ||||||
| (Never, ever) | 0.001 | 0.818 | 0.734–0.911 | 0.214 | 1.231 | 0.887–1.710 |
| Tumor length (cm) | ||||||
| ≤ 4 | ||||||
| > 4 | 0.001 | 2.058 | 1.651–2.567 | 0.004 | 1.461 | 1.132–1.885 |
| Differentiation | ||||||
| (Well/moderate, poor) | 0.122 | 1.191 | 0.955–1.485 | |||
| T stage | ||||||
| (T1/T2, T3/T4) | 0.001 | 2.06 | 1.602–2.650 | 0.901 | 1.02 | 0.746–1.396 |
| Lymph node metastasis | ||||||
| (Negative, positive) | 0.001 | 2.394 | 1.891–3.031 | 0 | 1.812 | 1.349–2.435 |
| TNM stage | ||||||
| (I/II, III) | 0.001 | 2.26 | 1.818–2.808 | 0.038 | 1.371 | 1.017–1.851 |
| TOP2A expression | ||||||
| (Negative, positive) | 0.001 | 2.58 | 2.066–3.221 | 0.001 | 2.325 | 1.852–2.919 |
| UBE2C expression | ||||||
| (Negative, positive) | 0.001 | 1.996 | 1.594–2.499 | 0.001 | 1.735 | 1.377–2.185 |
| TOP2A/UBE2C | ||||||
| (Co-expression, others) | 0.001 | 2.427 | 1.950–3.020 | 0.001 | 1.99 | 1.584–2.501 |
p < 0.05 is significant (Marked with bold values)
Fig. 13.

Kaplan–Meier overall survival analyses for UBE2C and TOP2A expressed in 578 patients with LUAD in NCC cohort. Both_H samples with both TOP2A and UBE2C high expression, both_L samples with both TOP2A and UBE2C low expression, H_L samples with TOP2A high expression and UBE2C low expression, L_H samples with TOP2A low expression and UBE2C high expression
Discussion
Although biomarkers for NSCLC have been extensively studied, research on prognostic markers of lung adenocarcinoma alone was still limited (Wistuba et al. 2013; Shedden et al. 2008). Reliable prognostic markers are critical for stratifying patients more accurately and selecting certain high-risk patients to postoperative therapy (Kruglyak et al. 2016; Passiglia et al. 2015; Thakur and Gadgeel 2016). Due to this reason, this article aimed to discover robust prognostic markers in LUAD. DEGs were first identified through public data mining. After network construction based on these DEGs, TOP2A, and UBE2C were selected because their high degree values and they have not been fully studied. The high expression of these two genes was further confirmed in CPTAC. These genes were significantly associated with overall survival in both TCGA and our NCC cohorts. In addition, TOP2A and UBE2C were identified independent prognostic factors according to multivariable analysis. The results reveal great potential for incorporating these two genes with traditional TNM system during LUAD stratification, which can assist in clinical decision-making.
Tumor is well known for its great heterogeneity which shows great variety between samples (McGranahan and Swanton 2017; Turajlic et al. 2019). Multiple comparisons in high-throughput data make false positive results an inevitable phenomenon (Farcomeni 2008). These two points are the main obstacles to the discovery of critical prognostic markers. Integration of different datasets for exploration and substantial validation in independent cohort can increase the signal and lessen the false positive findings to a certain extent. In this study, to overcome the above defects, four GEO datasets and TCGA database were utilized for marker discovery and a large independent LUAD cohort were used for validation. Thus, our prognostic markers, TOP2A and UBE2C, were robust in different datasets.
TOP2A encodes a topoisomerase II isozyme in mammalian cells (Chang et al. 2013; Vos et al. 2011; Wang 2002). This enzyme functions specifically in DNA topologic states controlling and changing during transcription (Nitiss 2009). In addition, DNA topology changes during replication give rise to catenation of replicated sister chromatids for cells to undergo successful mitosis (Deming et al. 2001; Chen et al. 2018). Previous studies reported that TOP2A alternation existed in several cancer type including colorectal cancer, bladder cancer, breast cancer, hepatocellular carcinoma, prostate cancer, renal cell carcinoma, and so on. Increased TOP2A expression has been shown to predict poorer prognosis and increased metastatic potential in cancer (Al-Kuraya et al. (2007); Chen et al. 2017; Olsen et al. 2004; Resende et al. 2013; Panvichian et al. 2015; Simon et al. 2003). Mechanism research revealed TOP2A is involved in PI3K–AKT pathway and regulated by PTEN (Kang et al. 2015). Its function in LUAD is not fully understood. Ubiquitination is an important cellular process for targeting short-lived or abnormal proteins for degradation (Pickart 2001). UBE2C encodes a member of ubiquitin-conjugating enzymes which guide polyubiquitination to targeted lysine in the substrates (Hao et al. 2012). UBE2C has been shown to play important roles in cell cycle and checkpoint control through cyclin B destruction (Hershko 1997; Rape and Kirschner 2004). Overexpression of UBE2C has been reported in a variety of cancer (Chou et al. (2014); Shen et al. 2013; Ieta et al. 2007). High UBE2C expression was shown to associated with high aggressiveness, high risk for relapse, and poor prognosis (Hao et al. 2012). Its potential role and clinical application in LUAD have not been elucidated.
Since TOP2A and UBE2C showed high relevance of their mRNA expression in TCGA database, they were separately discussed in multivariable COX model. Both of these gene were significant in the COX model. Interestingly, the hazard ratio of co-expression indicator was no more larger than any single gene in the multivariable model. This may be due to information redundancy by intrinsic regulatory relationship. Previous in vitro study revealed that ubiquitin-conjugating enzyme E2–EPF knockdown sensitized HeLa cells to the topoisomerase (topo) II inhibitors (Tedesco et al. 2007). However, the relationship between these two genes in mankind needs further research.
Our result has certain deficiencies in regard to potential clinical application. Since RNA-seq measured the relative level of gene expression, appropriate normalization method need to be applied before between-sample comparison. For this reason, it’s hard to set a threshold for patient stratification during clinical transformation.
Conclusion
In summary, through the use of public data mining, we identified 430 intersected DEGs. After interaction network construction and literature review, TOP2A and UBE2C were selected as hub genes for further research. Increased expressions of these two genes were observed in various cancer type including LUAD. Survival analysis revealed that overexpression of both genes was significantly associated with worse prognosis in TCGA cohort and our validated NCC cohort. In addition, TOP2A and UBE2C were independent prognostic factors in multivariable model.
Electronic supplementary material
Below is the link to the electronic supplementary material.
Acknowledgements
We thank all the staff in the Department of Thoracic Surgery for their support during the study.
Funding
This study was supported by the National Key R&D Program of China (2017YFC1311000), the CAMS Initiative for Innovative Medicine (2017-I2M-1-005, 2019-I2M-2-002), and the Institutional Fundamental Research Funds (2018PT32033).
Compliance with ethical standards
Conflict of interest
The authors declare that there is no conflict of interest.
Ethic approval
All procedures performed in studies involving human participants were in accordance with the ethical standards of the ethics committee of National Cancer Center/Cancer Hospital, Chinese Academy of Medical Sciences and Peking Union Medical College and with the 1964 Helsinki declaration and its later amendments or comparable ethical standards.
Informed consent
Informed consent was obtained from all participants included in the study.
Footnotes
Publisher's Note
Springer Nature remains neutral with regard to jurisdictional claims in published maps and institutional affiliations.
Wei Guo and Sijin Sun contributed equally to this study.
Contributor Information
Yibo Gao, Email: gaoyibo@cicams.ac.cn.
Shugeng Gao, Email: gaoshugeng@vip.sina.com.
Jie He, Email: prof.jiehe@gmail.com.
References
- Al-Kuraya K, Novotny H, Bavi P, Siraj AK, Uddin S, Ezzat A, Sanea NA, Al-Dayel F, Al-Mana H, Sheikh SS, Mirlacher M, Tapia C, Simon R, Sauter G, Terracciano L, Tornillo L (2007) HER2, TOP2A, CCND1, EGFR and C-MYC oncogene amplification in colorectal cancer. J Clin Pathol 60:768–772 [DOI] [PMC free article] [PubMed] [Google Scholar]
- Asamura H, Chansky K, Crowley J, Goldstraw P, Rusch VW, Vansteenkiste JF, Watanabe H, Wu YL, Zielinski M, Ball D, Rami-Porta R (2015) The International Association for the Study of Lung Cancer Lung Cancer Staging Project: Proposals for the Revision of the N Descriptors in the Forthcoming 8th Edition of the TNM Classification for Lung Cancer. J Thorac Oncol 10:1675–1684 [DOI] [PubMed] [Google Scholar]
- Bui KT, Cooper WA, Kao S, Boyer M (2018) Targeted molecular treatments in non-small cell lung cancer: a clinical guide for oncologists. J Clin Med 7:192 [DOI] [PMC free article] [PubMed] [Google Scholar]
- Byron SA, Van Keuren-Jensen KR, Engelthaler DM, Carpten JD, Craig DW (2016) Translating RNA sequencing into clinical diagnostics: opportunities and challenges. Nat Rev Genet 17:257–271 [DOI] [PMC free article] [PubMed] [Google Scholar]
- Chang CC, Wang YR, Chen SF, Wu CC, Chan NL (2013) New insights into DNA-binding by type IIA topoisomerases. Curr Opin Struct Biol 23:125–133 [DOI] [PubMed] [Google Scholar]
- Chen D, Maruschke M, Hakenberg O, Zimmermann W, Stief CG, Buchner A (2017) TOP2A, HELLS, ATAD2, and TET3 are novel prognostic markers in renal cell carcinoma. Urology 102:e261–e267 [DOI] [PubMed] [Google Scholar]
- Chen W, Zheng R, Baade PD, Zhang S, Zeng H, Bray F, Jemal A, Yu XQ, He J (2016) Cancer statistics in China, 2015. CA Cancer J Clin 66:115–132 [DOI] [PubMed] [Google Scholar]
- Chen SF, Huang NL, Lin JH, Wu CC, Wang YR, Yu YJ, Gilson MK, Chan NL (2018) Structural insights into the gating of DNA passage by the topoisomerase II DNA-gate. Nat Commun 9:3085 [DOI] [PMC free article] [PubMed] [Google Scholar]
- Chou C-P, Huang N-C, Jhuang S-J, Pan H-B, Peng N-J, Cheng J-T, Chen C-F, Chen J-J, Chang T-H (2014) Ubiquitin-conjugating enzyme UBE2C is highly expressed in breast microcalcification lesions. PLoS ONE 9:e93934 [DOI] [PMC free article] [PubMed] [Google Scholar]
- De Resende MF, Vieira S, Chinen LTD, Chiappelli F, da Fonseca FP, Guimarães GC, Soares FA, Neves I, Pagotty S, Pellionisz PA (2013) Prognostication of prostate cancer based on TOP2A protein and gene assessment: TOP2A in prostate cancer. J Transl Med 11:36 [DOI] [PMC free article] [PubMed] [Google Scholar]
- Deming PB, Cistulli CA, Zhao H, Graves PR, Piwnica-Worms H, Paules RS, Downes CS, Kaufmann WK (2001) The human decatenation checkpoint. Proc Natl Acad Sci USA 98:12044–12049 [DOI] [PMC free article] [PubMed] [Google Scholar]
- Eberhardt WE, Mitchell A, Crowley J, Kondo H, Kim YT, Turrisi A, Goldstraw P, Rami-Porta R (2015) The IASLC Lung Cancer Staging Project: Proposals for the Revision of the M Descriptors in the Forthcoming eighth edition of the TNM classification of lung cancer. J Thorac Oncol 10:1515–1522. [DOI] [PubMed]
- Farcomeni A (2008) A review of modern multiple hypothesis testing, with particular attention to the false discovery proportion. Stat Methods Med Res 17:347–388 [DOI] [PubMed] [Google Scholar]
- Gao Z, Shi R, Yuan K, Wang Y (2016) Expression and prognostic value of E2F activators in NSCLC and subtypes: a research based on bioinformatics analysis. Tumour Biol 37:14979–14987 [DOI] [PubMed] [Google Scholar]
- Goldstraw P, Chansky K, Crowley J, Rami-Porta R, Asamura H, Eberhardt WE, Nicholson AG, Groome P, Mitchell A, Bolejack V (2016) The IASLC lung cancer staging project: proposals for revision of the TNM stage groupings in the forthcoming (eighth) edition of the TNM classification for lung cancer. J Thorac Oncol 11:39–51 [DOI] [PubMed] [Google Scholar]
- Hao Z, Zhang H, Cowell J (2012) Ubiquitin-conjugating enzyme UBE2C: molecular biology, role in tumorigenesis, and potential as a biomarker. Tumor Biol 33:723–730 [DOI] [PubMed] [Google Scholar]
- Hershko A (1997) Roles of ubiquitin-mediated proteolysis in cell cycle control. Curr Opin Cell Biol 9:788–799 [DOI] [PubMed] [Google Scholar]
- Huang WT, Yang X, He RQ, Ma J, Hu XH, Mo WJ, Chen G (2019) Overexpressed BSG related to the progression of lung adenocarcinoma with high-throughput data-mining, immunohistochemistry, in vitro validation and in silico investigation. Am J Transl Res 11:4835–4850 [PMC free article] [PubMed] [Google Scholar]
- Ieta K, Ojima E, Tanaka F, Nakamura Y, Haraguchi N, Mimori K, Inoue H, Kuwano H, Mori M (2007) Identification of overexpressed genes in hepatocellular carcinoma, with special reference to ubiquitin-conjugating enzyme E2C gene expression. Int J Cancer 121:33–38 [DOI] [PubMed] [Google Scholar]
- Jamal-Hanjani M, Wilson GA, McGranahan N, Birkbak NJ, Watkins TBK, Veeriah S, Shafi S, Johnson DH, Mitter R, Rosenthal R, Salm M, Horswell S, Escudero M, Matthews N, Rowan A, Chambers T, Moore DA, Turajlic S, Xu H, Lee SM, Forster MD, Ahmad T, Hiley CT, Abbosh C, Falzon M, Borg E, Marafioti T, Lawrence D, Hayward M, Kolvekar S, Panagiotopoulos N, Janes SM, Thakrar R, Ahmed A, Blackhall F, Summers Y, Shah R, Joseph L, Quinn AM, Crosbie PA, Naidu B, Middleton G, Langman G, Trotter S, Nicolson M, Remmen H, Kerr K, Chetty M, Gomersall L, Fennell DA, Nakas A, Rathinam S, Anand G, Khan S, Russell P, Ezhil V, Ismail B, Irvin-Sellers M, Prakash V, Lester JF, Kornaszewska M, Attanoos R, Adams H, Davies H, Dentro S, Taniere P, O'Sullivan B, Lowe HL, Hartley JA, Iles N, Bell H, Ngai Y, Shaw JA, Herrero J, Szallasi Z, Schwarz RF, Stewart A, Quezada SA, Le Quesne J, Van Loo P, Dive C, Hackshaw A, Swanton C (2017) Tracking the evolution of non-small-cell lung cancer. N Engl J Med 376:2109–2121 [DOI] [PubMed] [Google Scholar]
- Kalemkerian GP, Narula N, Kennedy EB, Biermann WA, Donington J, Leighl NB, Lew M, Pantelas J, Ramalingam SS, Reck M, Saqi A, Simoff M, Singh N, Sundaram B (2018) Molecular testing guideline for the selection of patients with lung cancer for treatment with targeted tyrosine kinase inhibitors: American Society of Clinical Oncology Endorsement of the College of American Pathologists/International Association for the Study of Lung Cancer/Association for Molecular Pathology Clinical Practice Guideline Update. J Clin Oncol 36:911–919 [DOI] [PubMed] [Google Scholar]
- Kang X, Song C, Du X, Zhang C, Liu Y, Liang L, He J, Lamb K, Shen WH, Yin Y (2015) PTEN stabilizes TOP2A and regulates the DNA decatenation. Sci Rep 5:17873 [DOI] [PMC free article] [PubMed] [Google Scholar]
- Kotera M, Okuno Y, Hattori M, Goto S, Kanehisa M (2004) Computational assignment of the EC numbers for genomic-scale analysis of enzymatic reactions. J Am Chem Soc 126:16487–16498 [DOI] [PubMed] [Google Scholar]
- Kruglyak KM, Lin E, Ong FS (2016) Next-generation sequencing and applications to the diagnosis and treatment of lung cancer. Adv Exp Med Biol 890:123–136 [DOI] [PubMed] [Google Scholar]
- Li B, Cui Y, Diehn M, Li R (2017) Development and validation of an individualized immune prognostic signature in early-stage nonsquamous non-small cell lung cancer. JAMA Oncol 3:1529–1537 [DOI] [PMC free article] [PubMed] [Google Scholar]
- McGranahan N, Swanton C (2017) Clonal heterogeneity and tumor evolution: past, present, and the future. Cell 168:613–628 [DOI] [PubMed] [Google Scholar]
- Meyerson M, Gabriel S, Getz G (2010) Advances in understanding cancer genomes through second-generation sequencing. Nat Rev Genet 11:685–696 [DOI] [PubMed] [Google Scholar]
- Nitiss JL (2009) DNA topoisomerase II and its growing repertoire of biological functions. Nat Rev Cancer 9:327–337 [DOI] [PMC free article] [PubMed] [Google Scholar]
- Olsen KE, Knudsen H, Rasmussen BB, Balslev E, Knoop A, Ejlertsen B, Nielsen KV, Schönau A, Overgaard J (2004) Amplification of HER2 and TOP2A and deletion of TOP2A genes in breast cancer investigated by new FISH probes. Acta Oncol 43:35–42 [DOI] [PubMed] [Google Scholar]
- Osmani L, Askin F, Gabrielson E, Li QK (2018) Current WHO guidelines and the critical role of immunohistochemical markers in the subclassification of non-small cell lung carcinoma (NSCLC): moving from targeted therapy to immunotherapy. Semin Cancer Biol 52:103–109 [DOI] [PMC free article] [PubMed] [Google Scholar]
- Ozsolak F, Milos PM (2011) RNA sequencing: advances, challenges and opportunities. Nat Rev Genet 12:87–98 [DOI] [PMC free article] [PubMed] [Google Scholar]
- Panvichian R, Tantiwetrueangdet A, Angkathunyakul N, Leelaudomlipi S (2015) TOP2A amplification and overexpression in hepatocellular carcinoma tissues. BioMed Res Int 2015:381602 [DOI] [PMC free article] [PubMed] [Google Scholar]
- Passiglia F, Bronte G, Castiglia M, Listi A, Calo V, Toia F, Cicero G, Fanale D, Rizzo S, Bazan V, Russo A (2015) Prognostic and predictive biomarkers for targeted therapy in NSCLC: for whom the bell tolls? Expert Opin Biol Ther 15:1553–1566 [DOI] [PubMed] [Google Scholar]
- Pickart CM (2001) Mechanisms underlying ubiquitination. Annu Rev Biochem 70:503–533 [DOI] [PubMed] [Google Scholar]
- Rape M, Kirschner MW (2004) Autonomous regulation of the anaphase-promoting complex couples mitosis to S-phase entry. Nature 432:588 [DOI] [PubMed] [Google Scholar]
- Relli V, Trerotola M, Guerra E, Alberti S (2019) Abandoning the notion of non-small cell lung cancer. Trends Mol Med 25:585–594 [DOI] [PubMed] [Google Scholar]
- Rolfo C, Caglevic C, Santarpia M, Araujo A, Giovannetti E, Gallardo CD, Pauwels P, Mahave M (2017) Immunotherapy in NSCLC: a promising and revolutionary weapon. Adv Exp Med Biol 995:97–125 [DOI] [PubMed] [Google Scholar]
- Rybarczyk-Kasiuchnicz A, Ramlau R (2018) Current views on molecularly targeted therapy for lung cancer—a review of literature from the last five years. Kardiochirurgia i torakochirurgia polska 15:119–124 [DOI] [PMC free article] [PubMed] [Google Scholar]
- Shedden K, Taylor JM, Enkemann SA, Tsao MS, Yeatman TJ, Gerald WL, Eschrich S, Jurisica I, Giordano TJ, Misek DE, Chang AC, Zhu CQ, Strumpf D, Hanash S, Shepherd FA, Ding K, Seymour L, Naoki K, Pennell N, Weir B, Verhaak R, Ladd-Acosta C, Golub T, Gruidl M, Sharma A, Szoke J, Zakowski M, Rusch V, Kris M, Viale A, Motoi N, Travis W, Conley B, Seshan VE, Meyerson M, Kuick R, Dobbin KK, Lively T, Jacobson JW, Beer DG (2008) Gene expression-based survival prediction in lung adenocarcinoma: a multi-site, blinded validation study. Nat Med 14:822–827 [DOI] [PMC free article] [PubMed] [Google Scholar]
- Shen Z, Jiang X, Zeng C, Zheng S, Luo B, Zeng Y, Ding R, Jiang H, He Q, Guo J (2013) High expression of ubiquitin-conjugating enzyme 2C (UBE2C) correlates with nasopharyngeal carcinoma progression. BMC Cancer 13:192 [DOI] [PMC free article] [PubMed] [Google Scholar]
- Siegel RL, Miller KD, Jemal A (2015) Cancer statistics, 2015. CA A Cancer J Clin 65:5–29 [DOI] [PubMed] [Google Scholar]
- Siegel RL, Miller KD, Jemal A (2018) Cancer statistics, 2018. CA Cancer J Clin 68:7–30 [DOI] [PubMed] [Google Scholar]
- Simon R, Atefy R, Wagner U, Forster T, Fijan A, Bruderer J, Wilber K, Mihatsch MJ, Gasser T, Sauter G (2003) HER-2 and TOP2A coamplification in urinary bladder cancer. Int J Cancer 107:764–772 [DOI] [PubMed] [Google Scholar]
- Stark R, Grzelak M, Hadfield J (2019) RNA sequencing: the teenage years. Nat Rev Genet [DOI] [PubMed]
- Su X, Wan Y, Xie L, Lin X, Zhao H, Ju X, Fang A (2019) Expression of SUMO1P3 compared with SUMO1 is an independent predictor of patient outcome in lung adenocarcinoma. Med Sci Monit 25:6691–6701 [DOI] [PMC free article] [PubMed] [Google Scholar]
- Tang Z, Li C, Kang B, Gao G, Li C, Zhang Z (2017) GEPIA: a web server for cancer and normal gene expression profiling and interactive analyses. Nucleic Acids Res 45:W98–w102 [DOI] [PMC free article] [PubMed] [Google Scholar]
- Tedesco D, Zhang J, Trinh L, Lalehzadeh G, Meisner R, Yamaguchi KD, Ruderman DL, Dinter H, Zajchowski DA (2007) The ubiquitin-conjugating enzyme E2-EPF is overexpressed in primary breast cancer and modulates sensitivity to topoisomerase II inhibition. Neoplasia (New York, NY) 9:601 [DOI] [PMC free article] [PubMed] [Google Scholar]
- Thakur MK, Gadgeel SM (2016) Predictive and prognostic biomarkers in non-small cell lung cancer. Semin Respir Crit Care Med 37:760–770 [DOI] [PubMed] [Google Scholar]
- Travis WD, Asamura H, Bankier AA, Beasley MB, Detterbeck F, Flieder DB, Goo JM, MacMahon H, Naidich D, Nicholson AG, Powell CA, Prokop M, Rami-Porta R, Rusch V, van Schil P, Yatabe Y (2016) The IASLC lung cancer staging project: proposals for coding T categories for subsolid nodules and assessment of tumor size in part-solid tumors in the forthcoming eighth edition of the TNM classification of lung cancer. J Thorac Oncol 11:1204–1223 [DOI] [PubMed] [Google Scholar]
- Turajlic S, Sottoriva A, Graham T, Swanton C (2019) Resolving genetic heterogeneity in cancer. Nat Rev Genet 20:404–416 [DOI] [PubMed] [Google Scholar]
- Vos SM, Tretter EM, Schmidt BH, Berger JM (2011) All tangled up: how cells direct, manage and exploit topoisomerase function. Nat Rev Mol Cell Biol 12:827–841 [DOI] [PMC free article] [PubMed] [Google Scholar]
- Wang JC (2002) Cellular roles of DNA topoisomerases: a molecular perspective. Nat Rev Mol Cell Biol 3:430–440 [DOI] [PubMed] [Google Scholar]
- Wang H, Gu R, Tian F, Liu Y, Fan W, Xue G, Cai L, Xing Y (2019) PHLPP2 as a novel metastatic and prognostic biomarker in non-small cell lung cancer patients. Thorac Cancer 10:2124–2132 [DOI] [PMC free article] [PubMed] [Google Scholar]
- Wistuba II, Behrens C, Lombardi F, Wagner S, Fujimoto J, Raso MG, Spaggiari L, Galetta D, Riley R, Hughes E, Reid J, Sangale Z, Swisher SG, Kalhor N, Moran CA, Gutin A, Lanchbury JS, Barberis M, Kim ES (2013) Validation of a proliferation-based expression signature as prognostic marker in early stage lung adenocarcinoma. Clin Cancer Res 19:6261–6271 [DOI] [PMC free article] [PubMed] [Google Scholar]
- Yu G, Wang LG, Han Y, He QY (2012) clusterProfiler: an R package for comparing biological themes among gene clusters. OMICS 16:284–287 [DOI] [PMC free article] [PubMed] [Google Scholar]
- Zheng H, Zhan Y, Zhang Y, Liu S, Lu J, Yang Y, Wen Q, Fan S (2019) Elevated expression of G3BP1 associates with YB1 and p-AKT and predicts poor prognosis in nonsmall cell lung cancer patients after surgical resection. Cancer Med 8:6894–6903 [DOI] [PMC free article] [PubMed] [Google Scholar]
Associated Data
This section collects any data citations, data availability statements, or supplementary materials included in this article.