

Abstract
Stem cell therapies are gaining traction as promising treatments for a variety of degenerative conditions. Both clinical and preclinical studies of regenerative medicine are hampered by the lack of technologies that can evaluate the migration and behavior of stem cells post-transplantation. This study proposes an innovative method to longitudinally image in vivo human induced pluripotent stem cells differentiated to retinal pigment epithelium (hiPSC-RPE) cells by multimodal photoacoustic microscopy, optical coherence tomography, and fluorescence imaging powered by ultraminiature chain-like gold nanoparticle cluster (GNC) nanosensors. The GNC exhibits an optical absorption peak in the near-infrared regime and the 7–8 nm size in diameter after disassembly enables renal excretion and improved safety as well as biocompatibility. In a clinically-relevant rabbit model, GNC labelled hiPSC-RPE cells migrated to RPE degeneration areas and regenerated damaged tissues. The hiPSC-RPE cells’ distribution and migration were non-invasively, longitudinally monitored for 6 months with exceptional sensitivity and spatial resolution. This advanced platform for cellular imaging has the potential to enhance regenerative cell-based therapies.
Keywords: stem cell therapy, photoacoustic microscopy, optical coherence tomography, regenerative medicine, contrast agents, gold nanochains, human induced pluripotent stem cells differentiated to retinal pigment epithelium
Graphical Abstract

Main
Age-related macular degeneration (AMD), a condition that leads to degeneration of the retinal pigment epithelium (RPE) and retina, is a growing concern globally. Among individuals in the age range of 45 to 85 years, 8.7% have some stage of AMD1. In individuals over 60, it is the most common cause of blindness in industrialized countries2. There are two major types of AMD: wet AMD (neovascular AMD) and dry AMD (non-neovascular AMD). Wet AMD occurs when choroidal neovascular membranes grow in the subretinal space and leak fluid or blood, leading to rapid and severe vision loss3. Dry AMD is characterized by slowly progressive degeneration of photoreceptors and RPE cells. Deposits of protein and lipids called drusen may accumulate in the subretinal or sub-RPE space, leading to gradual central vision loss. Dry AMD is the most common form of the disease, and its progression is typically slower than wet AMD. However, it can still cause significant vision impairment over time4. Geographic atrophy (GA) is an advanced form of dry AMD characterized by large, well-defined areas of atrophy or cell loss5. GA typically results in severe and irreversible central vision loss and contributes significantly to vision impairment in individuals with AMD6. The current standard of treatment of wet AMD is administration of anti-vascular endothelial growth factor (VEGF) therapy. This is effective for wet AMD, but those with dry AMD and GA are not responsive to this treatment7. While the complement C3 inhibitor pegcetacoplan intravitreal injection was approved in 2023 as FDA-approved treatment of GA, pegcetacoplan only slows the progression of GA without reversing it, does not improve vision, carries a significantly increased risk of developing wet AMD, and requires injections every 1–2 months8. A potential treatment of atrophic AMD is the use of human induced pluripotent stem cells differentiated into RPE cells (hiPSC-RPE)9. Stem cell-based regenerative medicine therapies, including hiPSC-RPE, potentially have the capability to replace or restore damaged layers including the RPE by migrating, adhering to, and surviving in a site of pathology after transplantation. Early results demonstrate evidence that injection of hiPSC-RPE cells can rescue retinal function and improve visual acuity10, making them a promising avenue for AMD treatment.
The utility of hiPSC-RPE cells as a clinical treatment method is dependent on the capability to monitor the fate, destiny, mobility, and viability of the cells. This is due to the potential risks associated with using stem cells, including immune cascades, tumor formation, and limited understanding of efficacy11. Prior clinical trials using PSC-RPE cells have been unable to definitively distinguish whether areas of hyperpigmentation represented viable transplanted cells or extruded melanin12. The primary methods used currently to track stem cells are histological analysis and tissue function tests13. These methods, however, are notably invasive and challenging to implement in in vivo models. To advance the basic research and clinical translation of stem cell therapies, it is crucial to have a non-invasive, high-resolution imaging method which can provide longitudinal safety and efficacy information of transplanted cells in vivo.
Multimodal imaging paired with biocompatible contrast agents provides a potential solution. Several imaging techniques have demonstrated the capacity to perform cellular level imaging. The primary methods include magnetic resonance imaging (MRI), bioluminescence, fluorescence microscopy, positron emission tomography (PET), two-photon fluorescence imaging, single photon emission computed tomography (SPECT), and optical coherence tomography (OCT)13c, 14. Many of these methods have proven useful to perform noninvasive imaging of transplanted cells14a. However, each of these modalities has disadvantages. PET and SPECT pose the risk of ionizing radiation complications. While fluorescence microscopy has high sensitivity, the method lacks depth of penetration15. Bioluminescence has limited spatial resolution to monitor cell migration. OCT can visualize changes in the RPE layer post-cell transplantation such as RPE atrophy16. However, OCT is unable to differentiate between native RPE cells and donor cells after transplantation. Many of these modalities such as PET, SPECT, and MRI carry very significant costs.
A potential alternative to these methods is photoacoustic (PA) imaging. This technology analyzes acoustic waves generated by the thermal expansion of tissue following nanosecond laser exposure. PA imaging could be a good candidate for cell tracking given it has high sensitivity, high spatial resolution, and ideal tissue penetration17. A report by Kubelick et al. demonstrated the feasibility of PA for stem cell tracking in the anterior segment of the eye with encouraging results18. However, this study had limitations, including not being able to track stem cells longitudinally, and the cells were injected in the aqueous, not the vitreous or retina. We expect that PA imaging could help determine the location and quantity of stem cells in the RPE layer upon transplantation when supplemented with other imaging modalities and contrast agents. With that in mind, this study investigates photoacoustic microscopy (PAM) integrated with OCT and fluorescence microscopy (FM), or PAOFM, for longitudinal imaging of hiPSC-RPE cells in vivo. The three imaging technologies included in the integrated imaging system are all non-invasive and nonionizing, benefiting longitudinal tracking of cells in vivo, and can provide complementary structural and functional information with high sensitivity and high 3D resolution.
Given that most cells including hiPSC-RPE cells do not produce notable optical absorption, contrast agents can be introduced to the stem cells to track and monitor them with PA imaging. Various nanoparticles and organic chromophores have been studied as agents to enhance contrast in PAM and OCT17a, 17b, 19. Salah et al. recently used gold nanorods to enhance visualization of mesenchymal stem (MSC) cells in vivo using PA imaging, and found gold nanorods can enhance the optical contrast of cells without adverse effects19f. In a similar study, Mok et al. treated MSC cells with gold nanoparticles (diameter of 80 nm) and injected these labelled cells into the rat subretinal layer, and found high micro-CT contrast but no cytotoxic effects19g. In a previous study, our lab found 20 nm chain-like gold nanoparticle (CGNP) clusters conjugated with arginine-glycine-aspartate (RGD) peptides show great biocompatibility and photostability for multimodal molecular imaging19d. Their red-shifted optical absorption with a peak absorption at 650 nm avoids the overlap with the strong optical absorption peak of hemoglobin at around 550 nm, allowing them to be detected in biological samples in vivo by PA imaging with a high signal-to-background ratio20.
The current study introduces ultraminiature 7–8 nm GNC-RGD for labeling hiPSC-RPE cells and imaging of these cells in vivo in a rabbit model of RPE damage induced by laser burn. The ultraminiature 7–8 nm GNC-RGD were fabricated through the assembly of 5 nm spherical GNPs generated by femtosecond pulsed laser ablation as described previously21. It is hypothesized that 5 nm GNPs are more biocompatible given they have the potential for renal excretion, while 20 nm GNPs do not. This is based on rabbits’ glomerular filtration size threshold around 5–10 nm22. In this study, the toxicity profile of the ultraminiature 7–8 nm GNCs was compared to larger alternatives. The imaging modalities used to longitudinally monitor the cells and ocular pathology include fundus imaging, fluorescence imaging, OCT, and PAM. To assess the ability of the cells to migrate to the site of retinal damage, the migration of stem cells labeled by contrast agents was imaged and quantitatively measured in vivo in the rabbit model of RPE damage induced by laser burn, and the results were compared to those from the rabbit model without RPE damage as the control.
Results and Discussion
Renal excretable nanosensor probes for stem cell imaging:
In recent studies, we observed that chain-like gold nanoparticle clusters (GNC) clustered from 20 nm gold nanoparticles (GNPs) can shift the absorption spectrum from the visible range to the near-infrared (NIR) window and can be used to track live progenitor cells in vivo under laser illumination19e. To investigate whether this technique allows imaging of live hiPSC-RPE cells following transplantation into the subretinal region in vivo, we labeled hiPSC-RPE cells with the original, ultraminiature biocompatible gold nanosensor probes23 as illustrated in Fig. 1 and then imaged the cells with PAOFM imaging. We fabricated ultraminiature GNC using physical method of pulsed laser ablation (PLA) methods as shown in Fig. 1A. The fabricated GNC consists of clustering of 3–5 individual colloidal GNPs, each with an average diameter of 7–8 nm linked by using two specific peptides (CALNN and cysteamine) as shown in transmission electron microscopy (TEM) image (Fig. 1B). One benefit of this method is that the fabricated GNC has a natural negative charge with large zeta potential values (about –41 mV) and is very stable. The benefits of using this method include: (1) It represents a fully green synthesis method that directly yields non-toxic, colloidal-stable, highly pure gold nanoparticles in deionized (DI) water, free from capping or stabilizing agents. Controlling the size and size distribution of these nanoparticles can be achieved by optimizing laser parameters, including wavelength, pulse energy, duration, and repetition rate. This stands in contrast to wet-chemical synthesis methods, which incorporates reducing agents, chemical precursors, and stabilizing/capping agents into the process, and may pose potential environmental risks due to their associated impacts. (2) The resulting highly pure and capping/stabilizing agent-free GNPs enable precise surface functionalization for achieving the conjugation of various types of ligands with predetermined quantities, as demonstrated in our previous studies24. This exclusive property enables the development of nanomaterial-based probes possessing superb colloidal stability, exceptional biocompatibility, and extraordinarily efficient targeting abilities for in vivo multimodal molecular imaging. As another big advantage, the observations revealed that these manufactured GNC were eliminated from the body through urine. after administration into the rabbits (Supplementary Fig. S1A–C). In contrast, large GNCs or large colloidal GNPs (60 nm) were not detected in urine post-treatment, and mostly accumulated in the spleen and liver (Supplementary Fig. S1D). After clustering, GNCs have a strong absorption peak at 620 nm while the original GNPs have a peak absorption at 520 nm (Fig. 1C). This red shift in the optical absorption peak is important for tracking stem cells (SC) in the retina because the surrounding tissues such as hemoglobin and melanin have strong optical absorption at 520 nm and can induce pronounced background signals under laser illumination. To ensure that GNCs maintain their morphology integrity under laser irradiation, we conducted investigations to their stability following exposure to nanosecond laser pulses, with a laser fluence as high as 10 mJ cm−2 and up to 75,000 irradiated pulses. It has been confirmed that the generated GNCs exhibit excellent photostability, with laser-induced disassembly observed only when the laser fluence surpasses 8 mJ cm-2. This value is 200 times as high as the laser fluence of 0.04 mJ cm−2 used in our PAM imaging.
Figure 1. Physiochemical characterization of the ultraminiature gold nanochains (GNC):

(a) Schematic of ultraminiature gold nanoparticle monomer fabrication using femtosecond pulsed laser ablation and clustering process. (b) Transmission electron microscopy (TEM) images depicting the synthesized GNCs. (c) UV-Vis absorption spectrum of original 5–8 nm gold nanoparticles (GNPs) and the ultraminiature GNC. (d) UV-Vis absorption spectrum of the GNCs internalized within the hiPSC-RPE cells vs cells without being labeled by GNCs. (e) Comparison of hydrodynamic sizes of 7–8 nm GNPs and GNCs. (f) Fourier transformed infrared spectroscopy (FTIR) of different compounds and nanoparticles including Thiolated PEG 2000, PEGylated ultraminiature GNCs and ultraminiature GNCs. (g) Colloidal stability of ultraminiature GNC suspended in physiological conditions over time measured by UV-Vis spectrometer. There is no significant red-shift observed on the absorption spectrum of the sample up to 4 days. (h–i) 2D OCT and PAM images of PBS (control) and hiPSC-RPE cells labeled with GNCs at different cell densities (i.e.,102, 103, 104, 105, 106). (j–k) OCT signal intensity and PA signal amplitudes as functions of cell densities, respectively (n=3, p<0.001). (l–m) Confocal laser microscope images of hiPSC-RPE cells with and without being labeled by the ultraminiature GNCs, respectively. The red fluorescent color indicated the localization of the internalized GNCs within the cells.
To assess the potential change of optical properties such as broad absorption peak caused by aggregation of GNPs inside tissues, we treated the hiPSC-RPE cells without (control) and with GNCs (100 μg/mL) and monitored the absorption spectrum (Fig. 1D). The UV-Vis spectrum shows that the cells labeled with GNCs have significantly enhanced optical absorption at 630 nm, and the absorption peak of the GNC in cells is slightly broader when compared to that of the GNC without being encapsulated in cells (Fig. 1D). In contrast, weak and broad absorption spectrum was observed in the control group, similar to that of the data measured by Jacques et al.25 and Zonios et al.26. Additionally, dynamic light scattering analysis was employed to evaluate the hydrodynamic particle size distribution, indicating an average size of 55.3 nm and a polydispersity index of 0.3. (Fig. 1E). Moreover, the determined zeta potential of the synthesized ultraminiature GNCs was roughly −41 ± 2 mV. This factor enhances the colloidal stability significantly, as demonstrated by the absence of any detectable alteration in the absorption spectra throughout a two-month duration. FT-IR analysis confirmed the presence of PEG molecules (Fig. 1F). Moreover, the determined zeta potential of the synthesized ultraminiature GNCs was approximately −41 ± 2 mV. This characteristic significantly enhances their colloidal stability, as demonstrated by the absence of any detectable alteration in the absorption spectra of GNCs suspended in a physiological environment, such as 1X phosphate-buffered saline at pH 7.4, for up to 4 days (Fig. 1G).
Subsequently, we conducted in vitro assessments to evaluate the sensitivity of PAM and OCT for SC detection by imaging the hiPSC-RPE cells at different cell densities. As illustrated in Fig. 1H–K, the contrast and signal intensities of both PAM and OCT showed a linear correlation with the cell density. (p<0.001). The minimum detectable density in vitro is about 102 cells, while the cell density to achieve significant contrast for SC imaging in vivo is around 105 cells.
We next implemented cellular uptake on 4 different cell types, including HeLa cells, hiPSC-RPE, an immortalized retinal pigment epithelial cell line with differentiated properties (ARPE-19), and human umbilical vein endothelial cells (HUVEC) to investigate the capacity of GNC for cell labeling. Confocal laser scanning microscope images show that most of the GNCs extensively accumulated around the cells’ nuclei after being treated with GNC (Fig. 1L–M and Supplementary Fig. S2 (ARPE-19, HeLa, and HUVEC)) and the cells’ morphology remained in normal physiologic honeycomb shapes. The potential toxicity of GNCs on cellular viability was evaluated (Fig. S3). Surprisingly, even when exposed to a substantial concentration of 500 μg/mL for an extended period of 48 hours, the percentage of cell viability remained around 80% after treatment with GNCs. This indicates that GNCs have minimal impact on cellular health and suggests a low level of cytotoxicity associated with their use.
Safety evaluation of hiPSC-RPE cell function after treatment with GNCs followed by laser illumination in vitro:
To determine whether RPE cell function was impacted by either internalization of GNPs or by exposure to the laser fluence used for imaging, RPE cell markers, barrier properties, phagocytosis, and protein secretion were assayed after treatment with GNPs of varying sizes, with and without laser treatment of varying energies (Fig. 2). Localization patterns of ZO-1, CD147, Ezrin, and Kir7.1 were similar between untreated cells and those treated with either 7–8 nm GNCs, 80 nJ laser, or both (Fig. 2A–D, and Supplementary Fig. S4). Transepithelial electrical resistance (TEER) of iPSC-RPE cells rose appropriately after passage onto permeable supports both with and without 7–8 nm GNC treatment and plateaued at approximately 5 weeks of age, with no significant effect of treatment on 2-way ANOVA (Fig. 2H). Additional RPE markers were assayed by western blot and RT-PCR with and without 7–8 nm GNCs (Fig. 2F, G). All markers were expressed both with and without treatment, although many had reduced transcript levels after GNC treatment (Fig. 2G). Western blot densitometry of ZO-1, CD147, Ezrin, and Kir7.1 showed possible differences between treated and untreated cells, which were not significant (Fig. 2E). Secretion of vascular endothelial growth factor (VEGF), pigment epithelium-derived factor (PEDF), apolipoprotein E (APOE), and metalloproteinase inhibitor 3 (TIMP3) followed the same pattern of polarity with no significant effect of treatment in 7–8 nm GNC-treated cells compared to control cells on 2-way ANOVA, except a 26% decrease in apical APOE secretion (Fig. 2J–M). However, some significant changes in protein secretion were found after treatment with GNCs and laser. After 7–8 nm GNCs and 80 nJ laser, apical APOE secretion was reduced 56%, and apical VEGF secretion was increased 32% (basolateral 20%). PEDF and TIMP3 were not significantly changed. hiPSC-RPE cell phagocytosis of bovine outer segments was assayed after treatment with 7–8 nm GNCs, with and without laser of 80 nJ or 160 nJ, or 20 nm GNCs, or GNRs. Although GNR-treated cells showed a trend towards mildly delayed phagocytosis, the difference resolved by 24 hours, and all other treatment groups were similar to untreated groups (Fig. 2I).
Figure 2. hiPSC-RPE cell function evaluation after treatment with GNC and laser sequentially:

(a) Morphology and key marker expression of hiPSC-RPE without treatment with ultraminiature GNCs: zonula occludens protein-1 (ZO-1), CD147, EZRIN, and KIR7 by immunostaining. (b) Morphology and key marker expression of hiPSC-RPE after treatment with ultraminiature GNCs. (c) RPE markers expressed in cells treated with laser only. (d) RPE markers expressed in cells exposed to GNCs at a concentration of 100 μg/mL and then subjected to laser irradiation at 20 nJ. (e) Relative protein levels were determined by western blot for 20 nJ laser-treated hiPSC-RPE cells labeled with GNCs compared to untreated controls. Bands were quantified by densitometry and normalized to GAPDH, and values are shown relative to the control group for each protein. N=3, bars show mean ± SEM. Student t tests showed no difference between groups for each protein. Full western blots are shown in Supplementary Fig. S5. (f) Western blot for hiPSC-RPE cells with (GNCs) and without (WT) treatment with ultraminiature GNCs. (g) RPE marker transcript levels. N=3, mean±SEM, analyzed by multiple unpaired t tests, *p<0.05, **p<0.01. (h) TEER with and without treatment with ultraminiature GNC. Weeks= weeks post-passage. N=24, mean±SEM, 2-way ANOVA showed no effect of treatment. (i) Comparison of RPE phagocytosis for cells after different treatments: 7–8 nm GNCs, 20 nm GNCs, GNRs, 7–8 nm GNCs followed by laser irradiation at 80 nJ (laser 4x) and 160 nJ (laser 8x). (j) VEGF secretion, (k) PEDF secretion, (l) APOE secretion, and (m) TIMP3 secretion by cells after different treatments. For (j-l), N=3, bars show mean±SEM. 2-way ANOVA tests showed a significant effect of polarity for all factors, while all except TIMP-3 had a significant effect of treatment as well. Significant results of multiple comparisons are shown with *p<0.05, **p<0.01, ***p<0.001, and ****p<0.0001.
Transplantation of GNC labeled hiPSC-RPE cells in laser-induced RPE injury eye and longitudinal in vivo PAOFM imaging.
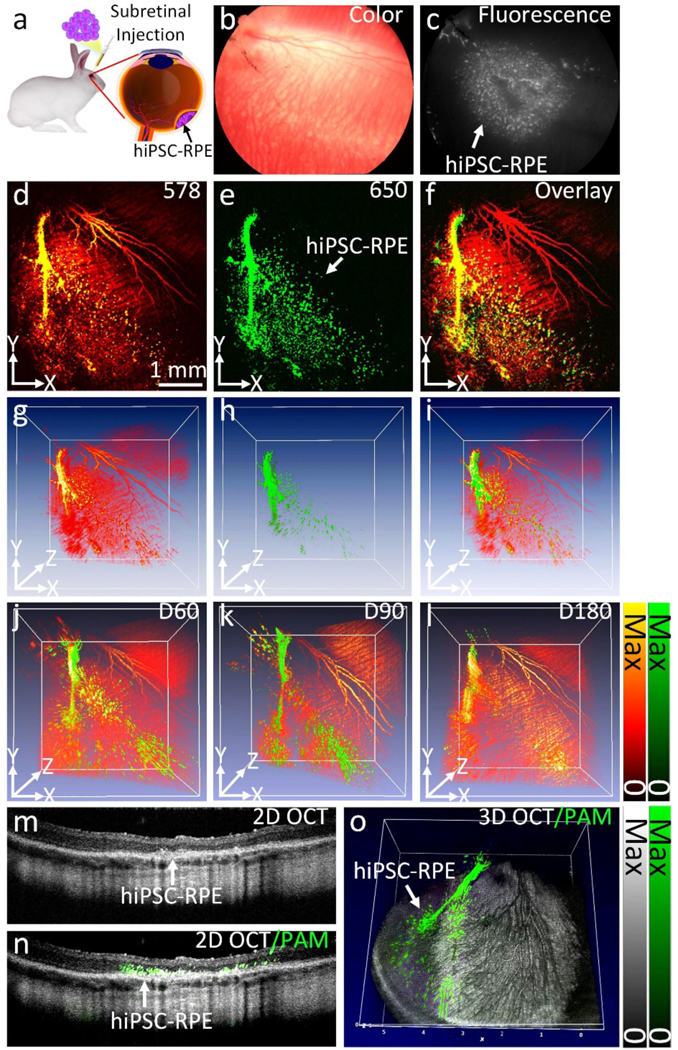
Employing a rabbit eye model featuring laser-induced RPE injury, we validated the feasibility of PAOFM imaging of transplanted pluripotent stem cells differentiated to RPE cells (hiPSC-RPE) which are labeled by GNCs for contrast enhancement. Fig. 3 shows the in vivo longitudinal tracking of hiPSC-RPE cells after transplantation in the rabbit subretinal space. In this experiment, 1×10⁵ hiPSC-RPE cells labeled with GNCs were injected into the subretinal space of a rabbit, and the cells underwent imaging for a duration of 180 days utilizing OCT, color fundus photography, FM, and PAM at various wavelengths. Fig. 2A–5A illustrate color fundus photography obtained in vivo before and after cell transplantation. To mimic clinical RPE and photoreceptor degeneration, photocoagulation in the rabbit eye was induced by laser with power of 800 mW, aerial beam size of 500 μm, and time duration of 0.1 s. At day 4 post laser illumination, the RPE layer was significantly changed along with the photoreceptors. These changes were observed on the color fundus photography obtained before cell transplantation. In the laser-treated area (white dotted circles), blood flow was reduced (white-red color) in comparison with the untreated area. In previous experiments we have demonstrated that the laser treatment can cause RPE and neurosensory retinal changes in the rabbit retinal structure. There was significant reduction in ONL, IPL, and photoreceptors observed at the laser-injury sites. We also noted that the transplanted hiPSC-RPE cells gradually gathered at the laser injury sites (black area). Fig. 3B and Fig. 4B illustrates the fluorescent images obtained pre- and post-transplantation of hiPSC-RPE cells. No fluorescent contrast was detected before cell transplantation or post-transplantation of unlabeled cells (Fig. 5B unlabeled cells). Excellent fluorescent contrast was observed after cell transplantation for up to 28 days (Fig. 3B and Fig. 4B). Afterward, the fluorescent contrast was gradually reduced and almost gone by 56 days. The high fluorescent contrast is notable at the damaged RPE sites to where the transplanted cells migrated and gathered (red dotted circles). Fig. 4C–D and Fig. 4C–D and Fig. 5C–D illustrate the selected serial PAM images of hiPSC-RPE cells and the surrounding retinal blood vessels in living rabbit eyes pre- and post-transplantation of cells using two different excitation laser wavelengths, including 578 nm to visualize both hiPSC-RPE cells and the structure of retinal microvasculature and 650 nm to visualize only the hiPSC-RPE cells. The laser-injured sites were also clearly visualized on the PAM conducted using a laser wavelength of 578 nm. Due to reduction of the blood vessels at the laser injury sites, the PAM image contrast was significantly decreased compared to that of the healthy area. The PAM images captured at 650 nm depict the spatial distribution and migration patterns of hiPSC-RPE cells within the subretinal region, exhibiting notable contrast against the neighboring microvasculature as a result of the strong optical absorption of melanin and the internalized GNCs inside the cells. We found that the population of hiPSC-RPE cells at the injury sites increased over time post injection (white dotted circles) as hiPSC-RPE cells gradually migrated to the RPE injured sites and started grafting around the injury sites to replace the damaged RPE cells. In addition, visualization of the grafted hiPSC-RPE cells was achieved even at 180 days post-transplantation, as shown in Fig. 3D, as a result of the formation of pigmented particles or melanin within the hiPSC-RPE cells. To demonstrate the effectiveness of PAM imaging in longitudinally monitoring stem cells, three-dimensional PAM images obtained at 578 nm and 650 nm were rendered and co-registered on the same orthogonal imaging planes (Fig. 3E and Supplementary video 1). These images exhibit hiPSC-RPE cells located in the subretinal space at the depth of around ~300 μm from the retina with great contrast when compared to that of the surrounding retinal microvasculature. By quantification of the PA image contrast extracted from the transplanted hiPSC-RPE cells, the normalized PA signal amplitudes were determined for each time point (Fig. 3F). This panel illustrates that the PA signal amplitudes surged by 37 times, escalating from 3.19±0.84 (a.u.) before transplantation to 117.31±11.66 (a.u.) by day 7 post-transplantation. Then, the PA signal steadily diminished but remained high (~28-fold) up to 180 days (PASignal = 88.48±4.98 (a.u.)) as a result of very strong optical absorption of the cell’s melanin. For the unlabeled injection group (blue line), the PA signal amplitudes reduced by about 60% from 69.64±21.26 (a.u.) for pre-transplantation to 42.03±8.26 (a.u.) for day 14 post-transplantation. This reduction in PA signal is believed to be due to the loss of the cell’s melanin caused by the cellular stress. Afterward, the cell’s melanin gradually restored and led to PA signal increasing by 13-fold from 6.96±0.70 (a.u.) pre-transplantation to 88.41±31.50 (a.u.) for day 90 post-transplantation. The PA signal was stable from day 90 to day 180 with the stabilization of pigmentation in mature hiPSC-RPE cells (PASignal = 85.47±18.71 (a.u.)). For the dead hiPSC-RPE cells group (green line), the PA signal amplitudes rapidly reduced and almost vanished after 60 days post-transplantation. By performing segmentation on the fluorescent images to isolate the contrast originated from ICG coated on GNC-labeled hiPSC-RPE cells, the fluorescent signal intensity was determined and plotted in Fig. 3G. The graph shows that the fluorescent intensity surged by 31 times, rising from 7.59±0.64 (a.u.) before transplantation to 235.13±11.91 (a.u.) immediately post-transplantation (red line). Then, the signal reduced and vanished by day 60 post-transplantation. Similarly, with dead cell injection, the fluorescent signal reduced more rapidly post-transplantation and almost vanished after 30 days (green line).
Figure 3. hiPSC-RPE cell migration, and RPE replacement assessment:

(a) Color fundus photography obtained in vivo before and after cell transplantation. White dotted circles indicate the regions of RPE injury caused by laser photocoagulation. The black area on the fundus images exhibits the distribution of hiPSC-RPE cells after transplantation. (b) Fluorescent images of hiPSC-RPE cells labeled with ICG-GNC-RGD. (c–d) Location and migration pattern of the transplanted hiPSC-RPE cells were observed by capturing PAM images at 578 nm, enabling visualization of both the morphology of native retinal vessels and the transplanted stem-cell differentiated to RPE (c), and at 650 nm to distinguish the transplanted stem-cell differentiated to RPE from the vasculature (d). Pseudo-green color depicts the migration pattern of the transplanted hiPSC-RPE cells. (e) Combined 3D PAM images at 578 nm and 650 nm. (f) Quantitative normalized PA signal amplitudes were obtained at multiple time points for three different treatment groups: hiPSC-RPE cells labeled with GNCs, unlabeled hiPSC-RPE cells, and dead hiPSC-RPE cells. (g) Quantitative normalized fluorescent intensities were obtained at multiple time points for two different treatment groups: hiPSC-RPE cells labeled with GNCs, and dead hiPSC-RPE cells. Data shows as mean ± SD (n=3).
Figure 5. In vivo multimodal imaging of unlabeled hiPSC-RPE cells:

(a) Color fundus photographs. (b) Fluorescent images. (c) PAM images obtained at 578 nm. (d) PAM images acquired at 650 nm. White arrow demonstrates the distribution of hiPSC-RPE cells.
Figure 4. Additional in vivo longitudinal images of stem cells after transplantation:

(a) Color fundus photographs. (b) Fluorescence images. (c) PAM images obtained at 578 nm. (d) PAM images acquired at 650 nm. Pseudo-green color demonstrates the distribution of hiPSC-RPE cells.
Figure 6 shows longitudinal OCT and the combined OCT and PAM images. The location and migration pattern of labeled hiPSC-RPE cells were imaged at different time points over a period of 180 days. Two-dimensional OCT images before the injection illustrate the different layers of the eye, including vitreous, retinal vessels (RVs), choroidal vessels (CVs), RPE, sclera, and laser-injured sites (Fig. 6A). These retinal layers were intact even when treated with laser at high power. Immediately after transplantation, localized subretinal fluid was observed. These labeled hiPSC-RPE cells were visualized in the subretinal space with high OCT contrast provided by the strong scattering of GNCs, demonstrating the capability of OCT for real-time visualization of the transplanted stem-cell differentiated to RPE (Supplementary Video 2). There were some cells observed on the human vitreous (hyperreflective dots), a consequence of reflux when withdrawing the needle. The transplanted cells gradually migrated to the laser-injured sites to replace damaged RPE cells (Fig. 6B–G and Supplementary Fig. S5A–F). The increased optical scattering of the internalized GNCs inside the cells allows differentiation of the grafted hiPSC-RPE cells against the intrinsic optical contrast provided by retinal tissues. The OCT images also demonstrate the dynamic changes in cell growth, population, and migration patterns over time. Importantly, the growth of xenografted hiPSC-RPE cells was clearly identified in the combined OCT and PAM images (Fig. 6H–N). Pseudo-green color illustrates the location of hiPSC-RPE cells with excellent contrast. These cells were primarily visualized in the subretinal space, RPE, photoreceptor, ONL, IPL, and INL layers, illustrating that the transplanted hiPSC-RPE cells were gradually grafted and replaced damaged RPE cells. In order to visualize the full distribution of the transplanted hiPSC-RPE cells, 3D OCT images were obtained in the same animal at different times up to 180 days and combined with PAM images obtained at 650 nm. Representative images are displayed in Fig. 6O–Q. Images acquired at different time points were provided in Supplementary Fig. S5G–L. The long-term growth and location of hiPSC-RPE cells visualized on these 3D PAM and OCT combination images with high contrast suggest that targeted GNC enables longitudinal tracking of live stem cells with excellent sensitivity. Using an image segmentation algorithm to extract the distribution of hiPSC-RPE cells, the migration area occupied by the cells was determined and plotted in Fig. 6R. This demonstrates that the migration area increased 88% from 0.31±0.04 mm2 on day 1 to 0.58±0.06 mm2 on day 90 post-transplantation. The migration area was then stable over a period of 180 days, illustrating the stability of the transplanted hiPSC-RPE cells after forming a monolayer in the subretinal space. This result also suggests that PAOFM imaging enables long-term visualization of cell growth.
Figure 6. The 3D, 2D cross-sectional OCT, and combined PAM and OCT images of the hiPSC-RPE cells after transplantation:

(a) 2D OCT image of the RPE removal model obtained before stem cell transplantation. The yellow arrow shows the location of the RPE-damaged area. Retinal vessels (RVs), choroidal vessels (CVs), sclera, and RPE were visualized in the untreated areas. (b) 2D OCT image of the retina after stem cell transplantation. Localized subretinal fluid and the distribution of labeled hiPSC-RPE cells (red arrow) were visualized. (c–g) 2D OCT images were acquired at different time points: day 14 (c), day 28 (d), day 60 (e), day 120 (f), and day 180 (g), post-transplantation. Yellow dotted lines indicate the margin of the transplanted hiPSC-RPE cells. Red arrows depict the replacement of hiPSC-RPE cells at the location of the RPE-damaged areas. (h–n) Combined 2D PAM image obtained at 650 nm and 2D OCT image. Pseudo-green color indicates the detected hiPSC-RPE cells located at the subretinal space. (o–q) Combined 3D PAM and OCT images at day 14 (o), day 28 (p), and day 180 (q) post-transplantation. (r) Quantitative measurement of cell migration areas. Data are represented as mean ± SD (n=3)
To assess the dynamic changes of transplanted stem-cell differentiated to RPE cells in a healthy retina as a control, we performed subretinal injection of labeled cells into a healthy rabbit’s retina (Fig. 7). The injection procedure was illustrated in Fig. 7A. In this experiment, a volume of 40 μL cells at a density of 2.5×10⁶ cells/mL was injected subretinally into the rabbit retina and the growth of the transplanted hiPSC-RPE cells was visualized on the color fundus (Fig. 7A) and fluorescent images (Fig. 7B). The high image contrast provided by fluorescence emission demonstrates the cell population post-transplantation without any evidence of immune rejection or inflammation. Fig. 7D–L shows the 2D and 3D PAM images of hiPSC-RPE and the adjacent microvasculature obtained at 578 nm and 650 nm at different time points up to 180 days. Although cells can also be seen on the PAM images obtained at 578 nm, the strong signal from the surrounding retinal vessels makes it difficult to quantify the cell population and migration area. In contrast, the cells are imaged with much higher contrast to background ratio at 650 nm where hemoglobin has low optical absorption (Supplementary Video 3). Spectroscopic PAM image demonstrates the capability for achieving even better distinction between hiPSC-RPE cells and surrounding blood vessels by acquiring PAM images at longer excitation wavelengths (Fig. 8A–J). As shown in Fig. 8A, the cells were better differentiated from the surrounding blood vessels in the spectral range of 610 nm to 710 nm with the strongest contrast achieved at around 650 nm. The quantification of PA signal amplitude (Fig. 8K) suggests the peak absorption of GNC at 650 nm which is similar to that measured by UV-Vis shown in Fig. 1C. 2D OCT, 2D PAM and OCT combination, and 3D PAM and OCT combination images show the cell population in the subretinal space without migration to the photoreceptor or ONL layers (Fig. 7M–O).
Figure 7. In vivo multimodal imaging of the transplanted hiPSC-RPE cells:
(a) Schematic of subretinal transplantation. (b) Color fundus photo showing major retinal vessels. (c) Fluorescent image of the transplanted hiPSC-RPE cells labeled with ICG-GNC-RGD. The white color indicates the distribution of the transplanted hiPSC-RPE cells. (d–e) 2D PAM images obtained at 578 nm (d) and 650 nm (e), respectively. (f) Combined 2D PAM and OCT image. (g–i) 3D volumetric PAM images. (j–l) Combined 3D PAM and OCT images obtained at different time points: day 60 (j), day 90 (k), and day 180 (l), post-transplantation. The green color shows the migration pattern of the transplanted hiPSC-RPE cells. (m) Selected 2D OCT image. (n) Combined 2D OCT and PAM image. (o) Combined 3D OCT and PAM image.
Figure 8. Spectroscopy PAM images obtained at different excitation wavelengths ranging from 500 nm to 710 nm:

(a) Minimal PA signal was observed at 500 nm. Strong absorption of hemoglobin (Hb) occurred from 563 nm to 578 nm (Figure b-d). The morphology of retinal, choroidal vessels, and the transplanted hiPSC-RPE cells were clearly observed. In contrast, the transplanted hiPSC-RPE cells were clearly differentiate from the surrounding microvascular from 610 nm to 710 nm (Figure e-j) where Hb has very low optical absorption in this spectral window. (k) Quantitative PA signal amplitudes of transplanted hiPSC-RPE cells as a function of wavelength.
To study the potential artifacts produced by dead cells, material transfer, or extracellular gold nanoparticles after cell transplantation, we implemented two control experiments: transplantation of dead cells labeled with GNCs and transplantation of bare GNCs without cells (Fig. 9 and Supplementary S6). In these experiments, we injected 40 μL of dead hiPSC-RPE cells labeled with GNCs at a density of 2.5×10⁶ cells/mL, and 40 μL of GNCs at a mass concentration of approximately 20 μg/mL which is equal to the total GNCs uptaken by 105 cells. By monitoring the decay signal using PAM and fluorescence imaging, we found that both PA and fluorescence signals rapidly decreased post-transplantation and almost disappeared by day 21. In addition, the subretinal fluid after injection rapidly resolved within 1-day post-transplantation. The 2D and 3D OCT images showed no evidence of tissue destruction or RPE atrophy post-transplantation. The findings from these control experiments illustrate that the PA signal generated by dead cells is weak, while the PA signal generated by bare GNCs decreases rapidly after transplantation, both different from the situation of PAM imaging of live hiPSC-RPE cells labeled by GNCs.
Figure 9. In vivo multimodal imaging of transplanted dead hiPSC-RPE cells:

(a–j) Color fundus photography, fluorescence, PAM images obtained at 578 and 650 nm, 2D OCT and 3D OCT images acquired before and after transplantation at different time points: 1, 3, 7, 14, 21, 28, 60, 90, and 180 days.
Histological analysis and immunohistochemistry visualization of hiPSC-RPE cells:
We next performed a comprehensive eye examination using a slit lamp to evaluate any potential side effects caused by the light used in imaging. The examination revealed that the light used in PAM and OCT imaging did not cause any problems to the cornea, anterior segment, or lens. More extensive evaluation of the safety of our imaging system has been completed and reported in our previous publications27.
To assess the location of the transplanted hiPSC-RPE cells, the rabbits were euthanized at day 180 post-transplantation and the retinal tissues were stained with hematoxylin and eosin (H&E). Control H&E image (Fig. 10A) shows the normal architecture of the retina including the internal limiting membrane (ILM), ganglion cell layer (GCL), inner plexiform layer (IPL), inner nuclear layer (INL), outer plexiform layer (OPL), outer nuclear layer (ONL), photoreceptors layer (PL), retinal pigment epithelium (RPE), choroidal layer (CL), and sclera. A single layer of RPE cells was visualized. In the group with transplanted hiPSC-RPE cells and without laser injury, the transplanted hiPSC-RPE cells were observed with high expression of pigmentation or melanin as shown in Fig. 10B. hiPSC-RPE cells were not detected in areas of ONL and PL, and there was no significant difference in the retina thickness or architecture of each retinal layer observed in this group. In Fig. 10C showing the H&E images of the group with transplanted hiPSC-RPE cells and with laser injury, there were significant changes in the architecture of the INL, OPL, ONL, PL, and RPE layers. Confluent RPE cells with a pigmented monolayer were detected along with the distribution of grafted hiPSC-RPE cells on other layers including INL, OPL, ONL, and PL, confirming the replacement of damaged RPE cells with the hiPSC-RPE cells. 2D OCT (Fig. 10D) and PAM image obtained at 650 nm (Fig. 10E) validated the occurrence of hyperreflective patches (yellow dotted line), revealing donor cells that matched well with histological images (Fig. 10F). These results suggest the capability of PAOFM imaging to precisely identify the location of the transplanted hiPSC-RPE cells. On the immunofluorescence staining images, nonpigmented RPE cells were strongly positive for RPE-65 (Fig. 10G–H). As expected, xenografts of hiPSC-RPE cells were strongly positive for NuMA in both groups with and without laser injury. This illustrates that hiPSC-RPE cells successfully integrated, gradually becoming donor cells and replacing the RPE loss.
Figure 10. Histological and immunofluorescent analysis:

(a) H&E staining image of the control group (without cell transplantation). This image shows different layers of the posterior pole of the eye, including the internal limiting membrane (ILM), ganglion cell layer (GCL), inner plexiform layer (IPL), inner nuclear layer (INL), outer plexiform layer (OPL), outer nuclear layer (ONL), photoreceptor layer (PL), choroid layer (CL), RPE, and sclera. (b) H&E image obtained from the tissue received subretinal injection of hiPSC-RPE cells without laser-induced RPE removal model. The transplanted hiPSC-RPE cells formed a single layer post-injection at day 180 (white arrows). (c) H&E image of the ribbit retina post-transplantation of hiPSC-RPE cells and with laser-induced RPE damage. The architecture of the retina was significantly changed at the position of laser injury sites. The transplanted hiPSC-RPE cells replaced damaged RPE (white arrows). (d) Magnification of 2D OCT image showing the margin of hiPSC-RPE cells. (e) 2D PAM image obtained at 650 nm. (f) Registered PAM and H&E images. Green color shows the location of hiPSC-RPE cells which was co-registered with pigmented RPE cells showing on the H&E image. (g–h) Immunofluorescence images were acquired from two different groups: without the laser-induced RPE damage (g) and with the laser-induced RPE damage (h). DAPI-stained nuclei (blue color), NuMA-stained hiPSC-RPE cells (green), and RPE65-stained RPE and hiPSC-RPE cells.
The current study demonstrates the potential of ultraminiature GNCs for allowing enhanced visualization of transplanted hiPSC-RPE cells over a period of 6 months. The ultraminiature GNC offers exceptional advantages as a contrast agent for PAM and OCT by providing strong optical absorption in the NIR window and strong optical scattering while boasting a width of 5–7 nm, which is about 25 times smaller than GNPs that have a similar optical absorption peak around 650 nm (~160 nm). After hiPSC-RPE cells were labeled with GNCs, their PAM signal was increased by 37-fold as a result of the GNC’s strong optical absorption and hemoglobin’s low optical absorption in the NIR region. The OCT signal of cells was also increased by 195% due to the strong optical scattering ability of GNCs. In addition, ICG on the surface of GNCs increased the fluorescent signal by 31-fold post-transplantation of labelled cells. Most importantly, the PAM and OCT signals from the cells can be observed for up to 180 days post-transplantation. This could be explained by the superior photostability of the internalized GNCs and the formation of pigmented particles in the hiPSC-RPE cells over time. Fluorescence imaging can also visualize the grafted cells with great contrast, but the signal rapidly decreased with time and almost vanished 60 days post-transplantation due to the rapid biodegradability of fluorescent dye on the surface of GNCs. This result is similar to previous studies,19c, 19e demonstrating that fluorescent imaging can visualize the transplanted cells only for a short time window of 21 days post-transplantation. The ultraminiature size of the GNCs allowed for enhanced renal excretion via urine post intravenous administration as demonstrated in vivo. This irreplaceable feature drastically improves the safety of GNCs as a contrast agent for labeling and tracking cells, especially in the situation of repeated use. To further evaluate the safety of the GNCs, we performed a TUNEL assay analysis on retinal tissue post subretinal transplantation, which showed no evidence of apoptosis (Supplementary Fig. S7). This result suggests the use of GNCs is safe in stem cell therapy for regenerative medicine.
To perform a comprehensive safety evaluation of any potential side effects that GNC or laser illumination could cause to hiPSC-RPE cells, we performed comprehensive RPE cell function studies such as TEER, RPE marker transcript and protein levels, phagocytosis, and secreted factors (VEGF, PEDF, APOE, and TIMP3). None of the cells treated with GNCs with and without laser illumination showed any change in the cells’ function. Immunofluorescence images also confirmed that all RPE biomarkers such as ZO-1, CD147, EZRIN, and KIR7 were not significantly changed after treatment with the ultraminiature GNCs followed by laser illumination at a fluence at 50% of the ANSI safety limit. The normal honeycomb morphology of the treated cells was unchanged in comparison to the control group.
The hiPSC-RPE cells used in this study were heavily pigmented in vitro before harvesting for in vivo experiments. Following the in vivo subretinal transplantation, the cells initially lost their pigmentation due to stress during trypsinization and harvesting, leading to reduced PA signal as shown in Fig. 5 (control group with unlabeled cells). Afterward, the pigmentation regenerated after 28 days post-transplantation as demonstrated by the gradual increasing of PA signal, which is consistent with previous studies16b. In this study, we also found that the subretinal injection of a suspension of hiPSC-RPE cells can establish a monolayer when injected into a healthy retina of rabbit eye. The transplanted cells gradually integrated into the native RPE layer and became donor cells without migration to the photoreceptor or choroidal layer as shown in histological and immunohistochemistry staining images (Fig. 10B, 10C, 10G, 10H). We did not see macrophages or other inflammatory cells appear at the injection area, indicating that there is no evidence of immuno-rejection. Furthermore, we studied hiPSC-RPE cells transplanted in the retina with existing laser-induced RPE damage and found that donor cells were detected in regions of damaged RPE. These results suggest that the transplanted hiPSC-RPE cells can migrate to areas of damage and properly integrate with native RPE cells.
The limitation of this study is that the use of New Zealand white rabbits in our eye/optics differs significantly from that of humans due to their albino nature and distinct eye pigmentation. This inherent difference may affect the generalizability of our findings to the human population. The albino characteristics of these rabbits result in a low background, potentially influencing the outcomes of optical techniques. While our study provides valuable insights within the context of our experimental model, we recognize the importance of caution when extrapolating these results to human subjects. Future studies employing a more diverse range of animal models or incorporating additional considerations related to eye pigmentation may provide a more comprehensive understanding of the translational implications for regenerative medicine.
Conclusions
This study demonstrates a multimodal PAOFM imaging technique for tracking hiPSC-RPE cells post-transplantation for cell-based therapy applications. This three-dimensional imaging system combining PAM, OCT, and FM is a non-invasive, real-time, and offers high spatial resolution and high sensitivity for tracking transplanted stem cells in vivo. The location and migration pattern of the transplanted hiPSC-RPE cells, as well as their replacement of damaged RPE cells, were visualized and imaged longitudinally for the inaugural occasion. Due to its distinctive “chain” design, the optical absorption peak of the GNCs is red-shifted to the red/NIR spectrum (e.g., 620 nm), which successfully avoids the overlap with the strong optical absorption peak of hemoglobin and facilitates capturing high resolution images and tracking labelled stem cells in eye tissues in vivo. The “chain” design also allows GNCs to keep a size of 7–8 nm, allowing them to be renally excretable. We envision this innovative stem cell imaging technology will have a wide range of applications in biomedicine and regenerative medicine, including offering additional opportunities for tracking stem cell fates to study therapeutic response and evaluate the regeneration of damaged tissue.
Materials and Methods
Cell culture:
hiPSC-RPE cells were differentiated from healthy control fibroblast-derived iPSCs (LAgen Labs, line 006-BIOTR-0001 Clone1). This study was approved by the University of Michigan Human Pluripotent Stem Cell Research Oversight (HPSCRO) Committee. Quality control for iPSCs included immunocytochemistry for pluripotency markers (Oct4, SSEA, Nanog, and TRA-1–60), and karyotyping. iPSCs were cultured and differentiated into RPE as previously described 30. Briefly, islands of RPE were identified by pigmentation and cobblestone morphology and were dissected using a 21-gauge needle from surrounding cells between days 50 and 90. Cells were passaged at a density of 50,000 cells/well onto a laminin-coated 24-well plate. After at least 4–5 weeks hiPSC-RPE cells were passaged onto Transwells. TEER was measured weekly with an EVOM device with an STX2 electrode (World Precision Instruments).
Reverse transcription-polymerase chain reaction (RT-PCR):
RNA was extracted from hiPSC-RPE cells (RNeasy Mini Kit, Qiagen) and used to make complementary DNA (SuperScript II reverse transcriptase, Invitrogen). Multiplexed RT-coupled PCR was performed in the Biorad iCycler (POWER SYBRTM Green PCR Master Mix, Applied Biosystems). Each biologic replicate was run with technical triplicates and transcript levels were normalized to ACTB.
Western Blot:
For APOE and TIMP3, apical and basolateral conditioned media was collected from hiPSC-RPE grown on Transwells (Corning). For RPE markers, cells were harvested for lysate. Sodium dodecyl sulfate (SDS) buffer was added to all samples, and recombinant recoverin was added at a final concentration of 0.5 nM for normalization. Samples were immediately used for SDS-polyacrylamide electrophoresis (SDS/PAGE), enzyme-linked immunoassay (ELISA), or stored at −80°C. After electrophoresis, proteins were transferred onto PVDF membranes. The membranes were blocked with 2% fetal bovine serum (FBS) and 0.5% tween-20 is tris buffered saline (TBS). Membranes were then incubated with primary antibody overnight, then washed and incubated with horse radish peroxidase (HRP)-conjugated secondary antibody for 1 hour. EcoBright Femto HRP (Innovative Solutions) was used to develop membranes, and an Azure c500 (Azure Biosystems) was used to photograph. Densitometry quantification was performed with ImageJ software.
Enzyme-Linked Immunosorbent Assay (ELISA):
Secreted VEGF (R&D Systems, SVE00) and PEDF (R&D Systems, DY117705) were detected by ELISA. For PEDF, the wells were coated overnight with capture antibody diluted in PBS, then blocked for 1 hour with Reagent Diluent. For VEGF, the plates were pre-coated and pre-blocked by the manufacturer. The samples diluted in assay diluent, and standard concentrations of recombinant VEGF or PEDF, were added to the pre-coated plates in technical triplicates for 2 hours, washed, and incubated with detection antibody conjugated with HRP for 2 hours. H2O2 and the chromogen tetramethylbenzidine were used to develop and a microplate reader was used to measure optical density.
Synthesis of RGD-GNC:
RGD-GNC, which are chain-like clusters of gold nanoparticles (GNPs), were produced for use as external contrast agents in the identification and monitoring of stem cells through high-resolution OCT and PAM imaging. Individual GNPs are created using an Ytterbium-doped femtosecond fiber laser that generates nanoparticles with a negative charge. The GNPs are extremely stable and require no capping or stabilizing agents. In order to assemble the gold monomers in clusters, the nanoparticles are mixed with a CALNN peptide solution at a molar ratio of 2000:1 (CALNN peptides to gold nanoparticles). Then the CALNN/GNP solution is exposed to cysteamine at a ratio of 1700:1 (cysteamine to GNPs). This process can take a couple of days for the nanoparticles to fully assemble into clusters and is characterized by the solution turning from red-pink to a blue color.
Next, our GNCs were functionalized with RGD ligands. A volume of 5 mL of GNCs underwent PEGylation by mixing with 20 μL of thiol-terminated PEG (PEG-SH) with a molar mass of 2000g mol −1 (PEG-2k-SH), and the mixture was left at room temperature for 2 hours. Then, 60 μL of 1mM RGD ligand was then added to the partially PEGylated GNCs and left at room temperature for 2 over hours. The mixture was then centrifuged at 1000g for 30 minutes. The GNCs exhibited a final absorbance peak at 650nm, which was normalized to 100nm by redissolving the pellet in a 4 mM borate buffer (pH 8.2) containing 5 mg/mL BSA. The GNCs were also labeled with ICG for fluorescence imaging. A two-step process was developed for conjugating ICG molecules onto GNCs without the issue of desorption. Initially, ICG molecules were labeled onto thiolated PEG with a molecular weight of 2000 (SH-PEG 2000) through the formation of a covalent amide bond by reacting SH-PEG 2000-amine with ICG NHS ester. Subsequently, the ICG-labeled PEG molecules were conjugated onto GNCs via the creation of a stable gold-thiol bond (197.4 kJ/mol). GNCs were combined with PEG-2k-SH and allowed to incubate for 2 hours at ambient temperature. The partially PEGylated GNCs were subsequently mixed with 50 μL of 1mM ICG-PEG-2k-SH and incubated for 2 hours to facilitate ample ICG labeling. Following that, 70 μL of a 1mM RGD peptide solution was added and left for an additional 2 hours to enable the attachment of RGD peptides to vacant areas within the GNC. The resulting mixture was centrifuged at 1000g to form a pellet, which was then reconstituted in a 4 mM borate buffer (pH 8.2) containing 5 mg/mL BSA to recalibrate the optical absorbance to OD 10 at 620 nm.
Physical and Optical Analysis of GNC-RGD:
The morphology, size dispersion, and optical absorption properties of the GNCs were assessed to ascertain the achievement of the synthesis process. Dynamic light scattering was employed to determine the size distribution of the GNCs using the Zetasizer Nano ZS90 instrument from Malvern Instruments, located in Malvern, Worcestershire, U.K. GNC morphology was observed using transmission electron microscopy (JEOL 2010F, Japan). A Spectrophotometer was used to detect absorbances of GNCs in the range of 350nm to 800nm (UV-3600, Shimadzu Corp., Japan). The stability of our GNCs was analyzed by measuring absorbance for up to 2 months at various time points. To evaluate the biological stability of our particles in cells, the biodistribution of GNCs was visualized under confocal microscopy in hiPSC-RPE at different time points. The optical absorbance of these cells was also determined. In order to test photostability of GNCs, we irradiated our particles at multiple different laser fluences with a 650 nm nanosecond pulsed laser. Photostability was also tested in vitro by taking multiple PAM images of fixed cells samples at the same location and measuring the PA signal amplitude.
Cytotoxicity Analysis:
In order to test the in vitro cellular uptake of our GNCs, we prepared an ultrapure solution of GNC-RGD sterilized under UV light for 12 hours before introduction into cells. The GNC-RGD were also conjugated with ICG for visualization with confocal laser scanning microscopy. Cells were cultured with GNCs at specified concentrations of 0, 25, 50, and 100 ug/mL for 24 hours. The cells were then stained with FITC, DAPI, and PI. The media was switched with a fresh media containing Lysotracker. The cells were finally labeled with Alexa Fluor 488-conjugated phalloidin and visualized under a SP5 confocal laser scanning microscope. In order to quantify levels of internalized GNCs in cells, The treated cells underwent dilution with HCl and HNO3, followed by filtration and quantification using ICP-MS.
Potential in vitro toxicity of GNCs to our cells was also tested via MTT assay. APRE-19, HeLa, HUVEC, and hiPSC-RPE were cultured with different concentrations of GNCs ranging from 12.5 to 500 μg/mL for durations of 24 and 48 hours. Cell viability was assessed using the MTT assay.
Potential toxic effects of GNCs in vivo were also assessed. All rabbits underwent euthanasia, and major organs including the eye, heart, kidney, liver, lung, and spleen were collected for the quantification of GNC levels via ICP-MS. Histological examination, utilizing H&E staining and TUNEL assay, was employed to observe retinal regeneration and detect potential cellular damage resulting from GNC exposure.
Labeling of hiPSC-RPE cells for injection:
hiPSC-RPE cells were cultured with GNC-RGD at a concentration of 100 μg/mL for a duration of 24 hours. The cells were then washed with PBS and harvested with 0.05% Trypsin/EDTA. The harvested cells were then centrifuged, counted, and resuspended in PBS.
Injection and Imaging:
All animal experiments adhered to the guidelines outlined in the Statement of the Association for Research in Vision and Ophthalmology (ARVO) and were conducted in compliance with approved protocols from the Institutional Animal Care and Use Committee (IACUC) at the University of Michigan (PRO000010388). A group of eighteen New Zealand white rabbits (weighing between 2.05 and 3.24 kg; aged between 3 and 5 months, both genders, male and female) were graciously provided by the Center for Advanced Models and Translational Sciences and Therapeutics (CAMTraST) at the University of Michigan Medical School. The rabbits were separated into various experimental cohorts: those that received subretinal injections of saline, subretinal injection of bare GNC-RGD-ICG, Subretinal administration of hiPSC-RPE cells labeled with GNC-RGD-ICG, both with and without laser-induced damage to the RPE, subretinal injection of dead hiPSC-RPE cells labled with GNC-RGD-ICG, and subretinal injection of unlabeled hiPSC-RPE cells.
For RPE damage groups that received labeled hiPSC-RPE cells, 4 days after laser-induced RPE damage, rabbits were anesthetized and administered 30 μL of GNC-labeled hiPSC-RPE cells at a cellular concentration of 106 cells/μL. The needle was guided using real-time OCT imaging during this procedure. After stem cell transplantation, rabbits were imaged with OCT, PAM, and fluorescence microscopy imaging (PAOFM). Rabbits were anesthetized and kept warm with a water-circulating heating blanket. Solutions of 1% tropicamide ophthalmic and 2.5% phenylephrine hydrochloride were used to dilate the pupils of the rabbits, and the vital signs of the rabbits (heart rate, respiratory rate, and body temperature) were observed at 15-minute intervals throughout the entire procedure.
For PAM imaging, our contrast agent permitted the utilization of a nanosecond laser operating at 570 nm, delivering a pulse energy of 80 nJ as the excitation source, which is within half of the American National Standards Institute (ANSI) safe limit for ocular exposure. The emitted excitation beam had a pulse width ranging from 3ns to 5 ns and a repetition rate of 1 kHz. Our maximum scan area was 5mm × 5mm, and the image acquisition time was 65 seconds. We employed a custom-made needle-shaped transducer with a central frequency of 27 MHz to detect laser-induced ultrasound signals. With our configuration and contrast agent, we achieved an axial and lateral resolution of 37.0 and 4.1 μm, respectively, for cell imaging. The PAM data was reconstructed and visualized in 3D using Amira software.
OCT images were captured using a commercially available OCT system with custom modifications (Ganymede-II-HR, Thorlabs, Newton, NJ). These adaptations involved the inclusion of an ocular lens following the scan lens and the integration of a dispersion compensation glass in the reference arm. Crucially, alignment was ensured between the OCT excitation beam and the PAM beam to facilitate the combination of OCT and PAM images. The mean OCT, PAM, and fluorescence signals within transplanted cells were quantified for each corresponding OCT, PAM, and fluorescence image. Error bars represent the standard deviation of measurements obtained from three separate samples.
Histological Analysis:
All the animals were euthanized at day 180 post injection using pentobarbital (Euthanasia, VetOne, MWI Animal Health, Boise, Idaho). The eyeballs were harvested from the euthanized animals and pre-fixed in Davidson’s fixative solution (Electron Microscope Sciences, PA, USA) for 24 hrs. Then, the pre-fixed tissues were transferred to 50% alcohol solution and kept in the ambient temperature (RT) for 8 hours. Afterwards, the samples were further fixed in 70% alcohol solution for 24 hours. Then, the samples were processed and embedded in paraffin. The embedded tissues were sectioned into 4–6 μm thick and stained with hematoxylin and eosin (H&E). Light microscope (DM600, Leica Biosystems, Nussloch, Germany) was used to examine the slides and the digital images were captured using DFC365FX camera.
Immunofluorescence Analysis:
To assess the hiPSC-RPE cells after transplantation, we performed immunofluorescence staining for different treated groups and control. Briefly, the unstained slides in paraffin were first deparaffinized using xylene, and alcohol at different concentrations (100%, 95%, 85%, 70%, and 50%). The specimens underwent rinsing with distilled water and Tris-buffered saline (TBS, pH 7.6). Subsequently, they were immersed in 10 mM citrate buffer (trisodium citrate dehydrate, pH 6.0; Sigma-Aldrich, USA) containing 0.05% Tween-20 (Sigma-Aldrich, USA) and heated at 96°C for 30 minutes, followed by a cooling period at room temperature for 30 minutes. After two washes with TBS, the specimens were treated with blocking buffer composed of 10% normal donkey serum (Abcam, Cambridge, United Kingdom) and 5% (wt/vol) protease-free bovine serum albumin (Jackson Immunoresearch Labs, West Grove, PA, USA) in TBS, and incubated in a humidified chamber for 30 minutes. Primary antibodies against human nuclear mitotic apparatus protein (NuMA) (1:200; Abcam ab84680) and RPE65 (1:100; Merck Millipore MAB5428) were diluted in blocking buffer and allowed to incubate for 24 hours at 4°C. Subsequently, secondary antibodies, including Alexa Fluor 555 donkey anti-rabbit IgG A31572 and Alexa Fluor 647 donkey anti-mouse IgG A31571 (Life Technologies, Carlsbad, CA, USA), diluted 1:200 in blocking buffer, were applied and incubated for 1 hour at room temperature. The slides were mounted with prolong gold mounting medium with DAPI (Vector Laboratories, Burlingame, CA, USA) under a 24×50 mm2 coverslip. Examination and digital imaging were conducted using a light microscope (DM6000, Leica Biosystems, Nussloch, Germany) and Leica Application Suite software (LAS X, Leica Biosystems, Nussloch, Germany).
To image RPE markers by immunofluorescence in cell culture, hiPSC-RPE cells were washed in phosphate buffered saline (PBS) and fixed with 4% paraformaldehyde for 15 minutes. Cells were subsequently rinsed with PBS and then incubated in blocking buffer (3% BSA, 0.3M glycine, 0.15% Triton X-100, 1% donkey serum) for 1 hour. Following this, the cells were exposed overnight to primary antibodies, washed, and subsequently exposed to secondary antibodies conjugated with DAPI (ThermoFisher). The primary antibodies used were anti-ZO-1 (Invitrogen, 33–9100), anti-CD147 (BDPharmigen, 563020), anti-Ezrin (Invitrogen, MA5–13862), and anti-Kir7.1 (Santa Cruz, sc-22438). The secondary antibodies utilized were goat anti-mouse IgG (Jackson Immunoresearch, 715–545-150) and donkey anti-rabbit IgG (Jackson Immunoresearch, 711–545-152).
Statistical methods:
Statistical procedures involved the replication of experimental conditions three times, with PAM and OCT signals measured for each replication. ANOVA analysis was employed to evaluate potential variations among the treatment groups. Data were expressed as mean ± standard deviation (SD), with P-values below 0.05 considered statistically significant.
Supplementary Material
Acknowledgments
This work was funded by grants from the National Eye Institute (YMP:1K08EY027458, 1R01EY033000, 1R01EY034325, ATF: 1K08EY032991), Fight for Sight- International Retinal Research Foundation (YMP: FFSGIA16002), Alcon Research Institute Young Investigator Grant (YMP), unrestricted departmental support from Research to Prevent Blindness, the Helmut F. Stern Career Development Professorship in Ophthalmology and Visual Sciences (YMP), a Choroideremia Research Foundation award (ATF), the Doris Duke Charitable Foundation COVID-19 Fund to Retain Clinical Scientists (ATF). This study was also received support from the University of Michigan Department of Ophthalmology and Visual Sciences, as well as the Core Center for Vision Research, which is funded by the National Eye Institute (P30 EY007003). We are grateful to Dr. David A. Antonetti for generously providing the ARPE-19 cells, and to Dr. Phil Kish and Dr. Lev Prasov for their assistance with tissue culture. Special thanks to Dr. Steve Lenz for his help with confocal microscope analysis. We also acknowledge Drs. Yuqing Chen, Dongshan Yang, and the University of Michigan CAMTraST for their significant contribution of rabbits.
Footnotes
Supporting Information Available: The following files are available free of charge.
Supplementary Information Stem Cells Tracking using multimodal PAM and OCT imaging.docx
Urine excretion analysis using multiple methods such as fluorescent imaging and ICP-MS. Cellular uptake analysis using confocal laser scanning microscope. Cell viability was assessed for cells exposed to ultraminiature ICG-GNC-RGD at varying concentrations. In vitro toxicity and cellular uptake analysis. In vitro RPE ZO-1, CD147, EZRIN, KIR7 biomarkers analysis. Additional western blots data.
Competing interests
The authors declare no competing financial interests.
Data and materials availability:
The data that support the plots and other findings of this study are available from the corresponding authors upon reasonable request.
References
- 1.(a) Jonas JB; Cheung CMG; Panda-Jonas S, Updates on the epidemiology of age-related macular degeneration. The Asia-Pacific Journal of Ophthalmology 2017, 6 (6), 493–497; [DOI] [PubMed] [Google Scholar]; (b) Ding X; Patel M; Chan C-C, Molecular pathology of age-related macular degeneration. Prog. Retin. Eye Res. 2009, 28 (1), 1–18. [DOI] [PMC free article] [PubMed] [Google Scholar]
- 2.Gehrs KM; Anderson DH; Johnson LV; Hageman GS, Age-related macular degeneration—emerging pathogenetic and therapeutic concepts. Ann. Med. 2006, 38 (7), 450–471. [DOI] [PMC free article] [PubMed] [Google Scholar]
- 3.(a) DeWan A; Liu M; Hartman S; Zhang SS-M; Liu DT; Zhao C; Tam PO; Chan WM; Lam DS; Snyder M, HTRA1 promoter polymorphism in wet age-related macular degeneration. Science 2006, 314 (5801), 989–992; [DOI] [PubMed] [Google Scholar]; (b) Stewart MW, Clinical and differential utility of VEGF inhibitors in wet age-related macular degeneration: focus on aflibercept. Clinical ophthalmology 2012, 1175–1186. [DOI] [PMC free article] [PubMed] [Google Scholar]
- 4.(a) Rickman CB; Farsiu S; Toth CA; Klingeborn M, Dry age-related macular degeneration: mechanisms, therapeutic targets, and imaging. Invest. Ophthalmol. Vis. Sci. 2013, 54 (14), ORSF68-ORSF80; [DOI] [PMC free article] [PubMed] [Google Scholar]; (b) de Guimaraes TAC; Varela MD; Georgiou M; Michaelides M, Treatments for dry age-related macular degeneration: therapeutic avenues, clinical trials and future directions. Br. J. Ophthalmol. 2022, 106 (3), 297–304. [DOI] [PMC free article] [PubMed] [Google Scholar]
- 5.Holz FG; Strauss EC; Schmitz-Valckenberg S; van Lookeren Campagne M, Geographic atrophy: clinical features and potential therapeutic approaches. Ophthalmology 2014, 121 (5), 1079–1091. [DOI] [PubMed] [Google Scholar]
- 6.Boyer DS; Schmidt-Erfurth U; van Lookeren Campagne M; Henry EC; Brittain C, The pathophysiology of geographic atrophy secondary to age-related macular degeneration and the complement pathway as a therapeutic target. Retina (Philadelphia, Pa.) 2017, 37 (5), 819. [DOI] [PMC free article] [PubMed] [Google Scholar]
- 7.(a) Mitchell P; Liew G; Gopinath B; Wong TY, Age-related macular degeneration. The Lancet 2018, 392 (10153), 1147–1159; [DOI] [PubMed] [Google Scholar]; (b) Lim LS; Mitchell P; Seddon JM; Holz FG; Wong TY, Age-related macular degeneration. The Lancet 2012, 379 (9827), 1728–1738. [DOI] [PubMed] [Google Scholar]
- 8.Liao DS; Grossi FV; El Mehdi D; Gerber MR; Brown DM; Heier JS; Wykoff CC; Singerman LJ; Abraham P; Grassmann F, Complement C3 inhibitor pegcetacoplan for geographic atrophy secondary to age-related macular degeneration: a randomized phase 2 trial. Ophthalmology 2020, 127 (2), 186–195. [DOI] [PubMed] [Google Scholar]
- 9.(a) Klimanskaya I; Hipp J; Rezai KA; West M; Atala A; Lanza R, Derivation and comparative assessment of retinal pigment epithelium from human embryonic stem cells using transcriptomics. Cloning and stem cells 2004, 6 (3), 217–245; [DOI] [PubMed] [Google Scholar]; (b) Petrus-Reurer S; Winblad N; Kumar P; Gorchs L; Chrobok M; Wagner AK; Bartuma H; Lardner E; Aronsson M; Reyes ÁP, Generation of retinal pigment epithelial cells derived from human embryonic stem cells lacking human leukocyte antigen class I and II. Stem cell reports 2020, 14 (4), 648–662. [DOI] [PMC free article] [PubMed] [Google Scholar]
- 10.(a) Diniz B; Thomas P; Thomas B; Ribeiro R; Hu Y; Brant R; Ahuja A; Zhu D; Liu L; Koss M, Subretinal implantation of retinal pigment epithelial cells derived from human embryonic stem cells: improved survival when implanted as a monolayer. Invest. Ophthalmol. Vis. Sci. 2013, 54 (7), 5087–5096; [DOI] [PMC free article] [PubMed] [Google Scholar]; (b) Pennington BO; Clegg DO; Melkoumian ZK; Hikita ST, Defined culture of human embryonic stem cells and xeno-free derivation of retinal pigmented epithelial cells on a novel, synthetic substrate. Stem cells translational medicine 2015, 4 (2), 165–177; [DOI] [PMC free article] [PubMed] [Google Scholar]; (c) Lu B; Malcuit C; Wang S; Girman S; Francis P; Lemieux L; Lanza R; Lund R, Long-term safety and function of RPE from human embryonic stem cells in preclinical models of macular degeneration. Stem Cells 2009, 27 (9), 2126–2135; [DOI] [PubMed] [Google Scholar]; (d) Rowland TJ; Buchholz DE; Clegg DO, Pluripotent human stem cells for the treatment of retinal disease. J. Cell. Physiol. 2012, 227 (2), 457–466; [DOI] [PubMed] [Google Scholar]; (e) Öner A, Stem cell treatment in retinal diseases: recent developments. Turkish Journal of Ophthalmology 2018, 48 (1), 33. [DOI] [PMC free article] [PubMed] [Google Scholar]
- 11.Scarfe L; Brillant N; Kumar JD; Ali N; Alrumayh A; Amali M; Barbellion S; Jones V; Niemeijer M; Potdevin S, Preclinical imaging methods for assessing the safety and efficacy of regenerative medicine therapies. NPJ Regenerative medicine 2017, 2 (1), 1–13. [DOI] [PMC free article] [PubMed] [Google Scholar]
- 12.Mehat MS; Sundaram V; Ripamonti C; Robson AG; Smith AJ; Borooah S; Robinson M; Rosenthal AN; Innes W; Weleber RG, Transplantation of human embryonic stem cell-derived retinal pigment epithelial cells in macular degeneration. Ophthalmology 2018, 125 (11), 1765–1775. [DOI] [PMC free article] [PubMed] [Google Scholar]
- 13.(a) Ricles LM; Hsieh P-L; Dana N; Rybalko V; Kraynak C; Farrar RP; Suggs LJ, Therapeutic assessment of mesenchymal stem cells delivered within a PEGylated fibrin gel following an ischemic injury. Biomaterials 2016, 102, 9–19; [DOI] [PMC free article] [PubMed] [Google Scholar]; (b) Santiesteban DY; Kubelick K; Dhada KS; Dumani D; Suggs L; Emelianov S, Monitoring/imaging and regenerative agents for enhancing tissue engineering characterization and therapies. Ann. Biomed. Eng. 2016, 44 (3), 750–772; [DOI] [PMC free article] [PubMed] [Google Scholar]; (c) Felszeghy S; Viiri J; Paterno JJ; Hyttinen JM; Koskela A; Chen M; Leinonen H; Tanila H; Kivinen N; Koistinen A, Loss of NRF-2 and PGC-1α genes leads to retinal pigment epithelium damage resembling dry age-related macular degeneration. Redox biology 2019, 20, 1–12. [DOI] [PMC free article] [PubMed] [Google Scholar]
- 14.(a) Naumova AV; Modo M; Moore A; Murry CE; Frank JA, Clinical imaging in regenerative medicine. Nat. Biotechnol. 2014, 32 (8), 804–818; [DOI] [PMC free article] [PubMed] [Google Scholar]; (b) Wang R; Zhang J; Guo Z; Shen L; Shang A; Chen Y; Yao S; He T; Yin D; Tian J, In-vivo PET imaging of implanted human retinal pigment epithelium cells in a Parkinson’s disease rat model. Nucl. Med. Commun. 2008, 29 (5), 455–461; [DOI] [PubMed] [Google Scholar]; (c) Rimpela A-K; Schmitt M; Latonen S; Hagstrom M; Antopolsky M; Manzanares JA; Kidron H; Urtti A, Drug distribution to retinal pigment epithelium: studies on melanin binding, cellular kinetics, and single photon emission computed tomography/computed tomography imaging. Mol. Pharm. 2016, 13 (9), 2977–2986. [DOI] [PubMed] [Google Scholar]
- 15.Chehade M; Srivastava AK; Bulte JW, Co-registration of bioluminescence tomography, computed tomography, and magnetic resonance imaging for multimodal in vivo stem cell tracking. Tomography 2016, 2 (2), 158–165. [DOI] [PMC free article] [PubMed] [Google Scholar]
- 16.Bartuma H; Petrus-Reurer S; Aronsson M; Westman S; André H; Kvanta A, In vivo imaging of subretinal bleb-induced outer retinal degeneration in the rabbit. Invest. Ophthalmol. Vis. Sci. 2015, 56 (4), 2423–2430; [DOI] [PubMed] [Google Scholar]; (b) Petrus-Reurer S; Bartuma H; Aronsson M; Westman S; Lanner F; André H; Kvanta A, Integration of subretinal suspension transplants of human embryonic stem cell-derived retinal pigment epithelial cells in a large-eyed model of geographic atrophy. Invest. Ophthalmol. Vis. Sci. 2017, 58 (2), 1314–1322. [DOI] [PubMed] [Google Scholar]
- 17.(a) Dhada KS; Hernandez DS; Suggs LJ, In vivo photoacoustic tracking of mesenchymal stem cell viability. ACS nano 2019, 13 (7), 7791–7799; [DOI] [PMC free article] [PubMed] [Google Scholar]; (b) Jokerst JV; Thangaraj M; Kempen PJ; Sinclair R; Gambhir SS, Photoacoustic imaging of mesenchymal stem cells in living mice via silica-coated gold nanorods. ACS nano 2012, 6 (7), 5920–5930; [DOI] [PMC free article] [PubMed] [Google Scholar]; (c) Kim T; Lemaster JE; Chen F; Li J; Jokerst JV, Photoacoustic imaging of human mesenchymal stem cells labeled with Prussian blue–poly (l-lysine) nanocomplexes. ACS nano 2017, 11 (9), 9022–9032; [DOI] [PMC free article] [PubMed] [Google Scholar]; (d) Hariri A; Wang J; Kim Y; Jhunjhunwala A; Chao DL; Jokerst JV, In vivo photoacoustic imaging of chorioretinal oxygen gradients. Journal of biomedical optics 2018, 23 (3), 036005–036005; [DOI] [PMC free article] [PubMed] [Google Scholar]; (e) Yücel YH; Cheng F; Cardinell K; Zhou X; Irving H; Gupta N, Age-related decline of lymphatic drainage from the eye: A noninvasive in vivo photoacoustic tomography study. Exp. Eye Res. 2020, 194, 108029. [DOI] [PubMed] [Google Scholar]
- 18.Kubelick KP; Snider EJ; Ethier CR; Emelianov S, Development of a stem cell tracking platform for ophthalmic applications using ultrasound and photoacoustic imaging. Theranostics 2019, 9 (13), 3812. [DOI] [PMC free article] [PubMed] [Google Scholar]
- 19.(a) Beard P, Biomedical photoacoustic imaging. Interface focus 2011, 1 (4), 602–631; [DOI] [PMC free article] [PubMed] [Google Scholar]; (b) Nguyen VP; Li Y; Qian W; Liu B; Tian C; Zhang W; Huang Z; Ponduri A; Tarnowski M; Wang X, Contrast agent enhanced multimodal photoacoustic microscopy and optical coherence tomography for imaging of rabbit choroidal and retinal vessels in vivo. Sci. Rep. 2019, 9 (1), 1–17; [DOI] [PMC free article] [PubMed] [Google Scholar]; (c) Nguyen VP; Li Y; Henry J; Qian T; Zhang W; Wang X; Paulus YM, In Vivo Subretinal ARPE-19 Cell Tracking Using Indocyanine Green Contrast-Enhanced Multimodality Photoacoustic Microscopy, Optical Coherence Tomography, and Fluorescence Imaging for Regenerative Medicine. Translational Vision Science & Technology 2021, 10 (10), 10–10; [DOI] [PMC free article] [PubMed] [Google Scholar]; (d) Nguyen VP; Qian W; Li Y; Liu B; Aaberg M; Henry J; Zhang W; Wang X; Paulus YM, Chain-like gold nanoparticle clusters for multimodal photoacoustic microscopy and optical coherence tomography enhanced molecular imaging. Nature Communications 2021, 12 (1), 1–14; [DOI] [PMC free article] [PubMed] [Google Scholar]; (e) Nguyen VP; Fan W; Zhu T; Qian W; Li Y; Liu B; Zhang W; Henry J; Yuan S; Wang X, Long-Term, Noninvasive In Vivo Tracking of Progenitor Cells Using Multimodality Photoacoustic, Optical Coherence Tomography, and Fluorescence Imaging. ACS nano 2021, 15 (8), 13289–13306; [DOI] [PMC free article] [PubMed] [Google Scholar]; (f) Salah D; Moghanm FS; Arshad M; Alanazi AA; Latif S; El-Gammal MI; Shimaa EM; Elsayed S, Polymer-Peptide Modified Gold Nanorods to Improve Cell Conjugation and Cell Labelling for Stem Cells Photoacoustic Imaging. Diagnostics 2021, 11 (7), 1196; [DOI] [PMC free article] [PubMed] [Google Scholar]; (g) Mok PL; Leow SN; Koh AE-H; Mohd Nizam HH; Ding SLS; Luu C; Ruhaslizan R; Wong HS; Halim WHWA; Ng MH, Micro-computed tomography detection of gold nanoparticle-labelled mesenchymal stem cells in the rat subretinal layer. Int. J. Mol. Sci. 2017, 18 (2), 345. [DOI] [PMC free article] [PubMed] [Google Scholar]
- 20.Friebel M; Helfmann J; Netz UJ; Meinke MC, Influence of oxygen saturation on the optical scattering properties of human red blood cells in the spectral range 250 to 2000 nm. Journal of biomedical optics 2009, 14 (3), 034001. [DOI] [PubMed] [Google Scholar]
- 21.Liu B; Hu Z; Che Y; Chen Y; Pan X, Nanoparticle generation in ultrafast pulsed laser ablation of nickel. Applied Physics Letters 2007, 90 (4), 044103. [Google Scholar]
- 22.(a) Ruggiero A; Villa CH; Bander E; Rey DA; Bergkvist M; Batt CA; Manova-Todorova K; Deen WM; Scheinberg DA; McDevitt MR, Paradoxical glomerular filtration of carbon nanotubes. Proceedings of the National Academy of Sciences 2010, 107 (27), 12369–12374; [DOI] [PMC free article] [PubMed] [Google Scholar]; (b) Longmire M; Choyke PL; Kobayashi H, Clearance properties of nano-sized particles and molecules as imaging agents: considerations and caveats. 2008. [DOI] [PMC free article] [PubMed] [Google Scholar]
- 23.Nguyen VP; Qian W; Zhe J; Henry J; Wang M; Liu B; Zhang W; Wang X; Paulus YM, Renal Clearable Ultraminiature Chain-like Gold Nanoparticle Clusters for Multimodal Molecular Imaging of Choroidal Neovascularization. Advanced Materials 2023, 2302069. [DOI] [PMC free article] [PubMed] [Google Scholar]
- 24.(a) Qian W; Murakami M; Ichikawa Y; Che Y, Highly efficient and controllable PEGylation of gold nanoparticles prepared by femtosecond laser ablation in water. The Journal of Physical Chemistry C 2011, 115 (47), 23293–23298; [Google Scholar]; (b) Chen H; Paholak H; Ito M; Sansanaphongpricha K; Qian W; Che Y; Sun D, ‘Living’ PEGylation on gold nanoparticles to optimize cancer cell uptake by controlling targeting ligand and charge densities. Nanotechnology 2013, 24 (35), 355101; [DOI] [PMC free article] [PubMed] [Google Scholar]; (c) Tian C; Qian W; Shao X; Xie Z; Cheng X; Liu S; Cheng Q; Liu B; Wang X, Plasmonic nanoparticles with quantitatively controlled bioconjugation for photoacoustic imaging of live cancer cells. Advanced Science 2016, 3 (12), 1600237. [DOI] [PMC free article] [PubMed] [Google Scholar]
- 25.Jacques S, Melanosome Absorption Coefficient. https://omlc.org/spectra/melanin/mua.html, (accesses May 11, 2023).s. [Google Scholar]
- 26.Zonios G; Dimou A; Bassukas I; Galaris D; Tsolakidis A; Kaxiras E, Melanin absorption spectroscopy: new method for noninvasive skin investigation and melanoma detection. Journal of biomedical optics 2008, 13 (1), 014017–014017-8. [DOI] [PubMed] [Google Scholar]
- 27.(a) Li Y; Zhang W; Nguyen VP; Khan NW; Xia X; Wang X; Paulus YM, Retinal safety evaluation of photoacoustic microscopy. Exp. Eye Res. 2021, 202, 108368; [DOI] [PMC free article] [PubMed] [Google Scholar]; (b) Nguyen VP; Li Y; Zhang W; Wang X; Paulus YM, Multi-wavelength, en-face photoacoustic microscopy and optical coherence tomography imaging for early and selective detection of laser induced retinal vein occlusion. Biomedical optics express 2018, 9 (12), 5915–5938. [DOI] [PMC free article] [PubMed] [Google Scholar]
Associated Data
This section collects any data citations, data availability statements, or supplementary materials included in this article.
Supplementary Materials
Data Availability Statement
The data that support the plots and other findings of this study are available from the corresponding authors upon reasonable request.