

Abstract
Coating synthetic nanoparticles (NPs) with lipid membranes is a promising approach to enhance the performance of nanomaterials in various biological applications, including therapeutic delivery to target organs. Current methods for achieving this coating often rely on bulk approaches which can result in low efficiency and poor reproducibility. Continuous processes coupled with quality control represent an attractive strategy to manufacture products with consistent attributes and high yields. Here, this concept is implemented by developing an acoustic microfluidic device together with an analytical platform to prepare nanoparticle‐vesicle hybrids and quantitatively characterize the nanoparticle coverage using fluorescence‐based techniques at different levels of resolution. With this approach polymethyl methacrylate (PMMA) nanoparticles are successfully coated with liposomes and extracellular vesicles (EVs), achieving a high encapsulation efficiency of 70%. Moreover, the approach enables the identification of design rules to control the efficiency of encapsulation by tuning various operational parameters and material properties, including buffer composition, nanoparticle/vesicle ratio, and vesicle rigidity.
Keywords: acoustofluidics, lipid vesicles, microfluidics, nanoparticles, nanoparticle‐vesicle hybrids
An acoustic microfluidic device together with an analytical platform is developed to prepare nanoparticle‐vesicle hybrids and quantitatively characterize the nanoparticle coverage using fluorescence‐based techniques at different levels of resolution. Nanoparticles are successfully coated with liposomes and extracellular vesicles, achieving high yields, and design rules are identified to optimize the encapsulation efficiency.

1. Introduction
Inorganic nanoparticles (NPs) offer significant benefits in various biomedical applications, including drug delivery, early‐stage disease diagnosis, photothermal, and photodynamic therapies.[ 1 , 2 , 3 , 4 , 5 ] Despite their potential, the effective clinical translation of NPs is still severely constrained. The exogenous nature of the NP can trigger immune responses, resulting in cytotoxicity, rapid clearance, and non‐specific accumulation in non‐targeting sites, thereby diminishing therapeutic efficacy.[ 6 , 7 , 8 , 9 ]
To address these limitations, considerable efforts are currently dedicated to engineering the surface of NPs to improve their biocompatibility.[ 10 , 11 , 12 ] One promising strategy relies on forming NPs‐lipid hybrids by covering the NP surface with lipid membranes, which represent the most common surfaces in vivo. This camouflage approach has been initially applied with cell membranes derived from white and red blood cells, cancer cells, and bacterial cell walls.[ 13 , 14 , 15 ] Several studies have shown how this membrane coating improves NP performance in various biological applications, hiding their surface from the immune system while preserving other important physicochemical properties.[ 11 , 16 , 17 , 18 , 19 , 20 ]
In addition to cell membranes, in the last decade, researchers have applied this strategy using synthetic and natural vesicles.[ 21 , 22 , 23 ] Using synthetic vesicles, such as liposomes, presents several advantages, including extensive synthetic control, facile customization for tailored targeting, and possible responsiveness to external stimuli, such as changes in pH or temperature.[ 24 ] On the other hand, natural vesicles, such as extracellular vesicles (EVs), can provide intrinsic biocompatibility, target specificity, resistance to macrophage uptake, and enhanced endocytosis efficiency.[ 21 ] As a consequence, EVs have gained interest in camouflaging inorganic NPs,[ 25 , 26 , 27 ] although the higher heterogeneity and complexity of natural vesicles bring additional challenges compared to liposomes.
At the molecular level, the NP‐vesicle hybridization involves a series of microscopic steps including adsorption, deformation, and rupture of vesicles on NP's surfaces.[ 28 , 29 , 30 ] The process depends on the ability of the vesicle lipid bilayer to adapt to the size and shape of the NPs. The adsorption and, therefore, the hybridization process are typically promoted by altering the ionic strength and pH of the solution. Moreover, to further facilitate NPs engulfment and improve efficiency, liposomes and EVs are commonly disrupted or permeabilized by applying external stimuli, such as sonication, temperature shocks, electroporation, and co‐extrusion.[ 21 , 31 ]
Although many protocols have been proposed,[ 32 ] challenges persist in achieving efficient and reproducible loading of vesicles with exogenous cargo. There remains a need for an optimal coating method that simultaneously offers high efficiency, reproducibility, and scalability.[ 33 , 34 , 35 ] Continuous processes coupled with quality control represent an attractive strategy to manufacture “products by process,” i.e. products whose properties are determined by the process generating them. Continuous processes in flow leading to consistent quality attributes and high yields have been successfully implemented in various fields, including the manufacturing of recombinant proteins and EVs from cell cultures.[ 36 , 37 ] The same strategy holds significant promise for engineering (nano)materials.[ 38 ]
In this context, microfluidic technology has several advantages for continuous manufacturing of nanomaterials. The extraordinary control of the environment on the micron scale enables the application of stresses that are precisely controlled, uniform, and reproducible. This, in turn, leads to consistent product quality that can be finely tuned by modulating operative parameters. Importantly, microfluidics opens the possibility of continuous operation, allowing process scalability. Successful examples of the manufacturing of synthetic nanomaterials by microfluidics include perovskites,[ 39 ] lipid nanoparticles,[ 38 , 40 ] liposomes,[ 41 ] and polymeric nanoparticles.[ 42 , 43 ] However, the production of hybrids from already‐formed nanoparticles remains a challenge.
The development of production methods for creating vesicle‐NP hybrids, including novel microfluidic strategies, is limited by additional challenges related to analytical characterization. Currently, the formation of these hybrids is often characterized by size and zeta‐potential measurements, complemented by electron microscopy imaging.[ 44 ] These methods require extensive sample purification and may lack quantitative information about process efficiency. Therefore, developing new continuous processes for vesicle‐NP hybrids requires advances in analytical methods to quantitatively characterize the product quality.
In the present work, we introduce an acoustic microfluidic device, hereafter referred to as µSonicator, designed to generate vesicle‐NP hybrids, using simple, off‐the‐shelf components. By generating an acoustic field within the microfluidic channel, the device opens the membranes of synthetic and natural vesicles, causing the partial release of lumen proteins. In the presence of NPs, this external stimulus promotes the camouflaging of NPs by the vesicle membrane. We quantitatively characterize the vesicle‐NPs hybrids using three fluorescence‐based techniques that offer different levels of resolution and throughput: Förster Resonance Energy Transfer (FRET), Fluorescence Cross‐Correlation Spectroscopy (FCCS), and super‐resolution microscopy.[ 45 ] We demonstrate the successful encapsulation of 180 nm NPs within both liposome and EVs membranes, generating vesicle‐NP hybrids with the highest efficiency of ≈70%. Additionally, this approach identifies design rules to control encapsulation efficiency by adjusting various operational parameters and material properties, such as flow rate, acoustic field intensity, buffer composition, NP/vesicle ratio, and vesicle rigidity.
2. Results
2.1. Microfluidic Sonicator
The µSonicator consists of four piezoelectric elements glued to a round glass capillary (see schematic and picture in Figure 1 ).[ 46 ] The application of an alternating electric potential to the piezoelectric elements causes their vibrations and, consequently, generates an acoustic field within the capillary.
Figure 1.
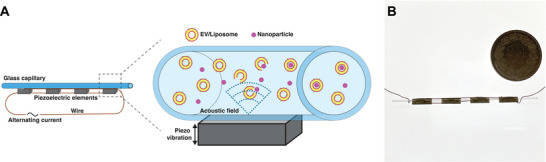
A) Illustration of the µSonicator. An alternating current at a defined frequency is applied to the piezoelectric devices, causing them to vibrate and generate an acoustic field inside the capillary, leading to the formation of vesicle‐NP hybrids. B) Image of the µSonicator. For scale a coin with a diameter of 27.40 mm.
We explored the effect of various parameters and optimized the design of the device by performing numerical simulations of a piezoelectric element attached to a capillary by a layer of glue (Figure 2A). First, we validated the model simulations using a reference system consisting of a capillary with an inner diameter of 0.5 mm. The simulations predicted that a dipole acoustic pressure field would form within the cross‐section of the capillary when excited at 1.75 MHz (Figure 2B). Indeed, we experimentally verified that the focusing of 1 µm fluorescent polystyrene particles within the microfluidic channel was optimal at an excitation frequency of 1.75 MHz (Figure S2, Supporting Information), in agreement with the numerical simulations.
Figure 2.
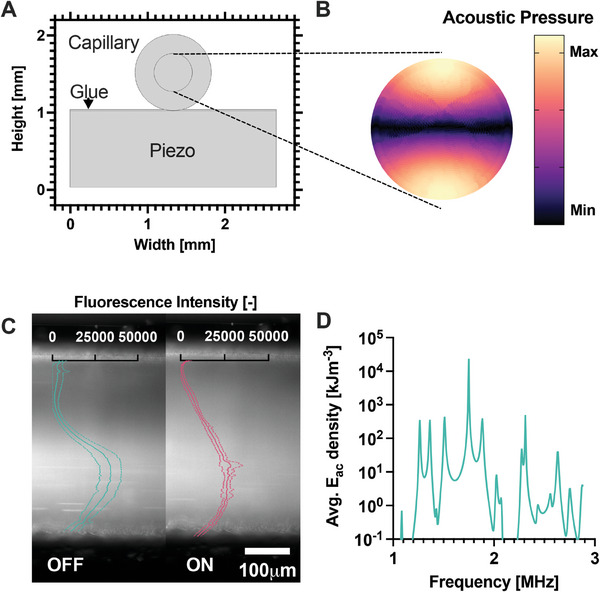
A) Model of the µSonicator cross‐section. B) Simulated acoustic pressure distribution in the glass capillary cross‐section at the 1.75 MHz excitation frequency. C) Distribution of 100 nm polystyrene particles in the microfluidic channel with the acoustic field OFF and ON. The particles migrate across the capillary due to the acoustic field. Overlay ‐ Fluorescence intensity distribution across the channel. The lowest value was normalized to 0. The dotted lines represent the standard deviation of technical triplicates. D) Simulated average acoustic energy densities (E ac ) at different excitation frequencies.
To confirm that this acoustic force would also affect particles in the size range of 100 nm, we confined fluorescent silica particles of 100 nm within one half of the capillary using a T‐junction located before the device (Figure S3, Supporting Information). The applied acoustic field induced the migration of particles across the capillary (Figure 2C), confirming that even small particles are affected by the applied acoustic force.
After validating the numerical model, we applied simulations to explore the sensitivity of the acoustic field to various parameters and identify a suitable frequency range for experiments. The simulated acoustic energy landscape was highly complex (Figure 2D) and sensitive to various parameters, including excitation frequency, the dimensions of the capillary and the piezo elements, which may deviate slightly from the nominal values in practice (Figure S4, Supporting Information). Numerical analysis identified the experimental frequency range between 1.5 and 2.1 MHz as the most promising. Preliminary experiments further indicated that 2.0 MHz was the optimal frequency (Figure S11, Supporting Information), which was subsequently used in all experiments.
2.2. Effect of Acoustofluidic Sonication on Synthetic Lipid Vesicles
First, we investigated the ability of the µSonicator to perturb the structure of vesicles. We prepared liposomes composed of 1‐palmitoyl‐2‐oleoyl‐glycero‐3‐phosphocholine (POPC) and 1,2‐distearoyl‐sn‐glycero‐3‐phosphocholine (DSPC) lipids encapsulating fluorescently‐labeled bovine serum albumin (BSA). POPC and DSPC liposomes share similar surface properties but differ in membrane mechanical properties. Specifically, at room temperature, DSPC lipids form membranes in a gel phase with a low lipid lateral mobility, while POPC membranes are in the liquid‐crystalline phase with a high lipid lateral mobility.[ 28 ] The comparison between these two liposome systems allows therefore to specifically probe the effect of membrane rigidity upon external stimuli.[ 47 ]
The vesicle dispersions were sonicated within the µSonicator at different acoustic field intensities, which were achieved by varying the input electrical potential (0, 20, 40, and 55 V pp ). To assess the transient opening of the vesicle membranes induced by sonication, we monitored variations in the overall amount of BSA released from the vesicle lumen via size exclusion chromatography combined with multi‐angle light scattering and fluorescence detection (SEC‐MALS‐FLD).[ 48 ] This approach allows to simultaneously quantify the concentration and size of the vesicles as well as the fluorescence intensity of both free proteins and proteins diffusing together with vesicles.
As shown in Figure 3A, at 55 V pp , the fluorescent signal of free proteins abruptly increases, indicating the release of luminal proteins due to the opening of lipid membranes. On the contrary, 20 V pp and 40 V pp show barely any change compared to 0 V pp , indicating that for both liposome compositions protein release occurred only at the highest acoustic field intensity.
Figure 3.
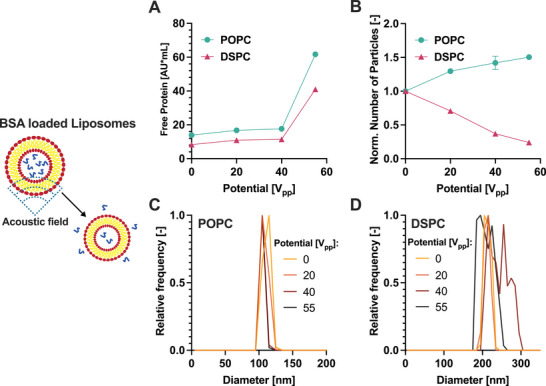
Effect of the microfluidic sonication on liposomes. A) Free protein released from the liposomes as measured by SEC‐FLD; B) Normalised particle concentration measured by SEC‐MALS as a function of the applied voltage. The data are normalized based on the concentration measured at 0 V. C,D) Size distribution of POPC (C) and DSPC (D) liposomes measured by SEC‐MALS. Error bars represent the standard deviation of technical triplicates.
To address the effect of sonication on vesicles, we monitored the concentration and size of particles before and after the application of the stress. For POPC liposomes, we observed an increase in the number of particles (Figure 3B) and a shift of the size distribution toward smaller sizes (Figure 3C). These results are consistent with the reshaping observed for flocculated or multilamellar vesicles.[ 49 ] In contrast, for stiff DSPC liposomes the number of particles decreased (3B) and the size distribution became more heterogeneous (3D and DLS data shown in Figure S7, Supporting Information), suggesting liposome disruption and aggregation. Therefore, the effect of the µSonicator on liposomes is highly dependent on their rigidity.
2.3. Preparation and Characterization of Liposome‐NP Hybrids by Fluorescence‐Based Techniques
After establishing that vesicles can be transiently opened by the µSonicator, we tested the ability of the device to promote the formation of hybrids. We aimed at covering negatively charged polymethyl methacrylate NPs (PMMA‐NPs) with a diameter of 180 nm with a liposome membrane, consisting of POPC, sphingomyelin, and cholesterol (0.87/0.38/1 mol/mol) to emulate natural membranes.[ 50 ] The liposomes and NPs were labeled with DiO and Rhodamine B, respectively.
We investigated the formation of liposome‐NP hybrids using total internal reflection fluorescence (TIRF) microscopy. The combination of low background from the internally reflected illumination and the high sensitivity of the detectors allows the imaging of individual NPs and vesicles with high resolution. After sonication in the µSonicator, the fluorescent signal of the majority of the NPs overlapped with the liposomes (Figure 4A), while after mixing, only a few liposomes were observed in close proximity to NPs (Figure S10, Supporting Information).
Figure 4.
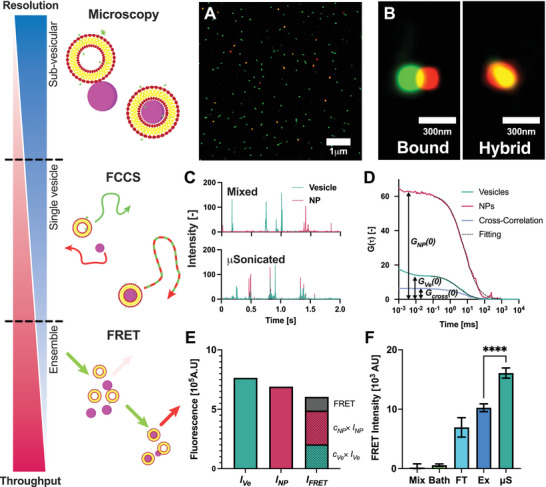
Characterisation of hybrid liposome‐NPs by fluorescence‐based methods at different resolutions and throughputs. A) TIRF microscopy image after microfluidic sonication. Green ‐ DiO‐Liposomes, Red ‐ RhodamineB‐PMMA‐NPs. B) The high resolution of TIRF microscopy can distinguish between liposomes bound to NPs (partial overlap) and hybrids (full overlap). C) Fluorescence intensity traces measured by FCCS. After µSonication the fluorescence peaks are overlapping. Top ‐ after mixing, Bottom ‐ after µSonication at 55V pp . Green ‐ DiO‐Liposomes, Red ‐ RhodamineB‐PMMA‐NPs. D) FCS correlation functions of vesicles, PMMA‐NPs, and Cross‐Correlation. The colocalization is calculated by dividing the amplitude of the cross‐correlation by the amplitude autocorrelation of vesicles. Black curves represent fits of autocorrelation functions of vesicles and PMMA‐NPs; E) Three fluorescence intensities were measured: fluorescence intensity in the vesicle channel I Ve , fluorescence intensity in the nanoparticle channel I NP and the fluorescence intensity in the FRET channel I FRET . The FRET signal was calculated from the measured I FRET subtracting the contributions from the direct fluorescence of the nanoparticles and vesicles (c x × I x ). See the Methods section for further details. F)FRET intensity after different loading methods. Bath ‐ Bath sonication, FT ‐ Freeze‐Thaw, Ex ‐ Coextrusion, µS ‐ µSonication. Error bars represent the standard deviation of technical triplicates.**** ‐ P < 0.0001, one‐way ordinary ANOVA post‐hoc analysis.
Importantly, as shown in Figure 4B, the high resolution of the microscopy can distinguish between a complex formed by a liposome bound to an NP and a putative liposome‐NP hybrid, where the two fluorescent signals are fully superimposed. Thus, TIRF‐Microscopy demonstrated that the µSonicator is able to form liposome‐NPs hybrids.
To complement these findings and quantify the extent of NP‐liposome colocalization at the ensemble‐average level, we characterized the hybrids using Fluorescence Cross‐Correlation Spectroscopy (FCCS). In FCCS, the temporal fluctuations of fluorescence intensity provide information on particle size and concentration. When differently labeled particles co‐localize, they simultaneously diffuse through the focal volume, resulting in overlapping signals in the intensity trace (see Experimental Section for details).
After characterizing individual liposomes and PMMA‐NPs before mixing (S6, S9,S5, and S8), we collected the fluorescence intensity traces of mixtures of NPs and liposomes before and after microfluidic sonication. As shown in Figure 4C (top panel), the fluorescence intensity traces of mixtures of PMMA‐NPs and liposomes after mixing show non‐colocalized green and red intensity peaks, confirming that PMMA‐NPs and liposomes do not colocalize upon incubation. In contrast, after the application of microfluidic sonication, the majority of the fluorescence intensity peaks of NPs and vesicles overlap, in agreement with TIRF microscopy data. In addition, in FCS the fluctuations of fluorescence intensity due to the diffusion of fluorescent species are converted into autocorrelation functions and a cross‐correlation function (Figure 4D), whose amplitude is proportional to the relative amount of colocalized particles (see Experimental Section for further details). As shown in Figure S12 (Supporting Information) after application of sonication the cross‐correlation amplitude increased. The percentage of colocalization calculated by cross‐correlation passes from 10% to nearly 70%. In addition, the average hydrodynamic diameter of PMMA‐NPs increased from 180 nm to 200 nm (S12), consistent with the formation of a lipid bilayer around the particles.[ 51 ]
We further supplemented the TIRF microscopy and FCCS, by characterizing the formation of hybrids by Förster resonance energy transfer (FRET) intensity, which exploits the increase in the fluorescence intensity, when the donor (DiO in the liposome membrane) and the acceptor (Rhodamine B on the NPs) fluorophores are in close proximity (< 10 nm). For each sample, the fluorescence intensity was measured in three channels: the vesicle I Ve , the nanoparticle I NP and the FRET I FRET channel (Figure 4E). I FRET includes also components from the fluorescence of the donor and acceptor. The intensity of these components can be calculated from the fluorescence intensity of the donor and acceptor in their corresponding channel and then subtracted from the fluorescence signal to obtain the true FRET fluorescence intensity (see Experimental Section for details).
We applied FRET to compare the hybrid formation obtained with the µSonication with other methods that have been conventionally employed to generate hybrids (namely, bath sonication, coextrusion, and freeze‐thaw) (Figure 4F). No FRET intensity was detected after mixing liposome and PMMA‐NPs. In contrast, after microfluidic sonication, the intensity of FRET showed a 20‐fold increase, further confirming the formation of the hybrids and the results obtained with TIRF microscopy and FCCS. The comparison showed a higher FRET intensity, and therefore more hybrids formed, after µSonication compared to all other tested approaches.
Finally, we confirmed the coating of nanoparticles with cryo‐TEM. Given the low electronic contrast of polymeric NPs for EM images, we applied the µSonication to coat inorganic NPs consisting of iron oxide cores and a silica shell (see Experimental Section for more details). The images shown in Figure 5 and Figure S13 (Supporting Information) confirm the presence of hybrids consisting of iron oxide NPs coated by a lipid membrane.
Figure 5.
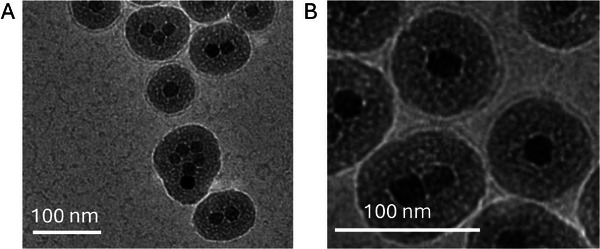
Cryo‐EM images of hybrids composed of core‐shell iron oxide NPs coated by lipid bilayers generated with the acoustic microfluidic device.
2.4. Effect of Various Operational Parameters on the Efficiency of Hybrid Formation
The high‐throughput FRET characterization, validated with TIRF microscopy and FCCS, opens the possibility to investigate the effect of various operational parameters on the efficiency of hybrid formation.
First, we analyzed the effect of the input electrical potential, which affects the force experienced by the particles within the capillary. The FRET intensity increases sharply above an applied potential of 40 V pp (Figure 6A), indicating that a threshold intensity of the acoustic field is required for the formation of the hybrids, in analogy with the results on the opening of liposome membranes (Figure 3A).
Figure 6.
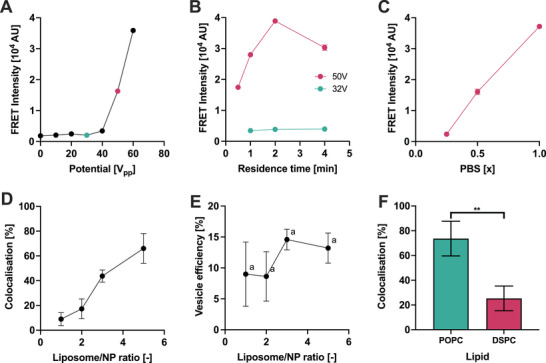
Parameters affecting the formation of hybrid liposome‐nanoparticles. A) Effect of the applied electrical potential on the FRET signal. B) Effect of residence time in the device on FRET signal at 32 and 50 V pp . C) Effect of the PBS concentration on hybrid formation measured by FRET signal. D) The percentage of colocalization measured by FCCS after sonicating different liposome/NP ratios in the µSonicator. E) Calculated percentage of vesicles converted into liposome‐NP hybrids after sonicating different liposome/NP ratios in the µSonicator. The values are statistically not significantly different from another (a ‐ P > 0.05, one way ANOVA multiple comparisons between every column pair). F) Effect of POPC and DSPC liposome rigidity on the percentage of colocalization calculated by cross‐correlation measured by FCCS.Error bars represent the standard deviation of technical triplicates. ** ‐ P < 0.01, unpaired t‐test post‐hoc analysis.
Subsequently, we examined whether the threshold intensity could be decreased by increasing the residence time within the capillary. The residence time was modulated by changing the flow rate. Extending the sonication duration did not increase the FRET signal at 32 V pp (Figure 6B). However, it increased at a higher potential of 50 V pp , until a maximum was observed (Figure 6B), which may suggest uncontrolled aggregation events or vesicle disruption occurring upon prolonged exposure to the acoustic field.
In addition to device parameters, we explored the impact of buffer composition. Both NPs and liposomes are negatively charged (Table S2, Supporting Information) and therefore the adsorption of the liposome on the nanoparticle surface is expected to be strongly affected by repulsive electrostatic interactions.[ 28 ] We modulated these interactions by changing the ionic strength via mixing phosphate‐buffered saline (PBS) and MilliQ water at different ratios. Incubation of PMMA‐NPs and liposomes in milliQ:PBS 3:1 ratio (0.25x PBS) led to a FRET signal that was indistinguishable from the value observed upon incubation in the absence of applied stress (Fig, 6C). In contrast, the microfluidic sonication yielded a higher FRET signal increasing the ionic strength, likely due to the screening of the electrostatic interactions.
The efficiency of hybrid formation at different vesicle‐to‐nanoparticle ratios is a key parameter when using biological vesicles, for which the amount of available vesicles becomes the limiting factor. We quantified the efficiency of hybrid formation as a function of the vesicle‐to‐nanoparticle ratio with FCCS. Increasing vesicle concentration led to a higher fraction of NPs colocalized with liposomes (Figure 6D; Figure S14, Supporting Information). The percentage of colocalization calculated by cross‐correlation reached a maximum value of ≈70% for a vesicle‐to‐nanoparticle ratio of 5. Furthermore, the percentage of vesicles that were converted into hybrids (vesicle efficiency) was estimated ≈10–15%, independently of the vesicle‐to‐nanoparticle ratio used (Figure 6E).
Finally, we evaluated the impact of the vesicle composition on hybrid formation using POPC or DSPC liposomes enriched in sphingomyelin and cholesterol. Increasing the vesicle rigidity (from POPC to DSPC‐based liposomes) resulted in a drop in NPs‐liposome colocalization from 70% to 20% (Figure 6F). Thus, our results highlighted that lower vesicle rigidity facilitates the bilayer deposition on NPs, in line with previous studies on the formation of supported lipid bilayer on planar substrates and curved NP surfaces.[ 52 ]
2.5. Effect of the Acoustic Field on Extracellular Vesicles
After establishing the ability of the acoustofluidic device to create liposome‐PMMA hybrids and identifying the main relevant experimental parameters governing the hybridization process, we applied the µSonication to form hybrids with extracellular vesicles (EVs) and PMMA NPs using human embryonic kidney cell‐derived EVs (HEK‐EVs) (see Supporting Information for details).
Before forming hybrids, we first monitored the impact of microfluidic sonication on HEK‐EVs. In analogy with the experiments performed with synthetic liposomes, the HEK‐EVs dispersion was sonicated within the device at different acoustic field intensities by varying the input electrical potential (Figure 7A). The concentration, size, and native protein fluorescence of the EV were evaluated with SEC‐MALS‐FLD.[ 48 ]
Figure 7.
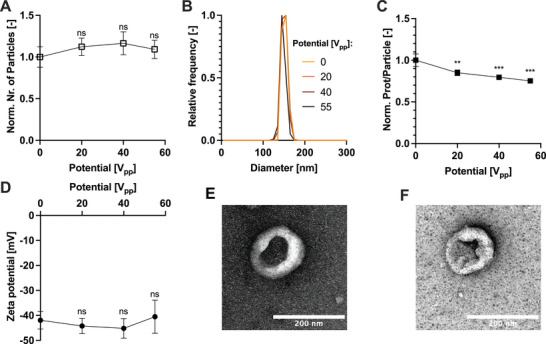
Effect of the sonication on EVs. Both the A) number of particles and B) size distribution measured by MALS is not affected by the acoustic field. However, C) the protein per particle decreases with the increased acoustic field strength. D) The zeta potential measured by NTA remains constant despite an increasing acoustic field strength. The morphology of the HEK‐EVs E) before and F) after µSonication at 55 V pp imaged by negative staining TEM. Error bars represent the standard deviation of technical triplicates. ns ‐ not significant; ** ‐ P < 0.01; *** ‐ P < 0.001, one‐way ordinary ANOVA post‐hoc analysis. Each measurement was compared to the control value (0V) for statistical significance.
The acoustic field of the µSonicator did not alter the measured number of particles independently of the input electrical potential(Figure 7A). Similarly, the size distribution was not significantly affected by the microfluidic sonication (Figure 7B), as also confirmed by DLS analysis (Figure S7, Supporting Information).
To assess the transient opening of EVs membranes stimulated by sonication, we monitored variations in the amount of overall protein released from the vesicles. We calculated the average protein content released per particle by dividing the total native fluorescence signal of proteins by the total number of particles measured. The application of sonication reduced the protein content per particle signal by ≈20%, suggesting transient pore formation and protein release (Figure 7C).
To check any modification to the EV surface, we monitored their zeta potential and morphology before and after sonication. The zeta potential of EVs remained constant independently of the input electrical potential (Figure 7D). In addition, TEM images revealed no discernible changes in vesicle morphology before and after microfluidic sonication (Figure 7E,F). However, a partial loss of CD81 per particle was detected (Figure S16, Supporting Information)
Altogether, these data reveal the negligible effect of sonication on the physico‐chemical properties of HEK‐EVs.
2.6. Preparation of Extracellular Vesicle‐Nanoparticle Hybrids
Finally, we applied the µSonicator to form hybrids based on HEK EVs and PMMA‐NPs. The mixture was sonicated in the µSonicator using the parameters previously optimized for the preparation of NP‐liposome hybrids.
We used direct Stochastic Optical Reconstruction Microscopy (dSTORM) to investigate the morphology and co‐localization of the nanoparticles and EVs after µSonication. We used dSTORM instead of TIRF microscopy to increase the imaging sensitivity and detect the small number of antibodies bound to the hybrids. We labeled the PMMA‐NPs with ATTO647N and the HEK‐EVs with an AlexaFluor488 labeled anti‐CD81 antibody. The nanometer resolution of dSTORM imaging allowed to determine the colocalization of the CD81 markers on the EV membrane and the NPs (Figure 8A,B). After µSonication, multiple EVs fully colocalized with the PMMA‐NPs, confirming the formation of hybrids as well as the retention of the surface marker CD81 in the correct orientation on the hybrid surface.
Figure 8.
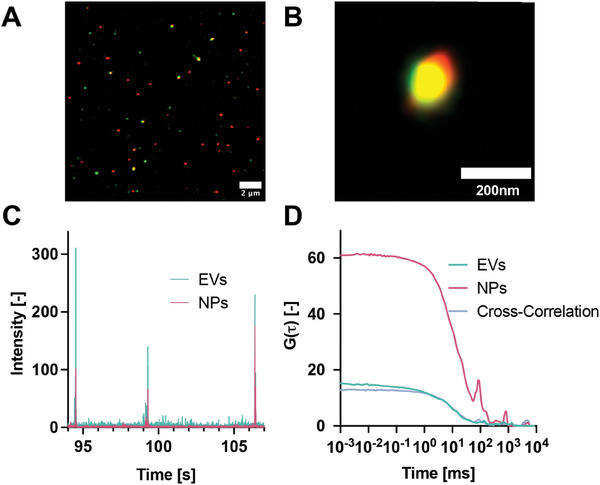
Characterisation of HEK‐EV membrane‐covered PMMA‐NP hybrids. A) dSTORM images of HEK‐EVs‐PMMA show the colocalization of the surface marker CD81 and PMMA‐NPs. B) Zoomed image of the formed hybrid. C) Intensity traces in two channels (EV Channel: λ ex = 488 and λ em = 520 nm; NPs channel: λ ex = 561 and λ em = 650 nm). D) Autocorrelation functions and cross‐correlation of HEK‐EVs and PMMA‐NPs after sonication.
The efficiency of hybrid formation was quantified using FCCS. For this purpose, HEK EVs were labeled with DiO (see Supporting Information for details) and mixed with PMMA‐NPs labeled with RhodamineB. After passing the mixture through the µSonicator, the green and the red peaks in the intensity trace, originating from HEK EVs and PMMA‐NPs, respectively, colocalize (Figure 8C). The efficiency of the loading process was evaluated from the cross‐correlation (Figure 8D). After cross‐talk subtraction (see Supporting Information for details), we estimated the percentage of colocalization of PMMA‐NPs with the EVs membranes of ≈40%.
3. Conclusion
Coating NPs with lipid membranes is a promising strategy to enhance the performance of NPs in vivo. Despite the plethora of protocols that have been proposed, achieving efficient coverage is challenging, and potentially successful methods often struggle with scalability and reproducibility.
In the present work, we describe a simple microfluidic sonication device, the µSonicator, that exploits acoustic waves to efficiently load NPs into synthetic and natural vesicles. The device consists of commercially available parts and is easy to construct and use. It operates in a continuous regime and is amenable to scale‐up by parallelization of multiple devices.
In parallel with the design of the microfluidic device, we developed an analytical workflow based on the combination of three complementary fluorescence‐based techniques to quantify the hybrid formation. Specifically, we characterized the hybrids at the single‐particle resolution with TIRF Microscopy and dSTORM. The efficiency of the coverage was quantified by FCCS and a higher throughput FRET‐based assay, which showed 1.5x higher yields compared to state‐of‐the‐art methods.
Moreover, by applying our strategy we have identified important design principles to enhance the efficiency of the hybridization process. These principles include device parameters, such as the intensity of the acoustic field and the residence time in the channel. In addition to device parameters, our findings demonstrate that NP coating can be facilitated by using a buffer at high ionic strength, a high vesicle‐to‐NP ratio (of ≈5), and vesicles with low stiffness. The higher rigidity of EVs, which is typically intermediate between the one of POPC liposomes and DSPC liposomes,[ 53 , 54 ] can also explain the lower efficiency of HEK‐EV‐PMMA NP hybrids compared to POPC‐PMMA NPs hybrids, although the more negative zeta potential of HEK‐EVs could also play a relevant role.
These insights highlight the importance of having developed the µSonicator device in conjunction with quantitative analytical characterization techniques to navigate the complex physico‐chemical landscape of nanoparticle‐vesicle hybrid materials[ 55 ] and elucidate its dependence on the myriad of sample and process parameters. This will lead to high yields and consistent product qualities, in addition to the possibility of implementing quality control, all aspects that are required for the transition toward marketable products.
4. Experimental Section
Numerical Simulations
A 2D numerical model of the cross‐section of the device (including piezo and glue) was built in COMSOL Multiphysics version 6.1. The material properties considered in the simulations are listed in Table S1 (Supporting Information). A user‐controlled mesh was constructed from the model (Figure S1, Supporting Information). The Thermoviscous Acoustics interface was applied to the water domain, the Solid Mechanics interface to the capillary, glue, and piezo domain, and the Electrostatics interface to the piezo domain. The combined system was solved in the frequency‐domain, solving more than 140 000 degrees of freedom. From the simulations, the frequency response of the device, the displacement of the capillary walls as well as the Gor—kov potential were extracted.
Acoustic Manipulation of Particles
Nominal 1 µm diameter fluorescent polystyrene particles (Sigma Aldrich) were diluted in MilliQ water. The particles were flowed through the uSonicator at 10µL min−1 by a syringe pump (Cetoni). A 20 V pp alternating current signal was generated by an arbitrary function generator (AFG‐2225, GW Instek) and a high‐frequency amplifier (High Wave 3.2, Digitum‐Elektronik).
In a second experiment, 100 nm fluorescent polystyrene particles (Sigma Aldrich) were confined using a T‐junction as shown in Figure S3 (Supporting Information). Both water and the particle dispersion were pumped through the device at 5µL min−1.
The fluorescent profile in the glass capillary was recorded using a Ti inverted microscope (Nikon) equipped with a LED light source (Led‐Hub, Omicron) and suitable filter cubes (AHF Analysentechinc). The images were captured by a Zyla sCMOS camera (Andor) and analyzed using FIJI.[ 56 ]
Preparation of Polymeric NPs
Polymeric NPs were synthesized following a standard emulsion polymerisation method.[ 57 ] In short, methyl methacrylate, 2‐Aminoethyl methacrylate, potassium persulfate, water and acetone were weighed into a vial. For RhodamineB labeled NPs, HEMA‐rhodamine was also added. The vial was stored under nitrogen and sealed, before heating the reaction mixture at 75°C and stirred continuously for 4 h. After completion of the reaction, the nanoparticles were dialyzed against water.
For dSTORM imaging, nanoparticles were prepared without HEMA‐rhodamine and labeled after synthesis with ATTO647N (Atto) according to manufacturers instructions, and dialyzed against water.
Preparation of Liposomes
Synthetic liposomes were prepared by dissolving POPC (or DSPC), Sphingomyelin, and cholesterol (0.87/0.38/1 mol/mol) in chloroform. All of the chemicals were bought from Sigma–Aldrich. The solvent was then evaporated under a nitrogen stream followed by drying under vacuum. The dry film was then hydrated with MilliQ water and mixed by vortexing, to obtain a dispersion of multilamellar vesicles with a final concentration of 2.5 mg mL−1. Finally, the dispersion was freeze‐thawed 10 times and extruded 20 times through 100 nm pore‐size polycarbonate membranes (Whatman, USA) to obtain monodispersed unilamellar vesicles (ULV). The size and particle concentration of the liposomes was measured by NTA.
Synthetic POPC and DSPC liposomes containing BSA‐FITC within the lumen were prepared by dissolving the POPC or DSPC lipid in chloroform. The solvent was then evaporated under a nitrogen stream followed by drying under vacuum. The dry film was then hydrated with a PBS dispersion of BSA‐FITC 3.3 mg mL−1 and mixed by vortexing, to obtain a dispersion of multilamellar vesicles with a final concentration of 2.5 mg mL−1. The dispersion was freeze‐thawed 10 times and extruded 20 times through 100 nm pore‐size polycarbonate membranes. The free BSA‐FITC proteins not encapsulated within the liposomes were separated through SEC.
Preparation of Core Shell Magnetic NPs
Core@shell silica magnetic NPs were synthesized via a modified water‐in‐cyclohexane reverse microemulsion process,[ 58 ] incorporating rhodamine (RITC) into a silicate matrix and applying a silica coating in four stages. RITC (0.037 mmol) was dissolved in deoxygenated ethanol (35 mL) with APTS (150 ) and stirred magnetically for 16 h, shielded from light to protect the fluorescent compound. The resulting complex was stored at 4 °C. For the synthesis, Fe3O4@OA NPs (10 mg in cyclohexane), Igepal CO‐520 (3.6 mmol), and cyclohexane (18.7 mL) were mixed and shaken. Aqueous NH3 (210 ) and TEOS were added in three stages, with TEOS additions at 2 and 1‐h intervals, followed by 16 h at room temperature for silica coating. The core@shell magnetic NPs were precipitated with IPA, magnetically separated, and washed with IPA and water before being re‐dispersed in Milli‐Q water.
Preparation of HEK‐EVs
HEK‐EVs were produced complying with MISEV directions and have been characterized in addition to this work also previously.[ 36 , 48 , 59 ] In brief, 30 mL HEK293‐F cells (Thermo Fisher, USA) were cultured at 37°C CD293 medium (Thermo Fisher, USA) supplemented with 4 mM GlutaMAX at 5% CO2 in 125 mL vented shake‐flasks without baffels (Thermo Fisher, USA). The culture was shaken at 130 rpm. Cells were grown initially to a cell density above 2.0 × 10⁶ cells mL−1 and viability above 95%. The cells were then resuspended in fresh media at 1.0 × 10⁶ cells mL−1 before starting the batch‐refeed process. Every 72 h a fraction of the cultures (the cell bleed) was removed to bring the number of cells to 1.0 × 10⁶ cells mL−1. After the cells were bled from the culture, the remaining cells were pelleted at 200 × g for 5 min and resuspended in 30 mL of fresh medium. The medium from both the cell bleed and culture was then centrifuged at 3000g for 15 min and stored at –20°C in 50 mL aliquots. This process was repeated 4 times while keeping the viability above 95%. The 50 mL aliquots were thawed and filtered by a 0.22 µm PES syringe filter (TPP, Switzerland). To remove DNA and other nucleotide contamination, 100U of Pierce nuclease (Thermo Fisher, USA) was added to the condition media. The sample was then concentrated using an Amicon 50 kDa MWCO ultrafilter (Merck Millipore, Ireland). Aggregates were removed by centrifugation at 7000g for 5 min before applying size exclusion chromatography using a Sepharose CL‐4B resin (Sigma–Aldrich, Germany) packed in a Tricorn 10/300 column (Cytiva, USA). The collected vesicle fractions were combined and the concentration was measured by Nanoparticle Tracking Analysis (NTA).
Preparation of the µSonicator
Piezoceramic elements were cut from 1 mm thick Pz26 wafers (CTS Ferroperm, USA) into 2.7 mm wide and 10 mm long pieces using a DAD3221 dicing Saw (DISCO, Japan). A glass capillary with 0.5 mm i.d and 1.0 mm o.d (World Precision Instruments, USA) was glued on 4 piezoceramic elements by H20E conductive epoxy glue (Epotek, USA). The glue was cured on a hot plate at 120°C for 15 minu. The wires' ends were stripped from insulation using an open flame and sandpaper, before attaching them to the piezoceramic elements using the conductive epoxy glue. The glue was again cured on a hot plate at 120°C for 15 min.
Preparation of the Hybrids
Briefly, 100 µL 2 × 10¹² p mL−1 of POPC/Chol/Sphy liposomes were mixed with 100 4 × 10¹¹ p mL−1 of PMMA‐NPs (or with 100 4 × 10¹¹ p mL−1 of PMMA‐NPs when specified) and subsequently injected and sonicated in the µSonicator at a flow rate of 10 µL min−1, when not specified differently. A 55 V pp (unless specified otherwise) alternating current signal at a frequency of 2 MHz was generated by an arbitrary function generator (AFG‐2225, GW Instek) and a high‐frequency amplifier (High Wave 3.2, Digitum‐Elektronik) and used to induce vibration in the piezos.
The preparation of liposome‐NP hybrids with the µSonicator was compared with other protocols involving i) freeze‐thaw, ii) coextrusion, and iii) bath sonication. 2 × 10¹² p mL−1 of POPC/Chol/Sphy liposomes were mixed with 4 × 10¹¹ p mL−1 of PMMA‐NPs and i) frozen in liquid nitrogen for 5 min and thawed in a water bath at 37°C (this step is repeated 10 times before measuring the FRET), or ii) co‐extruded through 200 nm polycarbonate filters for 10 times, or iii) bath sonicated for 30 min. For HEK‐PMMA NPs, ≈2 × 10¹¹ p mL−1 HEK‐EVs were mixed with 4 × 10¹⁰ PMMA‐NPs and subsequently injected and sonicated in the µSonicator at a flow rate of 10 µL/min, with an input voltage of 55 V pp , and 2 MHz.
Size Exclusion Chromatography with Fluorescence and Multi‐Angle Light Scattering Detection
The method was applied as previously described.[ 48 ] In brief, 20 µL of EVs diluted to 1010 particles per mL in PBS, 20 µL of BSA‐loaded DSPC liposomes or 2 µL oF BSA‐loaded POPC liposomes was injected into a Tricorn‐5/100 column (Cytiva, USA) of 2 mL bed volume packed with Sepharose‐CL4B resin (Sigma–Aldrich, Germany) assembled on an Agilent 1200 Series HPLC system. Phosphate‐buffered saline (PBS) (137 mM NaCl, 2.7 mM KCl, 10 mM Na2HPO4, 1.8 mM KH2PO4) at a volumetric flow rate of 0.1 mL min−1 was used as an eluent.
For CD81 quantification, anti‐human CD81‐AlexaFlour488 antibody (R&D Systems)[ 60 , 61 ] was diluted 1:500 from stock in the EV solution.
The fluorescence signal was measured with an Agilent 1260 Infinity II fluorescence detector assembled in‐line after the chromatographic column. Excitation and emission wavelengths were set to λex = 280 nm and λem = 350 nm for intrinsic fluorescence, λex = 480 nm and λem = 520 nm for BSA‐FITC and CD81 quantification. Fluorescence gain was set to 14 for the intrinsic fluorescence, and 18 for the BSA‐FITC and 16 for the anti‐human CD81‐AlexaFlour488 quantification. Raw data were exported from the ChemStation software, baseline corrected and integrated using a Python script.
Multi‐angle light scattering (MALS) analysis was performed with an in‐line DAWN HELEOS II detector (Wyatt Technology). The system was calibrated using toluene, and detectors were normalized using bovine serum albumin (Sigma–Aldrich, Germany) as an isotropic scatterer standard. The laser wavelength was set to 658 nm. Rayleigh ratio data were collected by ASTRA 5 Software (Wyatt Technology). Rayleigh ratio data were normalized, despiked using a median filter, smoothed by Savitzky–Golay filtering, and baseline corrected to obtain the excess Rayleigh ratios (R(θ)). By fitting the Rayleigh ratios angle dependence, both the radius of gyration and concentration of particles were obtained.
To obtain the fluorescence intensity per particle, the integral of the fluorescence peak was divided by the total number of particles measured and normalized to the control sample.
FRET Assay
The mixture of nanoparticles and liposomes was diluted 10x in 1x PBS and 20µL was transferred into a 384‐well plate (Perkin–Elmer Optiplate 384F). The fluorescence intensity was measured using a CLARIOstar Plus platereader (BMG Labtech GmbH, Germany). Three excitation and emission wavelength combinations were measured
| Channel | λ ex | λ em |
|---|---|---|
| DiO | 480 | 520 |
| RhodamineB | 550 | 605 |
| FRET | 480 | 605 |
To calculate the FRET signal, the signal from the DiO bleedthrough in the RhodamineB channel (I DiOBT ) and the excitation of the RhodamineB directly by the 480 nm laser (I RhodBBT ) was subtracted from the raw FRET channel signal:
| (1) |
The intensity signals I DiOBT and I RhodBBT depend on the spectral properties of the fluorescent dyes. The intensities of the false signals in the FRET channel were taken into account by a correction factor (c), which was calculated from the intensity ratio of the FRET channel to the fluorophores main channel of samples containing liposomes or nanoparticles only:
| (2) |
The correction factor was measured together with the hybrids using the same liposomes and nanoparticles. Triplicate measurements were performed and averaged for both the correction factors as well as the FRET signal intensities.
Fluorescence Cross‐Correlation Spectroscopy (FCCS)
FCCS experiments were performed on an inverted confocal fluorescence microscope (Leica 315 SP8 STED, Leica Application Suite X (LAS X) software, version 1.0) equipped with an HC 316 PL APO CS2 63x 1.2 NA water immersion objective with a software‐controlled correction collar (Leica), and a hybrid detector for single molecule detection (HyD SMD). The samples were excited with 488 and 561 nm lasers (from a white Light Laser at 80 MHz) and the fluorescence emission was collected in two different channels (500‐520 nm and 650–690 nm). The amplitude of autocorrelation functions is inversely proportional to the concentration of labeled species, while the amplitude of the cross‐correlation function is directly proportional to the concentration of species emitting in both channels. The percentage of colocalized particles was calculated from the amplitude of correlation and cross‐correlation functions as described elsewhere.[ 62 ] Briefly, the percentage of PMMA‐NPs colocalized with the vesicle (C r /C g x100, with C r and C g the concentration of red and green‐labeled species, respectively) can be calculated by dividing the amplitude of the cross‐correlation function (G 0, x ) by the amplitude of the liposome correlation function (G 0, g ), assuming 1:1 binding stochiometry (the amplitudes of the cross‐correlation and the vesicle correlation functions are equal when 100% of PMMA‐NPs colocalize with the vesicles). The colocalization was calculated as the average of 3 independent measurements. The cross‐talk arising from PMMA‐NPs in PMMA‐NPs HEK‐EVs systems has been removed according to Bacia et al.[ 62 ] Briefly, the bleed‐through ratio κ Rg is calculated in a calibration experiment with only red‐labeled particles (PMMA‐NPs) by dividing the count rate in the green channel () by the count rate in the red channel (). The amplitude of the cross‐correlation expected in case of complete cross‐talk is: G 0, k /G 0, r = K Rg,(F r /F g ) where G 0, k is the amplitude of the cross‐correlation, G 0, r is the amplitude of the correlation function of PMMA‐NPs, κ Rg is the bleed‐through ratio, and F r and F g are the counts rates in the PMMA‐NP and HEK‐EV channels, respectively. If the value of K Rg(F r /F g ) is higher or comparable to the cross‐correlation measured in HEK‐EVs PMMA‐NPs mixture, the calculated colocalization arises from cross‐talk. If the measured colocalization is higher, the real value of cross correlation can be corrected for the cross‐talk according to: .
TIRF Microscopy
A‐100 fold diluted sample was deposited on a freshly plasma‐treated 18 well µ‐Slide (Ibidi, Germany) and incubated for 1 h. The supernatant was aspirated and replaced with a blocking buffer (1% BSA in PBS).
The samples were imaged using a Nikon Ti2 Eclipse inverted microscope system equipped with a Hamamatsu Orca Flash 4 v3 (6.5 × 6.5 µm2 pixel size) sCMOS camera and an SR Apochromat TIRF 100x 1.49 N.A oil immersion objective. The sample was illuminated in total internal reflection mode and the laser angle of incidence was monitored with a Photometrics Dyno CCD camera at the back focal plane of the objective. The samples were imaged sequentially with excitation at the 561 nm (125 mW at the tip) and 488 nm (80 mW at the tip) laser lines. The fluorescence emission was passed through a QUAD filter set for TIRF application (Nikon C‐NSTORM QUAD 405/488/561/647). The 561 nm laser power was set to 2% at a 1x magnification and the 488 nm laser power was set to 4% at a 1x magnification. 1000 images were recorded at an exposure time of 5 ms in the 561 nm channel and 1000 images were recorded at an exposure time of 40 ms in the 488 nm channel. The focus was stabilized by the Perfect Focus System (Nikon) during imaging. The image acquisition was controlled with NIS Elements Advanced (Nikon) software.
The images were processed using FIJI[ 56 ] and the ThunderSTORM plugin.[ 63 ]
Direct Stochastic Optical Reconstruction Microscopy (dSTORM)
A 100‐fold diluted sample was deposited on a fresh plasma treated 18 well µ‐Slide (Ibidi, Germany) and incubated for 1 h. The supernatant was aspirated and replaced with a blocking buffer (1% BSA in PBS). After 1 h, the blocking buffer was removed and 100 µL 10000x diluted anti‐CD81‐AlexaFluor488 (Novus Biologicals, USA)[ 60 , 61 ] in blocking buffer was added. The sample was incubated in the antibody solution overnight. Before imaging, the antibody solution was removed and 250 µL of a standard STORM blinking buffer was added. For each sample, the blinking buffer was prepared freshly from stock solutions before imaging. The blinking buffer consisted of 10 mM MEA (Apollo Scientific Ltd, USA), 80 mgmL −1 glucose (Sigma–Aldrich, Germany), 9% glycerin (Sigma–Aldrich, Germany), 2 µgmL −1 catalase (Sigma‐Aldrich, Germany), 100 µgmL −1 glucose oxidase (Sigma‐Aldrich, Germany), 0.4 mM Tris(2‐carboxyethyl)phosphine hydrochloride (Sigma‐Aldrich, Germany), 2.5 mM KCl (Sigma–Aldrich, Germany), 2 mM Tris (Sigma–Aldrich, Germany) pH 7.5. The sample was covered with a glass coverslip to avoid the diffusion of oxygen inside.
The samples were imaged using a Nikon Ti2 Eclipse inverted microscope system equipped with a ANDOR iXon DU897 (16 × 16µm2 pixel size) EM‐CCD camera and an SR Apochromat TIRF 100x 1.49 N.A oil immersion objective. The sample was illuminated in total internal reflection mode and the laser angle of incidence was monitored with a Photometrics Dyno CCD camera at the back focal plane of the objective. The samples were imaged sequentially with excitation at the 647 nm (125 mW at the tip) and 488 nm (80 mW at the tip) laser lines. The fluorescence emission was passed through a QUAD filter set for TIRF application (Nikon C‐NSTORM QUAD 405/488/561/647). The laser power was set to 40% at a 2x magnification for the 488 channel and to 20% at a 2x magnification for the 647 channel. 10000 images were recorded at an exposure time of 20 and 30 ms in the 488 and 647 channels respectively. The focus was stabilized by the Perfect Focus System (Nikon) during imaging. The image acquisition was controlled with NIS Elements Advanced (Nikon) software.
The fluorophores were localized from the images using FIJI[ 56 ] and the ThunderSTORM plugin.[ 63 ]
Statistical Analysis
The data were normalized based on the average of the non‐treated controls. The data are presented as the mean of technical triplicates. The error bars represent the standard deviation. The statistical significance was evaluated with either a one‐way ordinary ANOVA or unpaired t‐test post‐hoc analysis with an alpha threshold of 0.05. The statistical analysis was performed on GraphPad Prism 10 software.
Conflict of Interest
The authors declare no conflict of interest.
Supporting information
Supporting Information
Acknowledgements
J.C. and K.N. contributed equally to this work. This work was supported by the BOW project funded by the H2020‐EU.1.2.2‐FET Proactive program via Grant Agreement 952183. The authors acknowledge Prof. Jean‐Christophe Leroux (ETH) for providing access to NTA, and the Florence Center for Electron Nanoscopy (FloCEN) at the University of Florence for the cryo‐EM analysis.
Cardellini J., Normak K., Gerlt M., Makasewicz K., Seiffert C., Capasso Palmiero U., Ye S., González Gómez M. A., Piñero Y., Rivas J., Bongiovanni A., Bergese P., Arosio P., Microfluidics‐Driven Manufacturing and Multiscale Analytical Characterization of Nanoparticle‐Vesicle Hybrids. Adv. Healthcare Mater. 2025, 14, 2403264. 10.1002/adhm.202403264
Data Availability Statement
The data that support the findings of this study are available in the supplementary material of this article.
References
- 1. Jiao M., Zhang P., Meng J., Li Y., Liu C., Luo X., Gao M., Biomater. Sci. 2018, 6, 726. [DOI] [PubMed] [Google Scholar]
- 2. Shi J., Kantoff P. W., Wooster R., Farokhzad O. C., Nat. Rev. Cancer 2017, 17, 20. [DOI] [PMC free article] [PubMed] [Google Scholar]
- 3. Youn Y. S., Bae Y. H., Adv. Drug Delivery Rev. 2018, 130, 3. [DOI] [PubMed] [Google Scholar]
- 4. Aftab S., Shah A., Nadhman A., Kurbanoglu S., Aysıl Ozkan S., Dionysiou D. D., Shukla S. S., Aminabhavi T. M., Int. J. Pharm. 2018, 540, 132. [DOI] [PubMed] [Google Scholar]
- 5. Dallari C., Lenci E., Trabocchi A., Bessi V., Bagnoli S., Nacmias B., Credi C., Pavone F. S., ACS Sens. 2023, 8, 3693. [DOI] [PMC free article] [PubMed] [Google Scholar]
- 6. Blanco E., Shen H., Ferrari M., Nat. Biotechnol. 2015, 33, 941. [DOI] [PMC free article] [PubMed] [Google Scholar]
- 7. Singh R. K., Knowles J. C., Kim H.‐W., J. Tissue Eng. 2019, 10, 204173141987752. [DOI] [PMC free article] [PubMed] [Google Scholar]
- 8. Moghimi S., Hunter A., Andresen T., Annu. Rev. Pharmacol. Toxicol. 2012, 52, 481. [DOI] [PubMed] [Google Scholar]
- 9. Nie S., Nanomedicine 2010, 5, 523. [DOI] [PMC free article] [PubMed] [Google Scholar]
- 10. Dehaini D., Fang R. H., Zhang L., Bioeng. Transl. Med. 2016, 1, 30. [DOI] [PMC free article] [PubMed] [Google Scholar]
- 11. Fang R. H., Kroll A. V., Gao W., Zhang L., Adv. Mater. 2018, 30, 1706759. [DOI] [PMC free article] [PubMed] [Google Scholar]
- 12. Li R., He Y., Zhang S., Qin J., Wang J., Acta Pharm. Sin. B 2018, 8, 14. [DOI] [PMC free article] [PubMed] [Google Scholar]
- 13. Nica V., Marino A., Pucci C., Sen O., Emanet M., De Pasquale D., Carmignani A., Petretto A., Bartolucci M., Lauciello S., Brescia R., de Boni F., Prato M., Marras S., Drago F., Hammad M., Segets D., Ciofani G., ACS Appl. Mater. Interfaces 2023, 15, 30008. [DOI] [PMC free article] [PubMed] [Google Scholar]
- 14. Bu Y., Wu D., Zhao Y., Wang G., Dang X., Xie X., Wang S., ACS Appl. Mater. Interfaces 2023, 15, 52150. [DOI] [PubMed] [Google Scholar]
- 15. Xiong J., Wu M., Chen J., Liu Y., Chen Y., Fan G., Liu Y., Cheng J., Wang Z., Wang S., Liu Y., Zhang W., ACS nano 2021, 15, 19756. [DOI] [PubMed] [Google Scholar]
- 16. Hu C.‐M. J., Zhang L., Aryal S., Cheung C., Fang R. H., Zhang L., Proc. Natl. Acad. Sci. USA 2011, 108, 10980. [DOI] [PMC free article] [PubMed] [Google Scholar]
- 17. Hu C.‐M. J., Fang R. H., Wang K.‐C., Luk B. T., Thamphiwatana S., Dehaini D., Nguyen P., Angsantikul P., Wen C. H., Kroll A. V., Carpenter C., Ramesh M., Qu V., Patel S. H., Zhu J., Shi W., Hofman F. M., Chen T. C., Gao W., Zhang K., Chien S., Zhang L., Nature 2015, 526, 118. [DOI] [PMC free article] [PubMed] [Google Scholar]
- 18. Luk B. T., Zhang L., J. Controlled Release 2015, 220, 600. [DOI] [PMC free article] [PubMed] [Google Scholar]
- 19. Zhai Y., Su J., Ran W., Zhang P., Yin Q., Zhang Z., Yu H., Li Y., Theranostics 2017, 7, 2575. [DOI] [PMC free article] [PubMed] [Google Scholar]
- 20. Sharma S., Masud M. K., Kaneti Y. V., Rewatkar P., Koradia A., Hossain M. S. A., Yamauchi Y., Popat A., Salomon C., Small 2021, 17, 2102220. [DOI] [PubMed] [Google Scholar]
- 21. Fathi P., Rao L., Chen X., View 2021, 2, 20200187. [Google Scholar]
- 22. Mizuta R., Inoue F., Sasaki Y., Sawada S.‐i., Akiyoshi K., Small 2023, 19, 2206153. [DOI] [PubMed] [Google Scholar]
- 23. Luchini A., Vitiello G., Front. Chem. 2019, 7, 343. [DOI] [PMC free article] [PubMed] [Google Scholar]
- 24. Dumontel B., Rosso G., Cauda V., Nanomedicine 2024, 19, 653. [DOI] [PubMed] [Google Scholar]
- 25. Liu C., Zhang W., Li Y., Chang J., Tian F., Zhao F., Ma Y., Sun J., Nano Letters 2019, 19, 7836. [DOI] [PubMed] [Google Scholar]
- 26. Han Z., Liu S., Pei Y., Ding Z., Li Y., Wang X., Zhan D., Xia S., Driedonks T., Witwer K., Weiss R. G., van Zijl P. C., Bulte J. W., Cheng L., Liu G., J. Extracell. Vesicles 2021, 10, 3. [DOI] [PMC free article] [PubMed] [Google Scholar]
- 27. Sancho‐Albero M., Encabo‐Berzosa M. D. M., Beltrán‐Visiedo M., Fernández‐Messina L., Sebastián V., Sánchez‐Madrid F., Arruebo M., Santamaría J., Martín‐Duque P., Nanoscale 2019, 11, 18825. [DOI] [PubMed] [Google Scholar]
- 28. Michel R., Gradzielski M., Int. J. Mol. Sci. 2012, 13, 11610. [DOI] [PMC free article] [PubMed] [Google Scholar]
- 29. Mornet S., Lambert O., Duguet E., Brisson A., Nano letters 2005, 5, 281. [DOI] [PubMed] [Google Scholar]
- 30. Ridolfi A., Cardellini J., Gashi F., van Herwijnen M. J., Trulsson M., Campos‐Terán J., Wauben M. H., Berti D., Nylander T., Stenhammar J., J. Colloid Interface Sci. 2023, 650, 883. [DOI] [PubMed] [Google Scholar]
- 31. Butler K. S., Durfee P. N., Theron C., Ashley C. E., Carnes E. C., Brinker C. J., small 2016, 12, 2173. [DOI] [PMC free article] [PubMed] [Google Scholar]
- 32. Fernández‐Borbolla A., García‐Hevia L., Fanarraga M. L., Int. J. Mol. Sci. 2024, 25, 2071. [DOI] [PMC free article] [PubMed] [Google Scholar]
- 33. Herrmann I. K., Wood M. J. A., Fuhrmann G., Nat. Nanotechnol. 2021, 16, 748. [DOI] [PubMed] [Google Scholar]
- 34. Zou S., Wang B., Wang C., Wang Q., Zhang L., Nanomedicine 2020, 15, 625. [DOI] [PubMed] [Google Scholar]
- 35. Zhang Y., Chen Q., Zhu Y., Pei M., Wang K., Qu X., Zhang Y., Gao J., Qin H., MedComm 2022, 3, e192. [DOI] [PMC free article] [PubMed] [Google Scholar]
- 36. Paganini C., Boyce H., Libort G., Arosio P., Adv. Healthcare Mater. 2022, 12, 2202232. [DOI] [PMC free article] [PubMed] [Google Scholar]
- 37. Paganini C., Capasso Palmiero U., Pocsfalvi G., Touzet N., Bongiovanni A., Arosio P., Biotechnol. J. 2019, 14, 1800528. [DOI] [PubMed] [Google Scholar]
- 38. Francia V., Zhang Y., Cheng M. H. Y., Schiffelers R. M., Witzigmann D., Cullis P. R., Proc. Natl. Acad. Sci. USA 2024, 121, e2307803120. [DOI] [PMC free article] [PubMed] [Google Scholar]
- 39. Lignos I., Stavrakis S., Nedelcu G., Protesescu L., deMello A. J., Kovalenko M. V., Nano Letters 2016, 16, 1869. [DOI] [PubMed] [Google Scholar]
- 40. Shepherd S. J., Han X., Mukalel A. J., El‐Mayta R., Thatte A. S., Wu J., Padilla M. S., Alameh M.‐G., Srikumar N., Lee D., Weissman D., Issadore D., Mitchell M. J., Proc. Natl. Acad. Sci. USA 2023, 120, e2303567120. [DOI] [PMC free article] [PubMed] [Google Scholar]
- 41. Jahn A., Stavis S. M., Hong J. S., Vreeland W. N., DeVoe D. L., Gaitan M., ACS Nano 2010, 4, 2077. [DOI] [PubMed] [Google Scholar]
- 42. Karnik R., Gu F., Basto P., Cannizzaro C., Dean L., Kyei‐Manu W., Langer R., Farokhzad O. C., Nano Lett. 2008, 8, 2906. [DOI] [PubMed] [Google Scholar]
- 43. Zhang L., Chan J. M., Gu F. X., Rhee J.‐W., Wang A. Z., Radovic‐Moreno A. F., Alexis F., Langer R., Farokhzad O. C., ACS nano 2008, 2, 1696. [DOI] [PMC free article] [PubMed] [Google Scholar]
- 44. Cardellini J., Ridolfi A., Donati M., Giampietro V., Severi M., Brucale M., Valle F., Bergese P., Montis C., Caselli L., Berti D., J. Colloid Interface Sci. 2023, 640, 100. [DOI] [PubMed] [Google Scholar]
- 45. Cardellini J., Balestri A., Montis C., Berti D., Pharmaceutics 2021, 13, 861. [DOI] [PMC free article] [PubMed] [Google Scholar]
- 46. Gerlt M. S., Paeckel A., Pavlic A., Rohner P., Poulikakos D., Dual J., Phys. Rev. Appl. 2022, 17, 014043. [Google Scholar]
- 47. Cardellini J., Caselli L., Lavagna E., Salassi S., Amenitsch H., Calamai M., Montis C., Rossi G., Berti D., J. Phys. Chem. C 2022, 126, 4483. [DOI] [PMC free article] [PubMed] [Google Scholar]
- 48. Normak K., Papp M., Ullmann M., Paganini C., Manno M., Bongiovanni A., Bergese P., Arosio P., Anal. Chem. 2023, 95, 12443. [DOI] [PMC free article] [PubMed] [Google Scholar]
- 49. Woodbury D. J., Richardson E. S., Grigg A. W., Welling R. D., Knudson B. H., J. Liposome Res. 2006, 16, 57. [DOI] [PubMed] [Google Scholar]
- 50. Llorente A., Skotland T., Sylvänne T., Kauhanen D., Róg T., Orłowski A., Vattulainen I., Ekroos K., Sandvig K., Biochim. Biophys. Acta (BBA)‐Mol. Cell Biol. Lipids 2013, 1831, 1302. [DOI] [PubMed] [Google Scholar]
- 51. Montizaan D., Saunders C., Yang K., Sasidharan S., Maity S., Reker‐Smit C., Stuart M. C., Montis C., Berti D., Roos W. H., Salvati A., Small 2023, 19, 2303267. [DOI] [PubMed] [Google Scholar]
- 52. Moura S. P., Carmona‐Ribeiro A. M., J. Colloid Interface Sci. 2007, 313, 519. [DOI] [PubMed] [Google Scholar]
- 53. Caselli L., Ridolfi A., Cardellini J., Sharpnack L., Paolini L., Brucale M., Valle F., Montis C., Bergese P., Berti D., Nanoscale Horiz. 2021, 6, 543. [DOI] [PubMed] [Google Scholar]
- 54. Sakai‐Kato K., Yoshida K., Takechi‐Haraya Y., Izutsu K.‐i., Langmuir 2020, 36, 12735. [DOI] [PubMed] [Google Scholar]
- 55. Manno M., Bongiovanni A., Margolis L., Bergese P., Arosio P., Nat. Rev. Bioeng. 2024. 10.1038/s44222-024-00255-5. [DOI] [Google Scholar]
- 56. Schindelin J., Arganda‐Carreras I., Frise E., Kaynig V., Longair M., Pietzsch T., Preibisch S., Rueden C., Saalfeld S., Schmid B., Tinevez J.‐Y., White D. J., Hartenstein V., Eliceiri K., Tomancak P., Cardona A., Nat. Methods 2012, 9, 676. [DOI] [PMC free article] [PubMed] [Google Scholar]
- 57. Camli S. T., Buyukserin F., Balci O., Budak G. G., J. Colloid Interface Sci. 2010, 344, 528. [DOI] [PubMed] [Google Scholar]
- 58. García Acevedo P., González Gómez M. A., Arnosa Prieto Á., De Castro Alves L., Seco Gudi na R., Pi neiro Y., Rivas J., Magnetochemistry 2022, 8, 83. [Google Scholar]
- 59. Welsh J. A., Goberdhan D. C., O'Driscoll L., Buzas E. I., Blenkiron C., Bussolati B., Cai H., Di Vizio D., Driedonks T. A., Erdbrügger U., Falcon‐Perez J. M., Fu Q., Hill A. F., Lenassi M., Lim S. K., Mahoney M. G., Mohanty S., Möller A., Nieuwland R., Ochiya T., Sahoo S., Torrecilhas A. C., Zheng L., Zijlstra A., Abuelreich S., Bagabas R., Bergese P., Bridges E. M., Brucale M., Burger D., et al., J. Extracell. Vesicles 2024, 13, e12404.38326288 [Google Scholar]
- 60. Setua S., Thangaraju K., Dzieciatkowska M., Wilkerson R. B., Nemkov T., Lamb D. R., Tagaya Y., Boyer T., Rowden T., Doctor A., D'Alessandro A., Buehler P. W., Sci. Rep. 2022, 12, 22191. [DOI] [PMC free article] [PubMed] [Google Scholar]
- 61. Shim Y. J., Chatterjee V., Swaidani S., Alluri R. K., Kundu S., Merkulova A., Angelini D., You D., Whitney S. A., Feener E. P., Barnard J., Schmaier A. H., Khorana A. A., McCrae K. R., Blood Adv. 2021, 5, 4741. [DOI] [PMC free article] [PubMed] [Google Scholar]
- 62. Bacia K., Schwille P., Nat. Protoc. 2007, 2, 2842. [DOI] [PubMed] [Google Scholar]
- 63. Ovesný M., Křížek P., Borkovec J., Švindrych Z., Hagen G. M., Bioinformatics 2014, 30, 2389. [DOI] [PMC free article] [PubMed] [Google Scholar]
Associated Data
This section collects any data citations, data availability statements, or supplementary materials included in this article.
Supplementary Materials
Supporting Information
Data Availability Statement
The data that support the findings of this study are available in the supplementary material of this article.