Abstract
An increase in photosynthetic activity of the northern hemisphere terrestrial vegetation, as derived from satellite observations, has been reported in previous studies. The amplitude of the seasonal cycle of the annually detrended atmospheric CO2 in the northern hemisphere (an indicator of biospheric activity) also increased during that period. We found, by analyzing the annually detrended CO2 record by season, that early summer (June) CO2 concentrations indeed decreased from 1985 to 1991, and they have continued to decrease from 1994 up to 2002. This decrease indicates accelerating springtime net CO2 uptake. However, the CO2 minimum concentration in late summer (an indicator of net growing-season uptake) showed no positive trend since 1994, indicating that lower net CO2 uptake during summer cancelled out the enhanced uptake during spring. Using a recent satellite normalized difference vegetation index data set and climate data, we show that this lower summer uptake is probably the result of hotter and drier summers in both mid and high latitudes, demonstrating that a warming climate does not necessarily lead to higher CO2 growing-season uptake, even in high-latitude ecosystems that are considered to be temperature limited.
Keywords: atmospheric CO2 seasonal cycle, global climate change, net primary production, summer drought, water stress
Variations in the terrestrial photosynthetic activity strongly control the land carbon cycle, which in turn affects the growth rate of atmospheric CO2. An increasing trend in the satellite-derived normalized difference vegetation index (NDVI) of the northern hemisphere was reported in earlier studies (1–3) and became known as “the greening trend.” The NDVI is related to the fraction of photosynthetic active radiation absorbed by plants (4) and thus to photosynthetic activity. Net primary productivity (NPP) estimated with a model driven by the NDVI and climate also showed an increasing trend (5). The seasonal amplitude of atmospheric CO2 (an indicator of biospheric activity) was observed to have increased over the same period and was linked to the increase in northern hemisphere photosynthetic activity (1). The trend in extratropical terrestrial photosynthetic activity has been mainly attributed to an observed warming trend (1). Additional contributions to the trend include increased precipitation (6), improvement in agricultural practices, and forest regrowth (7). The contributions of CO2 fertilization and nitrogen fertilization to the photosynthetic activity trend were probably small (7, 8), and changes in radiation were probably only important in the tropics (5).
In the current study, we examine the trends in the CO2 uptake in two seasons, spring and summer, and in two periods, up to 1991 and from 1994 [thereby skipping 1992 and 1993, which were influenced by the Mount Pinatubo eruption and are discussed elsewhere (9)]. The trends in these two periods will be assessed from changes in the atmospheric CO2 seasonal cycle and will be compared to the changes in photosynthetic activity indicated by a new NDVI data set [Global Inventory Modeling and Monitoring System (GIMMS), version G].
Methods
CO2 Data. We evaluated changes in two indicators related to the seasonal cycle of CO2 from the annually detrended atmospheric CO2 concentration time series. The first is the atmospheric CO2 concentration in early summer (June), which is indicative of net CO2 uptake (photosynthesis CO2 uptake minus the CO2 release from heterotrophic respiration and biomass burning) in spring. The second indicator is the CO2 seasonal minimum concentration, which is reached in late summer and indicates net CO2 uptake during the growing season (March through August). These two indicators will be referred to onward as “net spring CO2 uptake” and “net growing-season CO2 uptake,” respectively. They have been calculated after Thoning et al. (10) by using monthly zonal concentrations from the GLOBALVIEW (11) “reference marine boundary layer matrix” (12) from 1985 onward [when the number of operating CO2 stations was sufficient to allow robust study of interannual variations (13)]. The values of the two indicators were then averaged for the entire northern hemisphere extratropics (>20°N).
Satellite Data. In this study, we used the GIMMS version G NDVI data set on 1° × 1° spatial resolution and monthly temporal resolution from 1982 to 2002 (14) (available from http://glcf.umiacs.umd.edu/data/gimms/). Improved techniques were introduced to reduce NDVI variations from atmospheric, calibration, view geometry, and other effects not related to actual vegetation change. Pixels with a mean monthly NDVI value below 0.05 were masked for the relevant month.
NPP Estimate. NPP was estimated by the Carnegie Ames Stanford Approach (CASA) model (15) by using monthly interannual NDVI (GIMMS version G), temperature (16) and precipitation (17) data with climatological radiation fields (18).
Climate Data. Temperature anomalies are from the GISS dataset (19). Regional mean temperature trends are weighted by annual NPP calculated from the CASA model (15) to focus on the vegetated areas. Precipitation data (17) were expressed as the 3-month Standardized Precipitation Index, which correlates well with NDVI anomalies (20). The Palmer Drought Index is a standardized measure of surface moisture conditions that integrate moisture supply (precipitation) and demand (which depends on temperature), and it was calculated from these observed parameters by Dai et al. (21).
Results and Discussion
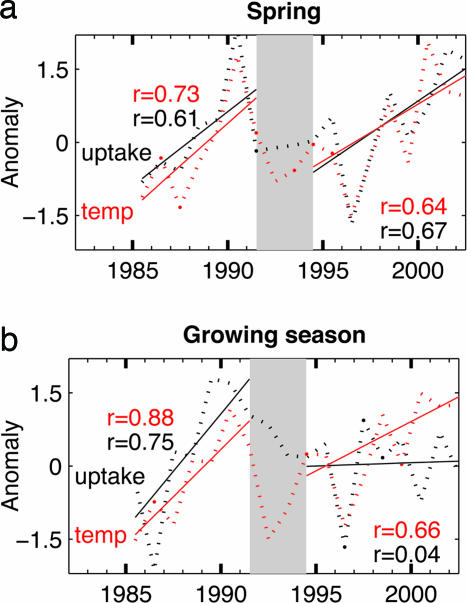
Seasonal Net CO2 Uptake Trends. The variations in the net spring and growing-season CO2 uptakes are shown in Fig. 1 (trend statistics are given in Table 1). The net spring CO2 uptake shows an increasing trend, in both the 1985–1991 period and the 1994–2002 period (r = 0.61 and 0.67, respectively). This trend coincides with a positive trend in spring temperature (r = 0.73 and 0.64 for the two periods, respectively). The significant correlation (Fig. 1a) between the spring uptake and temperature (r = 0.85, P = 10-5) for the entire study period (1985–2002) indicates that the increasing trend in the spring uptake was driven by temperature.
Fig. 1.
Extratropic mean normalized anomalies in the net spring uptake [dotted black line, expressed by inverted early summer (June) detrended CO2 concentration] and spring (MAM) temperature (dotted red line, weighted by NPP) (a) and in the net growing-season uptake (dotted black line, expressed by inverted seasonal minimum detrended CO2 concentration taken from the GLOBALVIEW “reference marine boundary layer matrix”) and growing season (MAMJJA) temperature (dotted red line, weighted by NPP) (b). Regressions against time for the periods 1985–1991, and 1994–2002 are shown by solid lines, and r values, with corresponding color. The period 1992–1993, which was influenced by the Mount Pinatubo eruption, is marked in gray.
Table 1. Linear trends (with r and P values in parentheses) in the extratropical spring (MAM) and growing-season (MAMJJA) temperatures, and in net spring and growing-season CO2 uptake for the two time periods studied.
| Time period | Spring air temperature, °C/yr | Net spring CO2 uptake, ppm/yr | Growing-season temperature, °C/yr | Net growing-season CO2 uptake, ppm/yr |
|---|---|---|---|---|
| 1985-1991 | 0.087 (0.73, 0.06) | 0.10 (0.61, 0.15) | 0.081 (0.88, 0.009) | 0.14 (0.75, 0.05) |
| 1994-2002 | 0.062 (0.64, 0.06) | 0.09 (0.67, 0.05) | 0.044 (0.66, 0.05) | 0.004 (0.04, 0.91) |
The year 1985 is when the number of operating CO2 stations was sufficient to allow robust study of interannual variations. Positive temperature trends are evident in both time periods and evident for both spring and the entire growing season. Net growing-season CO2 uptake goes from a positive trend in the early period to a stalling in the late period, whereas net spring uptake increased in both periods.
The years 1992 and 1993 were characterized by global cooling, resulting from the volcanic aerosol cloud emitted by the Mount Pinatubo eruption in June 1991 (19). This cooling reduced spring and summer CO2 uptakes (Fig. 1). Other anomalies in the carbon cycle in these years are discussed elsewhere (9).
The net growing-season CO2 uptake (Fig. 1b) shows an increasing trend (r = 0.75) in the 1985–1991 period, coincident with the growing-season temperature trend (r = 0.88) (Fig. 1b). This growing-season uptake trend, as well as the spring uptake trends, agrees well with the results of previous studies (1, 22). In contrast, growing-season CO2 uptake did not increase (r = 0.04) in the period 1994–2002, despite a positive temperature trend (r = 0.66). The net growing-season CO2 uptake for the entire period (1985–2002) is only poorly correlated with growing-season temperature (r = 0.27).
Interannual variations in atmospheric transport have been shown to be responsible for a high fraction of the interannual variations in the CO2 seasonal amplitude recorded at the monitoring sites (23). However, the averaging of seasonality variations over large regions, which was done in this study, removes a large part of the transport effects. This result is demonstrated by comparing the measured CO2 seasonality to that simulated (24) by an atmospheric transport model driven by interannual changing winds and constant sources. This comparison shows that although interannual transport variations are correlated with changes in CO2 seasonality, the magnitude of transport-induced variations is considerably smaller. For example, the contribution of interannual transport to the 1986–1990 decrease in the extratropical minimum CO2 concentration was only 25% of the observed change.
Thus, the lack of a 1994–2002 positive trend in the growing-season uptake is most likely not the result of a transport effect and represents a true biospheric response. The lack of any trend in the growing-season uptake, despite the positive trend in the spring uptake, indicates a decrease in summer uptake. Such decrease in summer uptake is the opposite of what may be expected given a warming trend alone (which is expected to enhance photosynthesis). One possible explanation is the drought stress effect on photosynthesis. Indeed, the net growing-season uptake for the entire study period (1985–2002) is correlated with the precipitation index (the 3-month Standardized Precipitation Index, not plotted) of the summer months (r = 0.56, P = 0.06). To investigate better the competing effects of temperature and soil-moisture availability on photosynthesis, we turn to an analysis of the NDVI trends, with emphasis on the spatial distributions, in the northern hemisphere.
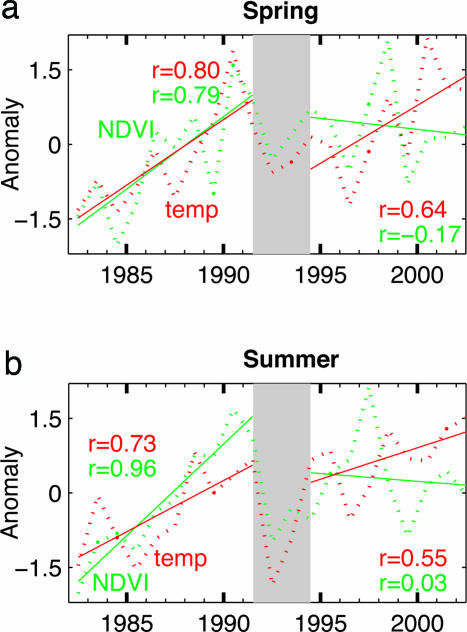
NDVI Trends. Summer trends. The extratropics (Fig. 2 and Table 2) show an increasing summer [June, July, and August (JJA)] NDVI trend from 1982 to 1991 (r = 0.96), when summer air temperatures increased (r = 0.73), in agreement with earlier studies (e.g., ref. 1). The warming continued after the years affected by the Mount Pinatubo eruption (1992–1993). However, the trend in NDVI stalled (r = 0.03) in 1994–2002, despite the continued warming trend (r = 0.55). Spatial analysis was used to determine the cause of the stalling of the NDVI trend.
Fig. 2.
Extratropic mean normalized anomalies in the summer (JJA) NDVI (dotted green line) and the summer temperature (dotted red line, weighted by NPP) (a) and in the spring (MAM) NDVI (dotted green line) and the spring temperature (dotted red line, weighted by NPP) (b). Regressions against time for the periods 1982–1991 and 1994–2002 are shown by solid lines, and r values, with corresponding color. The period 1992–1993, which was influenced by the Mount Pinatubo eruption, is marked in gray.
Table 2. Linear trends (with r and P values in parentheses) in the extratropical spring (MAM) and summer (JJA) temperatures, and in NDVI (in NDVI units/year) during spring and summer, for the two time periods studied.
| Time period | Spring air temperature, °C/yr | Spring NDVI, NDVI units/yr | Summer air temperature, °C/yr | Summer NDVI, NDVI units/yr |
|---|---|---|---|---|
| 1982-1991 | 0.070 (0.80, 0.006) | 0.0029 (0.79, 0.007) | 0.044 (0.73, 0.02) | 0.0023 (0.96, 0.00001) |
| 1994-2002 | 0.062 (0.64, 0.06) | -0.0004 (-0.17, 0.66) | 0.027 (0.55, 0.13) | -0.0002 (0.03, 0.94) |
Positive temperature trends are evident in both time periods, and for both seasons. Summer and spring NDVI goes from a positive trend in the early period to a stalling in the later period.
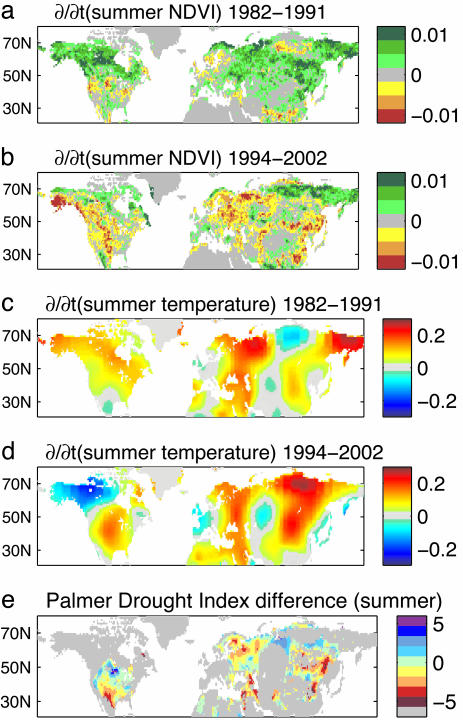
The spatial distributions of the summer NDVI linear trends for 1982–1991 and for 1994–2002 were analyzed and compared with the spatial distribution of the summer temperature linear trends for the same periods (Fig. 3). For 1982–1991, the summer NDVI trend map shows widespread greening (Fig. 3a), associated with warming (Fig. 3c), as reported previously (1). In contrast, during the period from 1994 to 2002, the summer NDVI trend was negative (“browning”) in most areas of North America and Eurasia (Fig. 3b), except some of the coldest parts of these continents, which continue to exhibit a greening trend. Comparison to the temperature trends map (Fig. 3d) shows that the 1994–2002 greening in the coldest areas of Eurasia is explained by a warming trend, whereas the browning present in some areas of Canada and Alaska is explained by cooling. However, browning is also present in some large mid- and high-latitude areas that actually warmed from 1994 to 2002 (colored areas in Fig. 3e). The browning in most of these areas is explained by drier summers, as indicated by the Palmer Drought Index (Fig. 3e), which shows more negative (drier) values in much of the region that browned. The increase in summer drought is mainly driven by lower local precipitation, but it is also affected by increased evapotranspiration demand for moisture driven by the increases in temperature. The drought effects are obvious not only in the middle latitudes, where recent drought effect on NDVI were reported (25), but also in northern Europe. Thus, summer drought plays a major role in the control of photosynthesis in both middle and high latitudes. This result is supported by a study, conducted in an inland boreal forest site in Alaska, which found a negative correlation between summer temperature and tree productivity and associated it with summer drought (26).
Fig. 3.
Summer trends spatial distribution. Linear trends in summer (JJA) NDVI (a and b, in NDVI units per year) and summer surface temperatures (c and d,in°C/yr) for the periods 1982–1991 (a and c), and 1994–2002 (b and d). Gray indicates areas of no trend or persistent ice cover. A greening trend dominates the first period but is largely absent in the second. (e) The difference in the JJA Palmer Drought Index between the mean of 1994–2002 and the mean of 1982–1991, shown only for areas where a negative summer NDVI trend (<0) is accompanied by a warming trend (>0.05°C/yr). (Lower values indicate drier summers.)
Some northern areas of Canada and Alaska that did not warm during the 1994–2002 period show a greening, but this finding can be explained by a previous warming (the 1982–1991 trend), which can have a long-term effect on plant growth through permafrost melting (27). It should be noted that changes in the observed NDVI can result not only from direct climate effects, but also from changes in the frequency of forest fires (which will be higher in hotter and drier summers), outbreaks of insect-caused tree death, and changes in management practices.
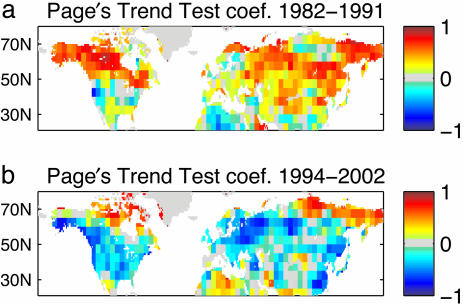
To check the statistical significance of the summer NDVI trends shown in Fig. 3 a and b, we have used the Page's nonparametric trend test, which is designed to deal with relatively short time series [10 years (1982–1991) and 9 years (1994–2002)]. To use the spatial coherence of the trends evident in Fig. 3, we have divided the NDVI data set into 3° × 3° rectangles, and we performed the trend test on each nine-pixel group contained in a rectangle. The trend test showed (Fig. 4a) that the 1982–1991 NDVI trend is significant (r > 0.8) over the large land areas that showed pronounced greening in Fig. 4a. The 1994–2002 stalling and reversal of the NDVI trend were also confirmed by the trend test (Fig. 4b), with strong negative correlations (r < -0.8) in the areas that showed the most pronounced browning in Fig. 3b.
Fig. 4.
Regression coefficients for the Page's trend test preformed on 3° × 3° (9 pixels) of mean summer NDVI for the periods 1982–1991 (a) and 1994–2002 (b). Significant positive values (red, indicating an increase in NDVI) dominate the first period, and negative values dominate the second period.
The halt in the extratropics summer NDVI trend indicates a halt in the increase of photosynthetic activity. Indeed, summer NPP estimated by CASA from the NDVI data shows a halt and even some reversal of the NPP trend in 1994–2002 (r = -0.38). This halt or reversal is probably the main cause for the halt in the net growing-season CO2 uptake trend discussed above. The climate perturbations most likely influenced heterotrophic respiration (Rh) as well, although the data are insufficient to determine the change in Rh resulting from the competition between warming and drought stress. Evidently, the decreased NPP dominated changes in Rh, in contrast to some local scale studies that found that the effect of water stress on Rh is bigger than the effect on NPP (28, 29). Another possible contribution to the decrease in net CO2 uptake is a drought-driven increase in boreal biomass burning. Indeed, interannual variations in biomass burning were shown recently to have a considerable magnitude (30, 31).
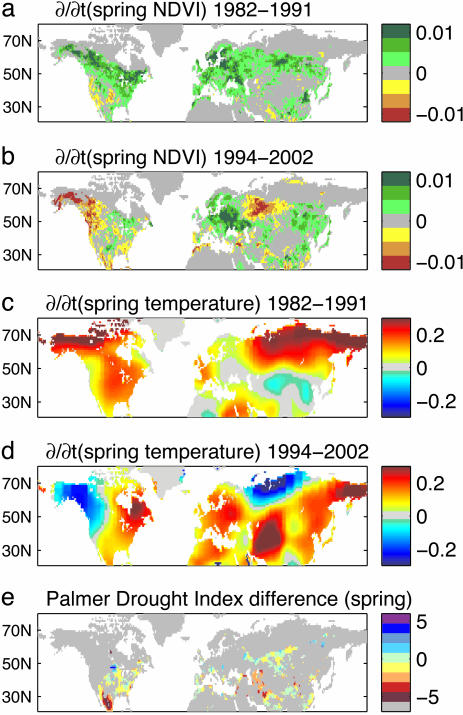
Spring trends. The extratropics spring [March, April, and May (MAM)] NDVI (Fig. 2 and Table 2) shows an increasing trend (r = 0.79) in the 1982–1991 time period, in parallel with the spring temperature trend (r = 0.80). However, no positive NDVI trend (r = -0.17) is obvious in the 1994–2002 period despite a spring warming trend (r = 0.64). These mean extratropics trends were studied in more detail by a spatial analysis (Fig. 5).
Fig. 5.
Spring trends spatial distribution. Linear trends in spring (MAM) NDVI (a and b, in NDVI units per year) and spring surface temperatures (c and d,in °C/yr), for the periods 1982–1991 (a and c), and 1994–2002 (b and d). Gray indicates areas of no trend or persistent ice cover. (e) The difference in the MAM Palmer Drought Index between the mean of 1994–2002 and the mean of 1982–1991, shown only for areas where a negative spring NDVI trend (<0) is accompanied by a warming trend (>0.05°C/yr). (Lower values indicate drier springs.)
The spatial analysis shows spring greening over broad areas (Fig. 5a) in the period 1982–1991. This greening is probably at least partly related to the broad scale warming that took place at this period over most of the northern hemisphere (Fig. 5c). A warming trend is also obvious over large areas in the 1994–2002 period (Fig. 5d). However, other broad areas in North America and Eurasia show pronounced cooling. The local spring NDVI trends in the latter period (Fig. 5b), also mostly follow local temperature, with greening in the warming areas and browning in the cooling ones. In Fig. 5e, we show the Palmer Drought Index for areas in which NDVI decreased in the second period despite an increase in temperature. Most of these areas show lower Palmer Drought Index in the second period, as was the case with the summer trends. In contrast to the summer, droughts in spring seem to affect only mid-latitude areas.
To confirm the robustness of the spring NDVI trends, we preformed Page's nonparametric trend test, which was also preformed for the summer trends. Similar to the summer trends, the statistical analysis of the spring trends (not shown) found significant trends (r > 0.8) in the areas that showed pronounced greening or browning.
The lack of a hemispheric extratropic spring NDVI trend from 1994–2002 complicates the explanation of the continuous increase in the net spring CO2 uptake. It is possible that the rising spring temperature could have generated higher photosynthetic rates, even with fixed NDVI (and fixed fraction of photosynthetically active radiation), through its effect on the light use efficiency, although this is difficult to confirm. It is unlikely that the positive trend in spring uptake between 1994 and 2002 could have been caused by a reduction in heterotrophic respiration, as temperature has been rising since the previous decade. One possible explanation for this discrepancy between the CO2 and satellite observations is snow effect on the spring NDVI.
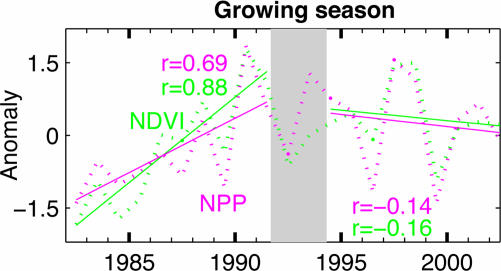
Growing-season trends. The mean growing-season (May through August) northern hemisphere (extratropic) NDVI (Fig. 6) shows the same increasing trend up to 1991 and stalling in the later years observed in the net growing season uptake (Fig. 1b). The growing-season NPP, estimated by CASA from NDVI and climatic data, mostly follows NDVI and shows the same trends. This general agreement between NDVI, CO2 uptake, and CASA estimated NPP supports the conclusion that there was a halt in the increase of photosynthesis activity in the northern-hemisphere extratropics and an associated halt in the growing-season uptake.
Fig. 6.
Variations in the extratropic (20°N-90°N) growing-season (MAMJJA) NDVI (dotted green line) and CASA estimated NPP (dotted magenta line). Regressions against time for the periods 1982–1991 and 1994–2002 are shown by solid lines, and r values, with corresponding color. An increasing trend is evident in both NDVI and NPP in 1982–1991, followed by a decrease in 1992–1993 (influenced by the Mount Pinatubo eruption) and stalling of the trend from 1994 onward.
Conclusions
Our work demonstrates that the net spring CO2 uptake increased from 1994 to 2002, whereas net growing season uptake did not. These findings indicate a decrease in net summer uptake. We have shown that these opposing trends in summer and spring are probably related to a drought-induced reduction in summer photosynthesis, evident in both middle and high latitudes. Thus, warming does not necessarily lead to higher CO2 uptake, even in temperature-limited, high-latitude ecosystems.
Acknowledgments
We thank Jasmin John for computational support and Uri Hasson for help with trend analysis. This study was supported by National Science Foundation Grant ATM-9987457, National Aeronautics and Space Administration (NASA) Carbon Program Grant NAG5-11200, and NASA Earth Observing System Interdisciplinary Science Grant NAG5-9514.
Author contributions: A.A. and I.F. designed research; A.A. and S.B. performed research; A.A., S.B., C.B., C.C.H., W.B., J.P., and C.J.T. analyzed data; and A.A., C.B., C.C.H., and I.F. wrote the paper.
This paper was submitted directly (Track II) to the PNAS office.
Abbreviations: NDVI, normalized difference vegetation index; NPP, net primary productivity; CASA, Carnegie Ames Stanford Approach; MAM, March, April, and May; JJA, June, July, and August.
References
- 1.Myneni, R. B., Keeling, C. D., Tucker, C. J., Asrar, G. & Nemani, R. R. (1997) Nature 386, 698-702. [Google Scholar]
- 2.Zhou, L. M., Tucker, C. J., Kaufmann, R. K., Slayback, D., Shabanov, N. V. & Myneni, R. B. (2001) J. Geophys. Res. 106, 20069-20083. [Google Scholar]
- 3.Slayback, D. A., Pinzon, J. E., Los, S. O. & Tucker, C. J. (2003) Global Change Biol. 9, 1-15. [Google Scholar]
- 4.Tucker, C. J., Fung, I. Y., Keeling, C. D. & Gammon, R. H. (1986) Nature 319, 195-199. [Google Scholar]
- 5.Nemani, R. R., Keeling, C. D., Hashimoto, H., Jolly, W. M., Piper, S. C., Tucker, C. J., Myneni, R. B. & Running, S. W. (2003) Science 300, 1560-1563. [DOI] [PubMed] [Google Scholar]
- 6.Nemani, R., White, M., Thornton, P., Nishida, K., Reddy, S., Jenkins, J. & Running, S. (May 28, 2002) Geophys. Res. Lett. 29, 10.1029/2002GL014867. [DOI]
- 7.Hicke, J. A., Asner, G. P., Randerson, J. T., Tucker, C., Los, S., Birdsey, R., Jenkins, J. C. & Field, C. (May 14, 2002) Global Biogeochem. Cycles 16, 10.1029/2001GB001550. [DOI]
- 8.Caspersen, J. P., Pacala, S. W., Jenkins, J. C., Hurtt, G. C., Moorcroft, P. R. & Birdsey, R. A. (2000) Science 290, 1148-1151. [DOI] [PubMed] [Google Scholar]
- 9.Angert, A., Biraud, S., Bonfils, C., Buermann, W. & Fung, I. (June 5, 2004) Geophys. Res. Lett. 31, 10.1029/2004GL019760. [DOI]
- 10.Thoning, K. W., Tans, P. P. & Komhyr, W. D. (1989) J. Geophys. Res. 94, 8549-8565. [Google Scholar]
- 11.GLOBALVIEW-CO2 (2004) GLOBALVIEW-CO2: Cooperative Atmospheric Data Integration Project—Carbon Dioxide, CD-ROM (National Oceanic and Atmospheric Administration Climate Monitoring and Diagnostics Laboratory, Boulder, CO).
- 12.Masarie, K. A. & Tans, P. P. (1995) J. Geophys. Res. 100, 11593-11610. [Google Scholar]
- 13.Peylin, P., Bousquet, P., Quéré, C. L., Sitch, S., Friedlingstein, P., McKinley, G., Gruber, N., Rayner, P. & Ciais, P. (February 10, 2005) Global Biogeochem. Cycles 19, 10.1029/2003GB002214. [DOI]
- 14.Tucker, C. J., Pinzon, J. E., Brown, M. E., Slayback, D., Pak, E. W., Mahoney, R., Vermote, E. & Saleous, N. E., Int. J. Remote Sens., in press.
- 15.Randerson, J. T., Thompson, M. V., Malmstrom, C. M., Field, C. B. & Fung, I. Y. (1996) Global Biogeochem. Cycles 10, 585-602. [Google Scholar]
- 16.Kalnay, E., Kanamitsu, M., Kistler, R., Collins, W., Deaven, D., Gandin, L., Iredell, M., Saha, S., White, G., Woollen, J., et al. (1996) Bull. Am. Meteorol. Soc. 77, 437-471. [Google Scholar]
- 17.Chen, M., Xie, P., Janowiak, J. E. & Arkin, P. A. (2002) J. Hydrometeorol. 3, 249-266. [Google Scholar]
- 18.Rossow, W. B. & Zhang, Y. C. (1995) J. Geophys. Res. 100, 1167-1197. [Google Scholar]
- 19.Hansen, J., Ruedy, R., Glascoe, J. & Sato, M. (1999) J. Geophys. Res. 104, 30997-31022. [Google Scholar]
- 20.Lotsch, A., Friedl, M. A., Anderson, B. T. & Tucker, C. J. (July 30, 2003) Geophys. Res. Lett. 30, 10.1029/2003GL017506. [DOI]
- 21.Dai, A., Trenberth, K. E. & Qian, T. (2004) J. Hydrometeorol. 5, 1117-1130. [Google Scholar]
- 22.Randerson, J. T., Field, C. B., Fung, I. Y. & Tans, P. P. (1999) Geophys. Res. Lett. 26, 2765-2768. [Google Scholar]
- 23.Higuchi, K., Murayama, S. & Taguchi, S. (April 17, 2002) Geophys. Res. Lett. 29, 10.1029/2001GL013751. [DOI]
- 24.Dargaville, R. J., Heimann, M., McGuire, A. D., Prentice, I. C., Kicklighter, D. W., Joos, F., Clein, J. S., Esser, G., Foley, J., Kaplan, J., et al. (November 19, 2002) Global Biogeochem. Cycles 16, 10.1029/2001GB001426. [DOI]
- 25.Lotsch, A., Friedl, M. A., Anderson, B. T. & Tucker, C. J. (March 19, 2005) Geophys. Res. Lett. 32, 10.1029/2004GL022043. [DOI]
- 26.Barber, V. A., Juday, G. P. & Finney, B. P. (2000) Nature 405, 668-673. [DOI] [PubMed] [Google Scholar]
- 27.Zhuang, Q., McGuire, A. D., Melillo, J. M., Clein, J. S., Dargaville, R. J., Kicklighter, D. W., Myneni, R. B., Dong, J., Romanovsky, V. E., Harden, J. & Hobbie, J. E. (2003) Tellus B 55, 751-776. [Google Scholar]
- 28.Saleska, S. R., Miller, S. D., Matross, D. M., Goulden, M. L., Wofsy, S. C., da Rocha, H. R., de Camargo, P. B., Crill, P., Daube, B. C., de Freitas, H. C., et al. (2003) Science 302, 1554-1557. [DOI] [PubMed] [Google Scholar]
- 29.Goulden, M. L., Munger, J. W., Fan, S. M., Daube, B. C. & Wofsy, S. C. (1996) Science 271, 1576-1578. [Google Scholar]
- 30.van der Werf, G. R., Randerson, J. T., Collatz, G. J., Giglio, L., Kasibhatla, P. S., Arellano, A. F., Jr., Olsen, S. C. & Kasischke, E. S. (2004) Science 303, 73-76. [DOI] [PubMed] [Google Scholar]
- 31.Kasischke, E. S., Hyer, E. J., Novelli, P. C., Bruhwiler, L. P., French, N. H. F., Sukhinin, A. I., Hewson, J. H. & Stocks, B. J. (February 16, 2005) Global Biogeochem. Cycles 19, 10.1029/2004GB002300. [DOI]


