

Abstract
Crossing-over between homologous chromosomes facilitates proper disjunction of chromosomes during meiosis I. In many organisms, gene functions that are essential to crossing-over also facilitate the intimate chromosome pairing called “synapsis.” Many organisms—including budding yeast, humans, zebrafish, Drosophila, and Arabidopsis—regulate the distribution of crossovers, so that, most of the time, each chromosome bundle gets at least one crossover while the mean number of crossovers per chromosome remains modest. This regulation is obtained through crossover interference. Recent evidence suggests that the organisms that use recombination functions to achieve synapsis have two classes of crossovers, only one of which is subject to interference. We statistically test this two-pathway hypothesis in the CEPH data and find evidence to support the two-pathway hypothesis in humans.
Introduction
Crossovers in many model organisms (e.g., budding yeast, Drosophila melanogaster, Neurospora crassa, and Caenorhabditis elegans) are subject to interference: a crossover at one location discourages crossovers from occurring nearby. Both conceptual and mathematical models for the distribution of crossovers subject to interference are well established (Bailey 1961; Mortimer and Fogel 1974; Foss et al. 1993; McPeek and Speed 1995; Zhao et al. 1995b). Recently, several experiments and analyses have suggested two distinct recombinational pathways in meiosis in some, if not most, organisms. On the one hand, mutations in MSH4 in Saccharomyces cerevisiae reduce crossing-over only by 50%–70% but completely abolish interference (Ross-Macdonald and Roeder 1994). On the other hand, mutations in the MSH4 homolog, HIM-14, in C. elegans completely eliminate crossing-over in that organism (Zalevsky et al. 1999). This evidence suggests that yeast has two recombinational pathways, only one of which is shared by C. elegans. Furthermore, yeast seems to use early recombination events to achieve synapsis (Loidl et al. 1994; Weiner and Kleckner 1994), whereas C. elegans uses cis-acting “pairing centers” for this purpose (McKim et al. 1993; Villeneuve 1994). Additional support for the hypothesis of separate “pairing” and “disjunction” recombinational pathways with only the second subject to interference comes from other model organisms. Drosophila has cis-acting pairing centers (Hawley 1980), seems not to need double-strand–break repair to establish chromosome synapsis (Dernburg et al. 1998), shows strong interference (Foss et al. 1993; Zhao et al. 1995b), and seems to have only one recombinational pathway (Copenhaver et al. 2002). Statistical evidence supports the two-pathway hypothesis in Arabidopsis thaliana (Copenhaver et al. 2002) and in budding yeast (M. German, J. Swanson, A. Malkova, J. McCusker, E. A. Housworth, H. Foss, F. W. Stahl, and J. Haber, unpublished data).
Although there is no direct evidence that humans use recombination to achieve synapsis during meiosis, it does seem likely, since mice do (Romanienko and Camerini-Otero 2000). In the present article, we statistically test the two-pathway hypothesis of recombination in CEPH data. The statistical test addresses the hypothesis that some of the crossovers (putatively, those in the pairing pathway and occurring early in meiosis) occur independently of all other crossovers whereas the remaining ones (putatively, those crossovers in the disjunction pathway and occurring late in meiosis) are subject to interference. The statistics can only answer questions about the fit of the various models to the data. Further molecular experiments are necessary to verify the nature of the crossovers.Table 1 summarizes the properties that distinguish organisms that use recombination functions to achieve synapsis (group II) from those that do not (group I).
Table 1.
Two Groups of Eukaryotes[Note]
| Organism | TelomereBouquet | Dmc1a | Evidenceof Initiation | Interference |
| Group Ib: | ||||
| D. melanogaster | Noc | No | Lated | χ2e |
| C. elegans | Nof | No | Lateg | Strong |
| N. crassa | Noh | No | Not available | χ2f |
| Group IIi: | ||||
| S. cerevisiae | Yesf | Yes | Early and latej | χ2 plus randomk |
| Homo/Mus | Yesf | Yes | Early and latel | χ2 plus randomm |
| A. thaliana | Yesf | Yes | Not available | χ2 plus randomn |
Note.— Eukaryotes that require recombination functions to achieve meiotic synapsis (group II) differ from those that do not (group I) by several identified properties. The early prophase stage called “bouquet,” in which telomeres are clustered, has been sought but not found in group I. Genes for the strand-invasion protein called “Dmc1” in S. cerevisiae are lacking in group I. Evidence for meiotic double-strand breaks, which initiate recombination, is found only in zygotene-pachytene in group I, even though it is evident earlier in prophase in group II. The frequency distribution of intercrossover distances (if available) is well described by the counting model for group I, whereas, for group II, the fit of the counting model to the data is significantly improved by adding a class of crossovers that are not subject to interference.
For review, see Copenhaver et al. 2002. See also Takanami et al. 2000, Gerton and DeRisi 2002, and online databases.
Recombination functions not required for synapsis (not known for N. crassa) (for review, see Copenhaver et al. 2002).
Foss et al. 1993.
For review, see Zickler and Kleckner 1998.
Immunofluorescent foci indicative of a peak of double-strand breaks in pachytene, rather than in leptotene or zygotene (A. Villeneuve, personal communication).
Singleton 1953. This issue has not been recently addressed in Neurospora.
Recombination functions required for synapsis (for review, see Copenhaver et al. 2002).
Xu et al. 1997.
M. German, J. Swanson, A. Malkova, J. McCusker, E. A. Housworth, H. Foss, F. W. Stahl, and J. Haber, unpublished data.
Moens et al. 2002.
Present article.
Copenhaver et al. 2002.
Methods
The present study uses the data analyzed for interference by Broman and Weber (2000). The data consist of nearly precise locations of crossovers in 80–92 products of meiosis for the maternally and paternally inherited chromosomes in eight CEPH families. The crossovers are located using >8,000 polymorphisms in these families, and only those meiotic products with a maximum distance of <14 cM between informative markers were used. The data have been carefully groomed to remove genotyping errors (Broman et al. 1998). This grooming is necessary because the vast majority of apparent tight double recombinants are due to genotyping errors. Apparent tight double recombinants that involve phase errors, involve both parental chromosomes at the same locus, or involve tight triple recombinants indicative of an error in marker order are almost surely due to genotyping errors. The data were also groomed using cryptic duplicate markers (i.e., markers at the same locus and corresponding to the same polymorphism but having distinct PCR primers). When there was a discrepancy between two cryptic duplicate markers, the typing that did not give a tight double recombinant was retained. Grooming also involved several cycles of identification of tight double recombinants and marker reordering. One major statistical prediction of the two-pathway hypothesis is the presence of rare but true tight double recombinants. Any true tight double recombinants disposed of by these latter grooming methods weakens the evidence supporting the two-pathway hypothesis. Thus, our analysis of the two-pathway hypothesis using the extensively groomed CEPH data should be viewed as conservative.
We extended the analytical methodology of Broman and Weber (2000) to a mixture model (for details, see appendix A). The idea is to compute the probability of seeing a particular pattern of intercrossover distances for any given level of interference (m) and any given probability that a randomly chosen crossover is interference free (p) rather than subject to interference (1-p). The probability of the data for particular values of m and p is the product of these probabilities over all the patterns in the sample. We can then find the m and p values that maximize the probability of observing the given data. We also find the value of the interference parameter, m, that best fits the data under an interference-only model. A simple likelihood-ratio test is used to evaluate whether the two-pathway model fits the data significantly better than the interference-alone model. The P values for the likelihood-ratio statistic are calculated using simulations, since the null hypothesis that there are no interference-free crossovers (p=0) lies on the boundary of the parameter space.
Figures 1–3 demonstrate the differences between the two-pathway and interference-only models. The degree of differentiation will depend on the percentage of interference-free crossovers and the values of the interference parameters used. Figure 1 shows the density distribution of the intercrossover distances between a random pair of crossovers for the two-pathway model with p=0.06 and m=5.5 (corresponding to our estimates for maternal chromosome 2), for an interference-only model with m=3.2 (the average level of interference for the maternal chromosomes under an interference-only model), and for the interference-free (m=0) model. However, unlike the interference-only and interference-free distances, the intercrossover distances under the two-pathway model along one meiotic product do not represent independent samples from the shown distribution. Figure 2 shows the cumulative distribution (the probability of seeing the next crossover <X morgans away) for small distances. Figure 3 shows the probability of a tight double recombinant in an interval, given no flanking marker recombination, for the two-pathway model, the interference-only model, and the interference-free model.
Figure 1.

Statistical density functions for intercrossover distances. For the two-pathway model, the density for intercrossover distances is given by p2f*(x|p,0)+2p(1-p)[1-F*(x|p,0)][1-F*(x|1-p,m)]+(1-p)2f*(x|1-p,m) and is shown by the solid curve for m=5.5 and p=0.06 (the values estimated for maternal chromosome 2). For the interference-only model, the density is given by f*(x|1,m) and is shown by the dashed curve for m=3.2 (the maternal average value under the interference-only model). The dotted curve shows the density for the interference-free model (m=0).
Figure 2.

Cumulative probability for the distance to the next crossover. The cumulative distribution functions for the densities in figure 1 are shown for the two-pathway model with p=0.06 and m=5.5 (solid line), for the interference-only model with m=3.2 (dashed line), and for the interference-free model (dotted line).
Figure 3.

Probability of a double crossover in an interval, given no marker recombination—for the two-pathway model with p=0.06 and m=5.5 (solid line), for the interference-only model with m=3.2 (dashed line), and for the interference-free model (dotted line).
There is evidence for variation in the recombination rate per Mb between chromosomes. Kaback et al. (1999) concluded that interference is stronger on longer chromosomes of budding yeast. Another plausible explanation for this relationship is that interference in the disjunction pathway is the same for all chromosomes but that each chromosome of a group II organism must enjoy the same average number of crossovers in the pairing pathway, independently of length. More specifically, each chromosome must have the same average number of double-strand breaks in the pairing pathway, to achieve synapsis, and the same proportion of these will have crossover resolutions. With a recombination rate, a, of disjunction crossovers per unit of physical distance and a fixed average amount of pairing-pathway crossing-over, b, per chromosome, the mathematical model for the estimation of the genetic distance X, in morgans, from the physical distance L, in Mbp, would be X=aL+b. Thus, the proportion, p, of crossovers that are in the pairing pathway on any one chromosome is predicted to be b/(aL+b)=b/X, or inversely proportional to the genetic length of the chromosome. The regression of genetic length on physical length for maternal and paternal human chromosomes supports this alternative explanation (see fig. 4). This demonstration allows us to pool the data from all the chromosomes, obtaining greater statistical power for testing the two-pathway hypothesis. We then test whether the pooled data fit the two-pathway hypothesis with the proportion of pairing-pathway crossovers inversely proportional to the genetic length of the chromosome better than the interference-only model with a single interference parameter. We also consider whether a model that includes separate interference parameters for each chromosome fits the data substantially better than the two-pathway hypothesis.
Figure 4.

Model for recombination rates in humans. The least-squares regression line for the estimation of genetic length from the physical lengths of the maternal (circles) (X=0.0125L+0.241) and paternal (crosses) (X=0.0070L+0.163) chromosomes. The maternal analysis includes the X chromosome, whereas the paternal analysis includes only the autosomes.
The interference parameter, m, is the number of noncrossover resolutions (simple gene conversions) required in the repair of double-strand breaks between pairs of crossover resolutions. If A is the rate of double-strand breaks in the disjunction pathway per Mb, then a = A/(m + 1). Thus, our proposed model, X = aL + b, alone is not enough to provide an estimate of the interference level, m, even though it does provide an estimate of the proportion of interference-free crossovers, p, for each chromosome.
Results
Table 2 contains the results for the chromosomes analyzed individually. The significance of the two-pathway model for any one chromosome is often based on only one meiotic product whose recombination pattern would be highly unlikely in the interference-only model. In contrast, simulations show that, for a data set of 92 products of meiosis, a chromosome of length 1 morgan, and two crossover pathways with parameters p = 0.08 and m = 6, we would estimate p to be 0 roughly one-fourth of the time. Thus, we lack the statistical power to adequately assess the two-pathway hypothesis on the individual chromosomes.
Table 2.
Separate Chromosome Analyses
|
Results for Females |
Results for Males |
|||||||
| Chromosome | ma | p | Testb | Length (cM) | ma | p | Testb | Length (cM) |
| 1 | 4.5 | 0 | 0 | 345 | 3.4 | 0 | 0 | 188 |
| 2 | 5.5 | .06 | 8.5*** | 322 | 8.3 | .03 | 16.1*** | 194 |
| 3 | 5.0 | .07 | 2.52** | 268 | 5.4 | 0 | 0 | 169 |
| 4 | 8.1 | .09 | 2.89** | 257 | 7.5 | .03 | 4.70** | 151 |
| 5 | 5.7 | .03 | 8.76*** | 243 | 5.1 | .06 | 4.18** | 129 |
| 6 | 4.0 | .06 | 1.06* | 246 | 7.3 | 0 | 0 | 119 |
| 7 | 6.9 | 0 | 0 | 224 | 2.9 | 0 | 0 | 117 |
| 8 | 1.2 | 0 | 0 | 223 | 6.1 | .03 | .62 (NS) | 104 |
| 9 | ∞ | .06 | 14.1*** | 185 | 4.3 | .06 | 3.02** | 118 |
| 10 | 5.4 | .06 | 3.30*** | 206 | 3.3 | 0 | 0 | 129 |
| 11 | 4.6 | 0 | 0 | 179 | 1.9 | 0 | 0 | 107 |
| 12 | 5.7 | 0 | 0 | 209 | 5.0 | .03 | 1.06* | 119 |
| 13 | 6.8 | .04 | 2.46* | 115 | 2.8 | 0 | 0 | 76 |
| 14 | 7.9 | 0 | 0 | 147 | 4.3 | 0 | 0 | 101 |
| 15 | 4.8 | 0 | 0 | 132 | 7.1 | .04 | 1.91* | 78 |
| 16 | 5.5 | .08 | 4.75** | 164 | 9.1 | 0 | 0 | 84 |
| 17 | 5.2 | .03 | 1.40* | 147 | 7.4 | 0 | 0 | 79 |
| 18 | 8.7 | .07 | 5.08** | 155 | 4.7 | 0 | 0 | 86 |
| 19 | 6.9 | 0 | 0 | 106 | 4.7 | 0 | 0 | 76 |
| 20 | ∞ | .21 | 4.43** | 118 | 2.0 | 0 | 0 | 59 |
| 21 | 3.3 | 0 | 0 | 59 | ∞ | 0 | 0 | 39 |
| 22 | 2.6 | 0 | 0 | 53 | 1.9 | 0 | 0 | 28 |
| 23 | 6.0 | 0 | 0 | 177 | ||||
The number of simple gene conversions between crossovers. The interference parameter, m, is estimated as a continuous parameter in the gamma distribution modeling intercrossover distances and thus is not restricted to be an integer.
Significance (if comparison is to be made) is approximate and is based on simulations. NS = not significant (P>.10).
P<.10.
P<.05.
P<.01.
When the maternal chromosomes are pooled and the proportion of pairing, interference-free crossovers is modeled as p=b/X, the two-pathway hypothesis is strongly supported (m=5.7±0.5; b=0.088±0.017; test statistic 64.8; P<.01). If we completely throw out the top 9–13 meiotic products that have the greatest likelihood ratio in support of the two-pathway hypothesis (and that involve relatively tight double recombinants), the remaining data still strongly support the two-pathway hypothesis over the interference-only model. For paternal chromosomes, the combined data also strongly support the two-pathway hypothesis (m=5.0±0.5; b=0.030±0.12; test statistic 22.2; P<.01). However, the strong statistical support for the two-pathway hypothesis in paternal chromosomes comes from three meiotic products whose recombination patterns, involving relatively tight double recombinants, are much more likely under the two-pathway hypothesis than under an interference-only model. Since it is not reasonable to throw out only data that support the two-pathway hypothesis, we calculated a trimmed sum for which we threw out the top 5% of the data that best support the two-pathway hypothesis and also threw out the top 5% of the data that best support the interference-only model. The remaining data strongly support the two-pathway hypothesis.
Furthermore, consideration of the likelihood values under the two-pathway hypothesis and under a model using separate interference parameters for each chromosome clearly supports the two-pathway model. For the data from maternal chromosomes, the log likelihood value for the two-pathway hypothesis is −3,153, whereas, for the model using separate interference parameters for each chromosome, the value is −3,152. The difference is trivial, and the Akaike information criterion (AIC) for model selection would clearly indicate that the two-pathway model should be used, owing to its simplicity. For paternally inherited chromosomes, the values are −1,789 and −1,787, and the two-pathway hypothesis would again clearly be supported under the AIC.
For the individual chromosome analyses, we did not calculate SEs or CIs for our parameter estimates. Such SEs and CIs are largely meaningless if the data have been excessively groomed, since, in that case, our estimates of the proportion of interference-free crossovers, p, would be downwardly biased. Moreover, whereas the average distance between markers is ∼0.5 cM, the maximum distance between informative markers for any one product of meiosis can be as great as 13.9 cM in the data that we used for the present analysis. Our analysis has not included the possibility that tight double recombinants exist but are unobserved in these intervals (fig. 3). Furthermore, when there is a significant proportion of interference-free crossovers in the pairing pathway, the estimator for the interference parameter for individual chromosomes on the basis of 80–92 meiotic products is noticeably skewed, and, thus, the SE does not adequately reflect our uncertainty in the estimate. Simulations to determine these CIs require large amounts of computer time, because the mixture-model analysis of any one data set is computationally intensive. The important conclusion of this work is simply the strong statistical support for two recombinational pathways, only one of which involves interference.
Discussion
Our estimates of b values based on the intercepts of the regressions of the genetic length on the physical length for the maternal and paternal chromosomes exceed our estimates based on maximum-likelihood estimation from fitting the model to the data. If we view the genetic lengths as being subject to random measurement error but the physical lengths of the chromosomes as practically fixed, it is appropriate to consider CIs for the intercept based on the regression of genetic lengths on the physical lengths. For the regression of the maternally and paternally inherited chromosomes, the 95% CIs for the intercept are (−0.002, 0.485) and (0.018, 0.308), respectively. Our maximum-likelihood estimates for b are within these intervals. Furthermore, these interval estimates for the intercept share considerable overlap, which suggests that the differences in maternal- and paternal-chromosomal genetic lengths are largely due to the very different estimates of the rate of interference-associated crossovers per megabase, a, in males and females.
The possibility that there are two recombinational pathways, only one of which is subject to interference, has several important implications for genetic studies. One implication is for gene-mapping algorithms. Several authors have demonstrated that the use of models of interference in gene-mapping methods increases the power of those methods, so that fewer genotypes need be scored to accurately order and map genes (Goldgar and Fain 1988; Goldgar et al. 1989; Weeks et al. 1993; Goldstein et al. 1995; Lin and Speed 1999). When the level of interference is assumed to be slightly different from the true interference level used to generate the data, the error rate for these improved mapping methods increases only minimally (Goldstein et al. 1995; Lin and Speed 1999). However, if some crossovers are not subject to interference, then the error rate of methods when a fixed and substantial level of interference is assumed will increase to unacceptable levels, because interference-only models essentially rule out all possibility of tight double recombinants (figs. 1 and 2). A second implication is for the removal of genotyping errors. Under the two-pathway hypothesis, the only way to remove isolated nonobvious genotyping errors (those not involving phase errors, tight triple recombinants, or double tight recombinants on both maternal and paternal chromosomes at the same locus) is by biologically verifying the genotype, because tight double recombinants are expected to happen occasionally by chance. A third implication is for following the transmission of a mutation through a pedigree. The transmission of tight flanking markers is less of a guarantee of the transmission of the mutation under the two-pathway model than under the interference-only model, owing to the increased chance that a tight double recombinant may occur in the interval under scrutiny (fig. 3). We are pursuing the molecular verification of our model’s predictions in yeast.
Acknowledgments
We thank Karl Broman and James Weber for sharing their “clean” data with us; their identification and correction of possible genotyping errors is a valuable contribution to our work. We also thank the two anonymous reviewers for their helpful comments and suggestions of improvements to our original manuscript. The computing part of this work was supported, in part, by Shared University Research grants from IBM (to Indiana University). Support to F.W.S. was from National Science Foundation grant MCB-9402695.
Appendix A: Mathematical Details
The methodology for calculating the probability of a given set of intercrossover distances along a single product of meiosis involves extending the methodology of Broman and Weber (2000).
Interference-Free and Interference-Only Models
Consider what happens along the tetrad. Let x0,x1,…,xn be the intercrossover distances along the tetrad, where x0 is the distance from the “start” of the tetrad to the first crossover and xn is the distance from the last crossover to the “end” of the tetrad. If there were no interference, the mathematical model for the probability density function for these distances would be the exponential distribution, e-λx, where λ is the rate of the Poisson-distributed crossovers (the double-strand breaks are assumed to follow a Poisson distribution, and, if the crossover and noncrossover resolutions are independent of each other [as they are in the interference-free model], then the crossovers are also Poisson distributed). If there is interference, then the mathematical model for the intercrossover distances is the model for the sum m+1 exponential interrecombination distances, where m noncrossover resolutions (simple gene conversions) are required between pairs of crossovers. This distribution is a scaled version of the χ2 distribution, so the counting model is also often called “the χ2 model.” The exponential distribution and the χ2 distribution are both members of the family of gamma distributions. The density for the gamma distribution with a given rate λ and shape ν will be denoted throughout as
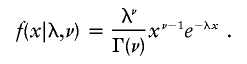 |
The Two-Pathway (Mixture) Model
Assume that we have a mixture of independent types of crossovers. Suppose that a type occurs with probability q and interference parameter l (the number of obligate simple gene conversions between any two crossovers of this type). The amount of crossing-over on a tetrad is twice that on a single product, so the density for the intercrossover distances for this type is given by a gamma distribution with rate 2q(l+1) and shape l+1: f[x|2q(l+1),l+1].
The distribution of the length to the first crossover is determined by the requirement of stationarity (i.e., the start of the chromosome plays no special role in determining where the first crossover will be, and, starting from the other end, we would get the same probability for the observed collection of distances). Under this assumption, the distribution for the distance to the first crossover is g(x|q,l)=2q[1-F(x|2q(l+1),l+1)], where F is the cumulative distribution function of the gamma density function f.
The distribution of the length from the last crossover to the end of the tetrad is calculated as a right-censored distribution (i.e., the probability of not seeing a crossover in an interval of that length) and is just 1-F[x|2q(l+1),l+1].
If we had tetrad data, then we could find the likelihood of the observed intercrossover distances, x0,x1,…,xn, under the two-pathway hypothesis by considering each of the 2n possible divisions of n crossovers into the two types (pairing and disjunction), multiplying the probabilities of the intercrossover distances for each type calculated separately, and summing over all the 2n possible divisions. For analyses involving single meiotic products, we have a further complication. We assume no chromatid interference (a reasonable assumption; see Zhao et al. 1995a). In that case, each chromatid has a 50:50 chance of getting each crossover, independently of which ones get the neighboring crossovers. Thus, the crossovers on the tetrad get thinned, each with probability 1/2, to form the crossover distribution on the product that we observe. Because the sum of gamma-distributed random variables each with the same rate is gamma-distributed with that same rate but with its shape parameter equal to the sum of the shape parameters of its components, we see that the density for the intercrossover distances is
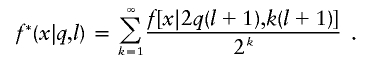 |
This density is for the distances between observed crossovers of a given type. We still have to handle the ends. On the “starting” end, we have probability 1/2 of getting the first crossover on the tetrad, which follows the distribution required for stationarity. If the product failed to get the first crossover on the tetrad, then the additional distances are intercrossover distances modeled via the gamma family. Using properties of the convolutions involved, we obtain the density for the distance from the start to the first crossover:
where F* is the cumulative distribution function for f*. The distribution for the intercrossover distance from the last crossover to the end of the chromosome is obtained as a right-censored observation of the intercrossover distances along a single meiotic product. Thus, the distribution is just [1-F*(x|q,l)].
Finally, the probability that a product has no crossovers of a given type is a right-censored observation from the density of the distribution for the distance to the first crossover. Thus, the probability of seeing no crossover on a chromosome of length L is given by [1-G*(L|q,l)], where G* is the cumulative distribution function for g*.
Data Analysis
If the intercrossover distances, including the ends, for a single product of meiosis are x0,x1,…,xn, where x0+x1+x2+⋅⋅⋅xn=L is the length of the chromosome, then we consider each of the 2n possible ways to assign the crossovers to the pairing (q=p,l=0) and disjunction (q=1-p,l=m) types. Given such an assignment, we form two sets of intercrossover distances, y0,y1,…,yj and z0,z1,…,zk, for the pairing and disjunction types of crossovers, respectively. Note that j+k will equal n+1, because of the division into two types, and that y0+y1+y2+⋅⋅⋅yj=z0+z1+z2+⋅⋅⋅zk=L.
We calculate the probability of the intercrossover distances for the two types separately:
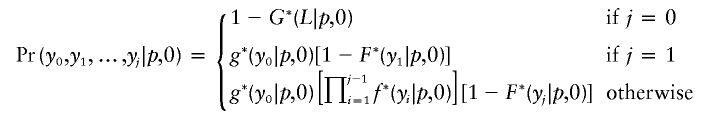 |
and
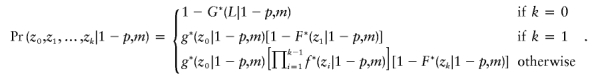 |
We sum these probabilities over all the 2n possible divisions, to obtain the probability of the observed pattern under the two-pathway hypothesis:
 |
where the sum is taken over all the 2n possible divisions of the n crossovers into two types.
The likelihood of the model parameters given a data set that consists of the intercrossover distances for a collection of meiotic products is the product of the probabilities of the individual meiotic patterns:
 |
The likelihood is a function of the parameters m and p and can be maximized to find estimates for m and p. This optimization takes place over a two-dimensional parameter space. We use optimization algorithms that avoid calculating the derivative (gradient) of this likelihood function. (We use the golden-section algorithm to calculate the optimum along any line, and we use a version of Powell’s method to determine the directions of the lines [Press et al. 1986].)
References
- Bailey NTJ (1961) Introduction to the mathematical theory of genetic linkage. Oxford University Press, London [Google Scholar]
- Broman KW, Murray JC, Sheffield VC, White RL, Weber JL (1998) Comprehensive human genetic maps: individual and sex-specific variation in recombination. Am J Hum Genet 63:861–869 [DOI] [PMC free article] [PubMed] [Google Scholar]
- Broman KW, Weber JL (2000) Characterization of human crossover interference. Am J Hum Genet 66:1911–1926 [DOI] [PMC free article] [PubMed] [Google Scholar]
- Copenhaver GP, Housworth EA, Stahl FW (2002) Crossover interference in Arabidopsis. Genetics 160:1631–1639 [DOI] [PMC free article] [PubMed] [Google Scholar]
- Dernburg AF, McDonald K, Moulder G, Barstead R, Dresser M, Villeneuve AM (1998) Meiotic recombination in C. elegans initiates by a conserved mechanism and is dispensable for chromosome synapsis. Cell 94:387–398 [DOI] [PubMed] [Google Scholar]
- Foss E, Lande R, Stahl FW, Steinberg CM (1993) Chiasma interference as a function of genetic distance. Genetics 133:681–691 [DOI] [PMC free article] [PubMed] [Google Scholar]
- Gerton JL, DeRisi JL (2002) Mnd1p: an evolutionarily conserved protein required for meiotic recombination. Proc Natl Acad Sci USA 99:6895–6900 [DOI] [PMC free article] [PubMed] [Google Scholar]
- Goldgar DE, Fain PR (1988) Models of multilocus recombination: nonrandomness in chiasma number of crossover positions. Am J Hum Genet 43:38–45 [PMC free article] [PubMed] [Google Scholar]
- Goldgar DE, Fain PR, Kimerling WJ (1989) Chiasma-based models of multilocus recombination: increased power for exclusion mapping and gene ordering. Genomics 5:283–290 [DOI] [PubMed] [Google Scholar]
- Goldstein DR, Zhao H, Speed TP (1995) Relative efficiencies of χ2 models of recombination for exclusion mapping and gene ordering. Genomics 27:265–273 [DOI] [PubMed] [Google Scholar]
- Hawley RS (1980) Chromosomal sites necessary for normal levels of meiotic recombination in Drosophila melanogaster. I. Evidence for and mapping of the sites. Genetics 94:625–646 [DOI] [PMC free article] [PubMed] [Google Scholar]
- Kaback DB, Barber D, Mahon J, Lamb J, You J (1999) Chromosome size–dependent control of meiotic reciprocal recombination in Saccharomyces cerevisiae: the role of crossover interference. Genetics 152:1475–1486 [DOI] [PMC free article] [PubMed] [Google Scholar]
- Lin S, Speed TP (1999) Relative efficiencies of the chi-square recombination models for gene mapping with human pedigree data. Ann Hum Genet 63:81–95 [DOI] [PubMed] [Google Scholar]
- Liu H, Jang JK, Kato N, McKim KS (2002) mei-P22 encodes a chromosome-associated protein required for the initiation of meiotic recombination in Drosophila melanogaster. Genetics 162:245–258 [DOI] [PMC free article] [PubMed] [Google Scholar]
- Loidl J, Klein F, Scherthan H (1994) Homologous pairing is reduced but not abolished in asynaptic mutants of yeast. J Cell Biol 125:1191–1200 [DOI] [PMC free article] [PubMed] [Google Scholar]
- McKim KS, Peters K, Rose AM (1993) Two types of sites required for meiotic chromosome pairing in Caenorhabditis elegans. Genetics 134:749–768 [DOI] [PMC free article] [PubMed] [Google Scholar]
- McPeek MS, Speed TP (1995) Modeling interference in genetic recombination. Genetics 139:1031–1044 [DOI] [PMC free article] [PubMed] [Google Scholar]
- Moens PB, Kolas NK, Tarsounas M, Marcon E, Cohen PE, Spyropoulos B (2002) The time course and chromosomal location of recombination-related proteins at meiosis in the mouse are compatible with models that can resolve the early DNA-DNA interactions without reciprocal recombination. J Cell Sci 115:1611–1622 [DOI] [PubMed] [Google Scholar]
- Mortimer RK, Fogel S (1974) Genetical interference and gene conversion. In: Grell RF (ed) Mechanisms in recombination. Plenum Press, New York, pp 263–275 [Google Scholar]
- Page SL, Hawley RS (2001) c(3)G encodes a Drosophila synaptonemal complex protein. Genes Dev 15:3130–3143 [DOI] [PMC free article] [PubMed] [Google Scholar]
- Press WH, Teukolsky SA, Vetterling WT, Flannery BP (1986) Numerical recipes in Fortran. Cambridge University Press, Cambridge, UK [Google Scholar]
- Romanienko PJ, Camerini-Otero RD (2000) The mouse Spo11 gene is required for meiotic chromosome synapsis. Mol Cell 6:975–987 [DOI] [PubMed] [Google Scholar]
- Ross-Macdonald P, Roeder GC (1994) Mutation of a meiosis-specific MutS homolog decreases crossing over but not mismatch correction. Cell 79:1069–1080 [DOI] [PubMed] [Google Scholar]
- Singleton JR (1953) Chromosome morphology and the chromosomal cycle in the ascus of Neurospora crassa. Am J Bot 40:124–144 [Google Scholar]
- Takanami T, Mori A, Takahashi H, Higashitani A (2000) Hyper-resistance of meiotic cells to radiation due to a strong expression of a single recA-like gene in Caenorhabditis elegans. Nucleic Acids Res 28:4232–4236 [DOI] [PMC free article] [PubMed] [Google Scholar]
- Villeneuve AM (1994) A cis-acting locus that promotes crossing over between X chromosomes in Caenorhabditis elegans. Genetics 136:887–902 [DOI] [PMC free article] [PubMed] [Google Scholar]
- Walker MY, Hawley RS (2000) Hanging on to your homolog: the roles of pairing, synapsis and recombination in the maintenance of homolog adhesion. Chromosoma 109:3–9 [DOI] [PubMed] [Google Scholar]
- Weeks DE, Lathrop GM, Ott J (1993) Multipoint mapping under genetic interference. Hum Hered 43:86–97 [DOI] [PubMed] [Google Scholar]
- Weiner BM, Kleckner N (1994) Chromosome pairing via multiple interstitial interactions before and during meiosis in yeast. Cell 77:977–991 [DOI] [PubMed] [Google Scholar]
- Xu L, Weiner BM, Kleckner N (1997) Meiotic cells monitor the status of the interhomolog recombination complex. Genes Dev 11:106–118 [DOI] [PubMed] [Google Scholar]
- Zalevsky J, MacQueen AJ, Duffy JB, Kemphues KJ, Villeneuve AM (1999) Crossing over during Caenorhabditis elegans meiosis requires a conserved MutS-based pathway that is partially dispensable in budding yeast. Genetics 153:1271–1291 [DOI] [PMC free article] [PubMed] [Google Scholar]
- Zhao H, McPeek MS, Speed TP (1995a) Statistical analysis of chromatid interference. Genetics 139:1057–1065 [DOI] [PMC free article] [PubMed] [Google Scholar]
- Zhao H, Speed TP, McPeek MS (1995b) Statistical analysis of crossover interference using the χ2 model. Genetics 139:1045–1056 [DOI] [PMC free article] [PubMed] [Google Scholar]
- Zickler D, Kleckner N (1998) The leptotene-zygotene transition of meiosis. Ann Rev Genet 32:619–697 [DOI] [PubMed] [Google Scholar]