

Abstract
Somatic loss of heterozygosity (LOH) has been widely reported in breast cancer as a means of identifying putative tumor-suppressor genes. However, individual studies have rarely spanned more than a single chromosome, and the varying criteria used to declare LOH complicate efforts to formally differentiate regions of consistent versus sporadic (random) loss. We report here the compilation of an extensive database from 151 published LOH studies of breast cancer, with summary data from >15,000 tumors and primary allelotypes from >4,300 tumors. Allelic loss was evaluated at 1,168 marker loci, with large variation in the density of informative observations across the genome. Using studies in which primary allelotype information was available, we employed a likelihood-based approach with a formal chromosomal instability and selection model. The approach seeks direct evidence for preferential loss at each locus compared with nearby loci, accounts for heterogeneity across studies, and enables the direct comparison of candidate regions across the genome. Striking preferential loss was observed (in descending order of significance) in specific regions of chromosomes 7q, 16q, 13q, 17p, 8p, 21q, 3p, 18q, 2q, and 19p, as well as other regions, in many cases coinciding with previously identified candidate genes or known fragile sites. Many of these observations were not possible from any single LOH study, and our results suggest that many previously reported LOH results are not systematic or reproducible. Our approach provides a comparative framework for further investigation of regions exhibiting LOH and identifies broad genomic regions for which there exist few data.
Introduction
Breast cancer is among the most common incident cancers in the world (Parkin et al. 2001) and causes nearly 200,000 invasive cases and 40,000 deaths each year in the United States (American Cancer Society 2002). A number of inherited cancer syndromes have been identified that confer elevated breast cancer risk (Couch and Weber 1997), and two common highly penetrant dominant disease genes have been identified (Ellisen and Haber 1998; Buchholz et al. 1999). However, inherited susceptibility appears to account for a minority of cases (Couch and Weber 1997), and, in general, breast cancer is thought to be a complex, multifactorial disease resulting from an accumulation of multiple genetic alterations (Nathanson et al. 2001).
Loss of heterozygosity (LOH), the loss of a normal, functional allele at a heterozygous locus, is the most common type of somatic alteration found in primary human breast tumors (Callahan et al. 1993). Through testing of tumor and normal reference DNA at a series of polymorphic marker loci, numerous allelic analyses of breast cancer have demonstrated frequent LOH on chromosome arms 1p, 1q, 3p, 6q, 7q, 8p, 11p, 13q, 16q, 17p, 17q, 18q, and 22q (Lasko et al. 1991; Devilee and Cornelisse 1994; Callahan 1998). As articulated by Lasko et al. (1991) and mathematically formalized by Newton and colleagues (Newton et al. 1998; Newton and Lee 2000), consistent LOH in a genomic region implicates the presence of tumor-suppressor genes (TSGs) or other genes related to tumor pathogenesis. For ease of discussion, we will refer to a region of true excess loss as evidence for a TSG, although establishing causality must await further functional validation.
Despite the hundreds of LOH studies of breast cancer, the number and identity of TSGs relevant to this disease remain largely unknown (Devilee et al. 2001), with most studies examining a single genomic region with limited resolution. The literature lacks a standard nomenclature, with various terms (e.g., “allelic imbalance,” “allelic loss,” and “LOH”) used essentially equivalently. The analysis of such data is further complicated by the widely varying criteria used to declare LOH. For example, in electrophoretic allele typing, a decrease in allele intensity of at least 50% in tumor versus normal DNA has been used (Gaki et al. 2000), as has a difference in the allele intensity ratio of ⩾20% (Kollias et al. 2000). Such quantitative distinctions belie the certainty with which LOH is often described. In addition, most LOH studies of breast cancer provide limited or no specification of tumor stage or histology, presenting an additional challenge in comparing across studies. For all of these reasons, previous summaries of LOH in breast cancer have been largely qualitative, consisting of descriptions of chromosomal arms or regions reported frequently lost (Lasko et al. 1991; Couch and Weber 1997). The resolution of these summaries typically is low, and it is not obvious how to carefully rank the evidence in different chromosomal regions. Furthermore, without a framework for carefully comparing deletion rates, such descriptions may be prone to publication bias. As we demonstrate below, the extent of the published LOH literature varies widely by chromosome, and regions containing known or suspected TSGs (e.g., BRCA1 [MIM 113705]) have been studied most extensively. Of particular concern are studies examining individual candidate genes—elevated LOH does not necessarily implicate a gene, since interstitial deletions containing a TSG can create a “bystander effect” of elevated LOH in broad regions. Such methodological difficulties have led some investigators to question the very foundations of LOH analysis (Tomlinson et al. 2002).
Other problems with traditional LOH analysis may be viewed as statistical, resulting from informal or overly optimistic interpretations of data that may otherwise be sound. In individual LOH studies, distinct regions of elevated loss are often reported without considering the effects of chance variation. For example, Kerangueven et al. (1997) reported five regions of LOH on chromosome 17, with an average of 30 informative samples and LOH proportions ranging from 0.23 to 0.47. Noviello et al. (1996) described four distinct regions of increased allelic loss on chromosome 6q, with LOH proportions in these regions ranging from 0.21 to 0.39 for most of the average 46 informative samples. Such variation cannot be distinguished from random binomial variation accompanying sporadic, nonspecific loss. As we shall see from the present data set (see the “Results” section), several chromosome arms show average loss proportions >0.30 without any clearly defined subregion of excess loss. Moreover, localization of regions of elevated LOH is usually performed informally, with qualitative descriptions of smallest commonly deleted regions or minimal overlapping loss (Nagai et al. 1995; Bieche et al. 1999). Such localization methods can be very misleading, since the occurrence of multiple TSGs or sporadic deletions in a broader region of elevated LOH can result in incorrect or optimistically narrow regions (Devilee et al. 2001).
A Model for Allelic Loss
Newton and colleagues (Newton et al. 1998; Newton and Lee 2000) have used a parametric “instability-selection” model to describe LOH data. The model assumes that loss (instability) is determined by a binary Markov process in precancerous tissue, followed by preferential tumor growth (selection of a cell lineage to become a clinically detectable tumor) if a lost segment contains a TSG. The presumed genetic mechanism involves LOH as either the first inactivating event in Knudson’s two-hit model (followed by mutation, methylation, or other inactivation of the remaining wild-type allele in the lineage) or as the second event, causing the removal of the remaining wild-type allele after one allele has been inactivated (Devilee et al. 2001). Other LOH mechanisms have been described (Newsham et al. 1997), and the likely sequence of LOH/mutation events remains controversial (Wilentz et al. 2001). Indeed, a second event may be unnecessary for TSGs exhibiting haploinsufficiency (Kwabi-Addo et al. 2001). Nonetheless, it is widely presumed that regions of consistently high LOH are functionally important in tumorigenesis. The Newton model can be used to test for the presence of a TSG via a likelihood ratio and resulting LOD score, in a manner similar to linkage analysis. The approach is attractive because it provides an explicit framework for testing and inference. The model also clarifies that the hallmark of a TSG should be preferential loss in a region of a chromosome, compared with sporadic loss at other regions. To fully exploit the marker-to-marker correlation in LOH, the method requires use of the primary “allelotype” data (i.e., the loss/retention data for each locus and each tumor) rather than averaged summaries across the tumors. Such primary data is often not reported in studies of LOH or is reported incompletely (sometimes only for those samples showing the greatest average loss). A high proportion (∼50%) of genotyped LOH data may also be missing because of constitutive homozygous genotypes or impaired sample quality of resected tissue. Furthermore, combining evidence from multiple studies is complicated by biological and technical heterogeneity.
The Challenge
An illustration of the difficulties in analyzing such data is given in figure 1, which shows the proportion of LOH (among informative marker observations) for each of 47 studies on chromosome 17. The variation in loss rates across the studies and the incomplete chromosomal coverage of any one study presents an evident challenge in identifying regions of consistent and significant loss. For example, by examining a small interval, we can test whether the average loss rate appears to vary among studies. A simple goodness-of-fit test (Ott et al. 2000) for average loss proportions in the region 60–80 cM (heavily studied because it contains BRCA1) reveals significant heterogeneity across studies that have markers in the interval (χ234=158.6; P≪.00001). In regions covered by few studies, such heterogeneity is especially problematic, since it confounds any attempt to attribute an apparently high loss rate to the loss of a TSG. Although a gradient is apparent in figure 1, with 17pter showing higher average loss than 17qter, further conclusions are difficult to draw from casual inspection.
Figure 1.

LOH on chromosome 17 (47 studies). Each point represents the proportion LOH observed at a marker within a single study. Observations within the same study are connected by lines, with widths proportional to the average number of informative observations per marker for that study. A smoothed density plot of informative observations (above the scatterplot) shows that the data are concentrated at 17pter and the regions containing TP53 and BRCA1. Similar scatterplots for all chromosomes and accompanying citations are available as supplemental data.
To provide a comprehensive view of LOH in breast cancer and to evaluate the model-based evidence for TSGs, we set out to identify all such studies that reported at least portions of the data as allelotypes. At the time the data were gathered (in late 2001), a total of 151 studies were identified that met this inclusion criterion, published from 1989 to June of 2001. The interval spans technological improvements in marker genotyping from RFLPs to modern microsatellites and SNPs. The various terms used to describe allelic loss were standardized, and the data were manually recorded. The summary evidence based on average loss proportions was used to provide a rough description of LOH across the genome. We then applied a likelihood-ratio approach to the allelotype data, accounting for heterogeneity by adopting study-specific parameters. The resulting pooled analysis (similar to a meta-analysis, but using published data rather than summary statistics) highlights several small regions of striking preferential loss on the genome, while finding little evidence in other widely studied regions.
Material and Methods
Primary and Summary Data
Articles describing LOH in breast cancer were identified in Medline searches. The following search keywords were used: “chromosome deletion OR heterozygote OR allel$2 loss$2 OR deletion map$4 OR LOH OR loss of heterozygosity OR microsatellite repeat$” AND “breast neoplasms OR breast.” Here, “$” represented a wildcard in then-current Medline syntax. This search strategy initially yielded 1,178 articles. The abstracts of the resulting matches were used to identify a smaller number of articles likely to contain allelotype data, and review of these articles identified 151 studies meeting the inclusion criteria, representing ∼15,000 tumors. Only 19 of the studies spanned more than one chromosome. Table 1 summarizes the coverage of the genome and tumor samples studied; 52.3% of the studies (and 64.8% of the individual samples) contained no descriptions of tumor histology, and, among those samples with sufficient descriptions, the most common classifications were invasive ductal carcinoma (80.0%), invasive lobular carcinoma (7.8%), and (noninvasive) ductal carcinoma in situ (DCIS; 6.7%). Tumor histology was generally unavailable for individual samples within the allelotypes and thus could not be used for stratification or careful subgroup analysis. The six articles with >20% noninvasive carcinomas (DCIS) were analyzed separately, and all but two of the remaining articles reported <10% noninvasive cancers. The inclusion criteria favored studies of primary tumor samples, although one cell-line study met the criteria (Bieche et al. 1998). Exclusion of this study has essentially no effect on the results below. Detailed descriptions of the 151 studies are provided in table C1 of appendix C (online only) and on the authors' Web site; all the primary data compiled from these studies are also available on the authors' Web site. Several of the studies covered a chromosome with only a single marker, and for these the likelihood could not be calculated. Still others covered multiple chromosomes, so that the total number of informative chromosome studies was 164 for the invasive studies and 8 for the noninvasive studies. There was considerable variation in the number of informative observations across the chromosomes (table 1) and across studies.
Table 1.
Summary of LOH Articles Compiled in the Database[Note]
|
No. of |
||||
| Chromosome | IndividualStudies | UniqueMarkers | Tumor Samples (Allelotypes) | InformativeObservations(AllelotypeObservations)per Mb |
| 1 | 21 | 133 | 1,268 (455) | 24.3 (15.0) |
| 2 | 9 | 23 | 179 (94) | 3.3 (1.3) |
| 3 | 15 | 70 | 853 (192) | 19.3 (6.2) |
| 4 | 5 | 24 | 56 (70) | 3.2 (5.2) |
| 5 | 5 | 22 | 34 (31) | .9 (.5) |
| 6 | 13 | 92 | 1,164 (294) | 26.7 (15.4) |
| 7 | 12 | 70 | 717 (133) | 39.1 (7.8) |
| 8 | 17 | 85 | 957 (401) | 48.5 (23.8) |
| 9 | 11 | 55 | 579 (274) | 27.3 (10.1) |
| 10 | 11 | 41 | 330 (142) | 9.3 (3.6) |
| 11 | 27 | 100 | 3,156 (736) | 74.7 (24.6) |
| 12 | 4 | 10 | 19 (33) | .7 (.5) |
| 13 | 18 | 41 | 1,653 (346) | 34.4 (18.7) |
| 14 | 4 | 6 | 88 (76) | 2.3 (1.7) |
| 15 | 3 | 2 | 12 (0) | .4 (.0) |
| 16 | 22 | 106 | 1,851 (480) | 70.8 (37.5) |
| 17 | 47 | 150 | 4,966 (1,249) | 212.4 (65.2) |
| 18 | 9 | 43 | 767 (204) | 54.0 (13.2) |
| 19 | 5 | 9 | 75 (51) | 3.1 (1.2) |
| 20 | 4 | 4 | 18 (26) | 1.2 (.2) |
| 21 | 4 | 13 | 154 (18) | 22.3 (2.9) |
| 22 | 7 | 41 | 238 (72) | 3.4 (19.0) |
| X | 3 |
33 |
80 (40) |
4.3 (4.2) |
| Total | 151a | 1,173 | 15,417a (4,365a) | 26.8 (10.9) |
Note.— A detailed record of the 151 individual studies used in the pooled analysis is included in appendix C (online only).
Total adjusted so that studies testing a panel of tumors across more than one chromosome were counted only once.
Newton and Lee (2000) described genomic positions rescaled as equally spaced on the unit interval, while less formal LOH mapping efforts have often used the sex-averaged meiotic genetic map. The markers in our present studies were initially placed according to the Location Database (LDB) (2000 and 2001 builds; Genetic Epidemiology Group Web site) (Collins et al. 1996). Each locus in the LDB is assigned a composite genetic location based on available genetic and radiation hybrid data, and our likelihood computation based on the assignments appeared to be successful. It was recognized, however, that the draft assembly of the human genome had reached sufficient quality that we could use it to determine the physical position of the loci, thus greatly improving our ability to integrate maps and identify candidate tumor suppressors. A total of 1,168 unique markers were used in the studies, and, of these, 863 (73.9%) could be uniquely placed on the December 22, 2001 National Center for Biotechnology Information assembly (the most current when this step was performed). For the placement, we used a combination of STS placements from J. Kent (UCSC Genome Bioinformatics Home Page) and direct e-PCR mapping (Schuler 1997). The remaining 305 markers were mostly RFLPs without sufficient sequence information for direct genome placement, and for these we used the LDB. Approximate physical positions for the 305 markers were predicted by third-degree polynomial regression fits to the physical versus genetic location for each chromosome, through use of nearly 800 markers that could be placed on the draft assembly and also appeared in the LDB.
The primary allelotype data was recorded for each study, representing >4,300 tumor samples. Five categories were used to classify the allelic status at each marker. Table A (online only) outlines the system of classification. Most studies also reported overall allelic loss (per informative observation) for all of the markers. These data are distinct from summaries based on the reported allelotypes, since many studies report average loss for all tumor samples but report allelotypes for only a portion of the tumors (hence, 15,000 tumors but only 4,300 allelotypes). Both the summaries and allelotypes are available as supplementary material on the authors' Web site.
Table A.
Classifying LOH Data
| Symbol | Category | Synonyms |
| G | Allelic gain | Amplification, duplication, gain in copy number, gain of signal intensity of one allele |
| H | Homozygous deletion | … |
| L | Loss of heterozygosity (LOH) | Allelic imbalancea, allelic loss, deleted, deletion in tumor DNA, informative and allelic imbalance, informative and LOH, loss, loss and gain, loss of signal-intensity of one allele, LOH + allele gain, LOH + MSI, LOH positive, LOH—wild-type allele is lost, positive LOH or staining, slight but reproducible LOH |
| M | Missing/not informative (includes markers intentionally not typed) | Allelic imbalancea, allele instability, genotype could not be determined, homozygosity, indeterminate, instability of the corresponding marker, intra-DNA fragment breakpoint, larger or smaller alleles, marginal imbalance, marker constitutionally homozygous, microsatellite instability, new allele, no amplification, no data, not determined, not done, noninformative, no result, not amplified, not available, not interpretable, not tested, PCR unsatisfactory, rearrangement, shift in allele size, uninformative, unsuccessfully tested, untested |
| R | Retention of heterozygosity (ROH) | Heterozygosity, heterozygous, heterozygous + MSI, informative and ROH, informative and unaffected, informative—no loss, intact region, LOH negative, maintain heterozygosity, negative LOH or staining, no allelic imbalance, no allelic loss, no change, no LOH, no loss, no mutation, not deleted, retained, retention of both alleles |
The term “allelic imbalance,” the observed change in allele signals in tumor relative to normal DNA, was used in a manner consistent with the definition of LOH in some studies and the definition of an uninformative sample in others, and is classified accordingly.
Allelotype data on homozygous deletions or markers with allelic gain (amplification) was not extensive enough to enable refined analysis of these categories. In the analyses that follow, the data was further grouped into three categories: “lost” (loss of heterozygosity or homozygous deletion), “retained” (retention of heterozygosity or allelic gain), or “missing” (missing/not informative/not typed). Any observation that was not missing was considered informative, and informative observations comprised 56.0% of the allelotype data. Only a few studies reported data across multiple chromosomes; to avoid excessive complication, we treated the data from each study on each chromosome independently. One study (Kollias et al. 2000) involved bilateral tumors, which were treated as independent observations.
The Likelihood Approach
The instability-selection model (Newton et al. 1998) supposes that breakpoints and loss occur on the chromosome, prior to clonal tumor growth, according to a random Markov process with specified transition rates between the states of “loss” and “no loss.” This assumption is similar to breakpoint assumptions used in linkage mapping (Ott 1999) and radiation hybrid mapping (Lange et al. 1995). If a lost segment includes a TSG, then the loss provides a selective growth advantage to the clonal population compared with the surrounding tissue. Together, these assumptions accord with our understanding of tumor growth resulting from loss of suppression (Lasko et al. 1991).
The application of this approach requires allelotype data. We provide here a basic description of the model and likelihood; detailed expositions are provided elsewhere (Newton et al. 1998; Newton and Lee 2000). A full specification of the model involves nonidentifiable parameters, including growth rates for tissue before and after loss of suppression. However, on the basis of the observable data, the likelihood for a single LOH study can be expressed in terms of four parameters: x*, the location of the TSG; δ, the background random loss rate of chromosomal segments; ω, the loss rate at the TSG; and λ, the breakpoint rate parameter prior to selection. The background loss δ is the loss rate prior to selection, due to differential growth of the clonal population; after selection, it is an asymptotic rate for genomic positions infinitely distant from the TSG. Under the null hypothesis, no tumor suppressor exists—that is, ω=δ. Under the alternative hypothesis, ω>δ. We provide the form of the likelihood in appendix A. Although the model simplifies complex biological processes (Devilee et al. 2001), it is a parsimonious model that captures essential features of the data, including inherent randomness of outcomes, loss rates that vary by genomic position, and positive correlation of loss events among nearby markers. Observations on the X chromosome were treated in the same manner as the autosomes, although, because of X inactivation in females (Strachan and Read 1999) (and therefore no second “hit” required), any observed excess loss would require careful biological interpretation.
The Profile LOD
We extend the instability-selection model in a manner appropriate to multiple studies, only some of which may show evidence for a TSG. For a single study i, we denote the set of allelotypes as datai and similarly use subscripts for the parameters δi, ωi, and λi. The use of such study-specific parameters accounts for heterogeneity that may arise from a variety of biological and technical sources. In contrast, x* is considered a fixed property of the TSG not depending on i.
Many studies report only a portion of the available allelotypes (Matsumoto et al. 1997; Utada et al. 2000), excluding those tumors that show little or no loss in the region under study. It is clear that the allelotypes for such studies inflate the apparent rates of loss in both the background and at the putative TSG. Thus, although selective reporting may produce potentially biased position estimates, our implementation of the instability-selection model protects against the most obvious bias by requiring that a region show excess loss compared with other markers on the same chromosome within the same study. We have also devised a nonparametric method (further described below) that uses all the summary data of loss across the markers, and the results from this approach agree very closely with the likelihood results.
For all of the above reasons, we examine the allelotype data within each study in a likelihood model for evidence that ωi>δi. At a given position x, we compute the LOD function for study i (in a manner familiar from linkage analysis) as
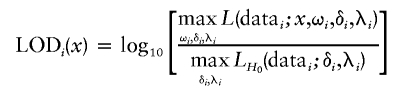 |
or LODi(x)=0 if  in the numerator. The numerator profiles over ωi, δi, and λi to evaluate at each position x the relative evidence for the parameter of interest x*, whereas the denominator does not depend on x. Maximizing over the parameters is relatively straightforward to perform numerically, and published S-Plus scripts (Newton and Lee 2000) can be used for a single study on one chromosome. However, we have found the software to converge too slowly to be practical for our purposes, and we have developed S-Plus functions that appear to converge more reliably and to evaluate the likelihood much faster (∼50–100 times). For a fixed x at an informative marker, the likelihood ratio is of a regular nested form (Cox and Hinkley 1974), and, under the null hypothesis,
  has a half-mass at 0 (because of the constraint ωi⩾δi) and half-mass approximately distributed as χ21. This approximation is the basis for approximate pointwise P values (i.e., at a fixed position x) and is somewhat conservative in intervals between markers.
Results from Multiple Studies
Evaluating the evidence for many studies on a single chromosome involves a simple extension of the above approach, applied to the M studies on the current chromosome. Denoting the vectors of parameters δ=(δ1,δ2,…,δM) and ω=(ω1,ω2,…,ωM), the global null hypothesis is that δ=ω, versus the alternative that at least one ωi>δi. Thus, a locus exhibiting excess loss in any of the studies is a TSG.
The resultant log-likelihood ratio is
 |
At a fixed informative marker x, the distributional approximation for each LODi gives the null approximation for LOD as proportional to a mixture of χ2 distributions with Y df, where Y is randomly drawn from Binomial (M, 1/2) and under the assumption of a point mass at 0 when Y=0. The approximation is conservative, since the LOD tends to be less extreme in genomic regions covered by few markers. Note that estimating such a large number of parameters can exact a heavy price in statistical power; however, we were primarily concerned with avoiding spurious “detection” of TSGs.
Display and Comparison
For a fixed x, the degrees of freedom in the null distribution of the LOD statistic depend on the number of studies M, which varies by chromosome. Thus, the LOD does not itself provide straightforward comparison of the results on different chromosomes. We therefore find it useful to use the distributional approximations for LOD at fixed x to compute a pointwise P value at each genomic position and display the results graphically as  .
.
In understanding the overall biology of tumor suppression, it is useful to be able to describe the relative “importance” or strength of LOH in different genomic regions. The LOD score and derived P values cannot serve directly in this capacity, since they depend on the sample size, whereas the estimated loss rate ωi is study-specific and should perhaps be considered in the context of differing background loss rates per chromosome. Although this work is preliminary, we describe two initial approaches to the problem. The first approach is to use the ratio between the maximum  statistic per chromosome arm and the number of informative observations as a rough indicator of the degree/importance of LOH (a so-called LOH “strength index”). A more formal approach is to use the ratios ωi/δi, which have an interpretation in terms of selection advantage in tumor growth (Newton and Lee 2000). Heterogeneity and incomplete chromosomal coverage of individual studies, however, complicate the interpretation of these ratios. We adopted a standard model from the meta-analysis literature (DerSimonian and Laird 1986), treating log(ωi/δi) as random effects drawn from a normal density with unknown overall chromosome-specific effect
  . The point estimates
  were obtained at the point of maximum
  for each chromosome, and approximate SEs were obtained as 1/4 of the length of a 95% support interval of the profile likelihood over the parameter space of each log(ωi/δi). These SEs were used in standard weighted averages (Thompson 1998) of the log(ωi/δi) to finally estimate log(ω/δ).
As a final check of potential position bias, we also employed a nonparametric positioning approach to the summarized data for all tumors (see the “Results” section) and found excellent agreement with the positions from the likelihood approach. Although the details are somewhat cumbersome (see appendix B), the idea behind the nonparametric procedure is quite simple. Within a study, the overall loss proportions at each marker were used to create a Z statistic for excess loss at each marker compared with other markers on the same chromosome. These scores were interpolated in the intervals between markers, and then a weighted average across multiple studies was computed.
Tests of Chromosomewide and Genomewide Significance
In this setting, asymptotic theory has not been established for excursions under H0 of the maximum LOD across a chromosome. Newton and Lee (2000) describe three approaches to the problem, using the Poisson clumping heuristic, parametric bootstrapping, or direct simulation of the LODi through use of the maximum-likelihood estimates for δi and λi. The direct simulation approach can be easily extended to a sum of independent LODs and, for our purposes, was initially the most attractive. We applied our software to the three sample data sets analyzed by the authors, reproducing their LODs and parameter estimates. The direct simulation P values under a dense-marker assumption were slightly smaller but never less than half of any of the P values obtained by Newton and Lee (2000) by use of Poisson clumping or bootstrapping. Thus, as a conservative approach, we obtained empirical chromosomewide P values that were twice that obtained from directly simulating 1,000 data sets for all of the studies on each chromosome. The procedure was computationally intensive, and we observed that a Bonferroni procedure applied to the P values from the grid of 200 LOD calculations per chromosome gave very similar results and, for some chromosomes, was even less conservative. For example, the median empirical threshold for a chromosomewide significance level of .05 was 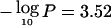 (range 2.73–4.16 across the chromosomes), compared with the Bonferroni threshold
  . Here, the grid density was not entirely arbitrary, being chosen to minimize computation while ensuring that meaningful variation in the LOD would not be overlooked.
Because the empirical procedure requires simplifying assumptions and was apparently not much less conservative than the Bonferroni thresholds, for simplicity, we present results based on the latter. However, either procedure identified the same regions as attaining chromosomewide significance, except for a minor conflict for chromosome 4q (see the “Results” section). Although we considered each chromosome worthy of independent consideration in hypothesis testing, it also is helpful to consider the corresponding genomewide threshold  .
.
Results
Average Loss
As an overall summary of LOH, we plotted the overall average loss rate for each chromosome arm, using all informative marker observations across the 118 studies for which the summary data were available for all tumor samples (fig. 2). For this analysis, we excluded the 33 articles that provided summary data on only a portion of the samples, since these studies appeared to exclude tumors showing little or no LOH. Although these latter studies are useful in the likelihood analyses below, they offer potentially biased estimates of average loss. Because of the large number of studies represented, figure 2 provides a concise quantitative summary of loss rates that have previously been available only as rough qualitative comparisons (Couch and Weber 1997). LOH proportions are presented using symbols with area proportional to the number of informative observations. Many of the chromosomal arms with high loss rates also have the greatest number of observations, because regions initially reported to have high rates of loss were re-examined by subsequent investigators. The data support reports that 17p and 16q have among the highest loss rates (White et al. 1996; Shen et al. 2000). However, it is notable that many chromosome arms described by some as having high rates of loss (e.g., 1p and 11p) (Lasko et al. 1991; Devilee and Cornelisse 1994) are not exceptional compared with the overall average LOH proportion of 0.318.
Figure 2.

Average LOH proportion per chromosome arm in 118 studies. The area of each circle is proportional to the total number of informative marker observations on that arm across all studies. The global average LOH proportion of 0.318 is shown as a dotted line.
To illustrate the likelihood approach to mapping TSGs, an example allelotype and resulting single-study LOD is given in figure 3A and 3B, from the study by Bieche et al. (1993) on chromosome 1. From the authors’ data, it is apparent that there is more evidence for excess loss on 1p than 1q. However, the maximum LOD of 0.82 corresponds (by the simulation method described above) to a chromosomewide P value of 0.65, and the data are not extensive enough to support the authors’ conclusion that multiple distinct TSGs reside on 1p. The data do appear to show distinct loss of entire arms or interstitial deletions rather than a completely random pattern of loss, a common feature of LOH data that is explicitly incorporated in the model.
Figure 3.

A, Allelotype data on chromosome 1 from Bieche et al. (1999). Blackened circles represent LOH, unblackened circles represent retention of heterozygosity, and dots represent noninformative observations. The X-axis of the allelotype data is aligned with the marker positions. B, Resulting LOD scores.
Computing the LOD scores for the individual studies was straightforward, and the initial likelihood computation and the nonparametric procedure were performed using the LDB map. Comparison of the relative positions of the maximum LOD versus the maximum nonparametric statistic (which used all summary data) revealed good agreement for the 14 chromosomes showing significant evidence of excess loss in the original LDB map (fig. 4; r=0.98) and thus little evidence of substantial position bias through the use of allelotypes. The greatest disagreements were for chromosomes 8 and 18. Manual review of the results suggested occasional difficulties in the interpolation used in the nonparametric procedure. This was especially pronounced for chromosome 8, where the nonparametric procedure did give a large secondary peak near the maximum-likelihood position. We adopted the likelihood procedure for all subsequent computations, because of its greater interpretability.
Figure 4.

Relative position estimates for the maximum-likelihood statistic versus the maximum nonparametric statistics under the LDB genetic map. The relative positions (expressed as a proportion of the chromosome length) are presented for the 14 chromosomes with significant chromosomewide LOD evidence. Subsequent likelihood results differ somewhat, since they are based on physical genomic position.
Once the integrated physical marker map was created, the likelihood computations were performed again, with some examination necessary to detect convergence failures that appeared in four of the studies (observable as sharp likelihood discontinuities or implausible LOD evidence compared with the number of informative observations). For these studies, the LODs could be apparently properly computed by changing the parameter starting conditions or computing the LOD in reverse (qter to pter), and removal of these studies did not appreciably change the results. A study of chromosome 22 (Castells et al. 2000) repeatedly failed to converge, possibly because of small distances between markers showing markedly different loss profiles (which can lead to difficulty in estimation of λ). Thus, in contrast to the results for the other chromosomes, the results for chromosome 22 are based on genetic distance, as judged by the LDB, and then are linearly rescaled to correspond to physical position. Again, removal of this study does not affect our major conclusions.
Model-Based Evidence across the Genome
Figure 5 shows the evidence for preferential LOH across the genome, using the common statistic  , where P is the pointwise P value for the overall summed LOD, as described in the “Material and Methods” section. Several regions show striking evidence of preferential loss, with P<10-8 in 7 regions and P<10-5 in 12 regions. Regions with
 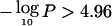 are significant at the .05 level in a genome scan. Chromosomes 7q, 16q, 13q, 17p, 8p, 21q, 3p, 18q, 2q, and 19p achieve this threshold (table 2), and their significance was confirmed using the empirical simulation-based approaches described above. In addition, regions on 18p, 17p, 9p, 3p, 6q, and 1p exceeded the chromosomewide threshold
 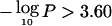 (we also list 4q because the chromosomewide simulation P value was .046). The dashed lines for chromosomes 8, 9, 10, 16, and 17 represent the
  scores from the few studies that were known to have >20% noninvasive cases (almost exclusively DCIS).
Figure 5.

Evidence for preferential LOH across the genome, expressed as 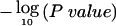 derived from the LOD scores. Striking preferential loss occurs in defined regions on several chromosomes. Gray horizontal lines show the chromosomewide significance threshold. The dashed curves on certain chromosomes correspond to studies with a substantial proportion of noninvasive tumors. Chromosomes 12, 15, and 20 had too few informative observations to fit the model, owing to purely technical aspects in maximizing the likelihood. Other chromosomes (in particular 5 and 14, see table 1) had few observations, and the relative lack of evidence should be interpreted with caution. Centromeres are indicated by black dots.
Table 2.
Regions of Elevated LOH, Listed in Descending Order of Evidence
| Chromosome |  |
Chromosomewide P | Position(Mb) | 3-LODSupportInterval(Mb) | Candidate TSG(s)(Position in Mb) |
| 7q31.2 (FRA7G) | 17.76 | <.0001 | 116.3 | 115.7–119.0 | TES (116.2), CAV1 (116.5), ST7 (MET region) (117.0) |
| 16q24.3 | 11.66 | <.0001 | 91.9 | 90.3–94.3 | CDH13 (88.5), CBFA2T3 (92.5), CDH15 (92.7), FANCA (93.2) |
| 13q14.11 | 11.06 | <.0001 | 39.1 | 38.8–42.1 | BRCA2 (38.2), AS3 (38.5) |
| 17p13.3 | 10.45 | <.0001 | .8 | 0–1.5 | ABR (.8), OVCA1 (1.7), HIC1 (1.7) |
| 16q22.1 (FRA16B) | 9.61 | <.0001 | 70.0 | 69.4–72.2 | CDH3 (71.3), CDH1 (71.5) |
| 8p21.3 | 9.41 | <.0001 | 19.7 | 18.5–23.0 | N33 (15.6), PDGFRL (17.8), LZTS1 (18.6), FGF17 (20.4), DBC2 (23.2) |
| 21q11.1 | 9.00 | <.0001 | 16.5 | 15.5–18.8 | BTG3 (15.6) |
| 3p14.2 (FRA3B) | 7.92 | <.0001 | 61.5 | 59.3–63.6 | FHIT (63.5) |
| 18q21.2 | 7.31 | <.0001 | 53.2 | 51.7–54.8 | DPC4 (51.1), DCC (53.3) |
| 2q22.1 | 7.29 | <.0001 | 136.3 | 134.5–137.7 | FLJ11857 (135.5), LRP1B (138.5) |
| 19p13.3 | 7.29 | <.0001 | 6.2 | 4.6–6.9 | SAFB (7.6) |
| 16q24.1 (noninvasive, FRA16D) | 5.66 | .0004 | 83.0 | 72.9–89.8 | WWOX (83.9) |
| 18p11.32 | 4.86 | .003 | 1.9 | 0–3.0 | DAL1/EPBB41L3 (5.8) |
| 17p13.2 (noninvasive) | 4.81 | .003 | 4.6 | 0–22.8 | TP53 (8.0), MAP2K4 (13.6) |
| 9p21.3 | 4.58 | .005 | 26.6 | 26.2–27.5 | CDKN2A/p16 (23.8), IFNA4 (24.5) |
| 3p24.1 | 4.11 | .016 | 32.8 | 22.1–40.4 | TGFBR2 (32.6) |
| 6q25.1 | 3.92 | .024 | 156.9 | 151.8–170.3 | ESR1 (159.3), IGF2R (167.3) |
| 1p36.3 | 3.77 | .034 | 1.3 | 0–10.5 | SKI (1.5), TP73 (3.5) |
| 4q35.1 | 3.59 | .052 | 185.6 | 182.9–189.2 | FAT (187.6) |
There is not a clear correspondence between the LOD evidence and the average loss rate on the chromosome arm (fig. 2). For example, 7q shows strong evidence for a TSG but an average loss rate of only 0.19, whereas 11q has relatively modest evidence for TSGs but an above-average loss rate. It is important to note that our approach searches for evidence of a single region of excess loss per chromosome, and a high background loss rate or the contribution of multiple TSGs would make it difficult to detect TSGs.
Support intervals of 3 LOD units (table 2) provide some guidance for the regions likely to contain TSGs and are intentionally conservative to account for uncertainties in the draft genome assembly. Candidate TSGs in the regions are listed on the basis of a review of the literature and the primary LOH studies themselves. The lists are not intended to be exhaustive, since the resolution of LOH mapping is limited and numerous additional genes may have antiproliferative properties (e.g., Online Mendelian Inheritance in Man gives 419 entries for “tumor suppressor,” although many of these are redundant or have modest supporting evidence). The positions of a number of additional genes are also plotted in figure 5. The plotted genes include the candidates in table 2, genes listed by Couch and Weber (1997) as being involved in hereditary syndromic breast cancers, and the 29 confirmed tumor suppressors discussed by Futreal et al. (2001). We discuss in some detail the regions that have been widely reported by others, which often correspond to our regions showing greatest evidence. Other regions are discussed in less detail, with simple lists of possible TSG candidates.
The greatest evidence of elevated LOH is at the fragile 7G region of chromosome 7q31.2 ( ) at 116.3 Mb, in the vicinity of CAV1 (MIM 601047) (Osborne and Hamshere 2000; Fiucci et al. 2002) and ST7 (MIM 600833), earlier reported to have suppressor activity (Zenklusen et al. 2001). The role of ST7 has been recently questioned (Brown et al. 2002; Dong and Sidransky 2002), but our results nonetheless emphasize the importance of a putative TSG in the immediate vicinity.
Strong evidence ( ) was also observed on 16q24.3 at 91.9 Mb, one of two regions on 16q discussed by other researchers (Callen et al. 2002). The region contains several promising candidates, including the cadherins CDH13 (MIM 601364) (Toyooka et al. 2001) and CDH15 (Kremmidiotis et al. 1998). Previously, however, Kremmidiotis et al. (1998) had reported that CDH13 appeared to be centromeric of the LOH peak, which is consistent with our findings. Nearby is the putative TSG CBFA2T3 (MIM 603870), with reduced expression in breast tissue (Kochetkova et al. 2002). CBFA2T3 was one of three genes reported as showing wide variability in expression in breast cancer cell lines (Powell et al. 2002) (the others were CYBA [MIM 233690] and UniGene cluster Hs.7970). Also in the region is FANCA (MIM 607139) of the Fanconi anemia complementation group, thought to be associated with chromosomal instability and DNA repair (Bogliolo et al. 2002).
The other major peak is at 16q22.1, near CDH1 (E-cadherin [MIM 192090]) and CDH3 (MIM 114021), with 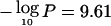 at 70.0 Mb (Cleton-Jansen et al. 1994; Osborne and Hamshere 2000; Chalmers et al. 2001). The CDH1 protein has been shown to be lost/reduced in breast cancer (Becker et al. 2002). The FRA16B 33-bp expansion (Hsu and Wang 2002) was directly placed using BLAT (UCSC Genome Browser, available from the UCSC Genome Bioinformatics Home Page) and appears to be centromeric of the peak. Finally, a potential third region of loss is at 16q24.1, largely because of a single noninvasive study (Chen et al. 1996). Our LOD interval procedure suggests that this region may be distinct from the other two, and, notably, the LOD peak coincides almost exactly with WWOX/FRA16D (MIM 605131) (Driouch et al. 1997; Bednarek et al. 2001).
Chromosome 13q14 shows a broad region of elevated loss (maximum 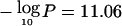 at 39.1 Mb), unlike the other most significant regions, perhaps suggesting the presence of multiple TSGs. The immediate interval around the peak does not contain obvious candidates, but BRCA2 (MIM 600185) (Kerangueven et al. 1995; Forsti et al. 2001) lies in the broader region. In contrast, the other major breast cancer susceptibility locus, BRCA1 (17q), exhibits only minor evidence of preferential loss (fig. 3). Also in the broad region is AS3 (MIM 605333), reported to regulate androgen-induced proliferative arrest in prostate cells (Geck et al. 1999). It has been reported that D13S171, used as a marker of instability in BRCA2, actually lies in AS3 (Geck et al. 2001), and we have confirmed this in recent genome drafts. A second LOD peak on 13q near RB1 (MIM 180200) is of uncertain significance. The 13q21 region reported as having evidence of linkage and somatic loss by Kainu et al. (2000) ranges from 62.8 Mb to 75.9 Mb and thus appears to be telomeric to our LOH evidence. The results by Kainu et al. (2000) were confined to Scandinavian families, and no linkage was found among western European families with breast cancer in a recent study (Thompson et al. 2002).
Chromosome 17p13.3 achieved similar significance ( at 0.8 Mb), almost at 17pter. The location coincides with ABR (MIM 600365), which may be involved in chromosome rearrangements (Chen et al. 1998). HIC1 (MIM 603825) (Guerardel et al. 2001) is nearby, as is DPH2L1 (or “OVCA1” [MIM 603527]), which has a potential role in ovarian and breast cancer (Phillips et al. 1996; Bruening et al. 1999; Salicioni et al. 2000), but these genes may be centromeric of our interval. Our findings are consistent with studies that have found the greatest evidence for LOH on chromosome 17, telomeric to TP53 (MIM 191170) (Seitz et al. 2001). Further study is necessary to assess whether the secondary peak at TP53 (fig. 5) is indeed distinct. In the noninvasive studies, a smaller and broader peak on 17p may include TP53 and MAP2K4 (MIM 601335) (Murphy et al. 2002), but it is not clear that the peak is distinct from that of invasive cancers.
8p21.3 has the next most striking evidence, with  at 19.7 Mb. N33 (MIM 601385) (MacGrogan et al. 1996) and PDGFRL (MIM 604584) (Komiya et al. 1997) appear to be telomeric of the peak, whereas LZTS1 (MIM 606551) (Cabeza-Arvelaiz et al. 2001) and FGF17 (Calvo et al. 2000) are possible candidates, although the latter may cause proliferation rather than suppression. RHOBTB2 (or “DBC2” [MIM 607352]) (Hamaguchi et al. 2002) seems to be centromeric of our peak. Hamaguchi et al. (2002) present functional evidence for RHOBTB2 as a TSG, but deletion analysis was performed for relatively few samples (six cell lines), and further study of the region may be necessary. Tumor necrosis superfamily members TNFRSF10A (MIM 603611) and TNFRSF10B (MIM 603612) also lie centromeric of our interval. It is intriguing that 8p21 is another region implicated in nonsyndromic hereditary breast cancer (Seitz et al. 1997; Adelaide et al. 1998).
The peak at 3p14.2 ( at 61.5 Mb) occurs very near the fragile site FRA3B, associated with FHIT (MIM 601153) (Rassool et al. 1996; Le Beau et al. 1998; Huiping et al. 2000). FHIT appears to be centromeric of the interval, a result somewhat consistent with previous observations (Maitra et al. 2001), although we do not exclude it as a candidate. MLH1 (MIM 120436) (Benachenhou et al. 1999) is clearly telomeric of the interval, and a minor peak occurs at TGFBR2 (MIM 190182) (Lucke et al. 2001), with
  at 32.8 Mb.
Chromosome 21q11.1 has a peak  of 9.00 at 16.5 Mb, near BTG3 (MIM 605674) (Matsuda et al. 2001) We do not find this or other candidates in the region to be compelling. The peak at chromosome 18q21.2 (
 ) is strikingly near DCC (MIM 120470) (Devilee et al. 1991; Ho et al. 1999), whereas MADH4 (MIM 600993) (Hahn et al. 1996) appears to be centromeric of the interval. The sharp likelihood peak at 2q22.1 (based on few studies) coincides with the hypothetical protein FLJ11857, which is mentioned because the gene may have sequence similarity with LRRC2 (MIM 607180) (Kiss et al. 2002), itself occurring at a minor peak on 3p (fig. 4). LRP1B (Liu et al. 2000) appears to be telomeric of the peak. Similar evidence is on 19p13, near SAFB (MIM 602895) (Oesterreich et al. 2001). The peak at 18p11.32 is near EPB41L3 (MIM 605331) (Tran et al. 1999). Other, less striking peaks include 9p21.3 (CDKN2A/p16 [MIM 600160] and IFNA4 [MIM 147564]) (Olopade et al. 1992; Milde-Langosch et al. 2001), 6q25.1 (ESR1 [MIM 133430] and IGF2R [MIM 147280]) (Murphy et al. 1996; Chen et al. 2002), 1p36.3 (SKI [MIM 164780] and TP73 [MIM 601990]) (Shinagawa et al. 2001; Stiewe and Putzer 2002), and 4q35.1 (FAT [MIM 600976]) (Mahoney et al. 1991).
Relative Strength of Elevated LOH
Figure 6A shows the relationship between the maximum  on each chromosome arm and the total number of informative marker observations per arm. It is apparent that 1p and 17q exhibit very modest evidence for tumor suppressors compared with the extensive study devoted to these regions. 7q achieves strong evidence with relatively few observations, owing to a small background loss rate, against which the excess loss in 7q31.2 is dramatic. The regions on 21q, 19p, and 2q appear especially strong in light of comparatively few observations. Figure 6B compares our rough strength index (the ratio of Y vs. X coordinates from fig. 6A) to the model-based estimate of log(ω/δ) described in the “Material and Methods” section. For either approach, the regions on 19 and 21 appear to be the most striking. There is reasonable agreement between the crude and model-based approaches, with rank correlation coefficient 0.86.
Figure 6.

The degree of preferential loss varies on the genome. A, Maximum  observed on each chromosome arm versus informative observations for that arm (arms with
  and <500 informative observations are not labeled). The horizontal lines show the chromosomewide significance threshold. Despite extensive study, arms such as 17q, 1p, 6q, 11p, and 11q exhibit modest evidence for preferential loss. Chromosome arms 21q, 19p, and 2q show striking evidence based on relatively few observations and deserve further study. B, For each chromosome, the estimated effect according to the instability selection model accounting for population heterogeneity versus a simple “strength index,” defined as
  /(informative observations) for the chromosome (both axes on natural log scale). Several chromosomes (5, 12, 15, and 20) had too few observations for reliable estimates.
Discussion
We have described the evidence for regions of elevated LOH in breast cancer across the human genome, using a likelihood-based approach designed to conservatively handle the daunting issues of biological and technical heterogeneity and incomplete marker coverage of individual studies. We emphasize that our approach is designed to look for evidence of preferential loss within a chromosome and is not sensitive to elevated loss over entire chromosomes, for which other approaches, such as permutation procedures, may be appropriate (Newton et al. 1998). It will also be difficult to resolve multiple nearby TSGs on the same chromosome without more fine-scale coverage, although regions such as 16q22 and 16q24 appear to be clearly discernible. LOH analysis cannot discern amplification/increases in DNA copy number, and newer technologies of comparative genomic hybridization (CGH), in concert with gene expression analysis, may help identify regions involved in carcinogenesis (Pollack et al. 2002). While embracing such technologies, it is also important to learn as much as possible from existing data, and we have attempted to perform meaningful inference on data collected over 12 years from numerous investigators. In a summary of the difficulties of performing LOH analysis to map TSGs, Devilee et al. (2001) concluded that finding TSGs might require “brute force” approaches, presumably involving analysis of many tumors. Our pooled analysis represents one such approach. We find the difficulty in performing LOH analysis in heterogeneous cancers to be reminiscent of complex-trait linkage analysis, in which the identification of the involved genes has proven more difficult than hoped (Sham 2001). Similarly, the focus for breast cancer LOH analysis should perhaps shift from immediately identifying the supposed TSG to clearly establishing that excess LOH indeed exists in the region. In any case, identifying a unique TSG may be difficult, even in a region of proven excess loss, as is exemplified by the current controversy surrounding ST7 as a putative TSG at 7q31 (Zenklusen et al. 2001; Brown et al. 2002; Dong and Sidransky 2002).
Despite these challenges, our results are surprisingly clear in their support of excess LOH in several regions, with very modest evidence in other regions. An example of the latter is 11q, although certain subgroups may show excess loss (Gentile et al. 2001). The data suggest that regions on chromosomes 19 and 21 are deserving of further investigation, whereas no conclusions can be made for other regions, including the entire chromosomes 12, 15, and 20. Some features are immediately apparent in figure 5 that have only recently been noticed by other researchers—for example, that TP53 shows only a minor peak and that the greatest evidence for a TSG is further telomeric on 17p (Seitz et al. 2001). The evidence for excess LOH at BRCA1 is not compelling, whereas, at/near BRCA2, the evidence is strong. We emphasize that the lack of excess LOH in these (mostly sporadic) breast cancers does not preclude LOH as a feature in hereditary breast cancer (Bell et al. 2002). The distinct peaks on 16q are also heartening, since recent progress has been made in dissecting these regions of LOH (Callen et al. 2002). The coincidental location of excess loss on 8p21 with a putative hereditary breast cancer gene (Seitz et al. 1997) may support the possibility of combined linkage/LOH studies to identify the putative TSG.
In general, genes causing inherited rare syndromic breast cancer susceptibility were not in regions of substantially elevated loss. We have described the comparative lack of evidence at TP53 (Li-Fraumeni syndrome [MIM 151623]; 17p13), and the peaks at PTEN (MIM 601728) (Cowden disease [MIM 158350]; 10q23) and ATM (MIM 208900) (ataxia-telangiectasia; 11q22) are also relatively modest. MLH1 (hereditary nonpolyposis colorectal cancer [MIM 120436]; 3p21) shows elevated loss but is telomeric to the high peak on 3p14, and STK11 (MIM 602216) (Peutz-Jeghers syndrome [MIM 175200]) is telomeric to the region of elevated loss on 19p13.
We also examined the location of genes described in a recent review by Kolodner et al. (2002) as mutated in human cancer susceptibility syndromes and having yeast homologs involved in cell checkpoints and genome stability. Of eight such genes, only WRN (MIM 604611) (Werner syndrome [MIM 277700]; 8p12) resides in a region of substantial preferential loss and is clearly centromeric to the 8p21 peak. We did not find compelling homologs of other yeast checkpoint genes, but several human homologs reside on chromosome 15, which has few LOH data. Although yeast is an important model for investigations of genome stability and spontaneous rearrangements, the connection with LOH in human breast cancer remains uncertain.
One surprising finding is the concordance of common fragile sites with regions of excess LOH. Of five fragile sites described in a recent review (Huebner and Croce 2001) as possibly related to cancer, three (FRA3B, FRA7G, and FRA16D) are at or very near peaks in our LOD score. Of the remaining two, FRA7H may show a bystander effect of elevated LOH due to loss at FRA7G, whereas FRAXB has been implicated mostly in cell lines (Smith et al. 1998; Arlt et al. 2002). In this context, the peak at ABR (active breakpoint cluster-related) at 17pter is intriguing. The results are not entirely unexpected, since roughly coincidental positions of fragile sites and translocations have been suggested (Yunis and Soreng 1984). However, we have not found much concordance of excess LOH with more recent summaries of chromosomal rearrangements in neoplasia (Mitelman 2000), and the proliferation of reported regions of breast cancer LOH over the years has made it difficult to sift through the evidence in a systematic manner.
A possible technical difficulty is that current approaches for detecting LOH can be sensitive to other sources of allelic imbalance, including amplification (Devilee et al. 2001). Shen et al. (2000) present arguments that, for their extensive data, this did not appear to be a concern. We also compared our results with those of Richard et al. (2000), who performed CGH on 105 breast tumors. The CGH results are at lower resolution, but we found broad agreement in that either the ductal or lobular carcinomas showed evidence of loss in the regions we identified. An exception is 19p, which they find to be a region of amplification (Richard et al. 2000). Several other regions of loss highlighted in the CGH data are not reflected in our results, perhaps reflecting elevated but nonspecific broad regions of LOH.
In contrast to our compiled LOH data, catalogs of chromosomal aberrations, such as the Mitelman database (Mitelman Database of Chromosome Aberrations in Cancer Web site), may describe multiple cytogenetic abnormalities per patient/tumor, as do genomewide approaches such as CGH (Kallioniemi et al. 1992). These techniques enable the exploration of correlated patterns of losses and gains, potentially giving clues to the timeline or causality of aberration events (Desper et al. 1999). The resolution of LOH-based mapping (or array-based CGH), however, is typically much greater and may enable such causal exploration if entire genome scans are performed for all tumors in a study.
One sobering conclusion from the present study is that a single large LOH study could have provided much of the same information, provided sufficient tumor material was available. Relatively few markers were examined in most of the compiled studies, so that the 15,000 tumors resulted in just 83,000 informative marker observations. Thus, a single study involving 415 tumors on a standard 400-marker panel would be crudely equivalent to our entire database (assuming that only half of the marker observations were informative). Such a study would likely have inferior resolution in currently well-studied regions (e.g., 17p) but would offer important new information in numerous other regions of the genome and enable the correlation of loss events across the genome. Moreover, many of the technical issues of heterogeneity and differing LOH criteria would not arise in the analysis of a single large study. The ambitious effort by Shen et al. (2000) is a step in this direction; they examined 100 laser-capture microdissected tumor samples at 400 markers (the article did not contain primary data and so did not meet our inclusion criteria).
In our analysis, we have attempted to extract simple conclusions from disparate and heterogeneous data. The same approach could be used to analyze data for numerous other cancers for which considerable LOH data have been published, including cancers of the lung, kidney, prostate, colon, and skin. Continuing improvements in the draft human genome may enable refinements in TSG support intervals (as in table 2) to perhaps 1–2 Mb and may help resolve some controversies over the supporting evidence for candidate TSGs. For CGH array data, an obvious further extension of the likelihood model would include regions of amplification in a similar manner as regions of loss. In addition, the combined analysis of gene expression and changes in DNA copy number (Pollack et al. 2002) may provide additional clues to identify genes involved in carcinogenesis.
Acknowledgments
We thank Paula Gregory for coordinating the Cancer Research Summer Internship Program for Ohio State University medical students, as well as Anthony Jakubisin, Tiffany Kirila, Bin Li, and Andrew Sterrett for assistance. Two anonymous reviewers provided valuable suggestions. This study was supported in part by National Institutes of Health grant GM58934.
Appendix A: The Instability-Selection Likelihood
For a single study and tumor j, we use Sj(x) to indicate the loss of heterozygosity at position x, or
 |
For ordered positions x*<x1<x2 and prior to selection, a consequence of the sporadic random loss model of chromosomal segments is that Sj(x) is a Markov process, with transition probabilities at the loci
We use sj(xk) to denote a realized loss value at the kth marker (k=1,…,K) of tumor j, and the likelihood for the entire process is
 |
Even after selection has occurred, computing the likelihood within each tumor is straightforward by the Markov process after conditioning on the loss event at x*, which has marginal probability  . Positions to the left of x* follow an identically distributed process in the opposite direction. Noninformative marker observations are considered missing at random and involve simply skipping the missing marker in computing the likelihood contribution of an individual tumor. Further details are available from Newton and Lee (2000).
Appendix B: A Nonparametric Procedure for Identifying Preferential Loss
In examining the data from numerous studies, it is helpful to have a procedure to scan for evidence of preferential loss without the need to rely on a specific model. We devised such an approach through use of the loss proportions (loss divided by total informative observations) at each marker compared with other markers on the chromosome in the same study. For each marker, the simple statistic for comparing binomial proportions can be computed as
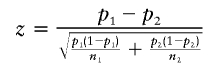 |
where p1 is the observed loss proportion at the current marker, p2 is the loss proportion at all remaining markers on the chromosome in the study, and n1 and n2 are the respective numbers of informative observations. Under the null hypothesis that the true LOH does not vary on the chromosome, and if the markers are uncorrelated, z∼.N(0,1) at each marker. Note that, in practice, the statistic is conservative, because positive correlation in loss (induced by deletions of chromosome segments) results in overestimation of Var(p1-p2) in the denominator. We further devised a means for summarizing the evidence at each position across all studies. Although the details (below) are somewhat cumbersome, the key features are that the statistic is computed over the range of markers within each study, and a weighted sum over multiple studies provides a single summary. A conservative test for chromosomewide significance can be applied, using random permutations of data within each study.
We use Ri to denote the range of markers in study i, and the Z statistic defined above for each marker is linearly interpolated across successive markers to create a statistic Zi(x) for each position x∈Ri, with Zi(x)≡0 elsewhere. A summary statistic across the studies is computed as  , where Wi is a weighting function and I[A] denotes the indicator for event A. The weights are based on βi, the mean number of informative tumors per marker in study i, and are scaled as
  . The use of the indicator ensures that T cannot be negative and reflects that we do not consider Zi(x)<0 from study i to be meaningful countervailing evidence against preferential loss in, say, another study at the same position. A pointwise P value is easily obtained numerically using the half-normal approximation for each of the components in the sum. The location of the minimum pointwise P values were used to obtain TSG location estimates on each chromosome.
Although not necessary for our study, a test of chromosomewide significance for T can be performed by permuting, for each study and each chromosome, the loss observations across all informative marker observations on that chromosome and computing max(T) for each permutation. The proportion of the empirical max(T) values exceeding the observed value form an empirical P value. This P value is conservative (sometimes highly so), since, even in the absence of a tumor suppressor, deletions of interstitial regions or entire arms produce positive correlation in loss events. The permutation samples eliminate this correlation, producing higher excursions of the T statistic.
Appendix C
Table C1.
151 LOH Articles, with Brief Descriptions and Organized by Chromosome
| Author | Journal | Year | ChromosomeStudieda | No. ofTumor Samples | No. ofUnique Markers | Tumor Histologyb |
| Bieche et al. | Genes Chromosomes Cancer | 1999 | 1 | 96 | 31 | Information not available |
| Bieche et al. | Oncol Rep | 1998 | 1 | 10 | 36 | Information not available (cell lines) |
| Bieche et al. | Clin Cancer Res | 1995 | 1 | 124 | 17 | Information not available |
| Bieche et al. | Cancer Res | 1993 | 1 | 74 | 27 | Information not available |
| Borg et al. | Genes Chromosomes Cancer | 1992 | 1 | 124 | 3 | Information not available |
| Chen et al. | Proc Natl Acad Sci USA | 1989 | 1 | 48 | 6 | 43 (89.6%) intraductal, 3 (6.3%) metastatic effusions, 1 (2.1%) mucinous, 1 (2.1%) inflammatory |
| Gaki et al. | Eur J Surg Oncol | 2000 | 1 | 50 | 16 | 46 (92.0%) IDC, 4 (8.0%) ILC |
| Genuardi et al. | Am J Hum Genet | 1989 | 1 | 37 | 5 | 37 (100%) IDC |
| Hoggard et al. | Genomics | 1995 | 1 | 23 | 24 | Information not available |
| Loupart et al. | Genes Chromosomes Cancer | 1995 | 1 | 71 | 15 | Information not available |
| Merlo et al. | Cancer Res | 1989 | 1 | 110 | 6 | Information not available |
| Nagai et al. | Cancer Res | 1995 | 1 | 52 | 11 | Information not available |
| Peng et al. | Int J Cancer | 2000 | 1 | 8 | 7 | Information not available |
| Phelan et al. | Genomics | 1996 | 1 | 30 | 6 | 17 (56.7%) IDC, 3 (10.0%) mucinous, 3 (10.0%) medullary, 2 (6.7%) ILC, 2 (6.7%) papillary, 2 (6.7%) no data, 1 (3.3%) DCIS (comedo) |
| Ragnarsson et al. | Br J Cancer | 1999 | 1 | 238 | 13 | Information not available |
| Tsukamoto et al. | Cancer | 1998 | 1 | 143 | 15 | 51 (35.7%) scirrhous, 43 (30.1%) solid tubular, 24 (16.8%) papillotubular, 22 (15.3%) no data, 3 (2.1%) intraductal |
| Piao et al. | Genes Chromosomes Cancer | 2001 | 2, 6 | 37 | 10, 13 | Information not available |
| Ali et al. | J Natl Cancer Inst | 1989 | 3 | 84 | 7 | Information not available |
| Benachenhou et al. | Br J Cancer | 1999 | 3, 5 | 22 | 16, 18 | Information not available |
| Bergthorsson et al. | Eur J Cancer | 1998 | 3 | 103 | 10 | Information not available |
| Deng et al. | Science | 1996 | 3 | 30 | 8 | 30 (100%) normal TDLU |
| Huiping et al. | Eur J Cancer | 2000 | 3 | 107 | 5 | 58 (54.2%) IDC, 49 (45.8%) ILC |
| Matsumoto et al. | Genes Chromosomes Cancer | 1997 | 3 | 196 | 22 | Information not available |
| Shivapurkar et al. | Cancer Res | 1999 | 4 | 44 | 19 | Information not available |
| Chappell et al. | Br J Cancer | 1997 | 6 | 59 | 4 | 50 (84.7%) IDC, 6 (10.2%) tubular, 1 (1.7%) ILC, 1 (1.7%) ILC/tubular, 1 (1.7%) IDC/ILC |
| Fujii et al. | Genes Chromosomes Cancer | 1996 | 6 | 66 | 5 | 57 (86.4%) IDC, 5 (7.6%) medullary, 4 (6.1%) ILC |
| Ingvarrson et al. | Cancer Res | 1998 | 6, 11, 13 | 541 | 19, 14, 16 | 487 (90.0%) IDC, 54 (10.0%) ILC |
| Noviello et al. | Clin Cancer Res | 1996 | 6 | 83c | 11 | 59 (73.8%) IDC, 12 (15.0%) ILC, 5 (6.3%) DCIS, 2 (2.5%) metastatic, 2 (2.5%) mucinous |
| Orpahnos et al. | Br J Cancer | 1995 | 6 | 42 | 18 | 34 (81.0%) IDC, 6 (14.3%) ILC, 1 (2.4%) mucinous, 1 (2.4%) no data |
| Sheng et al. | Br J Cancer | 1996 | 6 | 80 | 14 | 80 (100%) IDC |
| Theile et al. | Oncogene | 1996 | 6 | 46 | 23 | Information not available |
| Utada et al. | Jpn J Cancer Res | 2000 | 6 | 192 | 16 | Information not available |
| Bieche et al. | Clin Cancer Res | 1997 | 7 | 113 | 23 | Information not available |
| Kristjansson et al. | Anticancer Res | 1997 | 7 | 238 | 9 | 214 (89.9%) IDC, 23 (9.7%) ILC, 1 (0.4%) no data |
| Kurose et al. | Jpn J Cancer Res | 1998 | 7 | 142 | 19 | Information not available |
| Lin et al. | Oncogene | 1996 | 7 | 73 | 17 | Information not available |
| Zeng et al. | Oncogene | 1998 | 7 | 66 | 11 | 56 (84.8%) IDC, 5 (7.6%) ILC, 2 (3.0%) DCIS/invasive, 1 (1.5%) mucinous, 1 (1.5%) papillary, 1 (1.5%) sarcoma |
| Zenklusen et al. | Proc Natl Acad Sci USA | 1994 | 7 | 31 | 19 | Information not available |
| Adelaide et al. | Genes Chromosomes Cancer | 1998 | 8 | 79 | 22 | Information not available |
| Anbazhagan et al. | Am J Pathol | 1998 | 8 | 60 | 16 | 60 (100%) IDC |
| Dahiya et al. | Int J Oncol | 1998 | 8 | 66 | 15 | Information not available |
| Kerangueven et al. | Oncogene | 1995 | 8 | 113 | 9 | Information not available |
| Seitz et al. | Eur J Cancer | 2000 | 8 | 50 | 15 | 26 (52.0%) IDC, 15 (30.0%) ILC, 3 (6.0%) no data, 2 (4.0%) intraductal, 2 (4.0%) IDC/intraductal, 1 (2.0%) medullary, 1 (2.0%) papillary |
| Seitz et al. | Br J Cancer | 1997 | 8 | 94 | 7 | 67 (71.3%) IDC, 13 (13.8%) ILC, 6 (6.4%) DCIS, 4 (4.3%) medullary, 1 (1.1%) papillary, 1 (1.1%) tubular, 1 (1.1%) mucinous, 1 (1.1%) LCIS |
| Sigbjornsdottir et al. | J Med Genet | 2000 | 8 | 201 | 11 | 178 (88.6%) IDC, 13 (6.5%) ILC, 10 (5.0%) no data |
| Suzuki et al. | Int J Oncol | 1999 | 8 | 34 | 11 | Information not available |
| Wang et al. | Genomics | 1999 | 8 | 65 | 19 | 65 (100%) DCIS |
| Yaremko et al. | Genes Chromosomes Cancer | 1995 | 8 | 20 | 3 | 19 (95.0%) IDC, 1 (5.0%) papillary |
| Yokota et al. | Cancer | 1999 | 8 | 144 | 17 | Information not available |
| An et al. | Cancer Res | 1999 | 9 | 80 | 22 | Information not available |
| An et al. | Genes Chromosomes Cancer | 1996 | 9 | 68 | 7 | Information not available |
| Brenner et al. | Cancer Res | 1995 | 9 | 24 | 6 | Information not available |
| Eiriksdottir et al. | Int J Cancer | 1995 | 9 | 201 | 8 | 183 (91.0%) IDC, 17 (8.5%) ILC, 1 (0.5%) no data |
| Gorgoulis et al. | Mol Med | 1998 | 9 | 55 | 4 | 48 (87.3%) IDC, 4 (7.3%) ILC, 3 (5.4%) no data |
| Marsh et al. | Br J Cancer | 1998 | 9 | 43 | 13 | 20 (46.5%) invasive, 13 (30.3%) DCIS, 10 (23.2%) DCIS/invasive |
| Minobe et al. | Jpn J Cancer Res | 1998 | 9 | 96 | 15 | Information not available |
| Bose et al. | Oncogene | 1998 | 10 | 62 | 7 | 27 (43.5%) IDC, 10 (16.1%) DCIS (comedo), 10 (16.1%) DCIS (noncomedo), 10 (16.1%) IDC/DCIS, 3 (4.8%) ILC, 1 (1.6%) mucinous, 1 (1.6%) tubular |
| Feilotter et al. | Br J Cancer | 1999 | 10 | 70 | 7 | 68 (97.1%) IDC, 2 (2.9%) ILC |
| Garcia et al. | Breast Cancer Res Treat | 1999 | 10 | 105 | 5 | Information not available |
| Marsh et al. | Genes Chromosomes Cancer | 1998 | 10 | 4 | 12 | 4 (100%) Hamartoma |
| Singh et al. | Genes Chromosomes Cancer | 1998 | 10 | 22 | 11 | 15 (68.2%) IDC, 3 (13.6%) ILC, 3 (13.6%) mucinous, 1 (4.5%) colloid |
| Carter et al. | Cancer Res | 1994 | 11 | 62 | 7 | Information not available |
| Chuaqui et al. | Am J Pathol | 1997 | 11 | 37 | 2 | 25 (67.6%) DCIS, 12 (32.4%) ADH |
| Devilee et al. | Genomics | 1989 | 11, 13, 17 | 64 | 6, 6, 6 | 56 (87.5%) IDC, 4 (6.3%) ILC, 2 (3.1%) intraductal, 1 (1.6%) mucinous, 1 (1.6%) medullary |
| Gentile et al. | Int J Cancer | 2001 | 11 | 134 | 6 | Information not available |
| Gentile et al. | Br J Cancer | 1999 | 11, 13, 17 | 102 | 3, 3, 3 | Information not available |
| Gudmundsson et al. | Br J Cancer | 1995 | 11 | 116 | 10 | Information not available |
| Hampton et al. | Cancer Res | 1994 | 11 | 47 | 5 | 29 (65.9%) IDC, 4 (9.1%) IMC, 3 (6.8%) benign fibroadenoma, 3 (6.8%) cribriform/papillary, 2 (4.5%) intraductal, 2 (4.5%) ILC, 2 (4.5%) tubular, 2 (4.5%) no data |
| Karnik et al. | Hum Mol Genet | 1998 | 11 | 94 | 18 | Information not available |
| Koreth et al. | Oncogene | 1997 | 11 | 51 | 10 | 41 (80.4%) IDC, 8 (15.7%) ILC, 2 (3.9%) mixed, |
| Laake et al. | Genes Chromosomes Cancer | 1999 | 11 | 918 | 7 | Information not available |
| Laake et al. | Genes Chromosomes Cancer | 1997 | 11 | 179 | 10 | Information not available |
| Lichy et al. | Am J Pathol | 1998 | 11 | 115 | 10 | Information not available |
| Nakata et al. | Eur J Cancer | 1998 | 11 | 184 | 15 | Information not available |
| Negrini et al. | Cancer Res | 1995 | 11 | 61 | 25 | Information not available |
| Tomlinson et al. | J Pathol | 1996 | 11 | 71 | 4 | Information not available |
| Tomlinson et al. | J Clin Pathol | 1995 | 11 | 41 | 3 | Information not available |
| Winqvist et al. | Cancer Res | 1995 | 11 | 96 | 15 | 61 (63.5%) IDC, 11 (11.5%) ILC, 10 (10.4%) benign, 5 (5.2%) medullary, 5 (5.2%) tubular, 2 (2.1%) intraductal, 1 (1.0%) IDC/ILC, 1 (1.0%) no data |
| Spirin et al. | Cancer Res | 1996 | 12 | 7 | 6 | Information not available |
| Eiriksdottir et al. | Eur J Cancer | 1998 | 13 | 139 | 18 | 123 (88.5%) IDC, 16 (11.5%) ILC |
| Forsti et al. | Carcinogenesis | 2001 | 13, 17 | 18 | 16, 14 | Information not available |
| Kerangueven et al. | Genes Chromosomes Cancer | 1995 | 13 | 59 | 8 | Information not available |
| Lo et al. | Int J Cancer | 1998 | 13, 17 | 90 | 8, 12 | Information not available |
| Silva et al. | Breast Cancer Res Treat | 1999 | 13, 17 | 140 | 6, 4 | Information not available |
| VandenBerg et al. | Br J Cancer | 1996 | 13 | 84 | 6 | 67 (79.8%) IDC, 6 (7.1%) ILC, 6 (7.1%) no data, 5 (6.0%) medullary |
| O’Connell et al. | J Natl Cancer Inst | 1999 | 14 | 76 | 4 | 62 (81.6%) IDC, 8 (10.5%) ILC, 3 (3.9%) medullary, 3 (3.9%) mucinous |
| Caligo et al. | Int J Oncol | 1998 | 16 | 36 | 4 | 35 (97.2%) IDC, 1 (2.8%) medullary |
| Chalmers et al. | Cancer Genet Cytogenet | 2001 | 16 | 10 | 10 | 5 (50.0%) IDC, 5 (50.0%) ILC |
| Chen et al. | Cancer Res | 1996 | 16 | 35 | 22 | 35 (100%) DCIS |
| Cleton-Jansen et al. | Cancer Res | 2001 | 16 | 712 | 45 | Information not available |
| Cleton-Jansen et al. | Genes Chromosomes Cancer | 1994 | 16 | 79 | 21 | Information not available |
| Dorion-Bonnet et al. | Genes Chromosomes Cancer | 1995 | 16 | 46 | 11 | 44 (95.7%) IDC, 2 (4.3%) ILC |
| Driouch et al. | Genes Chromosomes Cancer | 1997 | 16 | 24 | 15 | Information not available |
| Iida et al. | Br J Cancer | 1997 | 16 | 210 | 15 | 78 (37.1%) scirrhous, 57 (27.1%) solid tubular, 39 (18.6%) papillotubular, 30 (14.3%) no data, 6 (2.9%) IDC |
| Lakhani et al. | J Clin Pathol | 1995 | 16, 17 | 14 | 1, 1 | 14 (100%) ADH |
| Lininger et al. | Hum Pathol | 1998 | 16 | 33 | 3 | Information not available |
| Radford et al. | Cancer Res | 1995 | 16, 17 | 61 | 11, 10 | 61 (100%) DCIS |
| Skirnisdottir et al. | Int J Cancer | 1995 | 16 | 150 | 10 | 129 (86.0%) IDC, 16 (10.7%) ILC, 5 (3.3%) no data |
| Tsuda et al. | Mod Pathol | 2001 | 16 | 46 | 10 | 13 (28.2%) ductal hyperplasia, 10 (21.7%) ADH, 10 (21.7%) papilloma, 6 (13.0%) IDC, 3 (6.5%) atypical papilloma, 3 (6.5%) DCIS, 1 (2.2%) LCIS |
| Tsuda et al. | Cancer Res | 1994 | 16 | 78 | 27 | Information not available |
| Andersen et al. | Genes Chromosomes Cancer | 1992 | 17 | 70 | 7 | Information not available |
| Coles et al. | Lancet | 1990 | 17 | 168 | 5 | Information not available |
| Cornelis et al. | Cancer Res | 1994 | 17 | 141 | 13 | 132 (93.6%) IDC, 4 (2.8%) ILC, 3 (2.1%) DCIS, 1 (0.7%) mucinous, 1 (0.7%) medullary |
| Cornelis et al. | Oncogene | 1993 | 17 | 109 | 15 | 98 (89.9%) IDC, 5 (4.6%) ILC, 3 (2.8%) DCIS, 2 (1.8%) mucinous, 1 (0.9%) medullary |
| Cropp et al. | Cancer Res | 1993 | 17 | 69 | 18 | Information not available |
| Devilee et al. | Cytogenet Cell Genet | 1990 | 17 | 78 | 9 | Information not available |
| Eiriksdottir et al. | Oncogene | 1998 | 17 | 27 | 10 | Information not available |
| Fukino et al. | Genes Chromosomes Cancer | 1999 | 17 | 178 | 7 | Information not available |
| Futreal et al. | Cancer Res | 1992 | 17 | 20 | 7 | Information not available |
| Isomura et al. | Genes Chromosomes Cancer | 1994 | 17 | 398 | 14 | Information not available |
| Kalikin et al. | Genes Chromosomes Cancer | 1996 | 17 | 39 | 8 | Information not available |
| Kerangueven et al. | Oncogene | 1997 | 17 | 115 | 10 | Information not available |
| Kirchweger et al. | Int J Cancer | 1994 | 17 | 151 | 13 | Information not available |
| Lindblom et al. | Hum Genet | 1993 | 17 | 78 | 6 | Information not available |
| Merajver et al. | Clin Cancer Res | 1995 | 17 | 28 | 8 | 23 (82.1%) IDC, 2 (7.1%) papillary/serous, 1 (3.9%) ILC, 1 (3.9%) IDC/ILC, 1 (3.9%) medullary |
| Nagai et al. | Br J Cancer | 1994 | 17 | 100 | 2 | Information not available |
| Nagai et al. | Genes Chromosomes Cancer | 1994 | 17 | 67 | 9 | 60 (89.6%) IDC, 4 (6.0%) ILC, 3 (4.4%) medullary |
| Niederacher et al. | Genes Chromosomes Cancer | 1997 | 17 | 121 | 14 | 121 (100%) IDC |
| Osborne et al. | Cancer Res | 1991 | 17 | 26 | 2 | 26 (100%) IDC |
| Phelan et al. | Cancer Res | 1998 | 17 | 1,280 | 34 | Information not available |
| Plummer et al. | Genes Chromosomes Cancer | 1997 | 17 | 85 | 21 | 75 (88.2%) IDC, 8 (9.4%) DCIS, 2 (2.3%) ILC |
| Radford et al. | Cancer Res | 1993 | 17 | 33 | 5 | 33 (100%) DCIS |
| Rouba et al. | Int J Mol Med | 2000 | 17 | 13 | 3 | 12 (92.3%) IDC, 1 (7.7%) atypical medullary |
| Saito et al. | Cancer Res | 1993 | 17 | 246 | 11 | Information not available |
| Sato et al. | Cancer Res | 1990 | 17 | 79 | 10 | 69 (87.3%) IDC, 4 (5.1%) ILC, 4 (5.1%) no data, 2 (2.5%) mucinous |
| Schildkraut et al. | Am J Obstet Gyn | 1995 | 17 | 24 | 4 | 20 (83.3%) IDC, 2 (8.3%) no data, 1 (4.2%) in situ, 1 (4.2%) medullary |
| Stack et al. | Hum Mol Genet | 1995 | 17 | 39 | 9 | Information not available |
| Thorlacius et al. | Cancer Res | 1993 | 17 | 109 | 5 | 86 (79.2%) IDC, 16 (14.8%) ILC, 7 (6.0%) no data |
| Varley et al. | Oncogene | 1991 | 17 | 90 | 1 | 77 (85.6%) IDC, 3 (3.3%) ILC, 3 (3.3%) tubular, 2 (2.2%) mucinous, 2 (2.2%) papillary, 1 (1.1%) atypical medullary, 1 (1.1%) DCIS (cribriform), 1 (1.1%) IDC/microinvasion |
| Zelada-Heldman et al. | Hum Genet | 1994 | 17 | 7 | 5 | Information not available |
| Devilee et al. | Oncogene | 1991 | 18 | 49 | 5 | 43 (87.8%) IDC, 2 (4.1%) ILC, 1 (2.2%) medullary, 1 (2.2%) intraductal, 1 (2.2%) undifferentiated, 1 (2.2%) adenoma |
| Huang et al. | Diag Mol Pathol | 1995 | 18 | 29 | 10 | 29 (100%) IDC |
| Huiping et al. | Anticancer Res | 1998 | 18 | 228 | 15 | 204 (89.5%) IDC, 23 (10.1%) ILC, 1 (0.4%) no data |
| Kittiniyom et al. | Breast Cancer Res | 2001 | 18 | 30 | 3 | Information not available |
| Yokota et al. | Jpn J Cancer Res | 1997 | 18 | 200 | 15 | Information not available |
| Oesterreich et al. | Br J Cancer | 2001 | 19 | 57 | 4 | Information not available |
| Ohgaki et al. | Genes Chromosomes Cancer | 1998 | 21 | 142 | 11 | Information not available |
| Allione et al. | Int J Cancer | 1998 | 22 | 44 | 25 | 30 (68.2%) IDC, 12 (27.3%) ILC, 2 (4.5%) IDC/ILC |
| Castells et al. | Cancer Res | 2000 | 22 | 36 | 17 | 28 (77.8%) IDC, 4 (11.1%) ILC, 3 (8.3%) DCIS, 1 (2.8%) medullary |
| Iida et al. | Genes Chromosomes Cancer | 1998 | 22 | 140 | 16 | Information not available |
| Choi et al. | J Korean Med Sci | 1998 | X | 23 | 15 | 20 (87.0%) IDC, 2 (8.7%) DCIS, 1 (4.3%) medullary |
| Loupart et al. | Genes Chromosomes Cancer | 1995 | X | 57 | 17 | Information not available |
| Caldes et al. | Int J Oncol | 2000 | Multiple | 88 | 10 | 76 (86.4%) IDC, 12 (13.6%) ILC |
| Kollias et al. | Breast Cancer Res Treat | 2000 | Multiple | 62d | 6 | 16 (51.7%) IDC, IDC; 5 (16.2%) IDC, ILC; 2 (6.5%) medullary, IDC; 2 (6.5%) medullary, IMC; 2 (6.5%) IDC, tubular-mixed; 1 (3.2%) tubular-mixed × 2; 1 (3.2%) IDC, medullary; 1 (3.2%) ILC, IDC; 1 (3.2%) ILC, tubular-mixed |
| Lininger et al. | Mod Pathol | 1999 | Multiple | 18 | 4 | 13 (72.2%) apocrine DCIS, 5 (27.8%) invasive apocrine |
| Patel et al. | Oncogene | 1994 | Multiple | 13 | 9 | 9 (69.2%) IDC, 3 (28.6%) ILC, 1 (7.7%) IDC adenocarcinoma |
| Radford et al. | Cancer Res | 1995 | Multiple | 12 | 48 | 7 (58.3%) comedo/IDC, 2 (16.7%) cribriform/IDC, 1 (8.3%) micropapillary/IDC, 1 (8.3%) DCIS (terminal)/IDC, 1 (8.3%) DCIS (mixed)/IDC |
| Sato et al. | Cancer Res | 1991 | Multiple | 219 | 32 | 102 (46.4%) scirrhous, 49 (22.4%) solid tubular, 42 (19.2%) papillotubular, 16 (7.3%) no data, 10 (4.6%) ILC |
| Shen et al. | Cancer Res | 2000 | Multiple | 6 | 10 | 6 (100%) IDC/DCIS |
| Sourvinos et al. | Tumor Biology | 1996 | Multiple | 42 | 7 | Information not available |
| Zekri et al. | Int J Oncol | 1999 | Multiple | 29 | 24 | 24 (82.8%) IDC, 2 (6.9%) DCIS, 2 (6.9%) sarcoma, 1 (3.4%) ILC |
“Multiple” indicates that the study spanned four or more chromosomes.
The following abbreviations were used in classifying tumor histology: ADH = atypical ductal hyperplasia; ILC = invasive lobular carcinoma; DCIS = ductal carcinoma in situ; LCIS = lobular carcinoma in situ; IDC = invasive ductal carcinoma; TDLU = terminal ductal-lobular unit.
The reported total number of tumor samples analyzed (83) was not in agreement with the sum of the histologically classified tumor samples (80) for this study.
Study consisted of 31 cases of bilateral breast cancer.
Complete Citation List of 151 Articles
Adelaide, J., M. Chaffanet, et al (1998) Chromosome region 8p11-p21: refined mapping and molecular alterations in breast cancer. Genes Chromosomes Cancer 22:186–199
Ali, I. U., R. Lidereau, et al (1989) Presence of two members of c-erbA receptor gene family (c-erbA beta and c-erbA2) in smallest region of somatic homozygosity on chromosome 3p21-p25 in human breast carcinoma. J Natl Cancer Inst 81:1815–1820
Allione, F., F. Eisinger, et al (1998) Loss of heterozygosity at loci from chromosome arm 22Q in human sporadic breast carcinomas. Int J Cancer 75:181–186
An, H. X., A. Claas, et al (1999) Two regions of deletion in 9p23-24 in sporadic breast cancer. Cancer Res 59:3941–3943
An, H. X., D. Niederacher, et al (1996) Frequent allele loss on 9p21-22 defines a smallest common region in the vicinity of the CDKN2 gene in sporadic breast cancer. Genes Chromosomes Cancer 17:14–20
Anbazhagan, R., H. Fujii, et al (1998) Allelic loss of chromosomal arm 8p in breast cancer progression. Am J Pathol 152:815–819
Andersen, T. I., A. Gaustad, et al (1992) Genetic alterations of the tumour suppressor gene regions 3p, 11p, 13q, 17p, and 17q in human breast carcinomas. Genes Chromosomes Cancer 4:113–121
Benachenhou, N., S. Guiral, et al (1999) Frequent loss of heterozygosity at the DNA mismatch-repair loci hMLH1 and hMSH3 in sporadic breast cancer. Br J Cancer 79:1012–1017
Bergthorsson, J. T., J. Johannsdottir, et al (1998) Chromosome imbalance at the 3p14 region in human breast tumours: high frequency in patients with inherited predisposition due to BRCA2. Eur J Cancer 34:142–147
Bieche, I., M. H. Champeme, et al (1995) Loss and gain of distinct regions of chromosome 1q in primary breast cancer. Clin Cancer Res 1:123–127
Bieche, I., M. H. Champeme, et al (1993) Two distinct regions involved in 1p deletion in human primary breast cancer. Cancer Res 53:1990–1994
Bieche, I., A. Khodja, et al (1997) Genetic alteration mapping on chromosome 7 in primary breast cancer. Clin Cancer Res 3:1009–1016
Bieche, I., A. Khodja, et al (1998) Deletion mapping in breast tumor cell lines points to two distinct tumor-suppressor genes in the 1p32-pter region, one of deleted regions (1p36.2) being located within the consensus region of LOH in neuroblastoma. Oncol Rep 5:267–272
Bieche, I., A. Khodja, et al (1999) Deletion mapping of chromosomal region 1p32-pter in primary breast cancer. Genes Chromosomes Cancer 24:255–263
Borg, A., Q. X. Zhang, et al (1992) Chromosome 1 alterations in breast cancer: allelic loss on 1p and 1q is related to lymphogenic metastases and poor prognosis. Genes Chromosomes Cancer 5:311–320
Bose, S., S. I. Wang, et al (1998) Allelic loss of chromosome 10q23 is associated with tumor progression in breast carcinomas. Oncogene 17:123–127
Brenner, A. J. and C. M. Aldaz (1995) Chromosome 9p allelic loss and p16/CDKN2 in breast cancer and evidence of p16 inactivation in immortal breast epithelial cells. Cancer Res 55:2892–2895
Caldes, T., P. Perez-Segura, et al (2000) Low frequency of microsatellite instability in sporadic breast cancer. Int J Oncol 16:1235–1242
Caligo, M. A., L. Polidoro, et al (1998) A region on the long arm of chromosome 16 is frequently deleted in metastatic node-negative breast cancer. Int J Oncol 13:177–182
Carter, S. L., M. Negrini, et al (1994) Loss of heterozygosity at 11q22-q23 in breast cancer. Cancer Res 54:6270–6274
Castells, A., J. F. Gusella, et al (2000) A region of deletion on chromosome 22q13 is common to human breast and colorectal cancers. Cancer Res 60:2836–2839
Chalmers, I. J., M. Aubele, et al (2001) Mapping the chromosome 16 cadherin gene cluster to a minimal deleted region in ductal breast cancer. Cancer Genet Cytogenet 126:39–44
Chappell, S. A., T. Walsh, et al (1997) Loss of heterozygosity at chromosome 6q in preinvasive and early invasive breast carcinomas. Br J Cancer 75:1324–1329
Chen, L. C., C. Dollbaum, et al (1989) Loss of heterozygosity on chromosome 1q in human breast cancer. Proc Natl Acad Sci USA 86:7204–7207
Chen, T., A. Sahin, et al (1996) Deletion map of chromosome 16q in ductal carcinoma in situ of the breast: refining a putative tumor suppressor gene region. Cancer Res 56:5605–5609
Choi, C., M. H. Kim, et al (1998) Loss of heterozygosity on chromosome XP22.2-p22.13 and Xq26.1-q27.1 in human breast carcinomas. J Korean Med Sci 13:311–316
Chuaqui, R. F., Z. Zhuang, et al (1997) Analysis of loss of heterozygosity on chromosome 11q13 in atypical ductal hyperplasia and in situ carcinoma of the breast. Am J Pathol 150:297–303
Cleton-Jansen, A. M., D. F. Callen, et al (2001) Loss of heterozygosity mapping at chromosome arm 16q in 712 breast tumors reveals factors that influence delineation of candidate regions. Cancer Res 61:1171–1177
Cleton-Jansen, A. M., E. W. Moerland, et al (1994) At least two different regions are involved in allelic imbalance on chromosome arm 16q in breast cancer. Genes Chromosomes Cancer 9:101–107
Coles, C., A. M. Thompson, et al (1990) Evidence implicating at least two genes on chromosome 17p in breast carcinogenesis. Lancet 336:761–763
Cornelis, R. S., P. Devilee, et al (1993) Allele loss patterns on chromosome 17q in 109 breast carcinomas indicate at least two distinct target regions. Oncogene 8:781–785
Cornelis, R. S., M. van Vliet, et al (1994) Evidence for a gene on 17p13.3, distal to TP53, as a target for allele loss in breast tumors without p53 mutations. Cancer Res 54:4200–4206
Cropp, C. S., M. H. Champeme, et al (1993) Identification of three regions on chromosome 17q in primary human breast carcinomas which are frequently deleted. Cancer Res 53:5617–5619
Dahiya, R., G. Perinchery, et al (1998) Multiple sites of loss of heterozygosity on chromosome 8 in human breast cancer has differential correlation with clinical parameters. Int J Oncol 12:811–816
Deng, G., Y. Lu, et al (1996) Loss of heterozygosity in normal tissue adjacent to breast carcinomas. Science 274:2057–2059
Devilee, P., C. J. Cornelisse, et al (1990) Loss of heterozygosity on 17p in human breast carcinomas: defining the smallest common region of deletion. Cytogenet Cell Genet 53:52–54
Devilee, P., M. van den Broek, et al (1989) At least four different chromosomal regions are involved in loss of heterozygosity in human breast carcinoma. Genomics 5:554–560
Devilee, P., M. van Vliet, et al (1991) Somatic genetic changes on chromosome 18 in breast carcinomas: is the DCC gene involved? Oncogene 6:311–315
Dorion-Bonnet, F., S. Mautalen, et al (1995) Allelic imbalance study of 16q in human primary breast carcinomas using microsatellite markers. Genes Chromosomes Cancer 14:171–181
Driouch, K., F. Dorion-Bonnet, et al (1997) Loss of heterozygosity on chromosome arm 16q in breast cancer metastases. Genes Chromosomes Cancer 19:185–191
Eiriksdottir, G., R. B. Barkardottir, et al (1998) High incidence of loss of heterozygosity at chromosome 17p13 in breast tumours from BRCA2 mutation carriers. Oncogene 16:21–26
Eiriksdottir, G., G. Johannesdottir, et al (1998) Mapping loss of heterozygosity at chromosome 13q: loss at 13q12-q13 is associated with breast tumour progression and poor prognosis. Eur J Cancer 34:2076–2081
Eiriksdottir, G., A. Sigurdsson, et al (1995) Loss of heterozygosity on chromosome 9 in human breast cancer: association with clinical variables and genetic changes at other chromosome regions. Int J Cancer 64:378–382
Feilotter, H. E., V. Coulon, et al (1999) Analysis of the 10q23 chromosomal region and the PTEN gene in human sporadic breast carcinoma. Br J Cancer 79:718–723
Forsti, A., L. Luo, et al (2001) Allelic imbalance on chromosomes 13 and 17 and mutation analysis of BRCA1 and BRCA2 genes in monozygotic twins concordant for breast cancer. Carcinogenesis 22:27–33
Fujii, H., W. Zhou, et al (1996) Detection of frequent allelic loss of 6q23-q25.2 in microdissected human breast cancer tissues. Genes Chromosomes Cancer 16:35–39
Fukino, K., A. Iido, et al (1999) Frequent allelic loss at the TOC locus on 17q25.1 in primary breast cancers. Genes Chromosomes Cancer 24:345–350
Futreal, P. A., P. Soderkvist, et al (1992) Detection of frequent allelic loss on proximal chromosome 17q in sporadic breast carcinoma using microsatellite length polymorphisms. Cancer Res 52:2624–2627
Gaki, V., M. Tsopanomichalou, et al (2000) Allelic loss in chromosomal region 1q21-23 in breast cancer is associated with peritumoral angiolymphatic invasion and extensive intraductal component. Eur J Surg Oncol 26:455–460
Garcia, J. M., J. M. Silva, et al (1999) Allelic loss of the PTEN region (10q23) in breast carcinomas of poor pathophenotype. Breast Cancer Res Treat 57:237–243
Gentile, M., K. Olsen, et al (1999) Frequent allelic losses at 11q24.1–q25 in young women with breast cancer: association with poor survival. Br J Cancer 80:843–849
Gentile, M., A. Wiman, et al (2001) Deletion mapping of chromosome segment 11q24-25, exhibiting extensive allelic loss in early onset breast cancer. Int J Cancer 92:208–213
Genuardi, M., H. Tsihira, et al (1989) Distal deletion of chromosome 1p in ductal carcinoma of the breast. Am J Hum Genet 45:73–82
Gorgoulis, V. G., E. N. Koutroumbi, et al (1998) Alterations of p16-pRb pathway and chromosome locus 9p21-22 in sporadic invasive breast carcinomas. Mol Med 4:807–822
Gudmundsson, J., R. B. Barkardottir, et al (1995) Loss of heterozygosity at chromosome 11 in breast cancer: association of prognostic factors with genetic alterations. Br J Cancer 72:696–701
Hampton, G. M., A. Mannermaa, et al (1994) Loss of heterozygosity in sporadic human breast carcinoma: a common region between 11q22 and 11q23.3. Cancer Res 54:4586–4589
Hoggard, N., Y. Hey, et al (1995) Identification and cloning in yeast artificial chromosomes of a region of elevated loss of heterozygosity on chromosome 1p31.1 in human breast cancer. Genomics 30:233–243
Huang, T. H., P. L. Yeh, et al (1995) Genetic alterations of microsatellites on chromosome 18 in human breast carcinoma. Diagn Mol Pathol 4:66–72
Huiping, C., G. Eiriksdottir, et al (1998) High frequency of LOH at chromosome 18q in human breast cancer: association with high S-phase fraction and low progesterone receptor content. Anticancer Res 18:1031–1036
Huiping, C., J. G. Jonasson, et al (2000) Analysis of the fragile histidine triad (FHIT) gene in lobular breast cancer. Eur J Cancer 36:1552–1557
Iida, A., R. Isobe, et al (1997) Localization of a breast cancer tumour-suppressor gene to a 3-cM interval within chromosomal region 16q22. Br J Cancer 75:264–267
Iida, A., K. Kurose, et al (1998) Mapping of a new target region of allelic loss to a 2-cM interval at 22q13.1 in primary breast cancer. Genes Chromosomes Cancer 21:108–112
Ingvarsson, S., E. K. Geirsdottir, et al (1998) High incidence of loss of heterozygosity in breast tumors from carriers of the BRCA2 999del5 mutation. Cancer Res 58:4421–4425
Isomura, M., A. Tanigami, et al (1994) Detailed analysis of loss of heterozygosity on chromosome band 17p13 in breast carcinoma on the basis of a high-resolution physical map with 29 markers. Genes Chromosomes Cancer 9:173–179
Kalikin, L. M., X. Qu, et al (1996) Detailed deletion analysis of sporadic breast tumors defines an interstitial region of allelic loss on 17q25. Genes Chromosomes Cancer 17:64–68
Karnik, P., M. Paris, et al (1998) Two distinct tumor suppressor loci within chromosome 11p15 implicated in breast cancer progression and metastasis. Hum Mol Genet 7:895–903
Kerangueven, F., F. Allione, et al (1995) Patterns of loss of heterozygosity at loci from chromosome arm 13q suggests a possible involvement of BRCA2 in sporadic breast tumors. Genes Chromosomes Cancer 13:291–294
Kerangueven, F., F. Eisinger, et al (1997) Loss of heterozygosity in human breast carcinomas in the ataxia telangiectasia, Cowden disease and BRCA1 gene regions. Oncogene 14:339–347
Kerangueven, F., L. Essioux, et al (1995) Loss of heterozygosity and linkage analysis in breast carcinoma: indication for a putative third susceptibility gene on the short arm of chromosome 8. Oncogene 10:1023–1026
Kirchweger, R., R. Zeillinger, et al (1994) Patterns of allele losses suggest the existence of five distinct regions of LOH on chromosome 17 in breast cancer. Int J Cancer 56:193–199
Kittiniyom, K., K. M. Gorse, et al (2001) Allelic loss on chromosome band 18p11.3 occurs early and reveals heterogeneity in breast cancer progression. Breast Cancer Res 3:192–198
Kollias, J., S. Man, et al (2000) Loss of heterozygosity in bilateral breast cancer. Breast Cancer Res Treat 64:241–251
Koreth, J., C. J. Bakkenist, et al (1997) Allelic deletions at chromosome 11q22-q23.1 and 11q25-qterm are frequent in sporadic breast but not colorectal cancers. Oncogene 14:431–437
Kristjansson, A. K., G. Eiriksdottir, et al (1997) Loss of heterozygosity at chromosome 7q in human breast cancer: association with clinical variables. Anticancer Res 17:93–98
Kurose, K., A. Iida, et al (1998) Frequent allelic loss at 7p14-15 associated with aggressive histologic types of breast cancer. Jpn J Cancer Res 89:533–538
Laake, K., V. Launonen, et al (1999) Loss of heterozygosity at 11q23.1 and survival in breast cancer: results of a large European study. Breast Cancer Somatic Genetics Consortium. Genes Chromosomes Cancer 25:212–221
Laake, K., A. Odegard, et al (1997) Loss of heterozygosity at 11q23.1 in breast carcinomas: indication for involvement of a gene distal and close to ATM. Genes Chromosomes Cancer 18:175–180
Lakhani, S. R., N. Collins, et al (1995) Atypical ductal hyperplasia of the breast: clonal proliferation with loss of heterozygosity on chromosomes 16q and 17p. J Clin Pathol 48:611–615
Lichy, J. H., M. Zavar, et al (1998) Loss of heterozygosity on chromosome 11p15 during histological progression in microdissected ductal carcinoma of the breast. Am J Pathol 153:271–278
Lin, J. C., S. W. Scherer, et al (1996) Detailed deletion mapping with a refined physical map of 7q31 localizes a putative tumor suppressor gene for breast cancer in the region of MET. Oncogene 13:2001–2008
Lindblom, A., L. Skoog, et al (1993) Four separate regions on chromosome 17 show loss of heterozygosity in familial breast carcinomas. Hum Genet 91:6–12
Lininger, R. A., W. S. Park, et al (1998) LOH at 16p13 is a novel chromosomal alteration detected in benign and malignant microdissected papillary neoplasms of the breast. Hum Pathol 29:1113–1118
Lininger, R. A., Z. Zhuang, et al (1999) Loss of heterozygosity is detected at chromosomes 1p35-36 (NB), 3p25 (VHL), 16p13 (TSC2/PKD1), and 17p13 (TP53) in microdissected apocrine carcinomas of the breast. Mod Pathol 12:1083–1089
Lo, Y. L., J. C. Yu, et al (1998) Allelic loss of the BRCA1 and BRCA2 genes and other regions on 17q and 13q in breast cancer among women from Taiwan (area of low incidence but early onset) Int J Cancer 79:580–587
Loupart, M. L., S. Adams, et al (1995) Loss of heterozygosity on the X chromosome in human breast cancer. Genes Chromosomes Cancer 13:229–238
Loupart, M. L., J. Armour, et al (1995) Allelic imbalance on chromosome 1 in human breast cancer. I. Minisatellite and RFLP analysis. Genes Chromosomes Cancer 12:16–23
Marsh, D. J., P. L. Dahia, et al (1998) Allelic imbalance, including deletion of PTEN/MMAC1, at the Cowden disease locus on 10q22-23, in hamartomas from patients with Cowden syndrome and germline PTEN mutation. Genes Chromosomes Cancer 21:61–69
Marsh, K. L. and J. M. Varley (1998) Loss of heterozygosity at chromosome 9p in ductal carcinoma in situ and invasive carcinoma of the breast. Br J Cancer 77:1439–1447
Matsumoto, S., F. Kasumi, et al (1997) Detailed deletion mapping of chromosome arm 3p in breast cancers: a 2-cM region on 3p14.3-21.1 and a 5-cM region on 3p24.3-25.1 commonly deleted in tumors. Genes Chromosomes Cancer 20:268–274
Merajver, S. D., T. S. Frank, et al (1995) Germline BRCA1 mutations and loss of the wild-type allele in tumors from families with early onset breast and ovarian cancer. Clin Cancer Res 1:539–544
Merlo, G. R., J. Siddiqui, et al (1989) Frequent alteration of the DF3 tumor-associated antigen gene in primary human breast carcinomas. Cancer Res 49:6966–6971
Minobe, K., M. Onda, et al (1998) Allelic loss on chromosome 9q is associated with lymph node metastasis of primary breast cancer. Jpn J Cancer Res 89:916–922
Nagai, H., M. Negrini, et al (1995) Detection and cloning of a common region of loss of heterozygosity at chromosome 1p in breast cancer. Cancer Res 55:1752–1757
Nagai, M. A., M. M. Pacheco, et al (1994) Allelic loss on distal chromosome 17p is associated with poor prognosis in a group of Brazilian breast cancer patients. Br J Cancer 69:754–758
Nagai, M. A., L. Yamamoto, et al (1994) Detailed deletion mapping of chromosome segment 17q12-21 in sporadic breast tumours. Genes Chromosomes Cancer 11:58–62
Nakata, T., M. Yoshimoto, et al (1998) Identification of a new commonly deleted region within a 2-cM interval of chromosome 11p11 in breast cancers. Eur J Cancer 34:417–421
Negrini, M., D. Rasio, et al (1995) Definition and refinement of chromosome 11 regions of loss of heterozygosity in breast cancer: identification of a new region at 11q23.3. Cancer Res 55:3003–3007
Niederacher, D., F. Picard, et al (1997) Patterns of allelic loss on chromosome 17 in sporadic breast carcinomas detected by fluorescent-labeled microsatellite analysis. Genes Chromosomes Cancer 18:181–192
Noviello, C., F. Courjal, et al (1996) Loss of heterozygosity on the long arm of chromosome 6 in breast cancer: possibly four regions of deletion. Clin Cancer Res 2:1601–1606
O’Connell, P., K. Fischbach, et al (1999) Loss of heterozygosity at D14S62 and metastatic potential of breast cancer. J Natl Cancer Inst 91:1391–1397
Oesterreich, S., D. C. Allredl, et al (2001) High rates of loss of heterozygosity on chromosome 19p13 in human breast cancer. Br J Cancer 84:493–498
Ohgaki, K., A. Iida, et al (1998) Mapping of a new target region of allelic loss to a 6-cM interval at 21q21 in primary breast cancers. Genes Chromosomes Cancer 23:244–247
Orphanos, V., G. McGown, et al (1995) Proximal 6q, a region showing allele loss in primary breast cancer. Br J Cancer 71:290–293
Osborne, R. J., G. R. Merlo, et al (1991) Mutations in the p53 gene in primary human breast cancers. Cancer Res 51:6194–6198
Patel, U., S. Grundfest-Broniatowski, et al (1994) Microsatellite instabilities at five chromosomes in primary breast tumors. Oncogene 9:3695–3700
Peng, H., F. Xu, et al (2000) ARHI is the center of allelic deletion on chromosome 1p31 in ovarian and breast cancers. Int J Cancer 86:690–694
Phelan, C. M., A. Borg, et al (1998) Consortium study on 1280 breast carcinomas: allelic loss on chromosome 17 targets subregions associated with family history and clinical parameters. Cancer Res 58:1004–1012
Phelan, C. M., C. Larsson, et al (1996) The human mammary-derived growth inhibitor (MDGI) gene: genomic structure and mutation analysis in human breast tumors. Genomics 34:63–68
Piao, Z., K. S. Lee, et al (2001) Identification of novel deletion regions on chromosome arms 2q and 6p in breast carcinomas by amplotype analysis. Genes Chromosomes Cancer 30:113–122
Plummer, S. J., M. J. Paris, et al (1997) Four regions of allelic imbalance on 17q12-qter associated with high-grade breast tumors. Genes Chromosomes Cancer 20:354–362
Radford, D. M., K. Fair, et al (1993) Allelic loss on a chromosome 17 in ductal carcinoma in situ of the breast. Cancer Res 53:2947–2949
Radford, D. M., K. L. Fair, et al (1995) Allelotyping of ductal carcinoma in situ of the breast: deletion of loci on 8p, 13q, 16q, 17p and 17q. Cancer Res 55:3399–3405
Radford, D. M., N. J. Phillips, et al (1995) Allelic loss and the progression of breast cancer [published erratum appears in Cancer Res 56:935]. Cancer Res 55:5180–5183
Ragnarsson, G., G. Eiriksdottir, et al (1999) Loss of heterozygosity at chromosome 1p in different solid human tumours: association with survival. Br J Cancer 79:1468–1474
Rouba, A., N. Kaisi, et al (2000) Patterns of allelic loss at the BRCA1 locus in Arabic women with breast cancer. Int J Mol Med 6:565–569
Saito, H., J. Inazawa, et al (1993) Detailed deletion mapping of chromosome 17q in ovarian and breast cancers: 2-cM region on 17q21.3 often and commonly deleted in tumors. Cancer Res 53:3382–3385
Sato, T., F. Akiyama, et al (1991) Accumulation of genetic alterations and progression of primary breast cancer. Cancer Res 51:5794–5799
Sato, T., A. Tanigami, et al (1990) Allelotype of breast cancer: cumulative allele losses promote tumor progression in primary breast cancer. Cancer Res 50:7184–7189
Schildkraut, J. M., N. K. Collins, et al (1995) Loss of heterozygosity on chromosome 17q11-21 in cancers of women who have both breast and ovarian cancer. Am J Obstet Gynecol 172:908–913
Seitz, S., K. Rohde, et al (1997) Deletion mapping and linkage analysis provide strong indication for the involvement of the human chromosome region 8p12-p22 in breast carcinogenesis. Br J Cancer 76:983–991
Seitz, S., S. Werner, et al (2000) Refined deletion mapping in sporadic breast cancer at chromosomal region 8p12-p21 and association with clinicopathological parameters. Eur J Cancer 36:1507–1513
Shen, C. Y., J. C. Yu, et al (2000) Genome-wide search for loss of heterozygosity using laser capture microdissected tissue of breast carcinoma: an implication for mutator phenotype and breast cancer pathogenesis. Cancer Res 60:3884–3892
Sheng, Z. M., A. Marchetti, et al (1996) Multiple regions of chromosome 6q affected by loss of heterozygosity in primary human breast carcinomas. Br J Cancer 73:144–147
Shivapurkar, N., S. Sood, et al (1999) Multiple regions of chromosome 4 demonstrating allelic losses in breast carcinomas. Cancer Res 59:3576–3580
Sigbjornsdottir, B. I., G. Ragnarsson, et al (2000) Chromosome 8p alterations in sporadic and BRCA2 999del5 linked breast cancer. J Med Genet 37:342–347
Silva, J. M., R. Gonzalez, et al (1999) Loss of heterozygosity in BRCA1 and BRCA2 markers and high-grade malignancy in breast cancer. Breast Cancer Res Treat 53:9–17
Singh, B., M. M. Ittmann, et al (1998) Sporadic breast cancers exhibit loss of heterozygosity on chromosome segment 10q23 close to the Cowden disease locus. Genes Chromosomes Cancer 21:166–171
Skirnisdottir, S., G. Eiriksdottir, et al (1995) High frequency of allelic imbalance at chromosome region 16q22-23 in human breast cancer: correlation with high PgR and low S phase. Int J Cancer 64:112–116
Sourvinos, G., H. Kiaris, et al (1997) Microsatellite instability and loss of heterozygosity in primary breast tumours. Tumour Biol 18:157–166
Spirin, K. S., J. F. Simpson, et al (1996) p27/Kip1 mutation found in breast cancer. Cancer Res 56:2400–2404
Stack, M., D. Jones, et al (1995) Detailed mapping and loss of heterozygosity analysis suggests a suppressor locus involved in sporadic breast cancer within a distal region of chromosome band 17p13.3. Hum Mol Genet 4:2047–2055
Suzuki, A., X. Shao, et al (1999) Identification of a 5-cM region of common allelic loss on 8p12-p21 in human breast cancer and genomic analysis of the hEXT1L/EXTR1/EXTL3 gene in this locus. Int J Oncol 15:443–451
Theile, M., S. Seitz, et al (1996) A defined chromosome 6q fragment (at D6S310) harbors a putative tumor suppressor gene for breast cancer. Oncogene 13:677–685
Thorlacius, S., A. L. Borresen, et al (1993) Somatic p53 mutations in human breast carcinomas in an Icelandic population: a prognostic factor. Cancer Res 53:1637–1641
Tomlinson, I. P., H. Nicolai, et al (1996) The frequency and mechanism of loss of heterozygosity on chromosome 11q in breast cancer. J Pathol 180:38–43
Tomlinson, I. P., J. E. Strickland, et al (1995) Loss of heterozygosity on chromosome 11 q in breast cancer. J Clin Pathol 48:424–428
Tsuda, H., D. F. Callen, et al (1994) Allele loss on chromosome 16q24.2-qter occurs frequently in breast cancers irrespectively of differences in phenotype and extent of spread. Cancer Res 54:513–517
Tsuda, H., T. Takarabe, et al (2001) Pattern of chromosome 16q loss differs between an atypical proliferative lesion and an intraductal or invasive ductal carcinoma occurring subsequently in the same area of the breast. Mod Pathol 14:382–388
Tsukamoto, K., N. Ito, et al (1998) Allelic loss on chromosome 1p is associated with progression and lymph node metastasis of primary breast carcinoma. Cancer 82:317–322
Utada, Y., S. Haga, et al (2000) Mapping of target regions of allelic loss in primary breast cancers to 1-cM intervals on genomic contigs at 6q21 and 6q25.3. Jpn J Cancer Res 91:293–300
van den Berg, J., O. Johannsson, et al (1996) Allelic loss at chromosome 13q12-q13 is associated with poor prognosis in familial and sporadic breast cancer. Br J Cancer 74:1615–1619
Varley, J. M., W. J. Brammar, et al (1991) Loss of chromosome 17p13 sequences and mutation of p53 in human breast carcinomas. Oncogene 6:413–421
Wang, J. C., D. M. Radford, et al (1999) Sequence-ready contig for the 1.4-cM ductal carcinoma in situ loss of heterozygosity region on chromosome 8p22-p23. Genomics 60:1–11
Winqvist, R., G. M. Hampton, et al (1995) Loss of heterozygosity for chromosome 11 in primary human breast tumors is associated with poor survival after metastasis. Cancer Res 55:2660–2664
Yaremko, M. L., W. M. Recant, et al (1995) Loss of heterozygosity from the short arm of chromosome 8 is an early event in breast cancers. Genes Chromosomes Cancer 13:186–191
Yokota, T., S. Matsumoto, et al (1997) Mapping of a breast cancer tumor suppressor gene locus to a 4-cM interval on chromosome 18q21. Jpn J Cancer Res 88:959–964
Yokota, T., M. Yoshimoto, et al (1999) Localization of a tumor suppressor gene associated with the progression of human breast carcinoma within a 1-cM interval of 8p22-p23.1. Cancer 85:447–452
Zekri, A. R., A. A. Bahnassi, et al (1999) Allelic instability as a predictor of survival in Egyptian breast cancer patients. Int J Oncol 15:757–767
Zelada-Hedman, M., M. Torroella, et al (1994) Loss of heterozygosity studies in tumors from families with breast-ovarian cancer syndrome. Hum Genet 94:231–234
Zeng, W. R., P. Watson, et al (1999) Refined mapping of the region of loss of heterozygosity on the long arm of chromosome 7 in human breast cancer defines the location of a second tumor suppressor gene at 7q22 in the region of the CUTL1 gene. Oncogene 18:2015–2021
Zenklusen, J. C., I. Bieche, et al (1994) (C-A)n microsatellite repeat D7S522 is the most commonly deleted region in human primary breast cancer. Proc Natl Acad Sci USA 91:12155–12158
Electronic-Database Information
The URLs for data presented herein are as follows:
- Authors' Web site, http://www.bios.unc.edu/~fwright (for data and other supplemental material)
- Genetic Epidemiology Group, http://cedar.genetics.soton.ac.uk/public_html/ (for the Location Database)
- Mitelman Database of Chromosome Aberrations in Cancer, http://cgap.nci.nih.gov/Chromosomes/Mitelman
- Online Mendelian Inheritance in Man (OMIM), http://www.ncbi.nlm.nih.gov/Omim/ (for BRCA1, CAV1, ST7, CDH13, CBFA2T3, CYBA, FANCA, CDH1, CDH3, WWOX/FRA16D, BRCA2, AS3, RB1, ABR, HIC1, DPH2L1, TP53, MAP2K4, N33, PDGFRL, LZTS1, RHOBTB2, TNFRSF10A, TNFRSF10B, FHIT, MLH1, TGFBR2, BTG3, DCC, MADH4, LRRC2, SAFB, EPB41L3, CDKN2A/p16, IFNA4, ESR1, IGF2R, SKI, TP73, FAT, Li-Fraumeni syndrome, PTEN, Cowden disease, ATM, hereditary nonpolyposis colorectal cancer, STK11, Peutz-Jeghers syndrome, WRN, and Werner syndrome)
- UCSC Genome Bioinformatics Home Page, http://genome.ucsc.edu/ (for the UCSC genome browser and STS placements)
References
- Adelaide J, Chaffanet M, Imbert A, Allione F, Geneix J, Popovici C, van Alewijk D, Trapman J, Zeillinger R, Borresen-Dale AL, Lidereau R, Birnbaum D, Pebusque MJ (1998) Chromosome region 8p11-p21: refined mapping and molecular alterations in breast cancer. Genes Chromosomes Cancer 22:186–199 [DOI] [PubMed] [Google Scholar]
- American Cancer Society (2002) ACS breast cancer facts and figures, 2001–2002. American Cancer Society, Atlanta [Google Scholar]
- Arlt MF, Miller DE, Beer DG, Glover TW (2002) Molecular characterization of FRAXB and comparative common fragile site instability in cancer cells. Genes Chromosomes Cancer 33:82–92 [DOI] [PubMed] [Google Scholar]
- Becker KF, Kremmer E, Eulitz M, Schulz S, Mages J, Handschuh G, Wheelock MJ, Cleton-Jansen AM, Hofler H, Becker I (2002) Functional allelic loss detected at the protein level in archival human tumours using allele-specific E-cadherin monoclonal antibodies. J Pathol 197:567–574 [DOI] [PubMed] [Google Scholar]
- Bednarek AK, Keck-Waggoner CL, Daniel RL, Laflin KJ, Bergsagel PL, Kiguchi K, Brenner AJ, Aldaz CM (2001) WWOX, the FRA16D gene, behaves as a suppressor of tumor growth. Cancer Res 61:8068–8073 [PubMed] [Google Scholar]
- Bell DW, Erban J, Sgroi DC, Haber DA (2002) Selective loss of heterozygosity in multiple breast cancers from a carrier of mutations in both BRCA1 and BRCA2. Cancer Res 62:2741–2743 [PubMed] [Google Scholar]
- Benachenhou N, Guiral S, Gorska-Flipot I, Labuda D, Sinnett D (1999) Frequent loss of heterozygosity at the DNA mismatch-repair loci hMLH1 and hMSH3 in sporadic breast cancer. Br J Cancer 79:1012–1017 [DOI] [PMC free article] [PubMed] [Google Scholar]
- Bieche I, Khodja A, Lidereau R (1998) Deletion mapping in breast tumor cell lines points to two distinct tumor-suppressor genes in the 1p32-pter region, one of deleted regions (1p36.2) being located within the consensus region of LOH in neuroblastoma. Oncol Rep 5:267–272 [DOI] [PubMed] [Google Scholar]
- ——— (1999) Deletion mapping of chromosomal region 1p32-pter in primary breast cancer. Genes Chromosomes Cancer 24:255–263 [DOI] [PubMed] [Google Scholar]
- Bogliolo M, Cabre O, Callen E, Castillo V, Creus A, Marcos R, Surralles J (2002) The Fanconi anaemia genome stability and tumour suppressor network. Mutagenesis 17:529–538 [DOI] [PubMed] [Google Scholar]
- Brown VL, Proby CM, Barnes DM, Kelsell DP (2002) Lack of mutations within ST7 gene in tumour-derived cell lines and primary epithelial tumours. Br J Cancer 87:208–211 [DOI] [PMC free article] [PubMed] [Google Scholar]
- Bruening W, Prowse AH, Schultz DC, Holgado-Madruga M, Wong A, Godwin AK (1999) Expression of OVCA1, a candidate tumor suppressor, is reduced in tumors and inhibits growth of ovarian cancer cells. Cancer Res 59:4973–4983 [PubMed] [Google Scholar]
- Buchholz TA, Weil MM, Story MD, Strom EA, Brock WA, McNeese MD (1999) Tumor suppressor genes and breast cancer. Radiat Oncol Investig 7:55–65 [DOI] [PubMed] [Google Scholar]
- Cabeza-Arvelaiz Y, Sepulveda JL, Lebovitz RM, Thompson TC, Chinault AC (2001) Functional identification of LZTS1 as a candidate prostate tumor suppressor gene on human chromosome 8p22. Oncogene 20:4169–4179 [DOI] [PubMed] [Google Scholar]
- Callahan R (1998) Somatic mutations that contribute to breast cancer. Biochem Soc Symp 63:211–221 [PubMed] [Google Scholar]
- Callahan R, Cropp C, Sheng ZM, Merlo G, Steeg P, Liscia D, Lidereau R (1993) Definition of regions of the human genome affected by loss of heterozygosity in primary human breast tumors. J Cell Biochem Suppl 17G:167–172 [DOI] [PubMed] [Google Scholar]
- Callen DF, Crawford J, Derwas C, Cleton-Jansen AM, Cornelisse CJ, Baker E (2002) Defining regions of loss of heterozygosity of 16q in breast cancer cell lines. Cancer Genet Cytogenet 133:76–82 [DOI] [PubMed] [Google Scholar]
- Calvo R, West J, Franklin W, Erickson P, Bemis L, Li E, Helfrich B, Bunn P, Roche J, Brambilla E, Rosell R, Gemmill RM, Drabkin HA (2000) Altered HOX and WNT7A expression in human lung cancer. Proc Natl Acad Sci USA 97:12776–12781 [DOI] [PMC free article] [PubMed] [Google Scholar]
- Castells A, Gusella JF, Ramesh V, Rustgi AK (2000) A region of deletion on chromosome 22q13 is common to human breast and colorectal cancers. Cancer Res 60:2836–2839 [PubMed] [Google Scholar]
- Chalmers IJ, Aubele M, Hartmann E, Braungart E, Werner M, Hofler H, Atkinson MJ (2001) Mapping the chromosome 16 cadherin gene cluster to a minimal deleted region in ductal breast cancer. Cancer Genet Cytogenet 126:39–44 [DOI] [PubMed] [Google Scholar]
- Chen T, Sahin A, Aldaz CM (1996) Deletion map of chromosome 16q in ductal carcinoma in situ of the breast: refining a putative tumor suppressor gene region. Cancer Res 56:5605–5609 [PubMed] [Google Scholar]
- Chen W, Butler M, Rao PH, Chaganti SR, Louie DC, Dalla-Favera R, Chaganti RS (1998) The t(2;3)(q21;q27) translocation in non-Hodgkin’s lymphoma displays BCL6 mutations in the 5′ regulatory region and chromosomal breakpoints distant from the gene. Oncogene 17:1717–1722 [DOI] [PubMed] [Google Scholar]
- Chen Z, Ge Y, Landman N, Kang JX (2002) Decreased expression of the mannose 6-phosphate/insulin-like growth factor-II receptor promotes growth of human breast cancer cells. BMC Cancer 2:18 [DOI] [PMC free article] [PubMed] [Google Scholar]
- Cleton-Jansen AM, Moerland EW, Kuipers-Dijkshoorn NJ, Callen DF, Sutherland GR, Hansen B, Devilee P, Cornelisse CJ (1994) At least two different regions are involved in allelic imbalance on chromosome arm 16q in breast cancer. Genes Chromosomes Cancer 9:101–107 [DOI] [PubMed] [Google Scholar]
- Collins A, Frezal J, Teague J, Morton NE (1996) A metric map of humans: 23,500 loci in 850 bands. Proc Natl Acad Sci USA 93:14771–14775 [DOI] [PMC free article] [PubMed] [Google Scholar]
- Couch FJ, Weber BL (1997) Breast cancer. In: Vogelstein B, Kinzler KW (eds) The genetic basis of human cancer. McGraw-Hill, New York, pp 537–564 [Google Scholar]
- Cox DR, Hinkley DV (1974) Theoretical statistics. Chapman and Hall, London [Google Scholar]
- DerSimonian R, Laird N (1986) Meta-analysis in clinical trials. Control Clin Trials 7:177–188 [DOI] [PubMed] [Google Scholar]
- Desper R, Jiang F, Kallioniemi OP, Moch H, Papadimitriou CH, Schaffer AA (1999) Inferring tree models for oncogenesis from comparative genome hybridization data. J Comput Biol 6:37–51 [DOI] [PubMed] [Google Scholar]
- Devilee P, Cleton-Jansen AM, Cornelisse CJ (2001) Ever since Knudson. Trends Genet 17:569–573 [DOI] [PubMed] [Google Scholar]
- Devilee P, Cornelisse CJ (1994) Somatic genetic changes in human breast cancer. Biochim Biophys Acta 1198:113–130 [DOI] [PubMed] [Google Scholar]
- Devilee P, van Vliet M, Kuipers-Dijkshoorn N, Pearson PL, Cornelisse CJ (1991) Somatic genetic changes on chromosome 18 in breast carcinomas: is the DCC gene involved? Oncogene 6:311–315 [PubMed] [Google Scholar]
- Dong SM, Sidransky D (2002) Absence of ST7 gene alterations in human cancer. Clin Cancer Res 8:2939–2941 [PubMed] [Google Scholar]
- Driouch K, Dorion-Bonnet F, Briffod M, Champeme MH, Longy M, Lidereau R (1997) Loss of heterozygosity on chromosome arm 16q in breast cancer metastases. Genes Chromosomes Cancer 19:185–191 [DOI] [PubMed] [Google Scholar]
- Ellisen LW, Haber DA (1998) Hereditary breast cancer. Annu Rev Med 49:425–436 [DOI] [PubMed] [Google Scholar]
- Fiucci G, Ravid D, Reich R, Liscovitch M (2002) Caveolin-1 inhibits anchorage-independent growth, anoikis and invasiveness in MCF-7 human breast cancer cells. Oncogene 21:2365–2375 [DOI] [PubMed] [Google Scholar]
- Forsti A, Luo L, Vorechovsky I, Soderberg M, Lichtenstein P, Hemminki K (2001) Allelic imbalance on chromosomes 13 and 17 and mutation analysis of BRCA1 and BRCA2 genes in monozygotic twins concordant for breast cancer. Carcinogenesis 22:27–33 [DOI] [PubMed] [Google Scholar]
- Futreal PA, Kasprzyk A, Birney E, Mullikin JC, Wooster R, Stratton MR (2001) Cancer and genomics. Nature 409:850–852 [DOI] [PubMed] [Google Scholar]
- Gaki V, Tsopanomichalou M, Sourvinos G, Tsiftsis D, Spandidos DA (2000) Allelic loss in chromosomal region 1q21-23 in breast cancer is associated with peritumoral angiolymphatic invasion and extensive intraductal component. Eur J Surg Oncol 26:455–460 [DOI] [PubMed] [Google Scholar]
- Geck P, Sonnenschein C, Soto AM (2001) The D13S171 marker, misannotated to BRCA2, links the AS3 gene to various cancers. Am J Hum Genet 69:461–463 [DOI] [PMC free article] [PubMed] [Google Scholar]
- Geck P, Szelei J, Jimenez J, Sonnenschein C, Soto AM (1999) Early gene expression during androgen-induced inhibition of proliferation of prostate cancer cells: a new suppressor candidate on chromosome 13, in the BRCA2-Rb1 locus. J Steroid Biochem Mol Biol 68:41–50 [DOI] [PubMed] [Google Scholar]
- Gentile M, Wiman A, Thorstenson S, Loman N, Borg A, Wingren S (2001) Deletion mapping of chromosome segment 11q24-25, exhibiting extensive allelic loss in early onset breast cancer. Int J Cancer 92:208–213 [DOI] [PubMed] [Google Scholar]
- Guerardel C, Deltour S, Pinte S, Monte D, Begue A, Godwin AK, Leprince D (2001) Identification in the human candidate tumor suppressor gene HIC-1 of a new major alternative TATA-less promoter positively regulated by p53. J Biol Chem 276:3078–3089 [DOI] [PubMed] [Google Scholar]
- Hahn SA, Schutte M, Hoque AT, Moskaluk CA, da Costa LT, Rozenblum E, Weinstein CL, Fischer A, Yeo CJ, Hruban RH, Kern SE (1996) DPC4, a candidate tumor suppressor gene at human chromosome 18q21.1. Science 271:350–353 [DOI] [PubMed] [Google Scholar]
- Hamaguchi M, Meth JL, von Klitzing C, Wei W, Esposito D, Rodgers L, Walsh T, Welcsh P, King MC, Wigler MH (2002) DBC2, a candidate for a tumor suppressor gene involved in breast cancer. Proc Natl Acad Sci USA 99:13647–13652 [DOI] [PMC free article] [PubMed] [Google Scholar]
- Ho KY, Kalle WH, Lo TH, Lam WY, Tang CM (1999) Reduced expression of APC and DCC gene protein in breast cancer. Histopathology 35:249–256 [DOI] [PubMed] [Google Scholar]
- Hsu YY, Wang YH (2002) Human fragile site FRA16B DNA excludes nucleosomes in the presence of distamycin. J Biol Chem 277:17315–17319 [DOI] [PubMed] [Google Scholar]
- Huebner K, Croce CM (2001) FRA3B and other common fragile sites: the weakest links. Nat Rev Cancer 1:214–221 [DOI] [PubMed] [Google Scholar]
- Huiping C, Jonasson JG, Agnarsson BA, Sigbjornsdottir BI, Huebner K, Ingvarsson S (2000) Analysis of the fragile histidine triad (FHIT) gene in lobular breast cancer. Eur J Cancer 36:1552–1557 [DOI] [PubMed] [Google Scholar]
- Kainu T, Juo SH, Desper R, Schaffer AA, Gillanders E, Rozenblum E, Freas-Lutz D, et al (2000) Somatic deletions in hereditary breast cancers implicate 13q21 as a putative novel breast cancer susceptibility locus. Proc Natl Acad Sci USA 97:9603–9608 [DOI] [PMC free article] [PubMed] [Google Scholar]
- Kallioniemi A, Kallioniemi OP, Sudar D, Rutovitz D, Gray JW, Waldman F, Pinkel D (1992) Comparative genomic hybridization for molecular cytogenetic analysis of solid tumors. Science 258:818–821 [DOI] [PubMed] [Google Scholar]
- Kerangueven F, Allione F, Noguchi T, Adelaide J, Sobol H, Jacquemier J, Birnbaum D (1995) Patterns of loss of heterozygosity at loci from chromosome arm 13q suggests a possible involvement of BRCA2 in sporadic breast tumors. Genes Chromosomes Cancer 13:291–294 [DOI] [PubMed] [Google Scholar]
- Kerangueven F, Eisinger F, Noguchi T, Allione F, Wargniez V, Eng C, Padberg G, Theillet C, Jacquemier J, Longy M, Sobol H, Birnbaum D (1997) Loss of heterozygosity in human breast carcinomas in the ataxia telangiectasia, Cowden disease and BRCA1 gene regions. Oncogene 14:339–347 [DOI] [PubMed] [Google Scholar]
- Kiss H, Yang Y, Kiss C, Andersson K, Klein G, Imreh S, Dumanski JP (2002) The transcriptional map of the common eliminated region 1 (C3CER1) in 3p21.3. Eur J Hum Genet 10:52–61 [DOI] [PubMed] [Google Scholar]
- Kochetkova M, McKenzie OL, Bais AJ, Martin JM, Secker GA, Seshadri R, Powell JA, Hinze SJ, Gardner AE, Spendlove HE, O’Callaghan NJ, Cleton-Jansen AM, Cornelisse C, Whitmore SA, Crawford J, Kremmidiotis G, Sutherland GR, Callen DF (2002) CBFA2T3 (MTG16) is a putative breast tumor suppressor gene from the breast cancer loss of heterozygosity region at 16q24.3. Cancer Res 62:4599–4604 [PubMed] [Google Scholar]
- Kollias J, Man S, Marafie M, Carpenter K, Pinder S, Ellis IO, Blamey RW, Cross G, Brook JD (2000) Loss of heterozygosity in bilateral breast cancer. Breast Cancer Res Treat 64:241–251 [DOI] [PubMed] [Google Scholar]
- Kolodner RD, Putnam CD, Myung K (2002) Maintenance of genome stability in Saccharomyces cerevisiae. Science 297:552–557 [DOI] [PubMed] [Google Scholar]
- Komiya A, Suzuki H, Ueda T, Aida S, Ito N, Shiraishi T, Yatani R, Emi M, Yasuda K, Shimazaki J, Ito H (1997) PRLTS gene alterations in human prostate cancer. Jpn J Cancer Res 88:389–93. [DOI] [PMC free article] [PubMed] [Google Scholar]
- Kremmidiotis G, Baker E, Crawford J, Eyre HJ, Nahmias J, Callen DF (1998) Localization of human cadherin genes to chromosome regions exhibiting cancer-related loss of heterozygosity. Genomics 49:467–471 [DOI] [PubMed] [Google Scholar]
- Kwabi-Addo B, Giri D, Schmidt K, Podsypanina K, Parsons R, Greenberg N, Ittmann M (2001) Haploinsufficiency of the Pten tumor suppressor gene promotes prostate cancer progression. Proc Natl Acad Sci USA 98:11563–11568 [DOI] [PMC free article] [PubMed] [Google Scholar]
- Lange K, Boehnke M, Cox DR, Lunetta KL (1995) Statistical methods for polyploid radiation hybrid mapping. Genome Res 5:136–150 [DOI] [PubMed] [Google Scholar]
- Lasko D, Cavenee W, Nordenskjold M (1991) Loss of constitutional heterozygosity in human cancer. Annu Rev Genet 25:281–314 [DOI] [PubMed] [Google Scholar]
- Le Beau MM, Drabkin H, Glover TW, Gemmill R, Rassool FV, McKeithan TW, Smith DI (1998) An FHIT tumor suppressor gene? Genes Chromosomes Cancer 21:281–289 [DOI] [PubMed] [Google Scholar]
- Liu CX, Musco S, Lisitsina NM, Yaklichkin SY, Lisitsyn NA (2000) Genomic organization of a new candidate tumor suppressor gene, LRP1B. Genomics 69:271–274 [DOI] [PubMed] [Google Scholar]
- Lucke CD, Philpott A, Metcalfe JC, Thompson AM, Hughes-Davies L, Kemp PR, Hesketh R (2001) Inhibiting mutations in the transforming growth factor beta type 2 receptor in recurrent human breast cancer. Cancer Res 61:482–485 [PubMed] [Google Scholar]
- MacGrogan D, Levy A, Bova GS, Isaacs WB, Bookstein R (1996) Structure and methylation-associated silencing of a gene within a homozygously deleted region of human chromosome band 8p22. Genomics 35:55–65 [DOI] [PubMed] [Google Scholar]
- Mahoney PA, Weber U, Onofrechuk P, Biessmann H, Bryant PJ, Goodman CS (1991) The fat tumor suppressor gene in Drosophila encodes a novel member of the cadherin gene superfamily. Cell 67:853–868 [DOI] [PubMed] [Google Scholar]
- Maitra A, Wistuba, II, Washington C, Virmani AK, Ashfaq R, Milchgrub S, Gazdar AF, Minna JD (2001) High-resolution chromosome 3p allelotyping of breast carcinomas and precursor lesions demonstrates frequent loss of heterozygosity and a discontinuous pattern of allele loss. Am J Pathol 159:119–130 [DOI] [PMC free article] [PubMed] [Google Scholar]
- Matsuda S, Rouault J, Magaud J, Berthet C (2001) In search of a function for the TIS21/PC3/BTG1/TOB family. FEBS Lett 497:67–72 [DOI] [PubMed] [Google Scholar]
- Matsumoto S, Kasumi F, Sakamoto G, Onda M, Nakamura Y, Emi M (1997) Detailed deletion mapping of chromosome arm 3p in breast cancers: a 2-cM region on 3p14.3-21.1 and a 5-cM region on 3p24.3-25.1 commonly deleted in tumors. Genes Chromosomes Cancer 20:268–274 [PubMed] [Google Scholar]
- Milde-Langosch K, Bamberger AM, Rieck G, Kelp B, Loning T (2001) Overexpression of the p16 cell cycle inhibitor in breast cancer is associated with a more malignant phenotype. Breast Cancer Res Treat 67:61–70 [DOI] [PubMed] [Google Scholar]
- Mitelman F (2000) Recurrent chromosome aberrations in cancer. Mutat Res 462:247–253 [DOI] [PubMed] [Google Scholar]
- Murphy KM, Brune KA, Griffin C, Sollenberger JE, Petersen GM, Bansal R, Hruban RH, Kern SE (2002) Evaluation of candidate genes MAP2K4, MADH4, ACVR1B, and BRCA2 in familial pancreatic cancer: deleterious BRCA2 mutations in 17%. Cancer Res 62:3789–3793 [PubMed] [Google Scholar]
- Murphy LC, Wang M, Coutt A, Dotzlaw H (1996) Novel mutations in the estrogen receptor messenger RNA in human breast cancers. J Clin Endocrinol Metab 81:1420–1427 [DOI] [PubMed] [Google Scholar]
- Nagai H, Negrini M, Carter SL, Gillum DR, Rosenberg AL, Schwartz GF, Croce CM (1995) Detection and cloning of a common region of loss of heterozygosity at chromosome 1p in breast cancer. Cancer Res 55:1752–1757 [PubMed] [Google Scholar]
- Nathanson KL, Wooster R, Weber BL, Nathanson KN (2001) Breast cancer genetics: what we know and what we need. Nat Med 7:552–556 [DOI] [PubMed] [Google Scholar]
- Newsham IF, Hadjistilianou T, Cavenee WK (1997) Retinoblastoma. In: Vogelstein B, Kinzler KW (eds) The genetic basis of human cancer. McGraw-Hill, New York, pp 363–392 [Google Scholar]
- Newton MA, Gould MN, Reznikoff CA, Haag JD (1998) On the statistical analysis of allelic-loss data. Stat Med 17:1425–1445 [DOI] [PubMed] [Google Scholar]
- Newton MA, Lee Y (2000) Inferring the location and effect of tumor suppressor genes by instability-selection modeling of allelic-loss data. Biometrics 56:1088–1097 [DOI] [PubMed] [Google Scholar]
- Noviello C, Courjal F, Theillet C (1996) Loss of heterozygosity on the long arm of chromosome 6 in breast cancer: possibly four regions of deletion. Clin Cancer Res 2:1601–1606 [PubMed] [Google Scholar]
- Oesterreich S, Allredl DC, Mohsin SK, Zhang Q, Wong H, Lee AV, Osborne CK, O’Connell P (2001) High rates of loss of heterozygosity on chromosome 19p13 in human breast cancer. Br J Cancer 84:493–498 [DOI] [PMC free article] [PubMed] [Google Scholar]
- Olopade OI, Bohlander SK, Pomykala H, Maltepe E, Van Melle E, Le Beau MM, Diaz MO (1992) Mapping of the shortest region of overlap of deletions of the short arm of chromosome 9 associated with human neoplasia. Genomics 14:437–443 [DOI] [PubMed] [Google Scholar]
- Osborne RJ, Hamshere MG (2000) A genome-wide map showing common regions of loss of heterozygosity/allelic imbalance in breast cancer. Cancer Res 60:3706–3712 [PubMed] [Google Scholar]
- Ott J (1999) Analysis of human genetic linkage. Johns Hopkins University Press, Baltimore [Google Scholar]
- Ott L, Longnecker MT, Ott RL (2000) An introduction to statistical methods and data analysis. Brooks/Cole, London [Google Scholar]
- Parkin DM, Bray F, Ferlay J, Pisani P (2001) Estimating the world cancer burden: Globocan 2000. Int J Cancer 94:153–156 [DOI] [PubMed] [Google Scholar]
- Phillips NJ, Ziegler MR, Radford DM, Fair KL, Steinbrueck T, Xynos FP, Donis-Keller H (1996) Allelic deletion on chromosome 17p13.3 in early ovarian cancer. Cancer Res 56:606–611 [PubMed] [Google Scholar]
- Pollack JR, Sorlie T, Perou CM, Rees CA, Jeffrey SS, Lonning PE, Tibshirani R, Botstein D, Borresen-Dale AL, Brown PO (2002) Microarray analysis reveals a major direct role of DNA copy number alteration in the transcriptional program of human breast tumors. Proc Natl Acad Sci USA 99:12963–12968 [DOI] [PMC free article] [PubMed] [Google Scholar]
- Powell JA, Gardner AE, Bais AJ, Hinze SJ, Baker E, Whitmore S, Crawford J, Kochetkova M, Spendlove HE, Doggett NA, Sutherland GR, Callen DF, Kremmidiotis G (2002) Sequencing, transcript identification, and quantitative gene expression profiling in the breast cancer loss of heterozygosity region 16q24.3 reveal three potential tumor-suppressor genes. Genomics 80:303–310 [DOI] [PubMed] [Google Scholar]
- Rassool FV, Le Beau MM, Shen ML, Neilly ME, Espinosa R 3rd, Ong ST, Boldog F, Drabkin H, McCarroll R, McKeithan TW (1996) Direct cloning of DNA sequences from the common fragile site region at chromosome band 3p14.2. Genomics 35:109–117 [DOI] [PubMed] [Google Scholar]
- Richard F, Pacyna-Gengelbach M, Schl]uns K, Fleige B, Winzer KJ, Szymas J, Dietel M, Petersen I, Schwendel A (2000) Patterns of chromosomal imbalances in invasive breast cancer. Int J Cancer 89:305–310 [PubMed] [Google Scholar]
- Salicioni AM, Xi M, Vanderveer LA, Balsara B, Testa JR, Dunbrack RL Jr, Godwin AK (2000) Identification and structural analysis of human RBM8A and RBM8B: two highly conserved RNA-binding motif proteins that interact with OVCA1, a candidate tumor suppressor. Genomics 69:54–62 [DOI] [PubMed] [Google Scholar]
- Schuler GD (1997) Sequence mapping by electronic PCR. Genome Res 7:541–550 [DOI] [PMC free article] [PubMed] [Google Scholar]
- Seitz S, Poppe K, Fischer J, Nothnagel A, Estevez-Schwarz L, Haensch W, Schlag PM, Scherneck S (2001) Detailed deletion mapping in sporadic breast cancer at chromosomal region 17p13 distal to the TP53 gene: association with clinicopathological parameters. J Pathol 194:318–326 [DOI] [PubMed] [Google Scholar]
- Seitz S, Rohde K, Bender E, Nothnagel A, Kolble K, Schlag PM, Scherneck S (1997) Strong indication for a breast cancer susceptibility gene on chromosome 8p12-p22: linkage analysis in German breast cancer families. Oncogene 14:741–743 [DOI] [PubMed] [Google Scholar]
- Sham P (2001) Shifting paradigms in gene-mapping methodology for complex traits. Pharmacogenomics 2:195–202 [DOI] [PubMed] [Google Scholar]
- Shen CY, Yu JC, Lo YL, Kuo CH, Yue CT, Jou YS, Huang CS, Lung JC, Wu CW (2000) Genome-wide search for loss of heterozygosity using laser capture microdissected tissue of breast carcinoma: an implication for mutator phenotype and breast cancer pathogenesis. Cancer Res 60:3884–3892 [PubMed] [Google Scholar]
- Shinagawa T, Nomura T, Colmenares C, Ohira M, Nakagawara A, Ishii S (2001) Increased susceptibility to tumorigenesis of ski-deficient heterozygous mice. Oncogene 20:8100–8108 [DOI] [PubMed] [Google Scholar]
- Smith DI, Huang H, Wang L (1998) Common fragile sites and cancer (review). Int J Oncol 12:187–196 [PubMed] [Google Scholar]
- Stiewe T, Putzer BM (2002) Role of p73 in malignancy: tumor suppressor or oncogene? Cell Death Differ 9:237–245 [DOI] [PubMed] [Google Scholar]
- Strachan T, Read AP (1999) Human molecular genetics. Wiley-Liss, Hoboken, NJ [Google Scholar]
- Thompson D, Szabo CI, Mangion J, Oldenburg RA, Odefrey F, Seal S, Barfoot R, et al (2002) Evaluation of linkage of breast cancer to the putative BRCA3 locus on chromosome 13q21 in 128 multiple case families from the Breast Cancer Linkage Consortium. Proc Natl Acad Sci USA 99:827–831 [DOI] [PMC free article] [PubMed] [Google Scholar]
- Thompson SG (1998) Meta-analysis of clinical trials. In: Armitage P, Colton T (eds) Encyclopedia of biostatistics. Wiley, New York, pp 2570–2579 [Google Scholar]
- Tomlinson IP, Lambros MB, Roylance RR (2002) Loss of heterozygosity analysis: practically and conceptually flawed? Genes Chromosomes Cancer 34:349–353 [DOI] [PubMed] [Google Scholar]
- Toyooka KO, Toyooka S, Virmani AK, Sathyanarayana UG, Euhus DM, Gilcrease M, Minna JD, Gazdar AF (2001) Loss of expression and aberrant methylation of the CDH13 (H-cadherin) gene in breast and lung carcinomas. Cancer Res 61:4556–4560 [PubMed] [Google Scholar]
- Tran YK, Bogler O, Gorse KM, Wieland I, Green MR, Newsham IF (1999) A novel member of the NF2/ERM/4.1 superfamily with growth suppressing properties in lung cancer. Cancer Res 59:35–43 [PubMed] [Google Scholar]
- Utada Y, Haga S, Kajiwara T, Kasumi F, Sakamoto G, Nakamura Y, Emi M (2000) Mapping of target regions of allelic loss in primary breast cancers to 1-cM intervals on genomic contigs at 6q21 and 6q25.3. Jpn J Cancer Res 91:293–300 [DOI] [PMC free article] [PubMed] [Google Scholar]
- White GR, Stack M, Santibanez-Koref M, Liscia DS, Venesio T, Wang JC, Helms C, Donis-Keller H, Betticher DC, Altermatt HJ, Hoban PR, Heighway J (1996) High levels of loss at the 17p telomere suggest the close proximity of a tumour suppressor. Br J Cancer 74:863–870 [DOI] [PMC free article] [PubMed] [Google Scholar]
- Wilentz RE, Argani P, Hruban RH (2001) Loss of heterozygosity or intragenic mutation, which comes first? Am J Pathol 158:1561–1563 [DOI] [PMC free article] [PubMed] [Google Scholar]
- Yunis JJ, Soreng AL (1984) Constitutive fragile sites and cancer. Science 226:1199–1204 [DOI] [PubMed] [Google Scholar]
- Zenklusen JC, Conti CJ, Green ED (2001) Mutational and functional analyses reveal that ST7 is a highly conserved tumor-suppressor gene on human chromosome 7q31. Nat Genet 27:392–398 [DOI] [PubMed] [Google Scholar]