Abstract
Relative to genomes of other sequenced organisms, the human genome appears particularly enriched for large, highly homologous segmental duplications (⩾90% sequence identity and ⩾10 kbp in length). The molecular basis for this enrichment is unknown. We sought to gain insight into the mechanism of origin, by systematically examining sequence features at the junctions of duplications. We analyzed 9,464 junctions within regions of high-quality finished sequence from a genomewide set of 2,366 duplication alignments. We observed a highly significant (P<.0001) enrichment of Alu short interspersed element (SINE) sequences near or within the junction. Twenty-seven percent of all segmental duplications terminated within an Alu repeat. The Alu junction enrichment was most pronounced for interspersed segmental duplications separated by ⩾1 Mb of intervening sequence. Alu elements at the junctions showed higher levels of divergence, consistent with Alu-Alu–mediated recombination events. When we classified Alu elements into major subfamilies, younger elements (AluY and AluS) accounted for the enrichment, whereas the oldest primate family (AluJ) showed no enrichment. We propose that the primate-specific burst of Alu retroposition activity (which occurred 35–40 million years ago) sensitized the ancestral human genome for Alu-Alu–mediated recombination events, which, in turn, initiated the expansion of gene-rich segmental duplications and their subsequent role in nonallelic homologous recombination.
Introduction
Segmental duplications play important roles in human genome evolution and disease (Eichler 2001; Mefford and Trask 2002; Stankiewicz and Lupski 2002). These duplications (also termed “duplicons” or “low-copy repeat sequences”) involve duplicative transposition of apparently normal genomic DNA, often containing genes and smaller repetitive elements. It has been found that ∼5%–6% of the human genome sequence has been duplicated within the past 40 million years, when sequences that are ⩾90% identical are considered (Bailey et al. 2002). Once initially formed, segmental duplications promote further rearrangement through their own misalignment (Eichler 2001) and subsequent nonallelic homologous recombination (Stankiewicz and Lupski 2002). This has led to the formation of rapidly evolving regions of complex genomic architecture (Horvath et al. 2000; Shaikh et al. 2000; Mefford et al. 2001; Crosier et al. 2002; DeSilva et al. 2002), which are frequently associated with recurrent chromosomal structural rearrangements.
Comparisons of segmental duplication among sequenced organisms reveal three nearly unique aspects of human genome architecture (Bailey et al. 2001, 2002; International Human Genome Sequencing Consortium [IHGSC] 2001). (1) The human genome is significantly enriched for large (>10 kb) blocks of segmental duplication, as compared with other sequenced genomes (IHGSC 2001; Samonte and Eichler 2002). (2) Human segmental duplications are biased toward genic sequences and are distributed most often in an interspersed fashion (separated by ⩾1 Mb of intervening sequence), as opposed to being tandemly clustered (Bailey et al. 2002; Hillier et al. 2003). (3) The duplicated bases exhibit a high degree of sequence identity (>94%), consistent with an expansion early in hominoid evolution (Samonte and Eichler 2002). Several hypotheses, including selection, population history, and genomic structure, have been put forward to explain these properties; however, to date, no common sequence features have been identified for segmental duplications (Inoue and Lupski 2002). Anecdotal reports have suggested a variety of possible mediating sequence features from GC-rich and AT-rich repeats and satellite sequences (Eichler et al. 1996, 1999; Guy et al. 2000). Although these observations certainly point to multiple mechanisms as well as to stochastic factors, a comprehensive study of the sequence features of segmental duplications and their junctions has not been attempted. Here, we systematically examine a genomewide set of segmental duplications, to gain insight into common sequence features that might explain the mechanism, origin, and unique properties of this aspect of human genome architecture.
Material and Methods
Pairwise Alignment End Point Detection
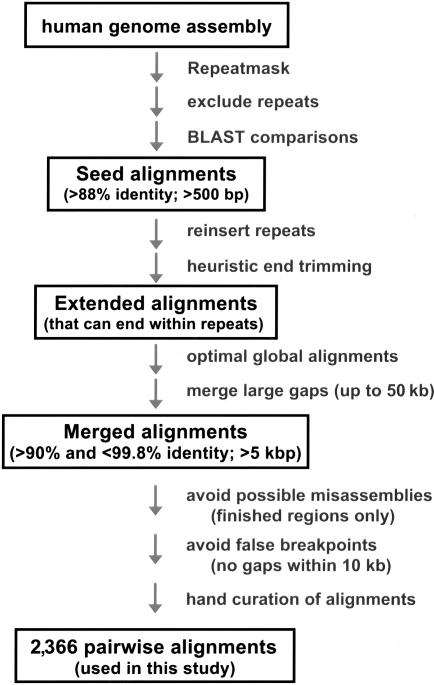
To detect segmental duplications in the draft genome (National Center for Biotechnology Information Genome Assembly, build 30), we applied our previously described method (Bailey et al. 2001), which is designed to accurately delineate end points or junctions of segmental duplications despite the presence of large deletions or insertions. In brief, the method consists of excising the high-copy repeats (short interspersed elements [SINEs], long interspersed elements [LINEs], long terminal repeats [LTRs], etc.) identified by RepeatMasker, followed by an initial whole-genome BLAST comparison of the putatively unique DNA, to detect seed alignments (fig. 1). The initial exclusion of repeat sequences significantly reduces the complexity of the analysis by eliminating “spurious” alignments that would occur as a result of high-copy repeats. It also allows for the more effective treatment of gaps that may be created because of lineage-specific insertions. Once the seed alignments are established, then the common repeats are reinserted, optimal global alignments are constructed, and heuristic end trimming is performed to more precisely identify the junction (fig. 1). Alignment end trimming is a reiterative extension process (see the appendix [online only] for details). This procedure allows for the correction of suboptimal BLAST alignments and for the extension of the alignment when the true junction resides in common repeat sequence. Once the two end points are identified for each pairwise alignment, a final full-length optimal global alignment is constructed. To recover complete segmental duplications, adjacent global alignments were further merged to traverse extremely large insertions/deletions (as large as 50 kb)—although only the aligned portions were used for statistics. Alignments with ⩾90% identity were retained for further segmental duplication analysis.
Figure 1.
Flowchart for the characterization of segmental duplication junctions. An overview of the strategy to identify human segmental duplications and the characterization of their junctions is presented. In brief, seed alignments were established on the basis of a whole-genome alignment comparison of the human sequence assembly (build 30). Junctions were identified by heuristically extending these alignments until the optimal end point of the alignment was identified. A total of 2,366 optimal global alignments with <99.8% and >90.0% sequence identity and that were >5 kb in length were retained in this analysis. All junctions were hand curated and visually inspected using the program Miropeats. See the “Material and Methods” section and the appendix (online only) for a more detailed description and for the precise in silico parameters used in this analysis.
To test the accuracy of this end-trimming procedure, we analyzed a test set of human sequences that contained known duplications with experimentally verified junctions (Bailey et al. 2001). This set consisted of sequence alignments that ranged from 88% to 99% nucleotide identity and contained insertions/deletions as large as 1,250 nts. All junctions for this test set were previously confirmed by resequencing and hand curation. Examination of the 23 alignments returned by our method found that 41 of the 46 alignment end positions were in complete agreement with those previously determined. The five cases that disagreed with previous alignments were ambiguous, such that alternate boundaries were equally valid.
For the purpose of this study, we selected large, nonidentical alignments (⩽99.8% sequence identity and ⩾5 kbp in length) located only within high-quality finished regions of the genome assembly (2,451 Mb). A total of 4,072 alignments met these criteria, which helped to eliminate uncharacterized transposable elements and false junctions due to misassembly of the draft sequence. False junctions are particularly prevalent within duplicated regions of the genome. We further required a minimum distance of 10 kb of finished sequence between any junction and sequence/assembly gap, to avoid premature alignment truncations due to absent sequence within the gap. For the subset of segmental duplications with highly similar pairwise sequence identity (⩾98%), we selected only those that had been verified by a second assembly-free method based on overrepresentation of whole-genome shotgun sequence reads (Bailey et al. 2002). Duplications lacking evidence of overrepresentation were removed as probable assembly errors. As a final confirmation of the position of each junction, we visually inspected the sequence 10 kb beyond each alignment through use of Miropeats, a graphical sequence alignment tool that can detect and display weak sequence similarities (Parsons 1995). We reassessed those in which the junction was inconsistent with our end-trimming procedure and excluded those that were indecipherable (such as in highly tandem repeat regions). The resulting 2,366 pairwise alignments (9,464 junction sequences) were then analyzed for enrichment. It should be noted that, although our analysis was restricted to a refined subset of the best alignments, similar enrichments were observed when using the less controlled data set. Within the 2,366–pairwise alignment set, there were an equivalent number of interchromosomal (1,197) and intrachromosomal (1,169) alignments. As noted elsewhere (Bailey et al. 2002), alignments represent surrogates for the duplication events themselves. Alignments for sequences that are highly active—that is, duplicated multiple times—may be overrepresented. However, such biases serve to enrich our analysis for older events—the possible initiating events—which frequently tend to be duplicated.
Examination of Junction Enrichment
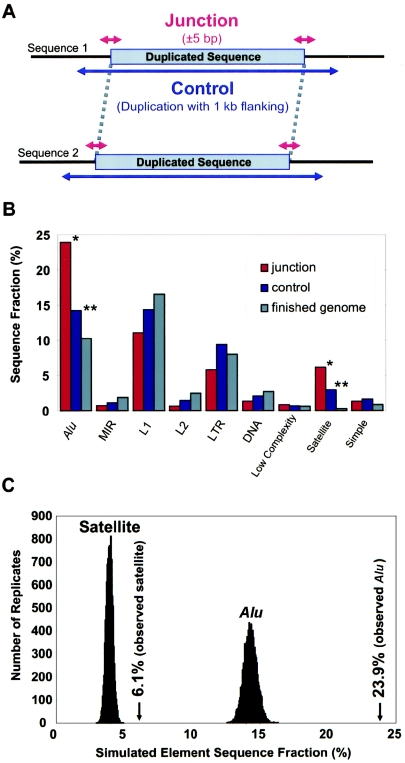
A series of Perl scripts were written to rapidly determine and analyze the junction content of segmental duplications. For each alignment, we defined the junction sequences as the sequence interval spanning ±5 bp of the alignment end points (fig. 2A). We avoided a more exacting definition, since the alignment end point will not always precisely mark the biological junction, because of chance nucleotide matches within the nonhomologous flanking sequence. We defined an internal control comprised of sequence from the pairwise alignment plus 1 kb of flanking sequence from either side of the alignment, to allow for possible sequence biases due to the type of sequence duplicated or the general region of integration (fig. 2A). Common repeats and GC content were analyzed using sensitive settings of RepeatMasker (RepeatMasker Server Home Page) and in-house Perl scripts. Based on the requirement that alignments be seeded in putatively unique (nonmasked) regions, the a priori expectation was a decreased number of repeats within the alignments and, consequently, the control regions.
Figure 2.
Junction analysis. A, Diagram representing a typical sequence alignment and the junction and control regions considered in the analysis. For each alignment, the sequence content of the four junction intervals (red) (10-bp windows centered at the alignment end points) was compared with the control sequence (blue) (duplicated sequence ±1 kb flanking sequence). The overall fraction of bases for any given sequence feature (repeat, GC content, etc.) was calculated over all 2,366 alignments. B, Histogram comparing the repeat content of the junction with the control region as well as the average finished genome. Repeat content is measured as a total fraction of analyzed bases. Significant differences (P<.0001) were observed for Alu and satellite repeats in terms of both junction versus control (*) and control versus finished genome (**). A more refined analysis of the specific subfamilies is available in table A (online only). C, We performed simulation studies to determine the significance of the observed enrichments compared with the control sequence by randomly sampling control sequence (see the “Material and Methods” section). The maximum simulated values were 16.3% for Alu and 4.9% for satellite repeats. For 10,000 replicates, no Alu replicates (maximum 11.0%) exceed the observed Alu fraction of 14.2% (P<.0001), and no satellite replicates (maximum 1.2%) exceeded the observed satellite fraction of 3.0% (P<.0001).
We assessed Alu junction enrichment by two measures (fig 2B; table A [online only]). We computed the total percentage of Alu repeat sequence in 10-bp windows for all 9,464 junctions (±5 bp bracketing the end point [see above]). We also calculated the observed number of Alu repeat elements identified at the junctions. To assess the specificity of the enrichment, we also calculated Alu content in 10-bp moving windows traversing from flanking to duplicated sequence (fig. 3).
Table A.
Relative Repeat Abundance and GC Content of Major Repeat Classes within Junction Sequence[Note]
|
Sequence |
Enrichment |
|||||
| Junction |
||||||
| Repeat Classa | Fraction | No. | Control Fraction | Finished Fraction | Junction vs. Control Ratio | Junction vs. Finished Ratio |
| Repetitive repeats: | ||||||
| SINE: | 24.6 | 2,680 | 15.3 | 12.1 | 1.6 | 2.0 |
| Alu | 23.9b | 2,525 | 14.2c | 10.3 | 1.7b | 2.3 |
| MIR | .7 | 85 | 1.1 | 1.9 | .6 | .4 |
| LINE: | 11.9 | 1,399 | 15.9 | 19.2 | .7 | .6 |
| L1 | 11.0 | 1,304 | 14.3 | 16.5 | .8 | .7 |
| L2 | .6 | 68 | 1.4 | 2.5 | .4 | .3 |
| LTR: | 5.8 | 730 | 9.4 | 8.0 | .6 | .7 |
| ERVL | .8 | 92 | .9 | 1.3 | .9 | .6 |
| ERVK | .8 | 119 | 1.0 | .3 | .8 | 2.5 |
| ERV1 | 2.9 | 371 | 4.8 | 2.9 | .6 | 1.0 |
| MaLR | 1.2 | 147 | 2.6 | 3.5 | .5 | .4 |
| DNA: | 1.3 | 147 | 2.1 | 2.7 | .6 | .5 |
| MER1 type | .4 | 44 | .9 | 1.2 | .4 | .3 |
| MER2 type | .8 | 87 | .9 | 1.0 | .9 | .8 |
| Low complexity | .8 | 89 | .7 | .6 | 1.2 | 1.3 |
| Other | .1 | 13 | .2 | .1 | .5 | .7 |
| Satellite | 6.1b | 616 | 3.0c | .3 | 2.1b | 21.9 |
| Simple repeat | 1.3 | 149 | 1.6 | .9 | .8 | 1.5 |
| Total repetitive | 52.0 | 5,829 | 48.2 | 44.0 | 1.1 | 1.2 |
| GC Content | 44.5 | … | 43.9 | 40.6 | … | … |
Note.— A total of 2,366 alignments (9,464 junction positions) with 90%–99.8% sequence identity and length ⩾5 kb. The junction fraction was calculated as the average repeat content within the 9,464 junctions, each 10 bp in size, for a total of 94,640 bp of sequence. Control regions were defined as the duplicated sequence plus 1 kb of flanking sequence and totaled 108,720,232 bp of sequence. The control fraction, therefore, represented the repeat content within the duplicated portion of the genome. The finished fraction considered the repeat content within the finished portion of the human genome assembly (build 30). The enrichment compares the relative repeat content of the junction to the control or finished regions of the genome.
MIR = mammalianwide interspersed repeat; ERV = endogenous retrovirus; MER = medium-reiteration frequency sequence; MaLR = mammalian LTR retrosequence.
P<.0001, by random sampling of control regions (10,000 replicates; maximum simulated fraction 16.3% for Alu and 4.9% for satellite).
P<.0001, by random sampling of finished regions compared with the duplicated control regions.
Figure 3.
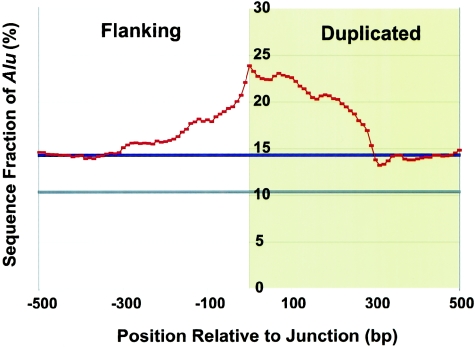
Specificity of Alu junction enrichment. The average fraction of Alu sequence was computed in 10-bp windows for all 9,464 junctions. Junctions were oriented from external flanking sequence (white) to duplicated sequence (yellow). The X-axis represents base-pair position with respect to the junction point set at 0 (positive values are located internal to the junction, whereas negative values represent extension into flanking sequence). The greatest enrichment occurs specifically at the junction (23.9%) and dissipates within 300 bp (the size of an Alu repeat) on either side of the junction. This effect is asymmetric, with a more gradual bias observed within the duplicated portion of the alignment. Control (blue) and finished genome (gray) averages are shown as bold horizontal lines.
Assessing Enrichment Significance
To estimate the probability that our observed enrichments were due to chance, we randomly sampled a 10-bp window from the control sequence to create a simulated junction (fig. 2C; table A [online only]). We conservatively simulated two junctions per alignment (one for each control sequence) instead of four, since all four junction sequences are not independent—the sequence internal to the alignment is the same in both copies. For each replicate, we computed the overall fraction of Alu or satellite sequence at the simulated junctions for all 2,366 alignments. A simulated fraction that met or exceeded the observed base pair fraction would suggest a chance occurrence. Similarly, to assess the significance of the Alu and satellite enrichment in the control sequence compared with the finished genome, we randomly chose a single simulated control region drawn from the finished portion of the genome for each of the 2,366 alignments. We conservatively used the size of the smaller control region in any given pairwise alignment rather than both, since the sequences in a pairwise alignment are duplicated and therefore nonindependent.
Alu Junction Divergence
To assess the potential influence of Alu-Alu–mediated recombination in the formation of segmental duplications, we compared the divergence of Alu elements located at the junction of the alignments with the divergence of Alus internal to the alignment (fig. 4A). If Alu-Alu–mediated recombination events were occurring, a markedly increased rate of Alu divergence would be observed for junction Alus when compared with internal Alus. For this analysis, CpG dinucleotides were excluded, to eliminate known mutation bias, and only Alus ⩾250 bp were compared. Optimal alignments for both internal and junction Alu repeats were constructed, and sequence divergence was estimated using Kimura’s two-parameter model for genetic distance. Two different analyses were performed. First, we examined the divergence of junction and internal Alu alignments as compared with the divergence of the segmental duplication (fig. 4A). Next, we performed a pairwise analysis in which junction and internal Alu alignments were compared specifically within each of the 2,366 pairwise alignments (fig. 4B). The pairwise difference (KjunctionAlu-KinternalAlu) between the junction Alu alignment and each internal Alu alignment was calculated and binned. A significant positive skewing was observed, irrespective of the degree of sequence identity of the alignment, arguing against methodological bias for this procedure. As a control for this analysis and to provide an estimate of the expected variance, we calculated a similar pairwise difference based solely on internal Alu repeat comparisons, KinternalAlu1-KinternalAlu2. The two distributions were significantly different, with a large degree of positive skewing noted for comparisons involving junction Alus (KjunctionAlu-KinternalAlu).
Figure 4.
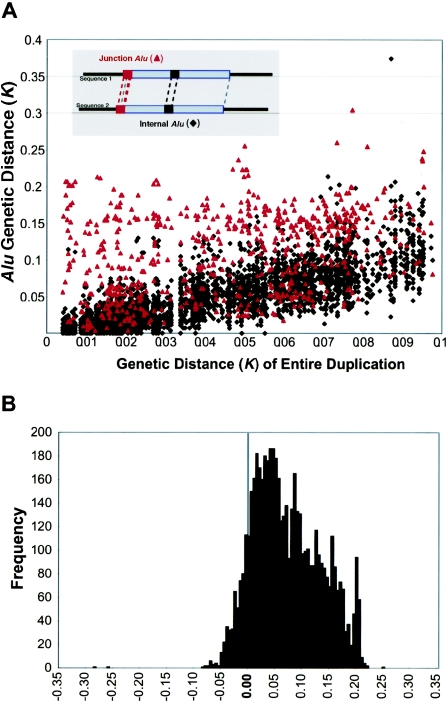
Divergence of junction Alus. A, The sequence divergence of the segmental duplication (X-axis) is compared with the divergence of Alu repeats (Y-axis) for Alu repeats located internal to the pairwise alignment (black triangles) and Alu repeats localized at the junction (red triangles). Kimura’s two-parameter model of genetic distance (in changes/bp) is used as an estimate of divergence excluding CpG dinucleotides. Junction Alu repeats demonstrate an increased divergence relative to internal Alus. B, The pairwise differences in divergence between the junction Alus and each control Alu were calculated for each alignment (KjunctionAlu-KinternalAlu) (see the “Material and Methods” section). The alignment of the full-length Alu repeat element located at the junction, and not simply the Alu portion within the overall genomic alignment, was considered in this analysis. This measure shows a highly skewed positive distribution, with nearly 60% of all pairwise differences demonstrating a significant departure from that of an expected distribution (fig. B [online only]; >1 SD, based on a distribution of the difference between all possible combinations of internal Alu alignments).
Alu Subfamily Analysis
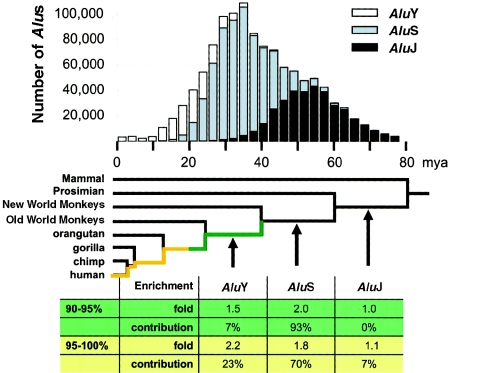
We filtered the RepeatMasker output to determine the position, subfamily, and nucleotide divergence from consensus for each Alu element within the build 30 genome assembly. The RepeatMasker sequence divergence was corrected for multiple substitutions through use of Kimura’s two-parameter model (K), and the estimated insertion age (T=K/R) was calculated using a rate (R=1.8×10⁻⁹ substitutions/year) based on observed Alu divergence rates between orthologous primate BAC sequences (Liu et al. 2003). The estimated age of an individual Alu insertion is only an approximation, because of the short length of the alignment (300 bp), which increases the variation of the estimate of evolutionary age. Nevertheless, an analysis of thousands of repeats from a given Alu subfamily provides a good approximation of the timing of major bursts of Alu transposition. In this analysis, only the major subfamilies AluJ, AluS, and AluY were considered (fig. 5, top). The enrichment contribution for a major subfamily (fig. 5, bottom) was the proportion of the overall Alu junction enrichment compared with control accounted for by the given major subfamily.
Figure 5.
Alu subfamily enrichment. The histogram depicts all Alu elements within the genome assembly (build 30), with shades designating their major subfamily, binned on the basis of their estimated ages of insertion (see the “Material and Methods” section). On the basis of this analysis, a significant burst in Alu (AluS) activity is predicted to have occurred 35–40 mya, consistent with results of previous studies (Shen et al. 1991; Kapitonov and Jurka 1996; Batzer and Deininger 2002). A generally accepted primate phylogeny (Goodman 1999) is superimposed with the estimated evolutionary age of the major primate Alu subfamilies. On the basis of neutral rates of evolution, the duplications and/or gene conversion events are estimated to have occurred <40 million years ago. A comparison of Alu subfamily and segmental duplication junctions shows that the AluS subfamily is responsible for the vast majority of the overall enrichment. When the enrichment is broken down in terms of younger (90%–95% identity) and older (95%–100% identity) duplications, the relative enrichment in younger duplications increases for AluY and decreases for AluS. This is consistent with the idea that the degree of sequence homology may play a role in mobilizing segmental duplications.
Primate Genomic Comparisons
To model the frequency and the pattern of repeat-associated insertion/deletion events within genomic DNA, we analyzed 9.2 Mb of high-quality alignments (determined by a memory-optimized Needleman-Wunsch algorithm) of orthologous sequence from human, chimpanzee, and baboon (Liu et al. 2003). Each alignment was cross-referenced with the RepeatMasker output, to identify insertion/deletion events >100 bases in length that were flanked on both sides by repetitive elements. Such alignments are putative sites of repeat-repeat–mediated deletion. These insertion/deletions and associated repeats were examined visually through use of PARASIGHT (J.A.B., unpublished), to identify apparent deletion events consistent with repeat-mediated recombination. No putative repeat-repeat–mediated insertion or deletion events were detected within 4.9 Mb of chimpanzee-human alignments. A total of nine Alu-Alu–mediated and six L1-L1–mediated recombination events were identified on the basis of the analysis of 4.8 Mb of aligned baboon and human genomic DNA. Deletion rates per megabase of sequence were calculated on the basis of the accepted divergence time, of 25 million years ago (mya), for the human and baboon lineages (Goodman 1999).
Results and Discussion
Here we examine a genomewide set of segmental duplications for common sequence features that might explain the mechanism, origin, and unique properties of this duplication architecture. Using methods described elsewhere (Bailey et al. 2001), we identified all pairwise alignments (⩾90% identity) within the human genome representing recent duplication. For this analysis, we considered a subset of all possible alignments in which the segmental duplications were large (⩾5 kb in length), in which the junctions could be verified using a second method, and in which alignments were embedded in high-quality finished sequence without gaps. A total of 2,366 alignments from the 12,049 met these conservative criteria. From these, we analyzed a curated set of 9,464 junctions (fig. 2A; fig. A [online only]; see the “Material and Methods” section) for a variety of sequence properties.
Figure A.
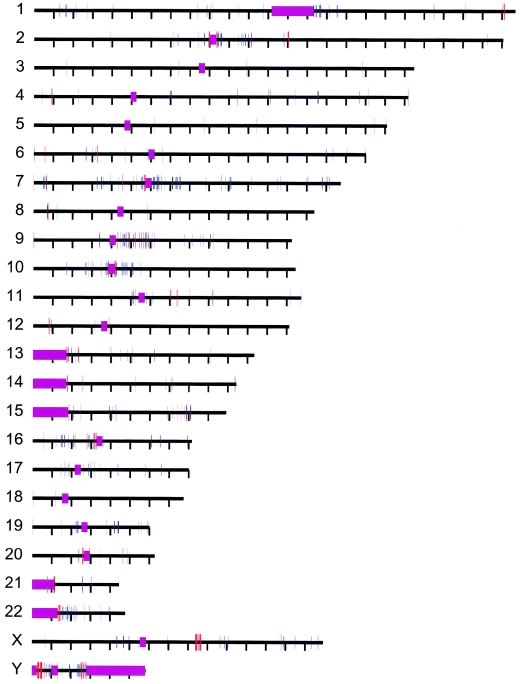
Distribution of 2,366 alignments analyzed. The positions of interchromosomal (red) and intrachromosomal (blue) duplications are shown. Alignments are distributed across all chromosomes. Purple regions represent unsequenced acrocentric p-arm and centromeric sequence.
During our analysis, we noticed that segmental duplications were enriched for Alu SINEs and were deficient in L1 repeats when compared with the genome average (fig. 2B; table A [online only]). When we examined the alignment junctions, the effect became even more pronounced. Alu content at the junction was enriched (23.9%) compared with the control regions (14.2%) and the finished genome average (10.3%). In terms of the number of junctions, nearly 27% of all segmental duplications (2,525/9,464 junctions) terminated within Alus. Of the four assayable junctions, all possible combinations and orientations of Alu repeats were observed. The majority (1,516/2,525) showed Alu repeat sequences only on one side of the alignment, suggesting an asymmetrical distribution (see table B [online only]). All other major repeat classes showed a decreased representation at the junctions, with the exception of satellite repeats HSATII, GSAT, and TAR1, which demarcated the termini of ∼7% (616/9,464) of the junctions. This is consistent with their known pericentromeric and subtelomeric bias (Horvath et al. 2000), associated with interchromosomal duplications. To assess whether the observed enrichments occurred by chance, we simulated an expected mean repeat content by randomly sampling sequence from the control regions and computing the base-pair fraction for each (fig. 2C; see the “Material and Methods” section). For both Alu and satellite repeats, the enrichments were highly significant (P<.0001; fig. 2C; table A [online only]).
Table B.
Positional Pattern of Alus within Sampled Junction Sequence[Note]
|
Presence/Absence of Alu in |
||||
| Junction 1 |
Junction 2 |
|||
| No. of Alignments (N=2,366) | Sequence 1 | Sequence 2 | Sequence 1 | Sequence 2 |
| 1,152 | − | − | − | − |
| 318 | + | − | − | − |
| 599 | + | + | − | − |
| 26 | + | − | + | − |
| 15 | + | − | − | + |
| 97 | + | + | + | − |
| 159 | + | + | + | + |
Note.— For each alignment, the four sampled junction sequences (10 bp centered at the alignment end point) are scored for the presence or absence of Alu and binned into seven categories. Since the direction of the duplication event is unknown, sequence 1 and junction 1 were arbitrarily defined as those with the greatest Alu content.
We further analyzed the Alu enrichment by considering various sequence properties of the duplications themselves (tables C, D, E, and F [online only]). For intrachromosomal duplications, we considered the intervening distance between duplicate copies (table 1). In light of the known involvement of Alus in tandem duplications (Lehrman et al. 1987; Hu et al. 1991; Deininger and Batzer 1999), there was a threefold enrichment for clustered duplications (spanning 0–1 kb in length). For small spans (1–100 kb), little enrichment was observed. The greatest absolute enrichment was observed for segmental duplications separated by >1 Mb of intervening sequence (table 1), suggesting an association between Alus and long-range transposition events.
Table C.
Alu and Satellite Junction Enrichment by Chromosomal Location[Note]
|
Interchromosomal |
Intrachromosomal |
|||||||
| Junction |
Junction |
|||||||
| Repeat Type | Fraction(%) | No. | Control Fraction(%) | Enrichment | Fraction(%) | No. | Control Fraction(%) | Enrichment |
| Alu | 20.9 | 579 | 11.5 | 1.8-fold | 27.5 | 653 | 17.0 | 1.6-fold |
| Satellite | 10.7 | 278 | 4.9 | 2.2-fold | 1.5 | 44 | 1.0 | 1.5-fold |
Note.— Alignments were divided into those duplicated between chromosomes (interchromosomal) and those duplicated within a chromosome (intrachromosomal). The junction and control fraction were calculated separately for each type of duplication. The enrichment compares the relative repeat content of the junction with those of the control regions.
Table D.
Alu and Satellite Junction Enrichment, by Size of Duplication[Note]
|
Alu |
Satellite |
||||||||
| Junction |
Junction |
||||||||
| Alignmenta(kb) | N | Fraction(%) | No. | Control Fraction(%) | Enrichment | Fraction(%) | No. | Control Fraction(%) | Enrichment |
| 5 to <10 | 865 | 21.7 | 439 | 12.6 | 1.7-fold | 6.5 | 130 | 3.9 | 1.7-fold |
| 10 to <20 | 340 | 31.4 | 220 | 17.7 | 1.8-fold | 1.8 | 12 | 2.5 | .7-fold |
| 20 to <30 | 834 | 26.1 | 429 | 14.6 | 1.8-fold | 8.5 | 149 | 5.7 | 1.5-fold |
| 30 to <40 | 103 | 21.3 | 52 | 14.8 | 1.4-fold | 3.5 | 11 | 2.0 | 1.7-fold |
| 40 to <50 | 90 | 22.5 | 47 | 17.2 | 1.3-fold | 2.7 | 6 | .6 | 4.4-fold |
| 50+ | 134 | 13.0 | 45 | 11.2 | 1.2-fold | 3.9 | 14 | .7 | 5.3-fold |
Note.— The junction and control fraction were calculated separately for each bin, as described in table A (online only). For example, the control fraction for the 10–20-kb alignment considered the repeat content within this size range and ±1 kb of flanking sequence. The enrichment compares the relative repeat content of the junction with those of the control regions.
Categorized on the basis of length, in 5-kb increments.
Table E.
Alu and Satellite Junction Enrichment by Percent Identity of Alignment[Note]
|
Sequence Identity |
||||||||||||||||||||
| 90% to <92% |
92% to <94% |
94% to <96% |
96% to <98% |
98% to 100% |
||||||||||||||||
| Junction |
Junction |
Junction |
Junction |
Junction |
||||||||||||||||
| Repeat | Fraction(%) | No. | Control Fraction(%) | Enrichment | Fraction(%) | No. | Control Fraction(%) | Enrichment | Fraction(%) | No. | Control Fraction(%) | Enrichment | Fraction(%) | No. | Control Fraction(%) | Enrichment | Fraction(%) | No. | Control Fraction(%) | Enrichment |
| Alu | 26.3 | 252 | 14.8 | 1.8-fold | 22.4 | 282 | 12.5 | 1.8-fold | 17.1 | 268 | 11.1 | 1.6-fold | 30.1 | 310 | 16.2 | 1.9-fold | 31.7 | 120 | 17.4 | 1.8-fold |
| Satellite | 7.2 | 67 | 5.1 | 1.4-fold | 12.2 | 146 | 8.0 | 1.5-fold | 5.6 | 88 | 2.5 | 2.2-fold | 1.1 | 19 | .6 | 1.7-fold | .3 | 2 | .3 | 1.0-fold |
Note.— Alignments were categorized on the basis of the percent sequence identity. The junction and control fraction were calculated separately for each category of percent-identity, essentially as described in table A (online only). The enrichment compares the relative repeat content of the junction with those of the control regions.
Table F.
Junction Enrichment by Alu Subfamily[Note]
|
Sequence Identity |
|||||||||||||||
| 90% to <95% |
95% to 100% |
90% to 100% |
|||||||||||||
| Junction |
Junction |
Junction |
|||||||||||||
| Alu Subfamily | Fraction(%) | No. | Control Fraction(%) | Enrichment | Relative Fraction(%) | Fraction(%) | No. | Control Fraction(%) | Enrichment | Relative Fraction(%) | Fraction(%) | No. | Control Fraction(%) | Enrichment | Relative Fraction(%) |
| AluJ | 2.7 | 98 | 2.7 | 1.0-fold | 0 | 3.9 | 137 | 3.2 | 1.2-fold | 7 | 3.2 | 235 | 3.0 | 1.1-fold | 3 |
| AluS | 17.0 | 510 | 8.3 | 2.0-fold | 93 | 17.1 | 392 | 9.7 | 1.8-fold | 70 | 17.0 | 902 | 9.1 | 1.9-fold | 84 |
| AluY | 1.8 | 115 | 1.2 | 1.5-fold | 7 | 4.3 | 150 | 2.0 | 2.2-fold | 23 | 2.9 | 265 | 1.7 | 1.8-fold | 13 |
Note.— Control regions are as described in table A (online only). Enrichment of junction and control regions was categorized by Alu repeat subfamily and by the degree of sequence identity of the underlying alignments. We examined a total of 1,342 alignments with 90%–95% sequence identity and 1,024 with 95%–100% sequence identity. The relative fraction of each subfamily is the proportion of the total Alu enrichment for which that family contributes. Alu S repeat elements constitute the majority (80%–90%) of the Alu enrichment.
Table 1.
Span between Intrachromosomal Pairwise Sequences
|
Fraction(%) |
Enrichmentb |
||||
| Spana | No. ofAlignments | Junction | Control | Relative | Absolute |
| 0 to <1 kb (tandem) | 25 | 22.9 | 7.6 | 3.0-fold | .15 |
| 1 to <10 kb | 32 | 15.0 | 12.3 | 1.2-fold | .03 |
| 10 to <100 kb | 154 | 16.5 | 11.3 | 1.5-fold | .05 |
| 100 kb to <1 Mb | 273 | 22.1 | 15.2 | 1.5-fold | .07 |
| 1 to <10 Mb | 360 | 32.3 | 18.2 | 1.8-fold | .14 |
| 10 to <100 Mb | 304 | 35.3 | 21.7 | 1.6-fold | .14 |
| 100 Mb+ | 21 |
9.8 | 8.2 | 1.2-fold | .02 |
| Total | 1,169 | 27.5 | 17.0 | 1.6-fold | .11 |
Span is the intervening amount of sequence between the pairwise copies of an alignment binned on a log base 10 scale. The junction fraction was calculated as the average base-pair repeat content for all junctions (±5 bp from the end point of the alignment) within the specified span. Control regions were defined as the duplicated sequence plus 1 kb of flanking sequence. The control fraction, therefore, represented the repeat content within the duplicated portion of the genome.
Relative enrichment is ratio of junction fraction over control fraction. Absolute enrichment is the junction minus control fraction.
Alu is a primate-specific 300-bp retroposon (Houck et al. 1979) and is the most abundant human repeat (IHGSC 2001), with a preference for GC-rich, gene-rich environments (Korenberg and Rykowski 1988). Alu-mediated rearrangement events have long been recognized as a common source of local deletion and duplication events associated with human genetic disease (Calabretta et al. 1982; Deininger and Batzer 1999). These properties and the highly significant association with the boundaries of segmental duplication suggest that Alus may play a mechanistic role in the origin and expansion of primate segmental duplications.
To further test this hypothesis, we examined the specificity and distribution of Alus at the junctions more precisely. We oriented all the junctions from flanking to duplicated sequence and calculated the Alu content in 10-bp windows across the junction (fig. 3). The peak enrichment occurs precisely at the junction point, dropping to control averages within ∼300 bp on either side (i.e., the length of an Alu). It is interesting that the enrichment is asymmetrical, with the duplicated portion (internal to the junction) showing greater enrichment. This asymmetry is consistent with the possibility of Alu-Alu–mediated recombination events facilitating duplication.
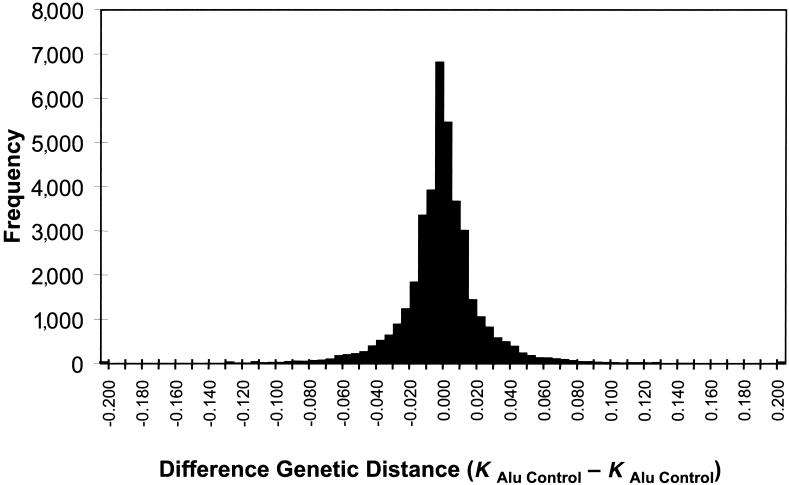
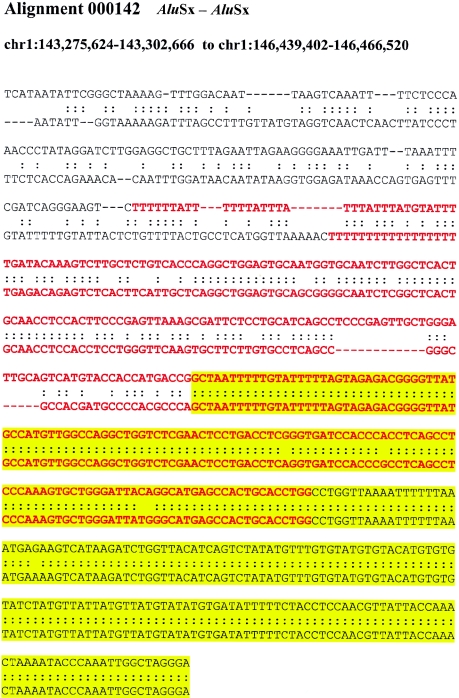
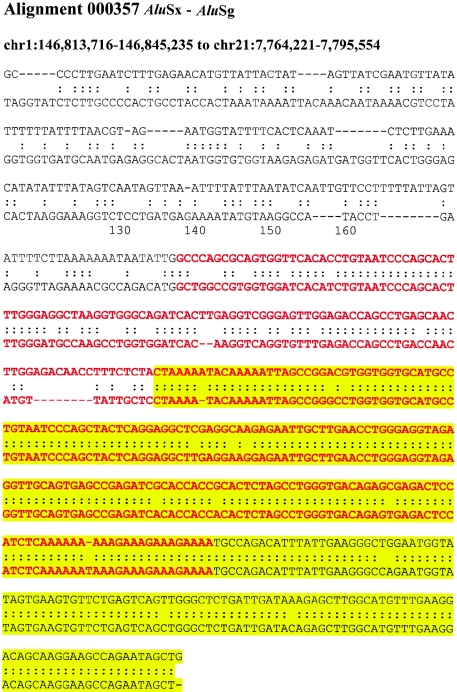
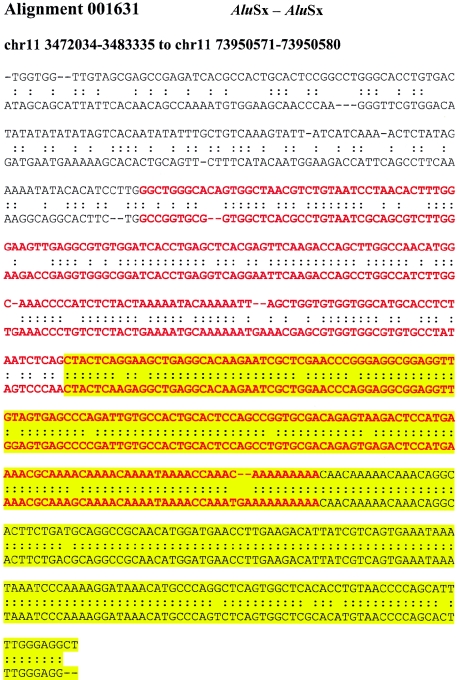
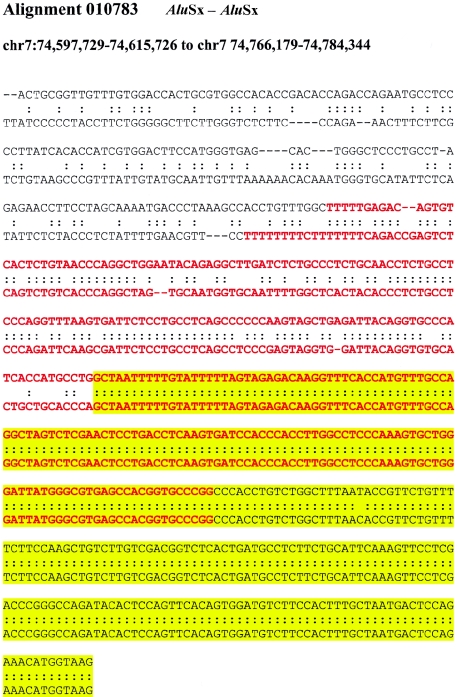
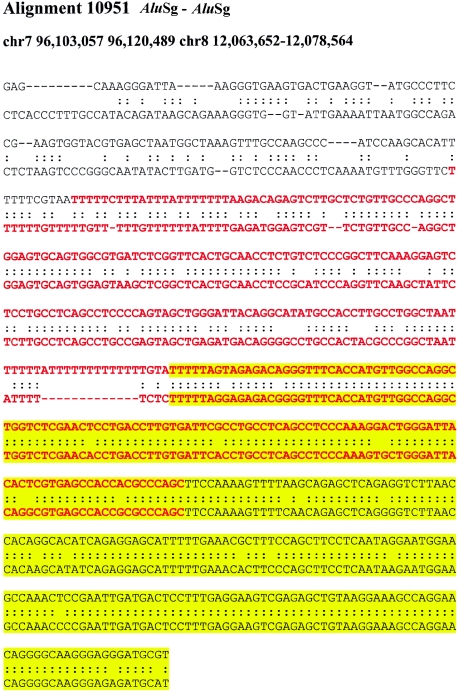
If recombination occurred between highly similar Alus, the alignments would tend to extend through the Alu, creating full-length “mosaic” elements at the alignment termini. Such a sequence transition would not be expected if the Alu repeat originated from a retrotransposition that was simply duplicated (i.e., not involved in the formation of the unique-duplication breakpoint). Alignments of “mosaic” elements would show an increased level of sequence divergence when compared with Alus located internal to the alignment. It should be emphasized that no sequence identity exists beyond the edge of the Alu repeat and that the junction Alu repeats, in these cases, do represent the extent of the segmental duplication. We compared the level of sequence divergence of both junction and internal Alu repeats with respect to the divergence of the duplications themselves (fig. 4A; see the “Material and Methods” section). Overall, greater divergence was observed between Alus at the junctions of duplications then between Alus internal to the duplicated sequence. We tested this position effect more specifically by calculating the difference in genetic distance for each pairwise combination of the internal and junction Alu alignments. A highly skewed distribution was observed (fig. 4B), with nearly 60% of all pairwise differences demonstrating a significant departure from that of an expected distribution (fig. B [online only]). Several examples of such divergent Alu alignments at the junctions are presented in figure C (online only), showing the characteristic mosaic Alu repeat sequence with respect to the junction.
Figure B.
Expected variation between Alu alignment divergences. To assess the expected divergence between any two Alu alignments within the analyzed 2,366 duplications, we computed all pairwise differences for the internal (control) Alus within a segmental duplication alignment (KinternalAlu1-KinternalAlu2) (see the “Material and Methods” section). A total of 5,306 comparisons were analyzed. The SD was 0.031.
Figure C.
Examples of “mosaic” Alus traversing duplication junctions. Pairwise alignments are centered at the junction point between the flanking (white) and duplicated (yellow) sequence. The traversing Alu elements (red) show increasing sequence divergence as the alignment approaches the flanking sequence.
Alus can be generally categorized into one of three major subfamilies, which were active at different times during primate evolution: AluJ (65–40 mya), AluS (25–45 mya), and AluY (30 mya to present) (Jurka and Milosavljevic 1991; Shen et al. 1991; Kapitonov and Jurka 1996). More than one-third of all fixed Alu retroposition events occurred ∼35–40 mya, during a surge of AluS activity (fig. 5). We measured the enrichment for each major subfamily (fig. 5; table F [online only]) at segmental duplication junctions. The observed Alu enrichment was accounted for entirely by the AluY (2.9% junction vs. 1.6% control region) and AluS (17.0% vs. 9.1%) subfamilies. The oldest subfamily, AluJ, showed virtually no enrichment (3.2% junction vs. 3.0% control region). It is interesting that this relationship changes with the age of the duplication. Relative to older duplications (90%–95% identity), we see an increased enrichment for AluY and a decreased enrichment for AluS among the most recent segmental duplications (95%–100% identity) (fig. 5, bottom). We believe this Alu age effect is, again, consistent with a homology-based mechanism. Homology-driven interactions are theoretically optimal at times when the number and sequence identity among repeat elements are maximized.
Although Alu-Alu–mediated recombination is a plausible explanation, several alternative scenarios might account for the observed pattern of Alu enrichment. For example, a shared site preference for duplications and Alu insertions may exist. This scenario seems highly unlikely, since the bias for the Alu enrichment internal to the duplication would require two separate insertion events in each sequence to generate this asymmetric pattern. Moreover, a shared insertion site preference would not adequately explain the multiple examples of sharp transition in sequence similarity that we have observed within Alus at the edges of the duplication alignment (fig. C [online only]). Another scenario may be that local Alu-Alu–mediated deletions have occurred subsequent to the duplications. This would produce mosaic Alus at the junctions of segmental duplications, as a result of local Alu-Alu deletion. This effect, however, is dependent upon the frequency of such deletion events. We addressed this possibility by assessing Alu-Alu–mediated deletions within 9.96 Mb of aligned genomic sequence between human, chimpanzee, and baboon (Liu et al. 2003). We detected a relatively low rate of Alu-Alu deletions (0.03 deletions/Mb/million years) with an average length of 868 bp (table G [online only]). Moreover, the rate for L1-L1 deletion was not significantly different (0.02 deletions/Mb/million years), and, on average, L1-L1 events were five times larger (5,096 bases vs. 868 bases). Thus, if repeat-repeat–mediated deletion were the basis of the enrichment, we would expect a comparable enrichment of L1 sequence at junctions.
Table G.
Repeat-Repeat–Associated Deletions within 9.96 Mb of Human-Baboon Alignments[Note]
| Repeat | Relative Orientation | Size(bp) |
| Alu-Alu | Direct | 1,281 |
| Alu-Alu | Direct | 298 |
| Alu-Alu | Inverted | 485 |
| Alu-Alu | Direct | 592 |
| Alu-Alu | Direct | 507 |
| Alu-Alu | Direct | 2,816 |
| Alu-Alu | Direct | 611 |
| Alu-Alu | Direct | 640 |
| Alu-Alu | Direct | 582 |
| L1-L1 | Direct | 6,506 |
| L1-L1 | Direct | 11,890 |
| L1-L1 | Direct | 1,486 |
| L1-L1 | Direct | 6,640 |
| L1-L1 | Direct | 1,173 |
| L1-L1 | Direct | 2,897 |
Note.— All alignments shown are human-baboon. We analyzed 9.2 Mb of high-quality alignments of orthologous sequence from human, chimpanzee, and baboon (Liu et al. 2003). Each alignment was cross-referenced with the RepeatMasker output to identify insertions/deletions >100 bases in length that were flanked on both sides by repetitive elements. Such alignments are putative sites of repeat-repeat–mediated deletion. No putative repeat-repeat–mediated insertion or deletion events were detected within 4.9 Mb of chimpanzee-human alignments. A total of nine Alu-Alu–mediated and six L1-L1–mediated recombination events were identified on the basis of the analysis of 4.8 Mb of aligned baboon and human genomic DNA. The type, size, and repeat orientation of the deletions are indicated.
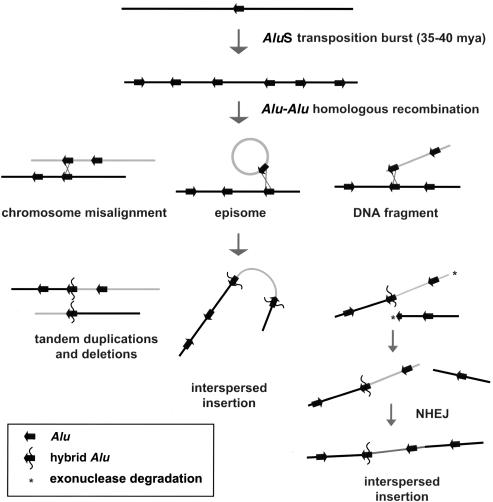
In summary, we have shown a significant genomewide enrichment of Alu repeat sequences at the boundaries of segmental duplications. The structure and organization of these junctions is consistent with homology-based Alu-Alu recombination playing a role in the origin and spread of segmental duplications, both within and between chromosomes. This association is highly significant, with a third of all segmental duplications terminating within Alu repeats. However, other repeat sequences (such as centromeric satellites)—and, therefore, other mechanisms—have also played a role in the evolutionary spread of segmental duplications. On the basis of our analysis, we propose that the primate-specific burst of AluS retroposition activity (35–40 mya) (Shen et al. 1991) created the impetus for the initial excess of segmental duplication events (fig. 6). During this time, hundreds of thousands of sites of near-perfect sequence identity would have been distributed throughout the anthropoid genome. Since the probability of nonallelic homologous recombination is proportional to the degree of sequence identity (Waldman and Liskay 1987, 1988), the frequency of Alu-Alu–mediated recombination events would have reached its peak during this period of primate evolution (Deininger and Batzer 1999). A fraction of these events led to the duplicative transposition of genomic material into new sites in the genome. Once such low-copy repeats emerged, they would have served as templates for subsequent cycles of nonallelic homologous recombination creating larger blocks of duplicated sequence (Samonte and Eichler 2002).
Figure 6.
A model of Alu-Alu–mediated duplication. A burst of AluS activity provided hundreds of thousands of sites of near-perfect sequence identity scattered throughout the ancestral genome during a narrow window of anthropoid evolution (35–40 mya). The probability of nonallelic homologous recombination among Alu repeats would have been the greatest during this time period. Three hypothetical scenarios for such Alu-Alu–mediated rearrangements are depicted, including an episomal circle, a linear DNA fragment, and the misalignment of chromosomes during meiosis. Chromosomal misalignment would predict local tandem duplications and deletions. Such events have been well-documented in association with human genetic disease (Kolomietz et al. 2002). Episomal integration would result in duplications flanked at both ends by Alu repeats, with possible rearrangement of the duplicatively transposed sequence, as proposed elsewhere (Eichler et al. 1996). Integration of linear DNA fragments would have the potential to show a wide range of junction properties, since multiple mechanisms could be envisioned to resolve the second junction, such as further Alu-Alu–mediated recombination or nonhomologous end-joining (NHEJ), as shown. All three events would generate “mosaic” or “hybrid” Alu repeat sequences consisting of both donor and acceptor sequences.
There are three aspects of this model that are attractive. First, it would help explain the disparity, in terms of frequency, pattern, and size, of large-segmental duplications between humans and other sequenced organisms. Based on the available sequence data, the primate burst of Alu retroposition activity ∼35 million years ago is nearly unique among mammalian lineages (Shen et al. 1991; IHGSC 2001). In the mouse genome, for example, the analogous SINE (B1) shows a much more uniform rate of retroposition (Waterston et al. 2002). Second, the expansion of segmental duplications, particularly interchromosomal duplication, is consistent with the proposed timing of this expansion. Finally, segmental duplications have been shown to be biased toward gene-rich regions of the genome (Bailey et al. 2002; Hillier et al. 2003). It has been shown that Alu repeats, despite dependence on the AT endonuclease, become enriched within GC-rich, gene-rich chromosomal environments within a few million years of evolution (IHGSC 2001). This genome structure association and not the selection of genic sequence, therefore, may help explain why gene-rich (Alu-rich) regions of the genome have been preferentially duplicated.
Acknowledgments
We would like to thank Devin Locke and Dr. Terry Hassold, for helpful comments in the preparation of this manuscript. This work was supported, in part, by National Institutes of Health grants GM58815 and HG002318 and U. S. Department of Energy grant ER62862 (to E.E.E.), National Institutes of Health Career Development Program in Genomic Epidemiology of Cancer grant CA094816 (to J.A.B.), Human Genetics Training grant HD07518-05 (to G.L.), the W. M. Keck Foundation, and the Charles B. Wang Foundation.
Appendix: Supplemental Methods: Parameters for In Silico Analysis
Whole-genome-analysis genome comparison for segmental duplications was performed as described previously (Bailey et al. 2001), using the build 30 version of the human genome (UCSC Genome Bioinformatics Home Page). High-copy repeats were identified by RepeatMasker version 7/16/2000 with the quick option (RepeatMasker Server Home Page) and were excised from the sequence. The resulting putatively unique genomic DNA then underwent global BLAST similarity searches with reduced affine gap extension parameters, which allowed gaps as large as 1 kb to be traversed. NCBI’s BLAST (Altschul et al. 1997) generated alignments between 400-kb segments (parameters: G = 180; E = 1; q = −80; r = 30; z = 3 × 10⁻⁹; Y = 3 × 10⁻⁹; e = e−10; F = F). A modified version of BLASTZ (Schwartz et al. 2003) that ignores self-identity compared each 400-kb piece to itself (parameters: B = 2; M = 30; I = −80; V = −80; O = 180; E = 1; W = 14; Y = 1,400). The BLAST results were parsed for alignments of ⩾1 kb of aligned bases and ⩾88% similarity. High-copy repeats were reinserted into each alignment, and alignment end trimming was performed with the program BLAST_END_TRIM. Our procedure initially extends the alignment by 1 kb within a 3-kb window, by extracting additional sequence from both query and subject sequence. For each putative boundary, an extension alignment is generated with the program ALIGN (Myers and Miller 1988) using the following scoring parameters: match +5, mismatch −4, gap opening −50, and gap extension −1. The extension alignment consists of 2,000 bp (2/3) anchored within the duplication and 1,000 bp (1/3) of sequence extending beyond the boundary. The alignment is then rescored (match +2, mismatch −5, and gap initiation penalty 10) to identify the position of the maximum cumulative score. The scoring procedure begins within the duplicated portion of the alignment and extends into the “unique” portion. An alignment end point is then repositioned only if a new maximal positional score is obtained. If the alignment extends from the previous junction, the entire process is repeated until no further extension can be made. To recover complete segmental duplications, adjacent global alignments were merged to traverse extremely large insertions/deletions (as large as 50 kb), although only the aligned portions were used for statistics. Initially, we identified a total of 12,049 alignments, within finished regions, that were ⩾1 kb in length and had ⩾90% sequence identity. A total of 4,072 alignments were ⩾5,000 bp in length and, therefore, did not represent previously uncharacterized high-copy repeat elements (the effective length of most common repeats is <2 kb). A total of 2,366 alignments had boundaries that could be unambiguously verified by visual inspection using Miropeats (Parsons 1995). These validated alignments were retained for subsequent analyses and represented 9,464 junctions.
Electronic-Database Information
The URLs for data presented herein are as follows:
- NCBI Genome Assembly, ftp://ftp.ncbi.nih.gov/genomes/H_sapiens/ (for the build 30 genome assembly)
- RepeatMasker Server Home Page, http://repeatmasker.genome.washington.edu/
- UCSC Genome Bioinformatics Home Page, http://genome.ucsc.edu/ (for build 30 genome assembly and annotation)
References
- Altschul SF, Madden TL, Schaffer AA, Zhang J, Zhang Z, Miller W, Lipman DJ (1997) Gapped BLAST and PSI-BLAST: a new generation of protein database search programs. Nucleic Acids Res 25:3389–3402 [DOI] [PMC free article] [PubMed] [Google Scholar]
- Bailey JA, Gu Z, Clark RA, Reinert K, Samonte RV, Schwartz S, Adams MD, Myers EW, Li PW, Eichler EE (2002) Recent segmental duplications in the human genome. Science 297:1003–1007 [DOI] [PubMed] [Google Scholar]
- Bailey JA, Yavor AM, Massa HF, Trask BJ, Eichler EE (2001) Segmental duplications: organization and impact within the current human genome project assembly. Genome Res 11:1005–1017 [DOI] [PMC free article] [PubMed] [Google Scholar]
- Batzer MA, Deininger PL (2002) Alu repeats and human genomic diversity. Nat Rev Genet 3:370–379 [DOI] [PubMed] [Google Scholar]
- Calabretta B, Robberson DL, Barrera-Saldana HA, Lambrou TP, Saunders GF (1982) Genome instability in a region of human DNA enriched in Alu repeat sequences. Nature 296:219–225 [DOI] [PubMed] [Google Scholar]
- Crosier M, Viggiano L, Guy J, Misceo D, Stones R, Wei W, Hearn T, Ventura M, Archidiacono N, Rocchi M, Jackson MS (2002) Human paralogs of KIAA0187 were created through independent pericentromeric-directed and chromosome-specific duplication mechanisms. Genome Res 12:67–80 [DOI] [PMC free article] [PubMed] [Google Scholar]
- Deininger PL, Batzer MA (1999) Alu repeats and human disease. Mol Genet Metab 67:183–193 [DOI] [PubMed] [Google Scholar]
- DeSilva U, Elnitski L, Idol JR, Doyle JL, Gan W, Thomas JW, Schwartz S, Dietrich NL, Beckstrom-Sternberg SM, McDowell JC, Blakesley RW, Bouffard GG, Thomas PJ, Touchman JW, Miller W, Green ED (2002) Generation and comparative analysis of approximately 3.3 Mb of mouse genomic sequence orthologous to the region of human chromosome 7q11.23 implicated in Williams syndrome. Genome Res 12:3–15 [DOI] [PMC free article] [PubMed] [Google Scholar]
- Eichler EE (2001) Recent duplication, domain accretion and the dynamic mutation of the human genome. Trends Genet 17:661–669 [DOI] [PubMed] [Google Scholar]
- Eichler EE, Archidiacono N, Rocchi M (1999) CAGGG repeats and the pericentromeric duplication of the hominoid genome. Genome Res 9:1048–1058 [DOI] [PubMed] [Google Scholar]
- Eichler EE, Lu F, Shen Y, Antonacci R, Jurecic V, Doggett NA, Moyzis RK, Baldini A, Gibbs RA, Nelson DL (1996) Duplication of a gene-rich cluster between 16p11.1 and Xq28: a novel pericentromeric-directed mechanism for paralogous genome evolution. Hum Molec Genet 5:899–912 [DOI] [PubMed] [Google Scholar]
- Goodman M (1999) The genomic record of humankind’s evolutionary roots. Am J Hum Genet 64:31–39 [DOI] [PMC free article] [PubMed] [Google Scholar]
- Guy J, Spalluto C, McMurray A, Hearn T, Crosier M, Viggiano L, Miolla V, Archidiacono N, Rocchi M, Scott C, Lee PA, Sulston J, Rogers J, Bentley D, Jackson MS (2000) Genomic sequence and transcriptional profile of the boundary between pericentromeric satellites and genes on human chromosome arm 10q. Hum Mol Genet 9:2029–2042 [DOI] [PubMed] [Google Scholar]
- Hillier LW, Fulton RS, Fulton LA, Graves TA, Pepin KH, Wagner-McPherson C, Layman D, et al (2003) The DNA sequence of human chromosome 7. Nature 424:157–164 [DOI] [PubMed] [Google Scholar]
- Horvath J, Schwartz S, Eichler E (2000) The mosaic structure of a 2p11 pericentromeric segment: a strategy for characterizing complex regions of the human genome. Genome Res 10:839–52 [DOI] [PMC free article] [PubMed] [Google Scholar]
- Houck CM, Rinehart FP, Schmid CW (1979) A ubiquitous family of repeated DNA sequences in the human genome. J Mol Biol 132:289–306 [DOI] [PubMed] [Google Scholar]
- Hu XY, Ray PN, Worton RG (1991) Mechanisms of tandem duplication in the Duchenne muscular dystrophy gene include both homologous and nonhomologous intrachromosomal recombination. EMBO J 10:2471–2477 [DOI] [PMC free article] [PubMed] [Google Scholar]
- International Human Genome Sequencing Consortium (2001) Initial sequencing and analysis of the human genome. Nature 409:860–921 [DOI] [PubMed] [Google Scholar]
- Inoue K, Lupski JR (2002) Molecular mechanisms for genomic disorders. Annu Rev Genomics Hum Genet 3:199–242 [DOI] [PubMed] [Google Scholar]
- Jurka J, Milosavljevic A (1991) Reconstruction and analysis of human Alu genes. J Mol Evol 32:105–121 [DOI] [PubMed] [Google Scholar]
- Kapitonov V, Jurka J (1996) The age of Alu subfamilies. J Mol Evol 42:59–65 [DOI] [PubMed] [Google Scholar]
- Kolomietz E, Meyn MS, Pandita A, Squire JA (2002) The role of Alu repeat clusters as mediators of recurrent chromosomal aberrations in tumors. Genes Chromosomes Cancer 35:97–112 [DOI] [PubMed] [Google Scholar]
- Korenberg JR, Rykowski MC (1988) Human genome organization: Alu, lines, and the molecular structure of metaphase chromosome bands. Cell 53:391–400 [DOI] [PubMed] [Google Scholar]
- Lehrman MA, Goldstein JL, Russell DW, Brown MS (1987) Duplication of seven exons in LDL receptor gene caused by Alu-Alu recombination in a subject with familial hypercholesterolemia. Cell 48:827–835 [DOI] [PubMed] [Google Scholar]
- Liu G, Program NC, Zhao S, Bailey JA, Sahinalp SC, Alkan C, Tuzun E, Green ED, Eichler EE (2003) Analysis of primate genomic variation reveals a repeat-driven expansion of the human genome. Genome Res 13:358–368 [DOI] [PMC free article] [PubMed] [Google Scholar]
- Mefford HC, Linardopoulou E, Coil D, van den Engh G, Trask BJ (2001) Comparative sequencing of a multicopy subtelomeric region containing olfactory receptor genes reveals multiple interactions between non-homologous chromosomes. Hum Mol Genet 10:2363–2372 [DOI] [PubMed] [Google Scholar]
- Mefford HC, Trask BJ (2002) The complex structure and dynamic evolution of human subtelomeres. Nat Rev Genet 3:91–102 [DOI] [PubMed] [Google Scholar]
- Myers EW, Miller W (1988) Optimal alignments in linear space. Comput Appl Biosci 4:11–17 [DOI] [PubMed] [Google Scholar]
- Parsons J (1995) Miropeats: graphical DNA sequence comparisons. Comput Appl Biosci 11:615–619 [DOI] [PubMed] [Google Scholar]
- Samonte RV, Eichler EE (2002) Segmental duplications and the evolution of the primate genome. Nat Rev Genet 3:65–72 [DOI] [PubMed] [Google Scholar]
- Schwartz S, Kent WJ, Smit A, Zhang Z, Baertsch R, Hardison RC, Haussler D, Miller W (2003) Human-mouse alignments with BLASTZ. Genome Res 13:103–107 [DOI] [PMC free article] [PubMed] [Google Scholar]
- Shaikh TH, Kurahashi H, Saitta SC, O’Hare AM, Hu P, Roe BA, Driscoll DA, McDonald-McGinn DM, Zackai EH, Budarf ML, Emanuel BS (2000) Chromosome 22-specific low copy repeats and the 22q11.2 deletion syndrome: genomic organization and deletion endpoint analysis. Hum Mol Genet 9:489–501 [DOI] [PubMed] [Google Scholar]
- Shen M-R, Batzer M, Deininger P (1991) Evolution of the master Alu gene(s). J Mol Evol 33:311–320 [DOI] [PubMed] [Google Scholar]
- Stankiewicz P, Lupski JR (2002) Genome architecture, rearrangements and genomic disorders. Trends Genet 18:74–82 [DOI] [PubMed] [Google Scholar]
- Waldman AS, Liskay RM (1987) Differential effects of base-pair mismatch on intrachromosomal versus extrachromosomal recombination in mouse cells. Proc Natl Acad Sci USA 84:5340–5344 [DOI] [PMC free article] [PubMed] [Google Scholar]
- ——— (1988) Dependence of intrachromosomal recombination in mammalian cells on uninterrupted homology. Mol Cell Biol 8:5350–5357 [DOI] [PMC free article] [PubMed] [Google Scholar]
- Waterston RH, Lindblad-Toh K, Birney E, Rogers J, Abril JF, Agarwal P, Agarwala R, et al. (2002) Initial sequencing and comparative analysis of the mouse genome. Nature 420:520–562 [DOI] [PubMed] [Google Scholar]


