

Abstract
Genomic imprinting is a mechanism in which only one of the two copies of a gene is expressed. Some genes that affect development and behavior in mammals are known to be imprinted. Deregulation of imprinted genes has been found in a number of human diseases. Incorporating imprinting information into linkage analysis results in a more powerful test for linkage. Here, we propose an efficient method to test for linkage and imprinting of quantitative traits in extended pedigrees. We compared the results obtained by using the extended-pedigree–analysis approach proposed in this study with other existing approaches. We found that the proposed method is more powerful and uses extended-pedigree information most efficiently.
Genomic imprinting is a mechanism in which only one copy of the gene pair is expressed and expression is determined by the parental origin of the copy. Several imprinted genes have been identified in humans. Many imprinted genes contribute to growth. In mammals, imprinted genes have evolved over time to fine-tune the growth of the fetus. It has been hypothesized that paternally expressed genes generally enhance growth, whereas maternally expressed genes appear to suppress growth (Reik and Walter 2001).
Deregulation of imprinted genes has been found in a number of human diseases, including insulin-like growth factors in Beckwith-Wiedemann syndrome and growth inhibitors, such as the GRB10 gene in Russell-Silver, Prader-Willi, and Angelman syndromes and Albright hereditary osteodystrophy. In addition, normal and abnormal genomic imprinting contributes to a wide range of malignancies. Morison et al. (2001) created the Imprinted Gene Catalogue, a database of >150 imprinted genes. Imprinted diseases are characterized by complex patterns of mutations and associated phenotypes that affect prenatal and postnatal growth and neurological functions.
Expression of imprinted genes is regulated by allele-specific epigenetic modifications of DNA and chromatin. These modifications affect central regulatory elements that control allele-specific expression of several neighboring genes. Imprinted genes have had a strong impact on biomedical research and have provided interesting models for studying the mechanisms and effects of epigenetic gene control (Walter and Paulsen 2003). (For reviews of genomic imprinting mechanisms, see Pfeifer [2000], Reik and Walter [2001], and Li [2002]).
Incorporating imprinting information into linkage analysis can result in a more powerful test for linkage (Hanson et al. 2001; Shete and Amos 2002). Methods for detection of linkage and imprinting in sibship data have been developed recently (Strauch et al. 2000; Hanson et al. 2001; Shete and Amos 2002). However, dividing larger pedigrees into sibships generally results in a loss of power to detect linkage (Wijsman and Amos 1997). A method to assess imprinting for affected relative pair has been described in Karason et al (2003). Here, we report a test for linkage and imprinting in extended pedigrees for quantitative traits. We follow the general framework of Shete and Amos (2002). Let Xi be the phenotypic value for the ith individual in a pedigree. We can write
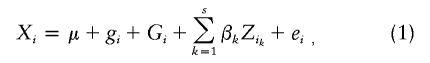 |
where μ is the overall mean, gi is the major gene effect, Gi is the polygenic effect, values of βk are covariate effects that are assumed not to be correlated with genetic and environmental factors, and ei is the environmental effect.
We write
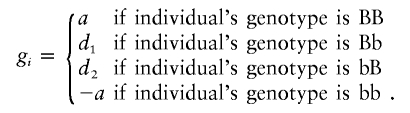 |
Here, the first allele is derived from the father, and the second allele is derived from the mother. If d is the dominance effect and I the imprinting effect, then d=(d1+d2)/2 and I=(d1-d2)/2. When d1=d2, then there is no imprinting.
The genetic variance, σ2g, at this locus can be divided into three parts: an additive component from the paternally derived allele, σ2af; an additive component from the maternally derived allele, σ2am; and the usual dominance component, σ2d. These components are equal to
and
where p and q are the frequencies of alleles B and b, respectively (Shete and Amos 2002). Also, σ2af+σ2am=σ2a.
When the imprinting coefficient I is zero, then σ2af and σ2am are equal to 1/2σ2a, and when σ2af and σ2am are equal, then I is zero. Hence, a test for equality of these two parent-specific additive variances can be used to test for imprinting.
We define “parent-specific identical by descent (IBD) sharing between a pair of relatives i and j” as follows:
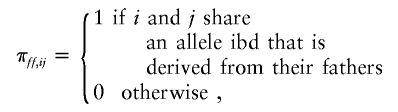 |
and
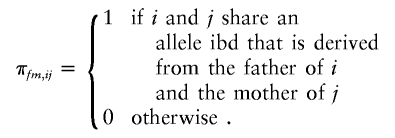 |
We define “πmf,ij” and “πmm,ij” similarly.
Then, from formula (1), the phenotypic covariance is Cov[Xi,Xj|(πff,ij,πmm,ij,πfm,ij,πmf,ij)]
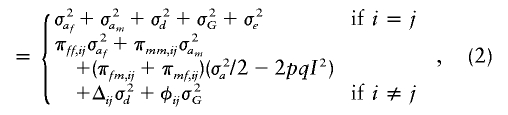 |
where σ2af, σ2am, and σ2d are as defined above; σ2G and σ2e are variances owing to the polygenic component and environmental component, respectively; Δij is the probability that a pair of relatives share both alleles IBD, known as “the coefficient of fraternity” (Lynch and Walsh 1997); and φij is the coefficient of relationship. This model will be useful for testing linkage when polymorphic markers are available within or very near the candidate gene. Although the model is developed for a two-allele system, this model can still be fitted to the multiallelic case. In this instance, the parameters will reflect average effects of the dominance and imprinting from the alleles.
From equation (2), it can be seen that the coefficients of πff,ij, πmm,ij, and (πfm,ij+πmf,ij) are equal if and only if σ2af and σ2am are equal, and σ2af and σ2am are equal if and only if the imprinting parameter I is zero (i.e., there is no parental imprinting). Hence, the null hypothesis of no imprinting can be tested by using the likelihood-ratio test for equality of these coefficients. Ordinarily, in a genome scan, one will test the joint null hypotheses of no linkage and no imprinting by testing σ2af=σ2am=0. If the data consist solely of sibships, then the coefficient of (πfm,ij+πmf,ij) is zero. To understand when the gain will be maximal for testing linkage in the presence of imprinting with the proposed model in formula (2) compared with the model that is based on sibship, we plotted values of (σ2a/2-2pqI2) for the range of values of imprinting (I) and dominance (d) in figure 1. From figure 1, we observe that, for testing for linkage, the gain in power is higher when there is either moderate-to-high dominance or moderate-to-low imprinting. The power for linkage detection decreases with increasing values of imprinting and decreasing values of dominance with no gain when imprinting is complete and there is no dominance (lower left corner of the figure). The part of the gain in the test for imprinting depends on the value of 2pqI. Increasing values of I give larger deviations, as shown in figure 1, by decreasing values of (σ2a/2-2pqI2). There will also be contributions from bilineal pairs.
Figure 1.

The region in which the new model will be more powerful for testing for linkage in the presence of imprinting, in comparison with the sibship-based model. The coefficient (σ2a/2-2pqI2) of (πfm,ij+πmf,ij) is plotted against different values of imprinting and dominance.
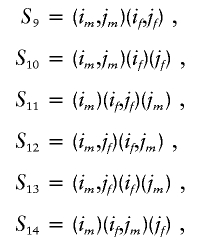
Multipoint parent-specific identity by descent is computed as follows: There are four alleles at a single locus for the relative pair i and j. Let us denote the two alleles for individual i by a vector (im,if), where im and if are maternal and paternal alleles, respectively. Similarly, we define the vector (jm,jf) for individual j. There are 15 possible ordered states of identity by descent between these two individuals (Lynch and Walsh 1997). Of these 15 states, only 7 are essential for computation of identity-by-descent sharing in outbred populations. Using the notations of SimWalk2 (Weeks et al. 1995; Sobel and Lange 1996), we define probabilities of these seven states as
 |
and
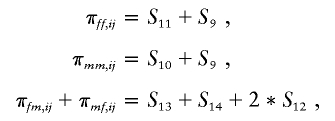
In these states, the pairs of alleles inside each pair of parentheses are IBD. For example, in S9, the maternal alleles and paternal alleles of i and j are IBD, and in S10, the maternal allele of i is IBD with the maternal allele of j, and the paternal alleles are not IBD. The state S12 occurs in outbred populations for some double cousins, such as double first cousins related through opposite-sex parents. On the basis of these seven states, we can calculate the parent-specific identity by descent as
 |
and
The identity states S9–S15 can be calculated by using the software program SimWalk2 (Weeks et al. 1995; Sobel and Lange 1996).
All the unknown parameters can be estimated by using the maximum-likelihood method, under the assumption that the data are approximately multivariate normally distributed. We do not estimate parameters p and I from equation (2). We estimate three parameters from equation (2)—namely, σ2af, σ2am, and (σ2a/2-2pqI2)—treating the coefficient of (πfm,ij+πmf,ij) in equation (2) as a single unknown quantity. When the data are not normally distributed, trait-value winsorization or transformation-type techniques can be used (Etzel et al. 2003; Shete et al., in press). We implemented the maximum-likelihood-estimation method by using MAXFUN (Sorant and Elston 1994) to estimate the unknown parameters. To test H0:σ2af=σ2am=0, we used the likelihood-ratio test. The likelihood-ratio test is twice the difference in log likelihood between a model in which σ2af and σ2am are free to vary and at least one of them is positive and a model in which σ2af and σ2am are set to zero. The test statistic LRimp=2(lnL1-lnL0) is asymptotically a mixture of 0, χ21, and χ22 in the proportions 1/4, 1/2, and 1/4, respectively, under the null hypothesis (Self and Liang 1987). Although we use the additional parameter (σ2a/2-2pqI2) for the coefficient of (πfm,ij+πmf,ij) in equation (2), this parameter is highly correlated with other parameters—σ2af and σ2am—in the model. A regression of σ2af and σ2am onto (σ2a/2-2pqI2) over the parameter space cuboid defined by all values of a and p between 0 and 1 and of d and I from −1 to 2 gave an R2 value >0.95. Hence, we do not need to include a degree of freedom for this parameter. From the simulation study below, we found that a mixture of 0, χ21, and χ22 in the proportions 1/4, 1/2, and 1/4, respectively, under the null hypothesis is a good approximation for controlling the type 1 error at a nominal significance level. Under the alternative hypothesis, the distribution of the likelihood-ratio test is a noncentral χ2. The usual test, H0:σ2a=0, is also tested by using likelihood-ratio test between a model in which σ2a is free to vary and a model in which it is fixed to zero. The test statistics LRU=2(lnL1-lnL0) is asymptotically a mixture of 0 and χ21 in the proportions 1/2 and 1/2.
We performed simulations to test the validity of the proposed test. We generated a large 3-generation pedigree with 40 individuals (fig. A [online only]). The first-generation parents had three sons and three daughters. Each of these children subsequently had four or five children. We generated 500 replicate samples, using the software SLINK (Ott 1989; Weeks et al. 1990). A trait locus with two alleles was simulated with the frequency of the deleterious allele equal to 0.20. The trait value was simulated using a normal distribution with means depending on genotypes at the trait locus (see definition of gi above) and residual variance of 1. We used a=3, I=2, and “no dominance” in the definition of gi. We simulated an unlinked marker with two equifrequent alleles as a “polygene.” A value at the polygene was simulated by using a normal distribution, with means depending on the genotypes of the polygene (−1 and +1 for the two homozygous genotypes and 0 for the heterozygous genotype) and a variance of 1. Residual environmental values were simulated from the standard normal distribution. The trait locus, polygene, and environmental values were added to obtain an individual’s phenotype. A completely linked marker with 10 equifrequent alleles was simulated to test for linkage and imprinting. An unlinked marker with 10 equifrequent alleles was simulated for type 1 error–assessment.
Figure A.

Simulated family for imprinting.
When we fix the coefficient of (πfm,ij+πmf,ij) to zero, then the model in equation (2) reduces to the one proposed for sibship data (Hanson et al. 2001; Shete and Amos 2002). The same model can be used for testing of imprinting and linkage in the extended pedigree (termed “sibship-imprinting method” in table 1) but is less efficient because it does not use all the information. We compared the proposed imprinting method (termed “pedigree-imprinting method” in table 1), which uses the extended-pedigree information most effectively, with the usual variance-components model (termed “usual VC method” in table 1), which does not allow for imprinting, and with the sibship-imprinting method. The results of the simulation are presented in table 1. The proposed method was significantly more powerful than the other methods. The P value corresponding to average test statistics that were based on the proposed method was .0057, compared with P values of .0169 and .0279 for the sibship-imprinting model and the usual VC method, respectively. We calculated the power reported in table 1 as the proportion of replicates in which the null hypothesis is rejected at α=0.0001. The type 1 errors of all three methods were well controlled at the nominal level of 5% and 1% significance. Of 500 replicate samples, we found 25 and 4 false positives in the usual VC method and 30 and 5 false positives in both the sibship-imprinting method and the pedigree-imprinting method, at 5% and 1% levels of significance, respectively.
Table 1.
Power of Different Tests of Linkage and Imprinting
| Usual VC Methoda | Sibship-Imprinting Methodb | Pedigree-Imprinting Methodc | |
| Average log likelihood | −278.13 | −271.56 | −237.85 |
| 2(lnL1-lnL0) | 3.66 | 6.28 | 8.36 |
| P | .0279 | .0169 | .0057 |
| Power | .65 | .83 | .93 |
The usual variance components model, which does not allow for imprinting.
The method of testing for linkage and imprinting that is based on sibship data—setting the coefficient of (πfm,ij+πmf,ij) to zero in equation (2).
The proposed method of testing for linkage and imprinting that uses extended pedigree most effectively.
The power of the proposed extended-pedigree-based imprinting method was better than that of the usual variance-components test and the sibship-imprinting method, because, in our test, we incorporated the imprinting parameter in the analysis of the extended pedigree most efficiently. However, when there is no imprinting, the usual variance-components test will be more powerful (Hanson et al. 2001; Shete and Amos 2002). While studying imprinted genes, it is important to use sex-specific recombination fractions because of differences in male and female recombination fractions in some regions of the genome. However, it has been shown that these tests are not sensitive to modest differences between male and female recombination fractions (Hanson et al. 2001; Shete and Amos 2002). A version of the MULTIC program of the software ACT, which incorporates imprinting and the program used to compute multipoint parent-specific identity-by-descent sharing from SimWalk2 output, can be obtained, at no cost, from the authors or at the Epigenetic Web site.
Acknowledgments
We thank the two anonymous reviewers for their helpful, constructive comments. We thank Dr. Maureen Goode for comments that led to a better presentation of the material in this paper. This work is supported by National Institutes of Health grants HG 02275 and ES 09912.
Electronic-Database Information
URLs for data presented herein are as follows:
- Epigenetic, http://www.epigenetic.org/Linkage/Imprint/ (for imprinting programs for performing extended-pedigree imprinting and linkage test and pedigree structure used in this simulation)
- Imprinted Gene Catalogue, http://cancer.otago.ac.nz/IGC/Web/home.html
References
- Etzel CJ, Shete S, Beasley TM, Fernandez JR, Allison DB, Amos CI (2003) Effect of box-cox transformation on power of Haseman-Elston and maximum-likelihood variance components tests to detect quantitative trait loci. Hum Hered 55:108–116 [DOI] [PubMed] [Google Scholar]
- Hanson RL, Kobes S, Lindsay RS, Knowler WC (2001) Assessment of parent-of-origin effects in linkage analysis of quantitative traits. Am J Hum Genet 68:951–962 [DOI] [PMC free article] [PubMed] [Google Scholar]
- Karason A, Gudjonsson JE, Upmanyu R, Antonsdottir AA, Hauksson VB, Runasdottir EH, Jonsson HH, Gudbjartsson DF, Frigge ML, Kong A, Stefansson K, Valdimarsson H, Gulcher JR (2003) A susceptibility gene for psoriatic arthritis maps to chromosome 16q: evidence for imprinting. Am J Hum Genet 72:125–131 [DOI] [PMC free article] [PubMed] [Google Scholar]
- Li E (2002) Chromatin modification and epigenetic reprogramming in mammalian development. Nat Rev Genet 3:662–673 [DOI] [PubMed] [Google Scholar]
- Lynch M, Walsh B (1997) Genetics and analysis of quantitative traits. Sinauer Associates, Sunderland, MA [Google Scholar]
- Morison IM, Paton CJ, Cleverley SD (2001) The imprinted gene and parent-of-origin effect database. Nucleic Acids Res 29:275–276 [DOI] [PMC free article] [PubMed] [Google Scholar]
- Ott J (1989) Computer-simulation methods in human linkage analysis. Proc Natl Acad Sci USA 86:4175–4178 [DOI] [PMC free article] [PubMed] [Google Scholar]
- Pfeifer K (2000) Mechanisms of genomic imprinting. Am J Hum Genet 67:777–787 [DOI] [PMC free article] [PubMed] [Google Scholar]
- Reik W, Walter J (2001) Genomic imprinting: parental influence on the genome. Nat Rev Genet 2:21–32 [DOI] [PubMed] [Google Scholar]
- Self SG, Liang K-Y (1987) Asymptotic properties of maximum likelihood estimators and likelihood ratio tests under nonstandard conditions. J Am Stat Assoc 82:605–610 [Google Scholar]
- Shete S, Amos CI (2002) Testing for genetic linkage in families by a variance-components approach in the presence of genomic imprinting. Am J Hum Genet 70:751–757 [DOI] [PMC free article] [PubMed] [Google Scholar]
- Shete S, Beasley M, Etzel CJ, Fernandez JR, Chen J, Allison DB, Amos CI. Effect of winsorization on power and type 1 error of variance components and related methods of QTL detection. Behav Genet (in press) [DOI] [PubMed] [Google Scholar]
- Sobel E, Lange K (1996) Descent graphs in pedigree analysis: applications to haplotyping, location scores, and marker-sharing statistics Am J Hum Genet 58:1323–1337 [PMC free article] [PubMed] [Google Scholar]
- Sorant AJM, Elston RC (1994) A subroutine package for function maximization (a user’s guide to MAXFUN version 6.0). Department of Biometry and Genetics, Louisiana State University Medical Center, New Orleans [Google Scholar]
- Strauch K, Fimmers R, Kurz T, Deichmann KA, Wienker TF, Baur MP (2000) Parametric and nonparametric multipoint linkage analysis with imprinting and two-locus–trait models: application to mite sensitization. Am J Hum Genet 66:1945–1957 [DOI] [PMC free article] [PubMed] [Google Scholar]
- Walter J, Paulsen M (2003) Imprinting and disease. Semin Cell Dev Biol 14:101–110 [DOI] [PubMed] [Google Scholar]
- Weeks DE, Ott J, Lathrop GM (1990) SLINK: a general simulation program for linkage analysis. Am J Hum Genet 47:A204 [Google Scholar]
- Weeks DE, Sobel E, O’Connell JR, Lange K (1995) Computer programs for multilocus haplotyping of general pedigrees. Am J Hum Genet 56:1506–1507 [PMC free article] [PubMed] [Google Scholar]
- Wijsman EM, Amos CI (1997) Genetic analysis of simulated oligogenic traits in nuclear and extended pedigrees: summary of GAW10 contributions. Genet Epidemiol 14:719–735 [DOI] [PubMed] [Google Scholar]