

Abstract
Purpose
Bone metastases (BM) is reported as the most frequent distant metastasis in non-small cell lung cancer (NSCLC), but the risk factors for the incidence and prognosis of BM patients in NSCLC have not been extensively elucidated. This study aimed to find risk factors to predict BM patients’ morbidity and survival outcome in NSCLC.
Methods
63,505 patients of NSCLC in the Surveillance, Epidemiology and End Results database diagnosed from 2010 to 2015 were used to analyze risk factors for developing BM by conducting multivariable logistic regression. Of these patients, 6152 and 5664 BM patients diagnosed between 2010 and 2014 were selected to investigate predictive factors for BM overall survival (OS) and cancer-specific survival (CSS) using the multivariable Cox proportional hazards regression.
Results
There were overall 7486 (11.79%) BM patients in NSCLC. The homogeneous risk factors for BM patients’ morbidity and survival outcome included male, higher T stage, lymph node involvement, poor differentiation grade, brain metastases, and liver metastases. Married status, adenocarcinoma type and lung metastases were positively correlated with BM incidence, while older age, white race, unmarried status, and SCC and other NSCLC types could predict poor OS and CSS of BM in NSCLC.
Conclusions
The homogeneous and heterogeneous risk factors for morbidity and survival outcome of BM patients could help physicians in more precise and individualized screening and therapies for BM patients in NSCLC.
Keywords: Non-small cell lung cancer, Bone metastasis, Risk factors, Morbidity, Prognosis
Introduction
Worldwide, lung cancer has become the most common cancer type. In both developed and developing countries, lung cancer gradually becomes the leading cause of cancer death in male patients (Torre et al. 2015). In the United States (US), lung cancer is estimated to contribute to 26% of cancer deaths in men and 25% in women in 2018 (Siegel et al. 2018). With the development of surgical techniques, targeted therapies, chemotherapies, radiotherapies, and immunotherapies, the survival outcome of lung cancer patients, especially patients with non-small cell lung cancer (NSCLC), has increased (Hirsch et al. 2017). Despite these therapeutic improvements, recurrence is still common in NSCLC patients, and 75% of recurrences are with distant metastases (Torok et al. 2017). Bone metastases (BM) occur in approximately 40% of advanced NSCLC patients (LeVasseur et al. 2016), which is one of the most common types of distant metastasis. Skeletal spread dramatically reduces NSCLC patients’ life quality by causing patients severe bone pain and complications such as pathologic fracture and spinal cord compression (Costa et al. 2008). These skeletal-related events (SREs) develop at least once in 40% of BM patients of NSCLC (Tanvetyanon and Hines 2005).
Most of the NSCLC patients did not come to doctor until they had symptoms mentioned above. Besides, for those asymptomatic patients, guidelines for lung cancer screening from National Comprehensive Cancer Network (NCCN) do not propose to routinely assess BM (Wood et al. 2018). Therefore, the diagnosis of BM is usually missed until they develop severe SRE. Thus, it is essential to investigate reliable risk factors for screening of BM in NSCLC patients. Clinical factors indicating BM include elevated alkaline phosphatase, hypercalcemia, and skeletal pain (Erturan et al. 2005). But there is lack of evidence showing these factors have robust ability of predicting high BM risk. Hence, at present, there demand more clinically applied BM risk predictors as well as the metastatic characteristics of NSCLC in clinic.
The aim of this study was utilizing the Surveillance, Epidemiology, and End Results (SEER) database to investigate morbidity and risk factors of BM in patients with NSCLC. Besides, survival outcomes and prognostic predictors were assessed for those who had found BM when they were first diagnosed with NSCLC.
Methods
Patient selection
Patients were chosen from the SEER database from 2010 to 2015, which was released in April 2018. SEER-Medicare program is a public-use dataset that collects clinical information and data from 18 population-based cancer registries and accounts for about 28% of the United States population. Thus, the 18 registry populations can be generalized to the overall population. SEER includes clinical, demographic, pathological, insurance, therapeutic, and outcome data.
We first identified patients whose age ≥ 18 years, with site codes from C34.0 to C34.9. Then we narrowed our investigation to those who were initially diagnosed with NSCLC from the first day of the year 2010 to the last day of the year 2015, as the information of distant metastases was collected from 2010 to 2015 in SEER. The histologic types of NSCLC were limited by the 3rd edition of the International Classification of Disease for Oncology and included adenocarcinoma (8140–8147, 8255, 8260, 8310, 8323, 8480, 8481, 8490, 8550, 8572), squamous cell carcinoma (8050, 8051, 8052, 8070–8078) and other types of NSCLC (8010, 8012, 8014, 8015, 8020, 8021, 8022, 8030, 8036) (Morgensztern et al. 2012). T and N staging were suggested by the AJCC 7th edition. As shown in Fig. 1, after a critical selection, there were overall 63,505 patients diagnosed as NSCLC without or with BM from 01/01/2010 to 12/31/2015, who were used for the identification of risk factors of BM. Then 6152 BM patients diagnosed between 2010 and 2014 (with more than 1-year follow-up) were collected from the 63,505 patients to analyze the prognostic factors of overall survival (OS) for BM in NSCLC. 5,664 patients were selected to predict prognostic factors for cancer-specific survival (CSS), after excluding 448 patients who were dead from other reasons (Fig. 1).
Fig. 1.

Flowchart of the study analyzing the risk factors for the incidence and survival outcome of BM patients in NSCLC, along with recording of the number of patients and the reasons for exclusion from our investigation. OS overall survival; CSS cancer-specific survival
Demographic, pathological, and clinical variables
Demographic variables include age (< 50, 50–59, 60–69, 70–79, ≥ 80), marital status (unmarried and married), race [white, black, other (American Indian or AK Native, Asian or Pacific Islander)], and sex (male and female). Pathological variables contain tumor histology (adenocarcinoma, squamous cell carcinoma, other types of NSCLC) and laterality (left side, right side and paired sides). Clinical variables were classified by grade (1, 2, 3, 4), T stage (T1, T2, T3, T4), N stage (N0, N1, N2, N3), without or with brain metastases, without or with liver metastases and without or with lung metastases.
Statistical analysis
Multivariable logistic regression was utilized to find the risk factors for BM when initially diagnosed as NSCLC. Kaplan–Meier (K–M) analysis was utilized to compare survival duration of OS and CSS between different groups of BM patients, and the OS and CSS differences between different groups were assessed by log-rank test. Multivariable analyses with Cox proportional hazard regression were conducted to determine independent prognostic factors for BM patients. Data were collected using SEER*Stat Software version 8.3.5. All of our statistical analyses were conducted using SPSS Version 23.0 (IBM Corporation, Armonk, NY, USA). Two-tailed P values less than 0.05 were considered as statistical significance in all of the analyses.
Results
Morbidity of bone metastases
In the overall 63,505 patients that were initially diagnosed as NSCLC between 2010 and 2015, there were 7486 (11.79%) BM patients and 56,019 (88.21%) patients without BM. The overall patients’ mean age was 68.08 ± 10.49 years. There were 51,034 (80.36%) white patients. 34,261 (53.95%) patients were married and 33,508 (52.76%) patients were male. Patients with adenocarcinoma were composed of 60.61% of the total cohort (N = 38,493). And more patients tended to get NSCLC in the right side (58.57%, N = 37,197). Detailed data are demonstrated in Table 1.
Table 1.
Multivariable logistic regression for analyzing the demographic and related clinical characteristics for developing BM in patients diagnosed with initial primary NSCLC
| Variables | Number of NSCLC patients (2010–2015) | OR (95% CI) | P value | |
|---|---|---|---|---|
| With bone metastases (%) | Without bone metastases (%) | |||
| Age | 0.976 (0.951–1.001) | 0.055 | ||
| < 50 | 448 (0.71%) | 2143 (3.37%) | 1.00 | – |
| 50–59 | 1547 (2.44%) | 9401 (14.80%) | 0.938 (0.824–1.067) | 0.331 |
| 60–69 | 2443 (3.85%) | 18,108 (28.51%) | 0.929 (0.821–1.051) | 0.243 |
| 70–79 | 2134 (3.36%) | 18,060 (28.44%) | 0.927 (0.818–1.051) | 0.236 |
| ≥ 80 | 914 (1.44%) | 8307 (13.08%) | 0.881 (0.768–1.011) | 0.070 |
| Race | 1.038 (0.994–1.083) | 0 0.089 | ||
| White | 5782 (9.10%) | 45,252 (71.26%) | 1.00 | – |
| Black | 1004 (1.58%) | 6467 (10.18%) | 1.014 (0.935–1.099) | 0.741 |
| Other | 700 (1.10%) | 4300 (6.77%) | 1.060 (0.964–1.166) | 0.226 |
| Marital status | ||||
| Unmarried | 3315 (5.22%) | 25,929 (40.83%) | 1.00 | – |
| Married | 4171 (6.57%) | 30,090 (47.38%) | 1.061 (1.004–1.121) | 0.036 |
| Sex | ||||
| Male | 4375 (6.89%) | 29,133 (45.88%) | 1.00 | – |
| Female | 3111 (4.90%) | 26,886 (42.34%) | 0.815 (0.771–0.861) | < 0.001 |
| Tumor histology | 0.675 (0.641–0.710) | < 0.001 | ||
| Adenocarcinoma | 5231 (8.24%) | 33,262 (52.38%) | 1.00 | – |
| Squamous cell carcinoma | 1874 (2.95%) | 21,274 (33.50%) | 0.516 (0.485–0.549) | < 0.001 |
| Other | 381 (0.60%) | 1483 (2.34%) | 1.005 (0.873–1.156) | 0.948 |
| Laterality | 0.972 (0.923–1.023) | 0 0.269 | ||
| Left | 3008 (4.74%) | 22,705 (35.75%) | 1.00 | – |
| Right | 4326 (6.81%) | 32,871 (51.76%) | 0.964 (0.913–1.019) | 0.194 |
| Paired | 152 (0.24%) | 443 (0.70%) | 0.860 (0.695–1.063) | 0.164 |
| T stage | 1.287 (1.251–1.324) | < 0.001 | ||
| T1 | 616 (0.97%) | 15,456 (24.34%) | 1.00 | – |
| T2 | 2039 (3.21%) | 19,431 (30.60%) | 1.798 (1.631–1.983) | < 0.001 |
| T3 | 2088 (3.29%) | 11,120 (17.51%) | 2.272 (2.052–2.516) | < 0.001 |
| T4 | 2743 (4.32%) | 10,012 (15.77%) | 2.536 (2.290–2.809) | < 0.001 |
| N stage | 1.568 (1.527–1.610) | < 0.001 | ||
| N0 | 1484 (2.34%) | 30,334 (47.77%) | 1.00 | – |
| N1 | 650 (1.02%) | 5881 (9.26%) | 1.709 (1.544–1.892) | < 0.001 |
| N2 | 3732 (5.88%) | 15,400 (24.25%) | 2.862 (2.671–3.068) | < 0.001 |
| N3 | 1620 (2.55%) | 4404 (6.93%) | 3.457 (3.170–3.771) | < 0.001 |
| Grade | 1.272 (1.218–1.328) | < 0.001 | ||
| 1 | 356 (0.56%) | 6088 (9.59%) | 1.00 | – |
| 2 | 2282 (3.59%) | 22,606 (35.60%) | 1.470 (1.298–1.666) | < 0.001 |
| 3 | 4681 (7.37%) | 26,428 (41.62%) | 1.695 (1.500–1.915) | < 0.001 |
| 4 | 167 (0.26%) | 897 (1.41%) | 1.568 (1.247–1.971) | < 0.001 |
| Brain metastases | ||||
| No | 5735 (9.03%) | 52,082 (82.01%) | 1.00 | – |
| Yes | 1751 (2.76%) | 3937 (6.20%) | 1.946 (1.812–2.089) | < 0.001 |
| Liver metastases | ||||
| No | 5818 (9.16%) | 54,583 (85.95%) | 1.00 | – |
| Yes | 1668 (2.63%) | 1436 (2.26%) | 5.846 (5.383–6.349) | < 0.001 |
| Lung metastases | ||||
| No | 5155 (8.12%) | 51,079 (80.43%) | 1.00 | – |
| Yes | 2331 (3.67%) | 4940 (7.78%) | 2.052 (1.917–2.197) | < 0.001 |
Bone metastasis patients’ characteristics
There were 6152 eligible patients diagnosed as NSCLC with BM from 2010 to 2014. The mean age for those patients was 66.42 ± 11.02 years. White patients made up 77.50% of the total population (N = 4768). There were 3433 (55.80%) married patients and 3600 (58.52%) male patients. BM patients diagnosed as adenocarcinoma accounted for 69.38% of the total cohort (N = 4268), and right-side NSCLC patients occupied 57.62% of the total BM patients (N = 3545). Detailed data are shown in Table 2.
Table 2.
Multivariable Cox regression for the OS among primary NSCLC patients with BM (diagnosed 2010–2014)
| Variables | Number of patients with BM (2010–2014) | Median survival time (95% CI, month) | HR (95% CI) | P value | |
|---|---|---|---|---|---|
| Overall (OS) | Deceased (%, OS) | ||||
| Age | 1.159 (1.131–1.188) | < 0.001 | |||
| < 50 | 374 | 326 (87.17%) | 7 (5.961–8.039) | 1.00 | – |
| 50–59 | 1287 | 1181 (91.76%) | 5 (4.531–5.469) | 1.269 (1.122–1.435) | < 0.001 |
| 60–69 | 1998 | 1820 (91.09%) | 5 (4.588–5.412) | 1.344 (1.194–1.514) | < 0.001 |
| 70–79 | 1748 | 1653 (94.57%) | 3 (2.726–3.274) | 1.665 (1.477–1.878) | < 0.001 |
| ≥80 | 745 | 709 (95.17%) | 3 (2.702–3.298) | 1.891 (1.654–2.161) | < 0.001 |
| Race | 0.866 (0.831–0.903) | < 0.001 | |||
| White | 4768 | 4461 (93.56%) | 4 (3.808–4.192) | 1.00 | – |
| Black | 817 | 764 (93.51%) | 3 (2.564–3.436) | 1.047 (0 0.968–1.133) | 0.252 |
| Other | 567 | 464 (81.83%) | 10 (8.451–11.549) | 0.670 (0.608–0.738) | < 0.001 |
| Marital status | |||||
| Unmarried | 2719 | 2554 (93.93%) | 3 (2.768–3.232) | 1.00 | – |
| Married | 3433 | 3135 (91.32%) | 5 (4.705–5.295) | 0.820 (0.777–0.866) | < 0.001 |
| Sex | |||||
| Male | 3600 | 3382 (93.94%) | 4 (3.798–4.202) | 1.00 | – |
| Female | 2552 | 2307 (90.40%) | 5 (4.645–5.355) | 0.805 (0.762–0.850) | < 0.001 |
| Tumor histology | 1.304 (1.245–1.366) | < 0.001 | |||
| Adenocarcinoma | 4268 | 3861 (90.46%) | 5 (4.715–5.285) | 1.00 | – |
| Squamous cell carcinoma | 1560 | 1511 (96.86%) | 3 (2.706–3.294) | 1.354 (1.271–1.442) | < 0.001 |
| Other | 324 | 317 (97.84%) | 2 (1.628–2.372) | 1.558 (1.378–1.761) | < 0.001 |
| Laterality | 1.041 (0.991–1.094) | 0.112 | |||
| Left | 2476 | 2291 (92.53%) | 4 (3.663–4.337) | 1.00 | – |
| Right | 3545 | 3274 (92.36%) | 4 (3.777–4.223) | 1.033 (0.979–1.090) | 0.233 |
| Paired | 131 | 124 (94.66%) | 3 (1.610–4.390) | 1.146 (0.954–1.377) | 0.145 |
| T stage | 1.075 (1.045–1.106) | < 0.001 | |||
| T1 | 506 | 449 (88.74%) | 7 (6.021–7.979) | 1.00 | – |
| T2 | 1674 | 1540 (92.00%) | 5 (4.633–5.367) | 1.190 (1.070–1.323) | 0.001 |
| T3 | 1728 | 1601 (92.65%) | 4 (3.691–4.309) | 1.251 (1.124–1.393) | < 0.001 |
| T4 | 2244 | 2099 (93.54%) | 4 (3.737–4.263) | 1.302 (1.171–1.448) | < 0.001 |
| N stage | 1.050 (1.023–1.078) | < 0.001 | |||
| N0 | 1218 | 1102 (90.48%) | 5 (4.466–5.534) | 1.00 | – |
| N1 | 531 | 479 (90.21%) | 5 (4.273–5.727) | 0.970 (0.871–1.081) | 0.584 |
| N2 | 3118 | 2909 (93.30%) | 4 (3.763–4.237) | 1.139 (1.061–1.222) | < 0.001 |
| N3 | 1285 | 1199 (93.31%) | 4 (3.535–4.465) | 1.114 (1.024–1.212) | 0.012 |
| Grade | 1.143 (1.093–1.194) | < 0.001 | |||
| 1 | 287 | 261 (90.94%) | 6 (4.570–7.430) | 1.00 | – |
| 2 | 1870 | 1686 (90.16%) | 6 (5.484–6.516) | 1.056 (0.927–1.204) | 0.414 |
| 3 | 3845 | 3596 (93.52%) | 4 (3.810–4.190) | 1.247 (1.098–1.416) | 0.001 |
| 4 | 150 | 146 (97.33%) | 3 (2.298–3.702) | 1.350 (1.093–1.668) | 0.005 |
| Brain metastases | |||||
| No | 4722 | 4357 (92.27%) | 4 (3.765–4.235) | 1.00 | – |
| Yes | 1430 | 1332 (93.15%) | 4 (3.713–4.287) | 1.209 (1.134–1.289) | < 0.001 |
| Liver metastases | |||||
| No | 4778 | 4363 (91.31%) | 5 (4.744–5.256) | 1.00 | – |
| Yes | 1374 | 1326 (96.51%) | 3 (2.761–3.239) | 1.378 (1.294–1.468) | < 0.001 |
| Lung metastases | |||||
| No | 4234 | 3904 (92.21%) | 4 (3.767–4.233) | 1.00 | – |
| Yes | 1918 | 1785 (93.07%) | 4 (3.695–4.305) | 1.036 (0.974–1.101) | 0.262 |
Risk factors for progressing into bone metastases
As demonstrated in Table 1, patients of married [OR (odds ratio) = 1.061, 95% CI (confidence interval) = 1.004–1.121, P = 0.036], higher T stage (OR = 1.287, 95% CI = 1.251–1.324, P < 0.001), lymph nodes metastases (OR = 1.568, 95% CI = 1.527–1.610, P < 0.001), poor differentiation grade (OR = 1.272, 95% CI = 1.218–1.328, P < 0.001), brain metastases (OR = 1.946, 95% CI = 1.812–2.089, P < 0.001), liver metastases (OR = 5.846, 95% CI = 5.383–6.349, P < 0.001), and lung metastasis (OR = 2.052, 95% CI = 1.917–2.197, P < 0.001) were significantly associated with higher BM risk. Female NSCLC patients had lower BM risk compared with male NSCLC patients (OR = 0.815, 95% CI = 0.771–0.861, P < 0.001), and patients with squamous cell carcinoma (SCC) were less likely to have BM than those with adenocarcinoma (OR = 0.675, 95% CI = 0.641–0.710, P < 0.001).
Prognostic factors for bone metastasis patients’ overall survival (OS) and cancer-specific survival (CSS)
The median survival time (MST) for OS and CSS of different BM patient groups is listed in Tables 2 and 3. BM patients of other race had the longest MST for OS (MST = 10 months, 95% CI = 8.451–11.549 months) and for CSS(MST = 10 months, 95% CI = 8.408–11.592 months), while those of other tumor histology showed the shortest MST for OS (MST = 2 months, 95% CI = 1.628–2.372 months) and for CSS (MST = 2 months, 95% CI = 1.616–2.384 months). The OS and CSS of BM patients classified according to age (Figs. 2a, 3a), race (Figs. 2b, 3b), marital status (Figs. 2c, 3c), sex (Figs. 2d, 3d), tumor histology (Figs. 2e, 3e), laterality (Figs. 2f, 3f), T stage (Figs. 2g, 3g), N stage (Figs. 2h, 3h), grade (Figs. 2i, 3i), brain metastases (Figs. 2j, 3j), liver metastases (Figs. 2k, 3k), and lung metastases (Figs. 2l, 3l) were illustrated in a graphic way. The results of multivariable Cox proportional hazard model demonstrated that older age, SCC and other NSCLC types, higher T stage, lymph node involvement, poor differentiation grade, brain metastases, and liver metastases were associated with poor survival outcomes of OS and CSS for BM patients, whereas patients of other races, married and female had better OS and CSS for BM patients (Tables 2, 3). Laterality and lung metastases were not correlated with patients’ OS and CSS.
Table 3.
Multivariable Cox regression for analyzing the CSS among primary NSCLC patients with BM (diagnosed 2010–2014)
| Variables | Number of patients with BM (2010–2014) | Median survival time (95% CI, month) | HR (95% CI) | P value | |
|---|---|---|---|---|---|
| Overall (CSS) | Deceased (%, CSS) | ||||
| Age | 1.166 (1.137–1.197) | < 0.001 | |||
| < 50 | 351 | 303 (86.32%) | 7 (5.913–8.087) | 1.00 | – |
| 50–59 | 1190 | 1084 (91.09%) | 5 (4.500–5.500) | 1.265 (1.113–1.437) | < 0.001 |
| 60–69 | 1844 | 1666 (90.35%) | 5 (4.574–5.426) | 1.342 (1.187–1.518) | < 0.001 |
| 70–79 | 1600 | 1505 (94.06%) | 4 (3.718–4.282) | 1.676 (1.479–1.899) | < 0.001 |
| ≥80 | 679 | 643 (94.70%) | 3 (2.687–3.313) | 1.930 (1.679–2.218) | < 0.001 |
| Race | 0.864 (0.827–0.902) | < 0.001 | |||
| White | 4388 | 4081 (93.00%) | 4 (3.802–4.198) | 1.00 | – |
| Black | 739 | 686 (92.83%) | 4 (3.550–4.450) | 1.028 (0.947–1.117) | 0.507 |
| Other | 537 | 434 (80.82%) | 10 (8.408–11.592) | 0.675 (0.610–0.747) | < 0.001 |
| Marital status | |||||
| Unmarried | 2491 | 2326 (93.38%) | 3 (2.765–3.235) | 1.00 | – |
| Married | 3173 | 2875 (90.61%) | 5 (4.692–5.308) | 0.817 (0.772–0.865) | < 0.001 |
| Sex | |||||
| Male | 3303 | 3085 (93.40%) | 4 (3.767–4.233) | 1.00 | – |
| Female | 2361 | 2116 (89.62%) | 5 (4.629–5.371) | 0.805 (0.760–0.852) | < 0.001 |
| Tumor histology | 1.305 (1.242–1.370) | < 0.001 | |||
| Adenocarcinoma | 3962 | 3555 (89.73%) | 5 (4.703–5.297) | 1.00 | – |
| Squamous cell carcinoma | 1414 | 1365 (96.53%) | 3 (2.704–3.296) | 1.363 (1.276–1.456) | < 0.001 |
| Other | 288 | 281 (97.57%) | 2 (1.616–2.384) | 1.534 (1.346–1.747) | < 0.001 |
| Laterality | 1.035 (0.983–1.090) | 0 0.189 | |||
| Left | 2262 | 2077 (91.82%) | 5 (4.645–5.355) | 1.00 | – |
| Right | 3292 | 3021 (91.77%) | 4 (3.772–4.228) | 1.038 (0.982–1.099) | 0.189 |
| Paired | 110 | 103 (93.64%) | 4 (2.473–5.527) | 1.053 (0.861–1.287) | 0.614 |
| T stage | 1.077 (1.046–1.109) | < 0.001 | |||
| T1 | 472 | 415 (87.92%) | 7 (6.010–7.990) | 1.00 | – |
| T2 | 1549 | 1415 (91.35%) | 5 (4.557–5.443) | 1.203 (1.077–1.344) | 0.001 |
| T3 | 1568 | 1441 (91.90%) | 4 (3.679–4.321) | 1.244 (1.113–1.392) | < 0.001 |
| T4 | 2075 | 1930 (93.01%) | 4 (3.728–4.272) | 1.319 (1.181–1.473) | < 0.001 |
| N stage | 1.077 (1.046–1.109) | < 0.001 | |||
| N0 | 1098 | 982 (89.44%) | 5 (4.449–5.551) | 1.00 | – |
| N1 | 492 | 440 (89.43%) | 5 (4.251–5.749) | 1.007 (0.899–1.127) | 0.904 |
| N2 | 2884 | 2675 (92.75%) | 4 (3.754–4.246) | 1.162 (1.079–1.252) | < 0.001 |
| N3 | 1190 | 1104 (92.77%) | 4 (3.514–4.486) | 1.153 (1.055–1.259) | 0.002 |
| Grade | 1.141 (1.090–1.195) | < 0.001 | |||
| 1 | 264 | 238 (90.15%) | 6 (4.535–7.465) | 1.00 | – |
| 2 | 1733 | 1549 (89.38%) | 6 (5.456–6.544) | 1.049 (0.914–1.203) | 0.497 |
| 3 | 3529 | 3280 (92.94%) | 4 (3.804–4.196) | 1.234 (1.081–1.410) | 0.002 |
| 4 | 138 | 134 (97.10%) | 3 (2.330–3.670) | 1.387 (1.112–1.731) | 0.004 |
| Brain metastases | |||||
| No | 4331 | 3966 (91.57%) | 4 (3.756–4.244) | 1.00 | – |
| Yes | 1333 | 1235 (92.65%) | 4 (3.698–4.302) | 1.214 (1.136–1.297) | < 0.001 |
| Liver metastases | |||||
| No | 4393 | 3978 (90.55%) | 5 (4.731–5.269) | 1.00 | – |
| Yes | 1271 | 1223 (96.22%) | 3 (2.715–3.285) | 1.392 (1.303–1.487) | < 0.001 |
| Lung metastases | |||||
| No | 3892 | 3562 (91.52%) | 5 (4.760–5.240) | 1.00 | – |
| Yes | 1772 | 1639 (92.49%) | 4 (3.648–4.352) | 1.029 (0.965–1.098) | 0.376 |
Fig. 2.

Kaplan–Meier survival curve analysis of risk factors’ impact on the OS of BM patients in NSCLC, which were stratified according to age (a), race (b), marital status (c), sex (d), tumor histology (e), laterality (f), T stage (g), N stage (h), grade (i), brain metastases (j), liver metastases (k), and lung metastases (l). OS overall survival, BM bone metastases, NSCLC non-small cell lung cancer, ADC adenocarcinoma, SCC squamous cell carcinoma, Brain Met brain metastases, Liver Met liver metastases, Lung Met lung metastases, y years
Fig. 3.

Kaplan–Meier survival curve analysis of risk factors’ impact on the CSS of BM patients in NSCLC, which were stratified according to age (a), race (b), marital status (c), sex (d), tumor histology (e), laterality (f), T stage (g), N stage (h), grade (i), brain metastases (j), liver metastases (k), and lung metastases (l). CSS cancer-specific survival, BM bone metastases, NSCLC non-small cell lung cancer, ADC adenocarcinoma, SCC squamous cell carcinoma, Brain Met brain metastases, Liver Met liver metastases, Lung Met lung metastases, y years
As shown in Fig. 4, male, higher T stage, lymph node involvement, poor differentiation grade, brain metastases, and liver metastases were homogeneous risk factors for the incidence and survival outcome of BM in NSCLC. Patients of married status were more likely to have BM, and those patients tended to have a better OS and CSS than unmarried patients. Patients with adenocarcinoma were more likely to be associated with the development of BM, but those with SCC and other NSCLC types had a poor survival outcome. Patients with lung metastases were tended to develop BM, but not associated with BM patients’ prognosis. Older age and other races were significantly correlated with OS and CSS of BM patients but could not predict BM risk.
Fig. 4.
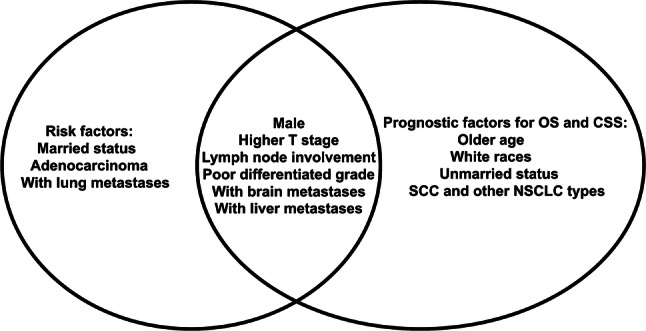
The homogeneous and heterogeneous risk factors for the incidence and survival outcome of BM patients in NSCLC. The left circle was the risk factors for the incidence of BM patients. The right circle was the risk factors for the prognosis factors of BM patients’ OS and CSS. The intersection of two circles meant the homogeneous risk factors including male, higher T stage, lymph node involvement, poor differentiation grade, brain metastases, and liver metastases. OS overall survival, CSS cancer-specific survival, BM bone metastases, SCC squamous cell carcinoma, NSCLC non-small cell lung cancer
Discussion
In the present study, we utilized the SEER database collecting a large population of NSCLC patients to find the homogeneous and heterogeneous risk factors for the morbidity and survival outcome of BM patients. According to our investigations, there were 11.79% of NSCLC patients who had BM when they were initially diagnosed. This is lower than the reported BM incidence (20%–40%) (Kuchuk et al. 2013; Quint et al. 1996; Tsuya et al. 2007). This may contribute to the underestimation of BM morbidity in the SEER database since this database is lacking the record of patients who are asymptomatic, while the reported BM incidence was mainly calculated after a systematic evaluation of the presence of BM. This highlighted the importance of basic bone screening for those asymptomatic NSCLC patients clinically.
As shown in our study, there were nine risk factors that were able to predict high BM risk for NSCLC, including married status, male, adenocarcinoma, higher T stage, lymph node involvement, poor differentiation grade, brain metastases, liver metastases, and lung metastases. These risk factors were able to guied doctors paying more attention to those with high BM risk. For these patients, a more frequent skeletal inspection may help early diagnosis of BM, which can lead to the appropriate use of bone-targeting agents and thus reduce the rate of SREs. Besides, these clinical factors may be combined with biological markers for more accurate prediction of BM for NSCLC patients in the future.
Apart from this, we found 11 risk factors that could predict both OS and CSS of BM patients in NSCLC, including older age, white race, unmarried status, male, SCC and other NSCLC types, higher T stage, lymph node involvement, poor differentiation grade, brain metastases, and liver metastases. Using these predictive factors, doctors are able to estimate the prognosis of BM patients in NSCLC. Our investigation is in accordance with M.Riihimäki’s study, which found BM patients with SCC demonstrated poorer survival outcomes than those with adenocarcinoma (Riihimaki et al. 2014). For the homogeneous risk factors, special attention should be paid by physicians, considering their predictive ability of both high BM risk and poor survival outcomes. In the six homogeneous risk factors, liver metastases rank highest in both odds ratio and hazard ratio. This is also in accordance with the study showing that lung cancer patients with liver metastases conferred the worst prognosis (Riihimaki et al. 2014). It also highlights the close contact between BM and liver metastases in NSCLC. Further mechanism researches are needed to unearth their possible interaction. According to the heterogeneous risk factors, physicians can focus on different aspects of their predictive abilities. For adenocarcinoma patients, the main focus should be the risk of BM, but the main concentration should be on the prognosis of BM for SCC. Interestingly, we found that married patients were more likely to develop BM than unmarried patients, while unmarried BM patients were with poorer prognosis than those married. Studies have shown that marriage can bring survival benefits for cancer patients because of the health insurance status, psychological supports from the family, and neighborhood socioeconomic status (Aizer et al. 2013; Gomez et al. 2016). These can explain why married BM patients of NSCLC have a better survival outcome than those unmarried. Nevertheless, we found married patients had higher possibility of developing BM, which has not been reported before. We hypothesize that this may be caused by the higher rate of exposure to secondhand smoke and kitchen fume of married women patients when they were diagnosed of NSCLC with BM, after which they were more likely to get the family support. This may explain why married patients were more likely diagnosed with BM while they were less likely to die from NSCLC.
Nevertheless, our investigations have some limitations that need to be mentioned. First of all, the SEER database only offered us with BM patients that were initially diagnosed, which may cause underestimation of those who progressed into BM later in their disease duration. Then, as demonstrated above, the SEER database may cause the underestimation of BM rate since the asymptomatic BM patients are unable to be captured. Third, the SEER database does not provide the detailed diagnostic standards for BM. Besides, the SEER database does not contain some important clinicopathologic factors of NSCLC like driven mutations, which need further investigations.
In conclusion, despite the limitations, our analyses used a large cohort of NSCLC patients in SEER database to demonstrate that there were homogeneous and heterogeneous risk factors for BM incidence and survival outcomes. Our study may provide a framework for clinical prediction and to provide patients with personized treatment in clinical practice.
Acknowledgements
This study would like to thank the author’s lover Yue Zhang for her love, support and encouragement.
Abbreviations
- BM
Bone metastases
- NSCLC
Non-small cell lung cancer
- US
The United States
- SEER
Surveillance, epidemiology and end results
- OS
Overall survival
- CSS
Cancer-specific survival
- SREs
Skeletal-related events
- NCCN
National comprehensive cancer network
- K-M
Kaplan–Meier
- OR
Odds ratio
- CI
Confidence interval
- MST
Median survival time
Compliance with ethical standards
Conflict of interest
The authors declare that they have no competing interests.
Footnotes
Qian Song and Jun Shang are first authors and equally contributed.
References
- Aizer AA et al (2013) Marital status and survival in patients with cancer. J Clin Oncol 31:3869 [DOI] [PMC free article] [PubMed] [Google Scholar]
- Costa L, Badia X, Chow E, Lipton A, Wardley A (2008) Impact of skeletal complications on patients’ quality of life, mobility, and functional independence supportive care. in cancer Off J Multinatl Assoc Support Care Cancer 16:879–889. 10.1007/s00520-008-0418-0 [DOI] [PubMed] [Google Scholar]
- Erturan S, Yaman M, Aydin G, Uzel I, Musellim B, Kaynak K (2005) The role of whole-body bone scanning and clinical factors in detecting bone metastases in patients with non-small cell. Lung Cancer Chest 127:449–454. 10.1378/chest.127.2.449 [DOI] [PubMed] [Google Scholar]
- Gomez SL et al (2016) Effects of marital status and economic resources on survival after cancer: a population-based. Study Cancer 122:1618–1625 [DOI] [PMC free article] [PubMed] [Google Scholar]
- Hirsch FR, Scagliotti GV, Mulshine JL, Kwon R, Curran WJ Jr, Wu YL, Paz-Ares L (2017) Lung cancer: current therapies and new targeted treatments Lancet (Lond Engl) 389:299–311. 10.1016/s0140-6736(16)30958-8 [DOI] [PubMed] [Google Scholar]
- Kuchuk M, Addison CL, Clemons M, Kuchuk I, Wheatley-Price P (2013) Incidence and consequences of bone metastases in lung cancer patients. J Bone Oncol 2:22–29. 10.1016/j.jbo.2012.12.004 [DOI] [PMC free article] [PubMed] [Google Scholar]
- LeVasseur N, Clemons M, Hutton B, Shorr R, Jacobs C (2016) Bone-targeted therapy use in patients with bone metastases from lung cancer: a systematic review of randomized controlled trials. Cancer Treat Rev 50:183–193. 10.1016/j.ctrv.2016.09.013 [DOI] [PubMed] [Google Scholar]
- Morgensztern D, Waqar S, Subramanian J, Gao F, Trinkaus K, Govindan R (2012) Prognostic significance of tumor size in patients with stage III non-small-cell lung cancer: a surveillance, epidemiology, and end results (SEER) survey from 1998 to 2003 J Thorac Oncol 7:1479–1484. 10.1097/JTO.0b013e318267d032 [DOI] [PubMed] [Google Scholar]
- Quint LE et al (1996) Distribution of distant metastases from newly diagnosed non-small cell lung cancer Ann Thorac Surg 62:246–250 [DOI] [PubMed] [Google Scholar]
- Riihimaki M, Hemminki A, Fallah M, Thomsen H, Sundquist K, Sundquist J, Hemminki K (2014) Metastatic sites and survival in lung cancer Lung Cancer (Amst Neth) 86:78–84. 10.1016/j.lungcan.2014.07.020 [DOI] [PubMed] [Google Scholar]
- Siegel RL, Miller KD, PhD AJD (2018) Cancer statistics, 2018 CA: Cancer J Clin 68:11 [Google Scholar]
- Tanvetyanon T, Hines E Jr (2005) Long-term efficacy and safety of zoledronic acid in the treatment of skeletal metastases in patients with nonsmall cell lung carcinoma and other. Solid Tumors Cancer 103:1756–1757. 10.1002/cncr.20996 (author reply 1757–1758) [DOI] [PubMed] [Google Scholar]
- Torok JA, Gu L, Tandberg DJ, Wang X, Harpole DH Jr, Kelsey CR, Salama JK (2017) Patterns of distant metastases after surgical management of non-small-cell lung cancer Clin Lung Cancer 18:e57-e70 10.1016/j.cllc.2016.06.011 [DOI] [PubMed] [Google Scholar]
- Torre LA, Bray F, Siegel RL, Ferlay J, Lortet-Tieulent J, Jemal A (2015) Global cancer statistics, 2012 CA: Cancer J Clin 65:87–108. 10.3322/caac.21262 [DOI] [PubMed] [Google Scholar]
- Tsuya A, Kurata T, Tamura K, Fukuoka M (2007) Skeletal metastases in non-small cell lung cancer: a retrospective study Lung Cancer (Amst Neth) 57:229–232. 10.1016/j.lungcan.2007.03.013 [DOI] [PubMed] [Google Scholar]
- Wood DE et al (2018) Lung cancer screening, version 3.2018, NCCN clinical practice guidelines in oncology. J Natl Compr Cancer Netw 16:412–441. 10.6004/jnccn.2018.0020 [DOI] [PMC free article] [PubMed] [Google Scholar]