

Abstract
Ischaemic stroke (IS) has a heavy disease burden. Although epidemiological research has suggested that heatwaves are associated with cardiovascular disease, there is a lack of empirical evidence for a correlation between heatwaves and IS. The China Meteorological Administration defines a heatwave as a wave lasting ≥ 3 days, with a maximum temperature of ≥ 35℃. We collected data on daily meteorological conditions, air pollution, and IS admissions in Hunan Province from 2018 to 2019. A generalized additive model and distributed lag nonlinear model were used to determine the associations between heatwaves and IS admissions. We analysed 329,876 admitted patients with IS in Hunan Province from 2018 to 2019. The main effect of heatwaves was that they significantly increased the risk of hospitalization for IS. The single-day lag maximum risk occurred at a daily average temperature of 30.88℃ (RR = 1.05, 95% CI: 1.04–1.06) and at a daily maximum temperature of 35.82℃ (RR = 1.05, 95% CI: 1.03–1.06). The use of the 5th and subsequent days of a heatwave as a reference showed that the 1st–2nd days (RR = 1.07, 95% CI: 1.02–1.12) and the 3rd–4th days (RR = 1.68, 95% CI: 1.03–1.10) of the heatwave increased the risk of hospitalization for IS. Compared with the third and subsequent heatwaves, the first (RR = 1.27, 95% CI: 1.19–1.35) and second (RR = 1.24, 95% CI: 1.16–1.32) heatwaves had greater impacts on the risk of hospitalization for IS. The risk of IS hospitalization was also exacerbated by high relative humidity (RR = 1.25, 95% CI: 1.16–1.35) and a low diurnal temperature range (RR = 1.08, 95% CI: 1.02–1.14) during the heatwave period. In our study, the main effects of heatwaves increased the risk of IS hospitalization. The effects varied according to the day of the heatwave, the timing of the heatwave, the DTR during the heatwave, and the humidity during the heatwave. This evidence has significant implications for the strategic planning of public health interventions to mitigate adverse health outcomes associated with heatwaves.
Supplementary Information
The online version contains supplementary material available at 10.1038/s41598-025-88557-5.
Subject terms: Cardiovascular diseases, Disease prevention, Public health, Neurological disorders, Risk factors
Introduction
Ischaemic stroke (IS) is a subtype of cardiovascular disease, and the 2019 Global Burden of Disease data show that IS accounts for 62.4% of all new strokes and has a high risk of recurrence1. The global incidence of IS is expected to increase further by 20302. In China, although the risk of death from IS decreased between 1990 and 2019, its incidence has been increasing3. IS is characterized by high morbidity, disability, and mortality, which places a heavy burden on patients’ families and the health care system4. The Lancet climate change report states that high temperatures are associated with cardiovascular disease5. Over the past few decades, the surface temperature of the Earth has been continually increasing. Since 1980, each decade has been warmer than the previous one, with the period from 2012 to 2022 being the warmest decade on record6. In the context of global warming, the burden of diseases caused by high temperatures is a major global public health issue, and their risks are expected to increase7. A heatwave is defined as several consecutive days of high temperatures8–11. A survey of 130 districts/counties in China revealed that the risk of cardiovascular disease-related deaths increased by 22.0% during heatwaves12. Although studies have shown that heatwaves can increase the risk of death from stroke13; 14, the association between heatwaves and stroke hospitalizations is controversial15; 16, and no studies have explored the associations between the characteristics of heatwaves and hospitalizations for IS during subtropical monsoons. Further research is needed to ensure more precise and effective prevention of IS.
There are two approaches to studying the health impacts of heatwaves. One of the main effects of heatwaves is that they are generated independently of high temperatures. Temperature is treated as a continuous variable, and predictions are made through exposure‒response functions linking temperature to health, which can be used to extract the impacts of specific temperatures on health. Another approach involves studying the added effects of heatwaves and investigating the extra impact of continuous high temperatures. In this case, heatwaves are regarded as independent events, and the associated excess risk is estimated by comparing heatwave periods with nonheatwave periods17–19.
The health impacts of heatwaves tend to vary according to their characteristics12. Health risks can also be influenced by the duration of a heatwave (for example, a heatwave is defined by having a duration of three or more consecutive days), its temperature thresholds (for example, a heatwave is defined by using a relative or an absolute threshold), the day number of the heatwave (for example, the 1st–2nd day of the heatwave), the timing of the heatwave (for example, whether it is the first heatwave of the year), and the characteristics of other meteorological factors20. Currently, the associations between heatwave characteristics and IS for targeted warning and prevention are unclear.
The burden of IS caused by heatwaves cannot be ignored. This study aimed to analyse the main and added effects of heatwaves, as well as the associations between heatwave characteristics and hospital admissions for IS. By determining prevention and control priorities, more accurate preventive measures can be developed on the basis of heatwaves and meteorological characteristics. This approach enables the precise prevention of IS when heatwaves occur.
Methods
Data sources and collection
Meteorological and air pollution data
Daily meteorological data were collected from the China Meteorological Data Network (https://data.cma.cn/) and included the daily maximum temperature, minimum temperature, average temperature, relative humidity and atmospheric pressure from 1 January 2018 to 31 December 2019. We obtained air pollution data from the China National Environmental Monitoring Centre (https://www.cnemc.cn/), including O3, CO, NO2, PM2.5, PM10, and SO2 data from 1 January 2018 to 31 December 2019. The daily meteorological and air pollution data for 122 districts/counties in Hunan Province were obtained by the spatiotemporal kriging interpolation analysis. Hunan Province has 29 environmental/meteorological monitoring stations and 71 air quality monitoring stations. Therefore, to obtain the daily average meteorological data and air pollution data for each county/district in Hunan Province, we used spatiotemporal kriging interpolation analysis based on the latitude and longitude of each station and each district/county using the the R software (“ltsk” and “parallel” packages).
Definition of a heatwave
Since there is no international standard for heatwaves21, this study adopted the definition of heatwaves from the China Meteorological Administration; that is, heatwaves were defined as lasting ≥ 3 days with a maximum temperature ≥ 35℃. Referring to previous studies, to avoid confounding caused by low temperatures, we limited the analysis to the warm season (1 May-30 September) when analysing the added effects12,13,22.
Daily hospital admission data
The daily number of IS admissions was extracted from the databases maintained by the statistical information direct reporting system of the Hunan Health Commission.
The inclusion criteria for admitted patients were as follows: (1) patients who were hospitalized from 1 January 2018 to 31 December 2019; (2) patients whose main diagnosis at discharge was IS and whose ICD-10 code was I63; and (3) patients whose number of hospitalization days was ≥ 1. The exclusion criteria were as follows: (1) individuals with unclear addresses or whose address was not in Hunan Province; (2) patients with the same ID number whose admission date coincided with the previous discharge date were considered readmitted; and (3) patients whose hospitalization cost was 0.
Economy and health resource data
The data on the economy and health resources of each district/county of Hunan Province in 2018 and 2019 were extracted from the Hunan Statistical Yearbooks 2019 and 2020 (http://tjj.hunan.gov.cn/).
Data analysis
Impacts of heatwaves on IS
Statistical analyses in this section consisted of two stages. The main effects of heatwaves were examined in the first phase, and the added effects of heatwaves were examined in the second phase.
The main effects
The relationship between heatwaves and IS admissions was analysed using a distributed lag nonlinear model (DLNM). A ‘‘cross-basis’’ function was used to evaluate the two-dimensional relationship between different numbers of lag days and temperature changes via the DLNM23,24. Considering the excessive dispersion problem in Poisson regression, a quasi-Poisson distribution was used as the connection function to fit the model.
Model a was as follows:
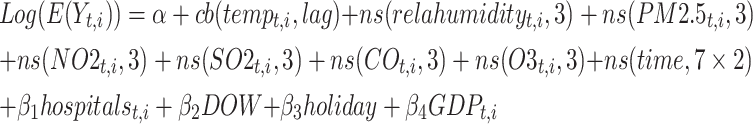 |
Model a |
where Log( ) denotes the link function of a quasi-Poisson distribution; E(Yt, i) is the expected daily count of IS hospital admissions on calendar day t (t = 1, 2, …, 730) in the ith area; a is the intercept; β1, β2, β3, and β4 are the regression coefficients; cb is the “cross-basis” function in the DLNM; temp indicates the maximum or the average temperature; lag is the lag days; relahumidity indicates relative humidity; time denotes long-term effects; hospitals indicates the number of medical institutions in each district/county; DOW is the dummy variable for the day of a week; holiday is used to control for the holiday effect; and GDP indicates gross domestic product per capita in each district/county in 2018 and 2019. The relahumidity, time, PM2.5, NO2, SO2, CO and O3 were fitted with natural cubic spline functions (ns), and the degrees of freedom were set to 3. The variable assignments are detailed in Supplementary Table S1. Referring to previous studies, we used 7 degrees of freedom (dfs) per year for time to control for the long term and seasonality25,26, where 2 represents 2 years. Considering that the effects of heatwaves tend to occur quickly (most studies use a maximum lag of 7–14 days)27–29, a maximum lag of 10 days was chosen for this study according to the sensitivity analysis and the Akaike information criterion (AIC).
In the cross-basis functions of this study, a ns was used for the fitting of both the exposure and lag dimensions, with the exposure dimension nodes set at the 25th, 50th, and 75th percentiles30,31. The relative risk of the main effects was calculated by comparing the medians of the maximum and average temperatures during the heatwave period to a reference temperature (the lowest admission risk temperature from 2018 to 2019).
The added effects
To analyse the added effects of heatwaves, heatwave events were defined as binary categorical variables, and the DLNM was established.
Model b was as follows:
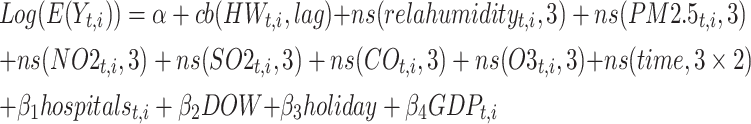 |
2 |
where HW = 0 if day t is a nonheatwave day and HW = 1 if day t is a heatwave day. The variable assignments are detailed in Supplementary Table S1. For the choice of the cross-basis functions, fitting for the exposure‒response dimension employs an integer suitable for categorical variables, whereas fitting for the lag dimension employs an ns. In accordance with previous studies, we used 3 degrees of freedom (dfs) per warm season to control for the long term and seasonality12,13; 22. A maximum lag of 10 days was chosen for this study according to the AIC.
Impacts of heatwave characteristics on IS
To explore the impacts of heatwave characteristics on the hospitalization of IS patients, a generalized additive model (GAM) was constructed.
Model c was as follows:
 |
3 |
where β1−9 are regression coefficients. The HWD represents the day of the heatwave, the HWT represents the timing of the heatwave during the year, and the HWRH indicates the relative humidity during the heatwave period. Considering that the impact of relative humidity on the human response is not significant when the relative humidity is less than 70%32, a relative humidity of less than 70% was used as the reference value, with the remaining portions divided into two layers, increasing by 50% each. The HWDTR indicates the diurnal temperature range during the heatwave period, and the HWAT represents the average temperature during heatwaves; both are divided into two strata in 50% increments. The above variables were included in the model as unordered categorical variables, with detailed variable assignments provided in Supplementary Table S1. We found that air pollutants might contribute to a further increase in hospital admissions during extreme heat33. Therefore, we included an interaction term between the average temperature and air pollutants (including PM2.5, NO2, SO2, CO, and O3) as a covariate to control for the effects of the interaction.
The impacts of heatwave characteristics on hospitalization of IS patients were explored by comparing the relative risks of different characteristics during the heatwave period.
Sensitivity analyses
To verify the robustness of the models, this study performed sensitivity analyses in the following aspects: I. In Model a, (1) the maximum number of lag days was changed from 7 to 12 days; (2) the df of time was modified from 8/year to 10/year; and (3) the df of other covariates (including relahumidity, PM2.5, NO2, SO2, CO, and O3) was adjusted from 4 to 5. II. In Model b, (1) the maximum number of lag days was changed from 7 to 12 days; (2) the df of time was changed from 2/year to 5/year; and (3) the df of other covariates (including relahumidity, PM2.5, NO2, SO2, CO, and O3) was adjusted from 4 to 5. III. In Model c, the df of other covariates (including relahumidity, PM2.5, NO2, SO2, CO, and O3) was adjusted from 4 to 5.
Data analyses in this study were performed in R (V4.2.2) using the ‘splines’, ‘mgcv’, and ‘dlnm’ packages to construct the DLNM and GAM. The means, standard deviations, maxima, minima and quartiles were used to describe daily IS admissions, meteorological factors and air pollutant distributions. The test level was set to α = 0.05 (two-sided test). Patients’ names, identity card numbers, and telephone numbers were desensitized at the data collection stage. Data confidentiality was maintained throughout the study. This study was approved by the Medical Ethics Committee of the Xiangya School of Public Health, Central South University (number: XYGW-2024-23). The requirement for informed consent was waived by the Medical Ethics Committee of the Xiangya School of Public Health, Central South University. All procedures were performed in accordance with the relevant guidelines and regulations.
Results
Research data characteristics
There were 329,876 patient admissions for IS in the 122 districts/counties in Hunan Province from 2018 to 2019, including 191,298 male patients, 138,578 female patients, 67,476 patients under the age of 60, and 262,400 patients aged 60 years and older. The distribution of daily admissions is shown in Table 1. There were an average of 3.72 admissions of IS patients per day, with a standard deviation of 3.30. Specifically, there were an average of 0.76 admissions per day for patients under 60 years of age, with a standard deviation of 1.03, and 2.96 admissions per day for patients aged 60 years and above, with a standard deviation of 2.78. Male patients had a mean of 2.15 admissions per day, with a standard deviation of 2.16, whereas female patients had a mean of 1.54 admissions per day, with a standard deviation of 1.73.
Table 1.
Characteristics of daily admissions for IS in 122 districts/counties, Hunan, 2018–2019.
| Variables | Mean (standard deviation) | Minimum value | 25th centile | 50th centile | 75th centile | Maximum value | H/U | p-value |
|---|---|---|---|---|---|---|---|---|
| Age | ||||||||
| <60 years old | 0.76(1.03) | 0 | 0 | 0 | 1 | 11 | 1.28 × 10⁷ | <0.001 |
| ≥ 60 years old | 2.96(2.78) | 0 | 1 | 2 | 4 | 29 | ||
| Sex | ||||||||
| Male | 2.15(2.16) | 0 | 1 | 2 | 3 | 19 | 5.03 × 10⁶ | <0.001 |
| Female | 1.54(1.73) | 0 | 0 | 1 | 2 | 19 | ||
| The day in the heat wave | ||||||||
| The 1st-2nd day of the heat wave | 4.08(3.33) | 0 | 1 | 3 | 6 | 24 | 2.93 | 0.231 |
| The 3rd-4th days of the heat wave | 4.05(3.13) | 0 | 2 | 3 | 6 | 24 | ||
| The 5th and subsequent days of the heat wave | 3.86(3.02) | 0 | 1 | 3 | 5 | 19 | ||
| The timing of the heat wave | ||||||||
| The first heat wave | 4.03(3.36) | 0 | 1 | 3 | 6 | 24 | 34.94* | 0.001 |
| The second heat wave | 4.28(3.14) | 0 | 2 | 4 | 6 | 20 | ||
| The third and subsequent heatwaves | 3.63(2.86) | 0 | 1 | 3 | 5 | 15 | ||
| Meteorological factors during heatwaves | ||||||||
| Low RH during heatwaves(<70%) | 3.05(2.80) | 1 | 1 | 3 | 5 | 19 | 39.54* | <0.001 |
| Medium RH during heatwaves(70-77%) | 3.84(3.12) | 0 | 1 | 3 | 5 | 24 | ||
| High RH during heatwaves(>77%) | 4.32(3.28) | 0 | 2 | 3 | 6 | 24 | ||
| Low DTR during heatwaves(<10℃) | 4.20(3.21) | 0 | 2 | 3 | 6 | 24 | 2.22 × 10⁶ | <0.001 |
| High DTR during heatwaves(≥ 10℃) | 3.74(3.08) | 0 | 1 | 3 | 5 | 24 | ||
| Low AT during heatwaves (<31℃) | 3.90(3.18) | 0 | 1 | 3 | 5 | 24 | 1.91 × 10⁶ | 0.013 |
| High AT during heatwaves (≥ 31℃) | 4.09(3.12) | 0 | 2 | 3 | 6 | 24 | ||
RH indicates relative humidity; DTR indicates diurnal temperature range; AT indicates average temperature.
*The pair-wise comparison results are statistically significant.
Nonparametric tests revealed that hospital admissions were greater for those aged 60 years and older than for those under 60 years of age (U = 1.28 × 10⁷, P < 0.001) and were greater for males than for females (U = 5.03 × 10⁶, P < 0.001). Hospital admissions were greater at low diurnal temperature ranges (DTRs) than at high DTRs during heatwaves (U = 2.22 × 10⁶, P < 0.001). The numbers of admissions were greater at high average temperatures during heatwaves than at low average temperatures (U = 1.91 × 10⁶, P = 0.013). Additionally, the numbers of hospital admissions differed depending on the timing of the heatwave (H = 34.94, P = 0.001) and relative humidity (H = 39.54, P < 0.001). A pairwise comparison revealed that daily admissions for IS were greater during the second heatwave than during the first heatwave and were lower during the third and subsequent heatwaves. With increasing relative humidity, hospital admissions for IS tended to increase.
In 2018 and 2019, heatwaves occurred between May and September in Hunan Province. In 2018, a total of 321 heatwave events were reported across the 122 districts/counties, with an average of 2.63 heatwave events per district/county, a total of 16.67 heatwave days (4.57%), and a total of 348.33 nonheatwave days (95.43%). In 2019, there were 322 heatwave events in the 122 districts/counties, with an average of 2.64 heatwave events per district/county, a total of 16.40 heatwave days (4.49%), and a total of 348.60 nonheatwave days (95.51%). The earliest heatwave event in 2018 occurred on 18 May, and the latest heatwave event occurred on 3 September. The earliest heatwave event in 2019 occurred on 17 May, and the latest heatwave event occurred on 2 September. The shortest duration of a heatwave was 3 days, and the longest duration was 23 days.
The daily distributions of meteorological factors and air pollutants in the 122 districts/counties in Hunan Province from 2018 to 2019 are shown in Supplementary Table S2. The median daily average temperature from 2018 to 2019 was 19.59 °C, with a median of 30.88 °C during heatwaves. The median daily maximum temperature was 24.07 °C, with a median of 35.82 °C during heatwaves. The median daily relative humidity was 81.08%, with a median of 75.84% during heatwaves. The median DTR was 7.70 °C, with a median of 9.93 °C during heatwaves.
Correlation analysis
Supplementary Table S3 shows the results of correlation analyses among these variables. PM2.5 levels were strongly correlated with those of PM10 (rs = 0.90, P < 0.001). Moreover, the average, maximum, and minimum temperatures were strongly correlated with each other (rs≥0.94, P < 0.001). Considering the issue of multicollinearity among variables, PM10 and the minimum temperature were not included in the model for subsequent analysis, and the inclusion of both maximum and minimum temperatures in the model was avoided34,35.
Impacts of heatwaves on IS
The main effects
In this study, we explored the main effects of heatwaves from two perspectives, namely, the average temperature and the maximum temperature, as shown in Fig. 1. The risk of hospitalization for IS was the lowest when the average temperature was 15.78 °C and the maximum temperature was 20.22 °C. Furthermore, the effect began to decline after the risk peaked at 29.2 °C for the average temperature and 32.3 °C for the maximum temperature.
Fig. 1.

Cumulative exposure-response relationship of temperature on IS admissions in Hunan Province, China. (a) represents the cumulative exposure-response relationship of daily average temperature to IS, and (b) is the plot of the cumulative exposure-response relationship of maximum daily temperature to IS. The red line indicates the RR value, and the shaded area indicates the 95% CI of the RR. The temperature at the time of the lowest risk of admission was used as the reference temperature (average temperature reference: 15.78 °C, maximum temperature reference: 20.22 °C). RR means relative risk.
Figure 1a shows the cumulative exposure‒response relationship between the daily average temperature and the risk of IS, and Fig. 1b shows a plot of the cumulative exposure‒response relationship between the maximum daily temperature and the risk of IS. The blue curves indicate the relative risk (RR) values, and the shaded areas indicate the 95% CI of the RR. The temperature at the time of the lowest risk of admission was used as the reference temperature (average temperature reference: 15.78 °C; maximum temperature reference: 20.22 °C).
The main effects of heatwaves on IS admissions in Hunan Province are shown in Table 2. During heatwaves, the median daily average temperature was 30.88 °C, and the median daily maximum temperature was 35.82 °C.
Table 2.
The main effects of heat waves on IS [RR(95%CI)].
| Daily average temperature | Daily maximum temperature | |||||||
|---|---|---|---|---|---|---|---|---|
| Single-day lag | Single effects | Multi-day lag | Cumulative effects | Single-day lg | Single effects | Multi-day lag | Cumulative effects | |
| 0 | 1.03(0.97–1.09) | 0–0 | 1.03(0.97–1.09) | 0 | 1.02(0.98–1.07) | 0–0 | 1.02(0.98–1.07) | |
| 1 | 1.03(0.97–1.08) | 0–1 | 1.05(1.01–1.10) | 1 | 1.02(0.98–1.06) | 0–1 | 1.04(1.00-1.08) | |
| 2 | 1.01(1.00-1.03) | 0–2 | 1.07(1.02–1.12) | 2 | 1.01(1.00-1.02) | 0–2 | 1.05(1.00-1.09) | |
| 3 | 1.02(1.00-1.05) | 0–3 | 1.09(1.04–1.14) | 3 | 1.01(1.00-1.03) | 0–3 | 1.06(1.02–1.11) | |
| 4 | 1.04(1.02–1.05) | 0–4 | 1.13(1.07–1.19) | 4 | 1.03 (1.02–1.05) | 0–4 | 1.09(1.04–1.15) | |
| 5 | 1.05(1.04–1.06) | 0–5 | 1.19(1.13–1.25) | 5 | 1.05 (1.03–1.06) | 0–5 | 1.14(1.09–1.20) | |
| 6 | 1.05(1.04–1.07) | 0–6 | 1.25(1.18–1.32) | 6 | 1.05 (1.04–1.06) | 0–6 | 1.20(1.14–1.26) | |
| 7 | 1.05(1.03–1.06) | 0–7 | 1.31(1.24–1.39) | 7 | 1.04 (1.03–1.06) | 0–7 | 1.25(1.19–1.32) | |
| 8 | 1.04(1.03–1.05) | 0–8 | 1.36(1.28–1.45) | 8 | 1.03 (1.02–1.04) | 0–8 | 1.29(1.22–1.37) | |
| 9 | 1.02(1.01–1.04) | 0–9 | 1.39(1.31–1.48) | 9 | 1.02 (1.00-1.03) | 0–9 | 1.31(1.24–1.39) | |
| 10 | 1.00(0.98–1.03) | 0–10 | 1.40(1.30–1.49) | 10 | 1.00 (0.98–1.02) | 0–10 | 1.31(1.23–1.40) | |
The lowest admission risk temperature was used as the reference temperature (average temperature reference: 15.78 °C, maximum temperature reference: 20.22 °C).
Significant values are given in bold.
The results indicated that the daily average temperature increased the risk of hospitalization for IS on lag Days 2–9, with the effect reaching its maximum on lag Day 5 (RR = 1.05, 95% CI: 1.04–1.06). The cumulative lag effects of the daily average temperature began to appear on lag Days 0–1 and continued to increase until lag Day 10 (RR = 1.40, 95% CI: 1.30–1.49). Similarly, the daily maximum temperature increased the risk of IS admission on lag Days 2–9, with the effect reaching its maximum on lag Day 5 (RR = 1.05, 95% CI: 1.03–1.06). The cumulative lag effects of the daily maximum temperature began to appear on lag Days 0–1 and continued to increase until lag Day 10 (RR = 1.31, 95% CI: 1.23–1.40). Supplementary Table S4 shows the results of the analysis of the influencing factors via Model a.
Figures 2 and 3 show the results of the subgroup analyses. The main effects of heatwaves were rapid among individuals aged 60 years and above (average temperature lag Day 1, RR = 1.20, 95% CI: 1.05–1.36; maximum temperature lag Day 1, RR = 1.19, 95% CI: 1.07–1.32) and among males (average temperature lag Day 1, RR = 1.30, 95% CI: 1.14–1.49; maximum temperature lag Day 1, RR = 1.30, 95% CI: 1.15–1.47), with the effects peaking on the first lag day. However, there were delays in the occurrence of the heatwave effects among those under 60 years of age (average temperature lag Day 6, RR = 1.07, 95% CI: 1.04–1.09; maximum temperature lag Day 6, RR = 1.06, 95% CI: 1.04–1.09) and among females (average temperature lag Day 5, RR = 1.05, 95% CI: 1.03–1.07; maximum temperature lag Day 5, RR = 1.06, 95% CI: 1.04–1.08).
Fig. 2.

Lag-specific associations between the average temperature and IS hospital admissions in different subgroups. The lowest admission risk temperature was used as the reference temperature (15.78 °C).
Fig. 3.

Lag-specific associations between the maximum temperature and IS hospital admissions in different subgroups. The lowest admission risk temperature was used as the reference temperature (20.22 °C).
The added effects
The risk of IS hospitalization from lag Day 1 to lag Day 10 during the heatwave period was not significantly different from that during the nonheatwave period (lag Day 10, RR = 1.01, 95% CI: 0.96–1.06). Additionally, the risks of hospital admission in populations with different demographic characteristics were not significantly different from lag Day 1 to lag Day 10 (lag Day 10: males, RR = 1.01, 95% CI: 0.90–1.10; females, RR = 0.96, 95% CI: 0.88–1.03; <60 years old, RR = 0.95, 95% CI: 0.85–1.07; ≥60 years old, RR = 1.02, 95% CI: 0.95–1.08). In summary, the added effects were not statistically significant.
Impacts of heatwave characteristics on IS
Table 3 shows the impacts of heatwave characteristics on IS. The use of the 5th and subsequent days of the heatwave as a reference showed that the 1st–2nd days (RR = 1.07, 95% CI: 1.02–1.12) and the 3rd–4th days (RR = 1.06, 95% CI: 1.03–1.10) of the heatwave increased the risk of hospitalization for IS. Compared with the third and subsequent heatwaves, the first (RR = 1.27, 95% CI: 1.19–1.35) and second (RR = 1.24, 95% CI: 1.16–1.32) heatwaves had greater impacts on the risk of hospitalization for IS.
Table 3.
The impact of heatwave characteristics on IS.
| The characteristics of heatwave | RR(95%CI) | The characteristics of heatwave | RR(95%CI) |
|---|---|---|---|
| The day in the heatwave | Meteorological factors during heatwaves | ||
| The 1st-2nd day of the heatwave | 1.07(1.02, 1.12) | Low RH during heatwaves (<70%) | Reference |
| The 3rd-4th days of the heatwave | 1.06(1.03, 1.10) | Moderate RH during heatwaves (70-77%) | 1.23(1.15, 1.34) |
| The 5th and subsequent days of the heatwave | Reference | High RH during heatwaves (>77%) | 1.25(1.16, 1.35) |
| The timing of the heatwave | Low DTR during heatwaves (<10℃) | 1.08(1.02, 1.14) | |
| The first heatwave | 1.27(1.19, 1.35) | High DTR during heatwaves (≥ 10℃) | Reference |
| The second heatwave | 1.24(1.16, 1.32) | Low AT during heatwaves (<31℃) | Reference |
| The third and subsequent heatwaves | Reference | High AT during heatwaves (≥ 31℃) | 1.01(0.94, 1.06) |
Significant values are given in bold.
Compared with low humidity, moderate humidity (RR = 1.23, 95% CI: 1.15–1.34) and high humidity (RR = 1.25, 95% CI: 1.16–1.35) significantly increased the risk of hospitalization for IS. Additionally, compared with heatwave periods with high DTRs, those with low DTRs had a hazardous effect on the risk of hospitalization for IS (RR = 1.08, 95% CI: 1.02–1.14). However, no significant effect on the risk of hospitalization for IS was found on the basis of the high or low average temperature during heatwaves.
Sensitivity analyses
Supplementary Figure S1 illustrates that the results of the model remained robust even after adjusting the maximum number of lag days within the range of 7 to 12 days. Supplementary Figures S2 and S3 show that the results of the model were still robust after varying the dfs of time (from 8 to 10 per year) and other covariates, including relahumidity, PM2.5, NO2, SO2, CO, and O3 (between 4 and 5). After varying the dfs of time (from 2 to 5 per year) and other covariates, including relahumidity, PM2.5, NO2, SO2, CO, and O3 (between 4 and 5), the added effects of heatwaves on IS admissions were still not statistically significant. Additionally, Supplementary Table S5 presents evidence that the results of the model maintained their robustness when the dfs of other covariates (including relahumidity, PM2.5, NO2, SO2, CO, and O3) were altered within the range of 4 to 5.
Discussion
Our study used a consistent definition of heatwaves and comprehensively investigated the impacts of heatwaves and their characteristics on the risk of hospitalization for IS. This approach facilitates the extrapolation of research findings and provides new support and a theoretical basis for the prevention and control of IS. Studying the influence of heatwaves on hospital admissions for IS advances disease prevention efforts. Hospitalization numbers represent individuals requiring hospital treatment due to illness or health issues, providing a more direct reflection of disease severity and the influence of risk factors on individual health. Moreover, hospital admissions directly correlate with the demand for medical resources. Hence, studying the impact of heatwaves on hospital admissions for IS offers direct, comprehensive, and practical advantages. Additionally, this study provides new evidence regarding the associations between heatwave characteristics and hospital admissions for IS.
Previous studies have shown that the exposure to air pollutants, the number of health care facilities (hospitals), the socioeconomic situation (GDP), holidays, and day-of-the-week effects modify the risk of IS in the population36–39; therefore, we included these potential confounders as covariates in our model. In our study, a single-day lag effect on the 10th day was not statistically significant, and a study in China reported that the lagged effect of heat-related mortality from cardiovascular disease was only 0–3 days29. Therefore, for the above reasons, we chose a lag of 10 days.
In accordance with our findings, the main effect of heatwaves was the risk for IS hospitalization; however, no significant associations were found between the added effects of heatwaves and IS hospitalizations. From a biological mechanism perspective, high temperatures exacerbate inflammatory responses, leading to endothelial cell damage, elevated cholesterol levels, increased blood viscosity, and alterations in coagulation function, which can result in thrombus formation and subsequent IS41. Consistent with these findings, a study in California reported that rising temperatures increased the risk of hospitalization for IS; however, the study also failed to detect statistically significant associations between the added effects of heatwaves and hospital admissions for IS16.
This study suggests that the primary risk factor is high temperature, emphasizing the importance of heatstroke prevention and cooling measures, avoiding emotional excitement, and minimizing outdoor activities during hot days. Additionally, the study revealed that after reaching a peak at approximately 30 °C, the risk declined for both average and maximum temperatures, which may have been caused by increased adaptability of the body to rising temperatures or the implementation of adaptive behaviours (such as using air conditioning or reducing outdoor activities) by individuals to mitigate the potential risks of heatwaves42. The lack of statistically significant associations between the added effects of heatwaves and hospital admissions for IS may be due to increased adaptability or the implementation of adaptive behaviours that mitigate the risks during heatwaves or to fewer heatwave days than nonheatwave days, resulting in the effects not being apparent.
The effects of heatwaves vary by age and sex. Our findings indicate that among individuals who are 60 years old and older or are males, the main effects of heatwaves occur quickly, often as early as lag Day 1. Because of the gradual physiological decline and the prevalence of various chronic diseases, older people may be more susceptible to the effects of heatwaves, which is in line with the findings of two studies conducted in Iran40; 43. Therefore, authorities should issue early warnings, and community and family members should take early measures to monitor the health of older individuals, encourage them to drink plenty of water, and ensure suitable temperatures and living conditions for them. Some findings suggest44 that high temperatures provoke stroke hospitalizations more quickly among males than females. This may be because males are often engaged in physically demanding work and are more likely to be exposed to high temperatures and heatwaves, which leads to a faster onset of effects. In contrast, females may adopt more protective behaviours, such as avoiding direct sunlight, which may slow the impact of heatwaves. These findings indicate that males should be aware of the effects of heatwaves, avoid working at high temperatures for prolonged periods of time, and take necessary protective measures.
Some heatwave characteristics may modify the risk of hospitalization for heatwave-related IS. The results of this study indicate that the 1st–4th days of a heatwave pose a greater risk than do the 5th and subsequent days. This suggests the need for preparation to mitigate the hazards of heatwaves, including reducing outdoor activities and implementing additional preventive measures during heatwave periods.
We also found that the first and second heatwaves of the year had a greater risk of hospitalization than the third and subsequent heatwaves did, which is consistent with studies on mortality in 130 counties in China12 and 43 communities in the United States45. The reason for this pattern may be the harvesting effect46,47, whereby susceptible individuals become ill or die during earlier heatwaves, which results in an increase in hospital admissions during the initial phase of heatwaves and a subsequent decrease in later hospitalizations. Alternatively, this pattern could be attributed to individual adaptation or the implementation of adaptive behaviours to withstand heat. This underscores the need for relevant authorities to establish early heatwave warning systems and strengthen health education for sensitive populations, such as older individuals, to prevent heatwave hazards at an early stage.
During heatwaves, increased relative humidity is positively correlated with the risk of IS. Multiple studies have suggested that high relative humidity environments are associated with cerebrovascular diseases. An increase in humidity may affect the body’s heat perception and temperature regulation, thereby imposing a burden on blood circulation and the cardiovascular system48,49. Therefore, in hot and humid weather, it is important to focus on cooling and dehumidification, maintain adequate water intake, and pay attention to changes in body temperature. If any discomfort arises, seeking medical attention or promptly taking emergency measures is advisable. The results of this study indicate that the DTRs during heatwaves are low and can increase the risk of IS. This may be because with a low DTR, nighttime temperatures tend to remain high, preventing people from receiving sufficient rest and relief, thus increasing the risk of disease occurrence. This suggests the need to mitigate the potential health impacts of prolonged high temperatures. Using cooling devices at night to aid in heat dissipation can ensure good sleep and help the body regulate its functions and recover.
Because the frequency and intensity of heatwaves will increase in the future, relevant authorities should develop targeted heatwave warnings on the basis of the characteristics of heatwaves. The authorities should increase environmental monitoring and enhance emergency response measures for hot weather conditions to ensure public health and safety.
The limitations of this study must also be acknowledged. First, as in most epidemiological studies, the meteorological and air pollutant data that we used were from fixed-site outdoor monitors, which do not accurately reflect the reality of individual exposure. Second, as in most other ecological studies, individual-level confounders were not controlled for in our study, which means that the study may contain ecological aberrations. Third, we adopted the definition of heatwaves as stipulated by the China Meteorological Administration, which applies to China’s climate type; thus, the results may not apply to countries and regions with different meteorological types. We also found that satellite data had a higher resolution than station data did, were not disturbed by external conditions, and had higher objectivity and authenticity50, which will be further investigated in future studies.
Conclusions
In this study, the main effect of heatwaves significantly influenced the risk of hospitalization for IS, whereas the added effects of heatwaves had no effect on the risk of admission for IS. Moreover, the influence of heatwaves on hospital admissions for IS varied depending on heatwave characteristics. Specifically, the 1st–4th days of heatwaves, the first and second heatwaves of the year, periods of high relative humidity and low DTRs during heatwaves were associated with an increased risk of hospital admissions for IS. Therefore, relevant authorities should pay attention to the effects of high temperatures during heatwaves and to heatwave characteristics, establish effective warning systems, implement appropriate protective measures, and increase public awareness and education to protect individuals from the harmful effects of heatwaves to ensure more precise health management.
Electronic supplementary material
Below is the link to the electronic supplementary material.
Acknowledgements
We thank the Information Statistics Center of Health Commission of Hunan Province for their support with data access and all agencies who provided the meteorological data.
Author contributions
Conceptualization: J.Y., J.S., and S.W.; formal analysis: J.Y.; investigation: J.Y., S.W., N.Y., Z.Z., and Z.Q.; data curation: J.Y., H.Z., Z.Q., and N.Y.; writing—original draft preparation: J.Y.; writing—review and editing, J.Y., J.S., H.Z., S.W., N.Y., Z.Z., Q.S., and J.D.; supervision: J.S.; project administration: J.S.; funding acquisition: J.S. All authors have read and agreed to the published version of the manuscript.
Funding
This research was funded as part of the project of the Natural Science Foundation of Hunan Province, China (grant numbers :2020JJ4772 and 2021JJ30893); National Science & Technology Foundational Resource Investigation Program of China (grant numbers: 2018FY100900 and 2018FY100901).
Data availability
All ICH cases’ data used in this study cannot be shared publicly .The data underlying the results presented in the study are available from the Information Statistics Center of Health Commission of Hunan Province.Meteorological data were collected from the China Meteorological Data Network(https://data.cma.cn/).Daily air quality data were collected from the China National Environmental Monitoring Centre (https://www.cnemc.cn/).The data for the population, economy, and health resources of each district/county were acquired from the Hunan Statistical Yearbook 2020 (http://tjj.hunan.gov.cn/).
Declarations
Competing interests
The authors declare no competing interests.
Ethics declarations
This study is an ecological study of hospitalization record data. The names, ID numbers and telephone numbers of patients were desensitized in the data collection phase. Data confidentiality principles were followed throughout the study. This study was approved by Medical Ethics Committee of Xiangya School of Public Health, Central South University (number: XYGW-2024-23). The need to obtain informed consent was waived by the Medical Ethics Committee of Xiangya School of Public Health, Central South University.
Footnotes
Publisher’s note
Springer Nature remains neutral with regard to jurisdictional claims in published maps and institutional affiliations.
References
- 1.Global, R., National Burden of Stroke and its & Risk Factors 1990–2019: a systematic analysis for the global burden of Disease Study 2019. Lancet Neurol.20, 795–820 (2021). [DOI] [PMC free article] [PubMed] [Google Scholar]
- 2.Pu, L. et al. Projected global trends in ischemic stroke incidence, deaths and disability-adjusted life years from 2020 to 2030. Stroke (1970). 54, 1330–1339 (2023). [DOI] [PubMed] [Google Scholar]
- 3.Xinru, Q., Wei, Z. & Mu, W. Age-period-cohort analysis of ischaemic stroke incidence and mortality trends among Chinese residents, 1990–2019. China Public. Health. 39, 1024–1031 (2023). [Google Scholar]
- 4.Association, C. M., Association, C. M., Association, C. S. O. G., Medicine, E. B. O. C. & Diseases, E. G. O. W. Guidelines for Primary Care of Ischaemic Stroke (2021). Chin. J. Gen. Practitioner 927–946 (2021).
- 5.Burkart, K. G. et al. Estimating the cause-specific relative risks of non-optimal temperature on Daily Mortality: a two-part Modelling Approach Applied to the global burden of Disease Study. Lancet398, 685–697 (2021). [DOI] [PMC free article] [PubMed] [Google Scholar]
- 6.World Meteorological Organization.State of the Global Climate in 2022. https://public.wmo.int/en/our-mandate/climate/wmo-statement-state-of-global-climate Accessed 25 Sep 2023. (2023).
- 7.Bo, Y. et al. Burden of Stroke attributable to high ambient temperature from 1990 to 2019: A global analysis. Int. J. Stroke1088915954 (2023). [DOI] [PubMed]
- 8.Moraes, S. L., Almendra, R. & Barrozo, L. V. Impact of heat waves and Cold spells on cause-specific mortality in the City of Sao Paulo, Brazil. Int. J. Hyg. Environ. Health. 239, 113861 (2022). [DOI] [PubMed] [Google Scholar]
- 9.Qi, X. et al. The effects of heatwaves and Cold spells on patients admitted with Acute ischemic stroke. Ann. Transl. Med.9, 309 (2021). [DOI] [PMC free article] [PubMed] [Google Scholar]
- 10.Wang, Y. et al. Have residents adapted to Heat Wave and Cold Spell in the 21St Century? Evidence from 136 Chinese cities. Environ. Int.173, 107811 (2023). [DOI] [PubMed] [Google Scholar]
- 11.Yin, P. et al. The added effects of heatwaves on cause-specific mortality: a nationwide analysis in 272 Chinese cities. Environ. Int.121, 898–905 (2018). [DOI] [PubMed] [Google Scholar]
- 12.Sun, Z. et al. Heat Wave characteristics, mortality and effect modification by temperature zones: a Time-Series Study in 130 counties of China. Int. J. Epidemiol.49, 1813–1822 (2021). [DOI] [PubMed] [Google Scholar]
- 13.Chen, K. et al. Influence of Heat Wave definitions to the added effect of heat waves on Daily Mortality in Nanjing, China. Sci. Total Environ.506-507, 18–25 (2015). [DOI] [PubMed] [Google Scholar]
- 14.Moraes, S. L. D., Almendra, R. & Barrozo, L. V. Impact of heat waves and Cold spells on cause-specific mortality in the City of São Paulo, Brazil. Int. J. Hyg. Environ. Health. 239, 113861 (2022). [DOI] [PubMed] [Google Scholar]
- 15.Ha, S., Talbott, E. O., Kan, H., Prins, C. A. & Xu, X. The effects of heat stress and its Effect modifiers on Stroke hospitalizations in Allegheny County, Pennsylvania. Int. Arch. Occup. Environ. Health. 87, 557–565 (2014). [DOI] [PubMed] [Google Scholar]
- 16.Sherbakov, T., Malig, B., Guirguis, K., Gershunov, A. & Basu, R. Ambient temperature and added Heat Wave effects on hospitalizations in California from 1999 to 2009. Environ. Res.160, 83–90 (2018). [DOI] [PubMed] [Google Scholar]
- 17.Gasparrini, A. & Armstrong, B. The impact of heat waves on mortality. Epidemiology22, 68–73 (2011). [DOI] [PMC free article] [PubMed] [Google Scholar]
- 18.Song, X. et al. The impact of heat waves and Cold spells on Respiratory Emergency Department Visits in Beijing, China. Sci. Total Environ.615, 1499–1505 (2018). [DOI] [PubMed] [Google Scholar]
- 19.Zeng, W. et al. The effect of heat waves on Mortality and Effect modifiers in Four communities of Guangdong Province, China. Sci. Total Environ.482–483, 214–221 (2014). [DOI] [PubMed] [Google Scholar]
- 20.Xu, Z., FitzGerald, G., Guo, Y., Jalaludin, B. & Tong, S. Impact of Heatwave on Mortality under different heatwave definitions: a systematic review and Meta-analysis. Environ. Int.89–90, 193–203 (2016). [DOI] [PubMed] [Google Scholar]
- 21.Portal, C. M. A. G. There is No Internationally Harmonised Standard for High Temperature Heatwaves. http://www.qxkp.net/zhfy/gwfh/202103/t20210319_2989743.html (Accessed 4 Sep 2024). (2021).
- 22.Yanlin, N. et al. Additive effects of High Temperature Heatwave on Mortality among Beijing residents. China Public Health. 38, 344–350 (2022). [Google Scholar]
- 23.Gasparrini, A. Distributed lag Linear and Non-linear models in R: the Package Dlnm. J. Stat. Softw.43, 1–20 (2011). [PMC free article] [PubMed] [Google Scholar]
- 24.Gasparrini, A., Armstrong, B. & Kenward, M. G. Distributed lag non-linear models. Stat. Med.29, 2224–2234 (2010). [DOI] [PMC free article] [PubMed] [Google Scholar]
- 25.Luo, Y. et al. The Cold Effect of Ambient temperature on ischemic and hemorrhagic Stroke Hospital admissions: a large database study in Beijing, China between years 2013 and 2014-Utilizing a distributed lag non-linear analysis. Environ. Pollut. 232, 90–96 (2018). [DOI] [PubMed] [Google Scholar]
- 26.Wu, Y. et al. Short-term exposure to Extreme temperature and outpatient visits for respiratory diseases among children in the Northern City of China: a Time-Series Study. Bmc Public. Health. 24, 341 (2024). [DOI] [PMC free article] [PubMed] [Google Scholar]
- 27.Alahmad, B. et al. Associations between Extreme temperatures and Cardiovascular cause-specific mortality: results from 27 countries. Circulation147, 35–46 (2023). [DOI] [PMC free article] [PubMed] [Google Scholar]
- 28.Fonseca-Rodriguez, O., Sheridan, S. C., Lundevaller, E. H. & Schumann, B. Effect of Extreme Hot and Cold Weather on cause-Specific hospitalizations in Sweden: a Time Series Analysis. Environ. Res.193, 110535 (2021). [DOI] [PubMed] [Google Scholar]
- 29.Huang, J., Wang, J. & Yu, W. The lag effects and vulnerabilities of Temperature effects on Cardiovascular Disease Mortality in a subtropical Climate Zone in China. Int. J. Environ. Res. Public. Health. 11, 3982–3994 (2014). [DOI] [PMC free article] [PubMed] [Google Scholar]
- 30.Wang, J. et al. Impact of ambient temperature, diurnal temperature range on Hyperventilation Syndrome Emergency Admission: a Time-Series Analysis in Beijing, China. Bmj Open.14, e80318 (2024). [DOI] [PMC free article] [PubMed] [Google Scholar]
- 31.Zhou, H., Wan, S., Shi, J. & Xiao, G. The Effect of Daily Temperature Difference on the Number of Hospital Admissions of Elderly People with ischaemic brain rate in Hunan Province. Chin. J. Prev. Med.4, (2023).
- 32.Higuma, T. et al. Effects of temperature and humidity on Acute myocardial infarction hospitalization in a Super-aging Society. Sci. Rep.11, 22832 (2021). [DOI] [PMC free article] [PubMed] [Google Scholar]
- 33.Aboubakri, O., Shoraka, H. R., Karamoozian, A., Abedi Gheshlaghi, L. & Foroutan, B. Seasonal impact of Air Particulate Matter on Morbidity: Interaction Effect Assessment in a time-stratified case-crossover design. Hum. Ecol. Risk Assess.27, 2328–2341 (2021). [Google Scholar]
- 34.Akoglu, H. User’s guide to correlation coefficients. Turk. J. Emerg. Med.18, 91–93 (2018). [DOI] [PMC free article] [PubMed] [Google Scholar]
- 35.Fox, J. & Weisberg, S. An R Companion to Applied Regression Sage Publications, Inc. (Thousand Oaks, 2019).
- 36.Lim, J. S. et al. Effects of temperature and pressure on Acute Stroke incidence assessed using a Korean Nationwide Insurance Database. J. Stroke. 19, 295–303 (2017). [DOI] [PMC free article] [PubMed] [Google Scholar]
- 37.Ran, H., Ye, R. & Fang, Z. Di Zhengli. Meta-analysis of the correlation between short-term exposure to six Common Air pollutants and the development of ischaemic stroke. Environ. Occup. Med.40, 184–189 (2023). [Google Scholar]
- 38.Yang, J. et al. Vulnerability to the impact of temperature variability on mortality in 31 Major Chinese cities. Environ. Pollut. 239, 631–637 (2018). [DOI] [PubMed] [Google Scholar]
- 39.Zhang, M. Correlation of Atmospheric Pollutants and Meteorological Factors with the Risk of Ischaemic Stroke in Taiyuan City, Shanxi Province, China (Shanxi Medical University, 2021).
- 40.Shoraka, H. R., Aboubakri, O., Ballester, J. & Sharafkhani, R. Heat and Cold-related morbidity risk in North-East of Iran: a time-stratified case crossover design. Environ. Sci. Pollut Res.29, 2664–2671 (2022). [DOI] [PubMed] [Google Scholar]
- 41.Giorgini, P. et al. Climate Changes and Human Health: a review of the Effect of Environmental Stressors on Cardiovascular Diseases Across Epidemiology and Biological mechanisms. Curr. Pharm. Des.23, 3247–3261 (2017). [DOI] [PubMed] [Google Scholar]
- 42.Alari, A., Letellier, N. & Benmarhnia, T. Effect of different heat Wave timing on Cardiovascular and Respiratory Mortality in France. Sci. Total Environ.892, 164543 (2023). [DOI] [PubMed] [Google Scholar]
- 43.Rezaee, R. et al. Summer heat waves and their mortality risk over a 14-Year period in a Western Region of Iran. Int. J. Biometeorol.67, 2081–2091 (2023). [DOI] [PubMed] [Google Scholar]
- 44.Xu, Z., Tong, S., Pan, H. & Cheng, J. Associations of Extreme temperatures with hospitalizations and Post-discharge deaths for stroke: what is the role of Pre-existing Hyperlipidemia? Environ. Res.193, 110391 (2021). [DOI] [PubMed] [Google Scholar]
- 45.Anderson, G. B. & Bell, M. L. Heat waves in the United States: mortality risk during heat waves and Effect Modification by Heat Wave characteristics in 43 U.S. communities. Environ. Health Perspect.119, 210–218 (2011). [DOI] [PMC free article] [PubMed] [Google Scholar]
- 46.Excess Mortality - Wikipediahttps://en.wikipedia.org/wiki/Excess_mortality Accessed 23 Sep 2024. (2024).
- 47.Zhou, H., Geng, H., Dong, C. & Bai, T. The short-term harvesting effects of ambient particulate matter on mortality in Taiyuan Elderly residents: a Time-Series Analysis with a generalized Additive distributed lag Model. Ecotox. Environ. Safe. 207, 111235 (2021). [DOI] [PubMed] [Google Scholar]
- 48.Doi, S. et al. Effects of temperature and humidity on Cerebrovascular Disease hospitalization in a Super-aging Society. Sci. Rep.13, 20602 (2023). [DOI] [PMC free article] [PubMed] [Google Scholar]
- 49.Klompmaker, J. O. et al. Long-term exposure to Summer Specific Humidity and Cardiovascular Disease hospitalizations in the us Medicare Population. Environ. Int.179, 108182 (2023). [DOI] [PMC free article] [PubMed] [Google Scholar]
- 50.Aboubakri, O., Ballester, J., Shoraka, H. R., Karamoozian, A. & Golchini, E. Ambient temperature and Covid-19 transmission: an evidence from a region of Iran based on Weather Station and Satellite Data. Environ. Res.209, 112887 (2022). [DOI] [PMC free article] [PubMed] [Google Scholar]
Associated Data
This section collects any data citations, data availability statements, or supplementary materials included in this article.
Supplementary Materials
Data Availability Statement
All ICH cases’ data used in this study cannot be shared publicly .The data underlying the results presented in the study are available from the Information Statistics Center of Health Commission of Hunan Province.Meteorological data were collected from the China Meteorological Data Network(https://data.cma.cn/).Daily air quality data were collected from the China National Environmental Monitoring Centre (https://www.cnemc.cn/).The data for the population, economy, and health resources of each district/county were acquired from the Hunan Statistical Yearbook 2020 (http://tjj.hunan.gov.cn/).