

Abstract
Balcinrenone (AZD9977) is a selective mineralocorticoid receptor modulator in development in combination with dapagliflozin for treatment of heart failure with impaired kidney function and chronic kidney disease. A prespecified concentration–QT analysis was performed based on data from a phase I single ascending dose study prospectively designed as a thorough QT study substitute. Oral single doses of balcinrenone of 5–800 mg, plus fractionated doses of 800 and 1200 mg, were evaluated in 62 healthy male participants. Time‐matched 12‐lead digital electrocardiogram and plasma concentrations were measured pre‐dose and up to 48 h postdose in the participants. Analysis was performed using a linear mixed‐effect model, where baseline‐adjusted Fridericia‐corrected QT interval (ΔQTcF) was a dependent variable and time‐matched balcinrenone concentration an independent variable. The model fit was deemed adequate by evaluation of goodness‐of‐fit plots, and the slope of the concentration–ΔQTcF relationship was nonsignificant (−0.003 ms/μmol/L; 95% confidence interval [CI]: −0.181, 0.176). The high clinical exposure scenario was defined as the maximum concentration (2.156 μmol/L) following the highest expected therapeutic dose (40 mg once daily) under fed conditions and in presence of a strong cytochrome P450 3A4 inhibitor. Estimated baseline‐adjusted and placebo‐corrected QTcF interval (ΔΔQTcF) at this concentration was 0.35 ms (90% CI: −1.29, 2.00). Furthermore, the upper 90% ΔΔQTcF CI was estimated to be below the threshold of regulatory concern of 10 ms at all observed concentrations (up to 16.7 μmol/L). Hence, it can be concluded that balcinrenone does not induce QTcF prolongation at the high clinical exposure scenario.
Study Highlights.
WHAT IS THE CURRENT KNOWLEDGE ON THE TOPIC?
Pathophysiological activation of the mineralocorticoid receptor (MR) leads to target organ dysfunction and increased risk of cardiovascular and renal disease. Balcinrenone, a novel MR modulator currently in development for use in combination with dapagliflozin in patients with heart failure and impaired kidney function and also for CKD, induces protein conformation distinct from MR antagonists, and may modify the interaction pattern of the receptor with transcriptional co‐activators.
WHAT QUESTION DID THIS STUDY ADDRESS?
Whether balcinrenone is associated with prolongation of QTcF interval.
WHAT DOES THIS STUDY ADD TO OUR KNOWLEDGE?
This study confirmed that balcinrenone does not prolong QTcF interval at the high clinical exposure scenario.
HOW MIGHT THIS CHANGE DRUG DISCOVERY, DEVELOPMENT, AND/OR THERAPEUTICS?
This study demonstrated that balcinrenone does not prolong the QTcF interval of drug safety or regulatory concern at high clinical exposure, meaning that routine safety electrocardiograms are sufficient in future clinical trials.
INTRODUCTION
Mineralocorticoid receptor (MR) is a transcription factor that is activated by both mineralocorticoids and glucocorticoids, 1 , 2 , 3 and is found in both sodium‐transporting epithelia (e.g., in the kidney) and nonepithelial tissues (e.g., in the heart). 1 , 2 Activation of the MR by aldosterone in renal epithelial cells regulates electrolyte and fluid homeostasis and consequently plays a pivotal role in blood pressure control. 1 , 3 , 4 MR activation in nonepithelial tissues promotes target organ dysfunction by stimulating inflammation, oxidative stress, and fibrosis. 1 , 2 Pathophysiological activation of the MR ultimately leads to target organ dysfunction and an increased risk of cardiovascular and renal disease. 1 , 2 , 3 , 4
Balcinrenone (AZD9977) is a novel, nonsteroidal, selective MR modulator in clinical development for use in combination with dapagliflozin in patients with heart failure with impaired kidney function as well as for chronic kidney disease (CKD). 5 In preclinical studies, balcinrenone provided organ protective effects on par with the MR antagonist eplerenone by blocking the damaging action of aldosterone and cortisol in nonepithelial tissues but had minimal effects on electrolyte handling by renal epithelial cells. 6 The binding of balcinrenone to the MR induces a unique protein conformation in the MR that is distinct from the one induced by MR antagonists and may modify the interaction pattern of the receptor with transcriptional co‐activators. 6 Therefore, balcinrenone may have the potential to address an important unmet need for MR modulation, providing organ protection with a reduced hyperkalemia risk in a patient population that is at increased risk of hyperkalemia. 6
Evaluation of a new molecular entity's liability to prolong QTc, the QT interval (the interval measured from the onset of the QRS complex to the end of the T wave) corrected for heart rate (HR), was traditionally performed in a thorough QT (TQT) study. 7 , 8 More recently, the guidelines have been revised to accept well‐designed and conducted concentration–QTc (C‐QTc) analysis in early phase I studies as an alternative approach to a TQT study to reliably exclude QTc prolongation as a drug safety concern. 9 , 10 Detailed scientific advice on the implementation of C‐QTc analysis has been published, 9 and currently the model‐based approach is widely used for evaluation of QT prolongation. 9 , 11 , 12 , 13 , 14 , 15 , 16 In the present work, the potential for QT prolongation of balcinrenone was evaluated based on time‐matched pharmacokinetic (PK) and digital electrocardiogram (dECG) data collected during a phase I single ascending dose (SAD) study in healthy male participants. 17 This study was prospectively designed to act as a TQT study substitute, and C‐QTc modeling was prespecified as the method of assessing QT liability. This work represents important evidence indicating a lack of QT prolongation risk at the clinically highest achieved exposure of this novel, nonsteroidal MR modulator.
MATERIALS AND METHODS
Study design
Data included in this analysis were collected from a randomized, single‐blind, placebo‐controlled, parallel‐group, single‐center, phase I SAD study in healthy male participants (ClinicalTrials.gov: NCT02484729). 17 The study consisted of two parts. Part A had a randomized, single‐blind, placebo‐controlled, sequential group design to assess the safety, tolerability, and PK of SADs of balcinrenone (5, 25, 100, 200, 400, and 800 mg, and fractionated doses of 800 and 1200 mg; fractionated dosing was used due to suspected solubility limited absorption, the fractionated dose was administered as 200 mg/h). 17 Part B had a nonrandomized, open‐label, single‐dose, fixed‐sequence crossover design to assess the regional absorption of balcinrenone along the gastrointestinal tract. 17 Part A was prospectively designed, with the PK‐matched dECG data collection intended to be used as a TQT study substitute, and the C‐QTc analysis was prespecified as an exploratory study objective. The main study inclusion criteria were healthy male participants, aged 18–50 years, with suitable veins for cannulation or repeated venipuncture, body weight of 50–100 kg, and a body mass index of 18–30 kg/m2.
In Part A, 62 healthy male participants were randomized to one of eight active groups (balcinrenone 5, 25, 100, 200, 400, and 800 mg, and fractionated doses of 800 and 1200 mg). Within each group, six participants (n = 5 for 200 and 800 mg) were randomly assigned to receive balcinrenone and two participants were randomly assigned to receive placebo. 17 Balcinrenone and placebo were administered as oral suspensions, under fasted conditions. None of the participants received a CYP3A4 inhibitor during the study.
Ethical approval
The study was performed in the Parexel Early Phase Clinical Unit London (London, UK), in accordance with ethical principles that had their origin in the Declaration of Helsinki, and consistent with the International Council for Harmonization (ICH) Good Clinical Practice and the AstraZeneca policy on Bioethics and Human Biological Samples. The study protocol, informed consent documents, and relevant documents were approved by the National Independent Ethics Committee. All patients signed the informed consent before study initiation.
ECG and PK sampling
A total of 12 time‐matched PK samples and 12‐lead continuous dECG recordings per participant were collected (pre‐dose and 0.5, 1, 2, 3, 4, 6, 8, 12, 24, 36, and 48 h postdose). An additional PK sample and dECG recording were collected at 3.5 h postdose for participants receiving the 800 and 1200 mg fractionated doses of balcinrenone. In total, 653 time‐matched PK/dECG measurements from 62 participants were used in a prespecified C‐QTc model; 61 postdose samples following administration of 5, 25, 100, or 200 mg of balcinrenone were below the lower limit of quantification.
The AZ ECG Centre (ECG Core Lab) performed the dECG analysis in this study, using the EClysis© system, a semi‐automated methodology, version 3.3.1 or higher. At protocol‐defined time points, 12‐lead continuous dECG were recorded for over 10 min at baseline and at least 5 min at postdose time points with the Schiller Cardiovit CS‐200 recorder (Schiller AG, Baar, Switzerland) and transmitted to the AZ central dECG repository, according to the standard procedures of the AZ ECG Centre for settings, recording, and transmission of dECGs. As standard, 10‐s dECGs were extracted by the EClysis system twice per minute from the continuous recording and initially automatically analyzed by the software.
The same recorder was used for each participant at all time points, when possible. All dECG time points were recorded in close connection with and prior to the PK sampling time points. Lead V2 was analyzed and reported as primary. Lead V5 was analyzed, for all visits, as backup for those individuals for whom analysis in lead V2 was not deemed possible for pre‐dose, for significant parts of visits, or for whole visits. The analysis was performed blinded to treatment. The following dECG variables were reported by the AZ ECG Centre: the time between corresponding points on two consecutive R waves on ECG (RR); ECG interval measured from the onset of the P wave to the onset of the QRS complex (PR); ECG interval measured from the start of the Q wave or the R wave if Q is missing to the J point (QRS); and QT intervals from the lead defined as primary in the protocol. Derived variables (QTc, HR, and others, as applicable) were calculated by the Parexel study statistician or delegate.
PK plasma samples for balcinrenone were collected and balcinrenone concentrations were quantified in all participants for all treatment periods using validated assays at Covance. The lower limit of quantification was 10 nmol/L.
Exploratory analysis
Prior to C‐QTc analysis, an exploratory graphical analysis was performed to evaluate whether the requirements of the prespecified model were met. 9 Exploratory graphical analysis was performed according to recommendations by major regulatory bodies and detailed scientific advice. 9 , 10 , 11 These assumptions included lack of drug effect on HR, appropriateness of the Fridericia QT HR correction method, 18 lack of time delay between plasma drug concentration and QTc values (hysteresis), and linearity of the C‐QTc relationship.
Categorical evaluation of QT, Fridericia‐corrected QT interval (QTcF), PR, and QRS intervals were performed to identify outliers and/or trends, using pre‐dose samples as baseline. Evaluated intervals of QT/QTcF were QT/QTcF >450, >480, and >500 ms, ΔQT/ΔQTcF >30 and >60 ms, and QT/QTcF + ΔQT/ΔQTcF >450 ms + >30 ms and >500 ms + >60 ms. Evaluated intervals of PR and QRS were >200 and >110 ms, respectively.
C‐QTc model
The C‐QTc analysis was performed according to a prespecified modeling analysis plan. Briefly, ΔQTcF was used as a dependent variable and the observed (time‐matched) balcinrenone concentration was used as an independent variable, and baseline QTcF, nominal time, and treatment arm were factors. A prespecified linear mixed‐effect (LME) model was used in the primary analysis, using Equation 1:
| (1) |
where ΔQTcF ijl is the change from baseline in QTcF for participant i in treatment j (0 = placebo, 1 = active drug) at time l; θ 0 is the population mean intercept in the absence of a treatment effect; h 0,i is the random effect associated with the intercept term θ 0; θ 1 is the fixed effect associated with treatment j; θ 2 is the population mean slope of the assumed linear association between concentration and ΔQTcF ijl ; h 2,i is the random effect associated with the slope θ 2; C ijl is the concentration for participant i in treatment j at time l; θ 3 is the fixed effect associated with time; and θ 4 is the fixed effect associated with baseline QTcF ijl=0; is overall mean of QTcF ijl0, that is, the mean of all the baseline (time = 0) QTcF values. The random effects are assumed to be normally distributed with mean [0, 0] and an unstructured covariance matrix. The code for fitting the C‐QT model is provided in the supplementary materials.
The diurnal change in placebo ΔQTcF time course is accounted for by using the time‐specific intercept at each sampling time point, regardless of its significance, to minimize the potential confounding effect of any diurnal change on ΔQTcF. The parameters of interest in the above model are the treatment‐specific intercept (θ 1) and coefficient for the concentration effect (slope, θ 2). They represent the effect of the drug on change of ΔQTcF that is adjusted for placebo time effect and baseline QTcF effect.
The final model was used to compute the baseline‐adjusted and placebo‐corrected QTcF (ΔΔQTcF) at concentrations of interest, such as the anticipated therapeutic maximum concentration (C max) at steady state and the highest clinically relevant C max at steady state. For the prespecified LME model (Equation 1), ΔΔQTcF was calculated as the difference between the model‐derived ΔQTcF at a given concentration and model‐derived ΔQTcF for placebo (i.e., at concentration = 0):
| (2) |
Analysis
Exploratory graphical analysis, C‐QTc modeling, and the estimation of ΔΔQTcF at the concentration of interest were performed using R software (version 3.5.1) and lme4 package (version 1.1‐7).
High clinical exposure scenario
The assumed therapeutic dose and dosing interval of balcinrenone is no higher than 40 mg once daily, administered in a capsule formulation (as this is the highest balcinrenone dose tested in the phase III study in patients with heart failure and impaired kidney function; ClinicalTrials.gov: NCT06307652). The high clinical exposure scenario for such a dose, as defined in the ICH S7B/E14 questions and answers document, 19 is 2.156 μmol/L. This exposure is defined as C max at the steady state following a 40‐mg dose of balcinrenone (capsule formulation) under fed conditions (ClinicalTrials.gov: NCT04798222; since there are no food restrictions for balcinrenone), in the presence of a strong cytochrome P450 3A4 (CYP3A4) inhibitor (the factor that has the largest effect on increasing C max at the steady state; ClinicalTrials.gov: NCT03843060 [data on file]).
RESULTS
Categorical evaluation
Only one ΔQT observation exceeded 30 ms (balcinrenone 1200 mg fractionated dose); there were no ΔQTcF measurements that exceeded 30 ms. As baseline was defined as the pre‐dose observation, the diurnal variation in ΔQT/QTcF is not accounted for. No QT/QTcF measurements exceeded 450 ms. In total, six PR observations exceeded 200 ms (three balcinrenone [5 and 800 mg, and 1200‐mg fractionated dose; each n = 1] and three placebo), and three QRS observations exceeded 110 ms (balcinrenone 25 and 200 mg, and 1200‐mg fractionated dose; each n = 1).
Evaluation of model assumptions
The effect of balcinrenone treatment on HR was assessed by comparing time profiles of plasma drug concentration, mean baseline‐adjusted HR (ΔHR), and baseline‐adjusted and placebo‐corrected HR (ΔΔHR). An increase in HR following administration of a 1200‐mg fractionated dose of balcinrenone was observed along with a mean increase in ΔΔHR of 10.2 bpm (Figure 1 and Figure S1).
FIGURE 1.

Time course of balcinrenone plasma concentration, and ΔHR and ΔQTcF. Points connected with lines denote mean values within one dosing arm. Treatment arms are presented as dashed lines, the placebo arm is presented as a yellow solid line. Error bars denote 90% confidence interval for HR measurements and SD for plasma drug concentration. QTcF, Fridericia‐corrected QT interval; SD, standard deviation; ΔHR, baseline‐adjusted heart rate; ΔQTcF, baseline‐adjusted QTcF interval.
Scatter plots of RR interval durations versus QT interval durations uncorrected for HR, and corrected by Bazett (QTcB) and by Fridericia (QTcF) supported that the Fridericia correction method 18 was appropriate for subsequent analysis (Figure S1B). Lack of hysteresis and lack of time delay between balcinrenone plasma concentration and ΔΔQTcF supported a direct relationship between drug concentration and QTcF effect (Figure S2). Scatter plots of ΔΔQTcF data and balcinrenone plasma concentration indicated a linear C‐QTcF relationship (Figure S3).
Since no delay in QT effect was observed, and the C‐QTcF relationship appeared linear as judged by exploratory plots, the prespecified model was considered applicable. However, since the analysis assumption regarding the lack of HR effect was not met, a sensitivity analysis was performed to evaluate the impact of including or excluding the highest balcinrenone dose (1200 mg fractionated) on QT prolongation.
C‐QTc model
The prespecified LME model for the C‐QTc primary analysis (including all assessed balcinrenone doses) described the observed data well, as evaluated by the goodness‐of‐fit plots (Figure 2). Model parameter estimates and their corresponding precisions are reported in Table S1. A statistically nonsignificant concentration–ΔQTcF relationship was estimated with a slope of −0.003 ms/μmol/L (95% confidence interval [CI]: −0.181, 0.176). The derived concentration–response relationship for ΔQTcF is shown in Figure 3.
FIGURE 2.
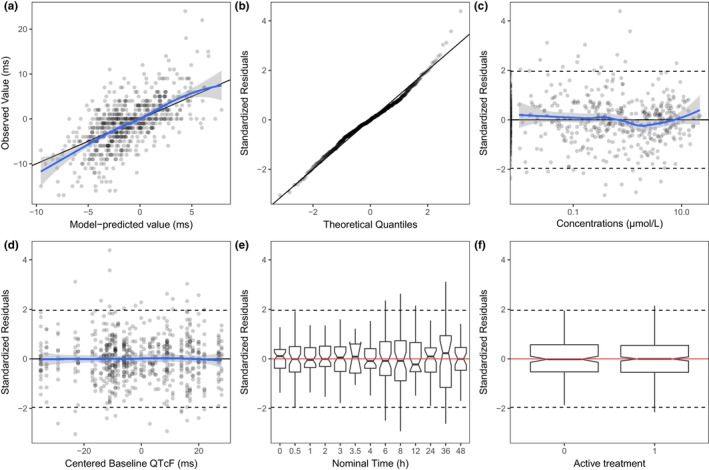
Diagnostic plots for the prespecified model (primary analysis). (a) Observed ΔQTcF versus predicted individual ΔQTcF; (b) quantile‐quantile plot of standardized residuals; (c) scatter plot of standardized residuals versus plasma balcinrenone concentration; (d) scatter plot of standardized residuals versus centered baseline QTcF; (e) box plot of standardized residuals by nominal time; (f) box plot of standardized residuals by treatment arm. Solid horizontal line is median (50th percentile); notches are 95% confidence intervals around medians; bars are IQR; whiskers represent the range of values no greater than: 1st quartile −1.5 × IQR and 3rd quartile +1.5 × IQR. IQR, interquartile range; QTcF, Fridericia‐corrected QT interval; ΔQTcF, baseline‐adjusted QTcF interval.
FIGURE 3.

Observed and estimated balcinrenone concentration–ΔQTcF relationship. Blue solid dots denote the estimated means within deciles of the observed data, blue shaded dots denote observations. Error bars denote 90% CI within respective deciles. Thin black solid line with ticks denotes decile bounds. Black curve with shaded area denotes mean model predictions with 90% CI. Red curve is the locally estimated scatterplot smoothing. CI, confidence interval; QTcF, Fridericia‐corrected QT interval; ΔQTcF, baseline‐adjusted QTcF interval.
Estimation of QT prolongation at the high clinical exposure scenario
Model‐predicted mean ΔΔQTcF with 90% confidence interval (CI) at the high clinical exposure scenario and at the highest achieved supratherapeutic exposure are presented in Table 1. The model‐derived mean ΔΔQTcF at the high clinical exposure scenario was estimated at 0.35 ms (90% CI: −1.29, 2.00). The highest exposure observed in study D6400C00001 was 16.7 μmol/L, thus providing a 7.7‐fold exposure margin to the high clinical exposure scenario. As shown in Figure 4, the upper 90% CI is estimated to be consistently below 10 ms in the studied exposure range of balcinrenone (up to 16.7 μmol/L).
TABLE 1.
Mean of model‐derived ΔΔQTcF predictions at the highest clinically relevant balcinrenone concentrations (primary analysis).
| Balcinrenone exposure | C max (μmol/L) | ΔΔQTcF | 90% CI |
|---|---|---|---|
| Primary analysis | |||
| Highest clinically relevant scenario, assuming a therapeutic dose of 40 mg | 2.16 | 0.35 | (−1.29, 2.00) |
| Supratherapeutic dose (primary analysis, 1200 mg fractionated) | 16.70 | 0.31 | (−2.26, 2.88) |
Abbreviations: CI, confidence interval; C max, maximum concentration; QTcF, Fridericia‐corrected QT interval; ΔΔQTcF, baseline‐adjusted and placebo‐corrected QTcF interval.
FIGURE 4.

Model‐derived balcinrenone concentration–ΔΔQTcF relationship (calculated for the entire observed concentration range). Black line with shaded area denotes mean model estimates with 90% CI. Purple arrow represents the upper 90% CI of the ΔΔQTcF at the high clinical exposure scenario, assuming a therapeutic dose of 40 mg q.d. CI, confidence interval; q.d., once daily; QTcF, Fridericia‐corrected QT interval; ΔΔQTcF, baseline‐adjusted and placebo‐corrected QTcF interval.
Sensitivity analysis
Due to the observed HR effect at the highest balcinrenone dose, a sensitivity analysis was performed to evaluate the impact of including or excluding the highest balcinrenone dose (1200‐mg fractionated dose) on QT prolongation. The goodness‐of‐fit diagnostic plots for the LME model for the C‐QTc sensitivity analysis (comprising the highest balcinrenone dose of 800 mg fractionated) are shown in Figure S4. Model parameter estimates and their corresponding precisions are reported in Table S1. A statistically nonsignificant concentration–ΔQTcF relationship was estimated with a slope of −0.140 ms/μmol/L (95% CI: −0.408, 0.127).
Model‐predicted mean ΔΔQTcF with 90% CI at the achieved supratherapeutic exposure with balcinrenone 800 mg fractionated dose supported the results from the primary analysis (Table S2). As shown in Figure S5, the upper 90% CI is estimated to be consistently below 10 ms in the studied exposure range of balcinrenone (up to 14.3 μmol/L).
DISCUSSION
This analysis evaluated the potential for QT prolongation of the novel, nonsteroidal, selective MR modulator, balcinrenone, as part of a prespecified C‐QTc analysis from a phase I SAD study in healthy male participants. The analysis followed the recommendations outlined in the scientific white paper by Garnett et al. 9 Not all assumptions of the prespecified model were met since an increase in ΔΔHR (by 10.2 bpm) was observed following administration of the highest balcinrenone dose (1200‐mg fractionated dose). However, since no delay in QT effect was observed, and the C‐QTcF relationship appeared linear as judged by exploratory plots, the prespecified model was considered applicable. The model fit was also deemed adequate by evaluation of goodness‐of‐fit plots, and the slope of the concentration–ΔQTcF relationship was not significant.
The therapeutic dose for balcinrenone is expected to be no higher than 40 mg once daily, since this is the highest dose tested in the phase III study (ClinicalTrials.gov: NCT06307652); the anticipated therapeutic C max at steady state for this dose, under fed conditions and in the presence of a strong CYP3A4 inhibitor, is 2.156 μmol/L, and it was used as the high clinical exposure scenario at which ΔΔQTcF should be evaluated. The threshold level of regulatory concern for ΔΔQTc prolongation in the population is a mean of ~5 ms, indicated by an upper one‐sided 95% CI (equivalent to an upper two‐sided 90% CI) exceeding 10 ms. 9 , 10 In the present analysis, the upper two‐sided 90% CI for the model‐predicted ΔΔQTcF was consistently below 10 ms in the entire studied exposure range of balcinrenone, including the high clinical exposure scenario, as well as the supratherapeutic exposure (up to 16.7 μmol/L). Taken together, this indicates that balcinrenone does not prolong QT at clinically relevant high exposure.
Following a single oral suspension of balcinrenone, absorption has been shown to be fast and, following attainment of C max, the plasma concentration declined rapidly and virtually monoexponentially with an elimination half‐life of 2–3 h. 17 No accumulation of balcinrenone was assumed following once‐daily dosing to steady state, based on the short half‐life. 20 For this reason, and given the low level of balcinrenone metabolites with no indication of metabolites with longer half‐lives than the parent compound, 20 it was deemed that single‐dose data are sufficient for the C‐QTc assessment of balcinrenone, as per the recommendations from Garnett et al. 9 The definition of the high clinical exposure scenario for balcinrenone in this analysis is based on the assessment of various intrinsic and extrinsic factors that impact C max. For balcinrenone, the factor that has the highest impact on C max is co‐administration with a strong CYP3A4 inhibitor, which increased C max of balcinrenone by a factor of 2.22 (administration with itraconazole, a strong CYP3A4 inhibitor in study NCT03843060 [ClinicalTrials.gov; data on file]). Currently, there are no other factors that increase the C max of balcinrenone more than co‐administration with a strong CYP3A4 inhibitor. Administration in fed state was assumed when defining high clinical scenario since there are no food restrictions for balcinrenone, and it was assumed likely that patients will take the drug under fed conditions. Therefore, we can conclude that the high clinical exposure scenario is reasonably and accurately defined for balcinrenone.
The highest concentration achieved in this study was with the balcinrenone 1200‐mg fractionated dose. The 7.7‐fold exposure margin to the high clinical exposure scenario with the balcinrenone 1200‐mg fractionated dose in this study supports the acceptance of not using a positive control to assess assay sensitivity. 10 Given the observed increase in ΔΔHR following administration of the balcinrenone 1200‐mg fractionated dose, a sensitivity analysis excluding the highest dose arm was performed to ensure adequate evaluation of QT prolongation. The model‐estimated ΔΔQTcF from the sensitivity analysis was −0.66 ms (90% CI: −2.73, 1.42). The results from both the primary analysis and the sensitivity analysis were consistent and indicated that balcinrenone does not have a QT prolongation effect at the clinically highest achieved exposure. The fact that the modeling results were similar for the primary and sensitivity analyses confirmed that the exclusion of the highest balcinrenone dose did not impact the C‐QTc assessment. It is important to highlight that the increase in mean ΔΔHR was only observed following administration of balcinrenone 1200‐mg fractionated dose, despite a similar exposure as with the 800‐mg fractionated dose arm, and the mean increase in ΔΔHR was partly driven by an increase in one participant. Importantly, since the increase in HR was small and observed at a maximum exposure ~7.7‐fold higher than the high clinical exposure scenario, an increase in HR at clinically therapeutic exposures is not anticipated. Indeed, no adverse trends in 12‐lead ECG, blood pressure, or HR have been reported following multiple ascending oral doses of balcinrenone up to 300 mg twice daily and SADs of balcinrenone of 5–1200 mg. 17 , 21
In addition, since balcinrenone is developed in combination with dapagliflozin, it is important to highlight that co‐administration with dapagliflozin does not affect exposure of balcinrenone [data on file]. Therefore, the conclusions from this C‐QTc assessment based on data of balcinrenone monotherapy are also applicable to combination with dapagliflozin.
CONCLUSIONS
In conclusion, C‐QTc analysis of time‐matched PK and dECG samples from the phase 1 SAD study in healthy male participants (D6400C00001, ClinicalTrials.gov: NCT02484729) was used to assess the risk of QT‐interval prolongation of balcinrenone. The upper bound of the two‐sided 90% CI for the QTcF effect of balcinrenone treatment was estimated as 2.00 ms at the high clinical exposure scenario. As the effect on QTcF is below the threshold for regulatory concern (10 ms), it can be concluded that balcinrenone does not prolong the QTcF interval of drug safety or regulatory concern at the high clinical exposure scenario.
AUTHOR CONTRIBUTIONS
J.S., D.R., J.M., S.J., A.E., C.D., and J.P. wrote the manuscript; J.S., D.R., J.M., S.J., A.E., C.D., and J.P. designed the research; J.S. performed the research; J.S. analyzed the data.
FUNDING INFORMATION
This study was funded by AstraZeneca.
CONFLICT OF INTEREST STATEMENT
D.R., J.M., S.J., A.E., C.D., and J.P. are employees of AstraZeneca and may hold stock in the company. J.S. is a former employee of AstraZeneca.
Supporting information
Table S1
Table S2
Figure S1
Figure S2
Figure S3
Figure S4
Figure S5
supplementary materials
ACKNOWLEDGMENTS
The authors thank the subjects who participated in the study. Moreover, the authors thank Hans Ericsson for valuable scientific discussions. Medical writing support was provided by Shaun W. Foley, BSc (Hons), ISMPP CMPP™, and editorial support was provided by Sharmin Saleque, MSc, and Jess Fawcett, BSc, of Core (a division of Prime, London, UK), supported by AstraZeneca according to Good Publication Practice guidelines (https://www.acpjournals.org/doi/10.7326/M22‐1460). The Sponsor was involved in the study design, collection, analysis, and interpretation of data, as well as data checking of information provided in the manuscript. However, ultimate responsibility for opinions, conclusions, and data interpretation lies with the authors.
Sundell J, Rekic D, Melin J, et al. Concentration–QT modeling demonstrates that the selective mineralocorticoid receptor modulator, balcinrenone (AZD9977), does not prolong QT interval. CPT Pharmacometrics Syst Pharmacol. 2025;14:292‐301. doi: 10.1002/psp4.13272
DATA AVAILABILITY STATEMENT
Data underlying the findings described in this manuscript may be obtained in accordance with AstraZeneca's data‐sharing policy described at: https://astrazenecagrouptrials.pharmacm.com/ST/Submission/Disclosure. Data for studies directly listed on Vivli can be requested through Vivli at: www.vivli.org. Data for clinical not listed on Vivli could be requested through Vivli at: https://vivli.org/members/enquiries‐about‐studies‐not‐listed‐on‐the‐vivli‐platform/. AstraZeneca Vivli member page is also available outlining further details: https://vivli.org/ourmember/astrazeneca/.
REFERENCES
- 1. Gilbert KC, Brown NJ. Aldosterone and inflammation. Curr Opin Endocrinol Diabetes Obes. 2010;17:199‐204. doi: 10.1097/med.0b013e3283391989 [DOI] [PMC free article] [PubMed] [Google Scholar]
- 2. Tesch GH, Young MJ. Mineralocorticoid receptor signaling as a therapeutic target for renal and cardiac fibrosis. Front Pharmacol. 2017;8:313. doi: 10.3389/fphar.2017.00313 [DOI] [PMC free article] [PubMed] [Google Scholar]
- 3. Bertocchio J‐P, Warnock DG, Jaisser F. Mineralocorticoid receptor activation and blockade: an emerging paradigm in chronic kidney disease. Kidney Int. 2011;79:1051‐1060. doi: 10.1038/ki.2011.48 [DOI] [PubMed] [Google Scholar]
- 4. Bauersachs J, Jaisser F, Toto R. Mineralocorticoid receptor activation and mineralocorticoid receptor antagonist treatment in cardiac and renal diseases. J Hypertens. 2015;65:257‐263. doi: 10.1161/HYPERTENSIONAHA.114.04488 [DOI] [PubMed] [Google Scholar]
- 5. Squire IB, Gabrielsen A, Greasley PJ, et al. Effect of AZD9977 and spironolactone on serum potassium in heart failure with preserved or mildly reduced ejection fraction, and renal impairment: a randomized trial. Clin Transl Sci. 2022;15:2493‐2504. doi: 10.1111/cts.13377 [DOI] [PMC free article] [PubMed] [Google Scholar]
- 6. Bamberg K, Johansson U, Edman K, et al. Preclinical pharmacology of AZD9977: a novel mineralocorticoid receptor modulator separating organ protection from effects on electrolyte excretion. PLoS One. 2018;13:e0193380. doi: 10.1371/journal.pone.0193380 [DOI] [PMC free article] [PubMed] [Google Scholar]
- 7. Darpo B. The thorough QT/QTc study 4 years after the implementation of the ICH E14 guidance. Br J Pharmacol. 2010;159:49‐57. doi: 10.1111/j.1476-5381.2009.00487.x [DOI] [PMC free article] [PubMed] [Google Scholar]
- 8. US Department of Health and Human Services Food and Drug Administration , Center for Drug Evaluation and Research (CDER) , Center for Biologics Evaluation and Research (CBER) . E14 clinical evaluation of QT/QTc interval prolongation and proarrhythmic potential for non‐antiarrhythmic drugs. Guidance for industry. 2005. https://www.fda.gov/files/drugs/published/E14‐Clinical‐Evaluation‐of‐QT‐QTc‐Interval‐Prolongation‐and‐Proarrhythmic‐Potential‐for‐Non‐Antiarrhythmic‐Drugs.pdf. Accessed August 15, 2024.
- 9. Garnett C, Bonate PL, Dang Q, et al. Scientific white paper on concentration‐QTc modeling. J Pharmacokinet Pharmacodyn. 2018;45:383‐397. doi: 10.1007/s10928-017-9558-5 [DOI] [PubMed] [Google Scholar]
- 10. US Department of Health and Human Services Food and Drug Administration , Center for Drug Evaluation and Research (CDER) , Center for Biologics Evaluation and Research (CBER) . E14 clinical evaluation of QT/QTc interval prolongation and proarrhythmic potential for non‐antiarrhythmic drugs — Questions and answers (R3). Guidance for industry. 2017. https://www.fda.gov/media/71379/download. Accessed August 15, 2024.
- 11. Garnett CE, Beasley N, Bhattaram VA, et al. Concentration‐QT relationships play a key role in the evaluation of proarrhythmic risk during regulatory review. J Clin Pharmacol. 2008;48:13‐18. doi: 10.1177/0091270007307881 [DOI] [PubMed] [Google Scholar]
- 12. Rekić D, Azarov I, Knöchel J, et al. AZD8233 antisense oligonucleotide targeting PCSK9 does not prolong QT interval. Br J Clin Pharmacol. 2022;88:4839‐4844. doi: 10.1111/bcp.15425 [DOI] [PubMed] [Google Scholar]
- 13. Voronova V, Cullberg M, Delff P, et al. Concentration‐QT modelling shows no evidence of clinically significant QT interval prolongation with capivasertib at expected therapeutic concentrations. Br J Clin Pharmacol. 2022;88:858‐864. doi: 10.1111/bcp.15006 [DOI] [PMC free article] [PubMed] [Google Scholar]
- 14. Darpo B, Benson C, Dota C, et al. Results from the IQ‐CSRC prospective study support replacement of the thorough QT study by QT assessment in the early clinical phase. Clin Pharmacol Ther. 2015;97:326‐335. doi: 10.1002/cpt.60 [DOI] [PubMed] [Google Scholar]
- 15. Gurkan S, Liu F, Chain A, Gutstein DE. A study to assess the proarrhythmic potential of mirtazapine using concentration‐QTc (C‐QTc) analysis. Clin Pharmacol Drug Dev. 2019;8:449‐458. doi: 10.1002/cpdd.605 [DOI] [PubMed] [Google Scholar]
- 16. Mu S, Darpo B, Tang Z, et al. No QTc prolongation with zanubrutinib: results of concentration‐QTc analysis from a thorough QT study in healthy subjects. Clin Transl Sci. 2020;13:923‐931. doi: 10.1111/cts.12779 [DOI] [PMC free article] [PubMed] [Google Scholar]
- 17. Erlandsson F, Albayaty M, Chialda L, et al. Clinical safety, tolerability, pharmacokinetics and effects on urinary electrolyte excretion of AZD9977, a novel, selective mineralocorticoid receptor modulator. Br J Clin Pharmacol. 2018;84:1486‐1493. doi: 10.1111/bcp.13562 [DOI] [PMC free article] [PubMed] [Google Scholar]
- 18. Fridericia LS. Die systolendauer im elektrokardiogramm bei normalen menschen und bei herzkranken. Acta Med Scand. 1920;53:469‐486. doi: 10.1111/j.0954-6820.1920.tb18266.x [DOI] [Google Scholar]
- 19. US Food and Drug Administration . E14 and S7B clinical and nonclinical evaluation of QT/QTc interval prolongation and proarrhythmic potential — Questions and answers. Guidance for industry. 2022. https://www.fda.gov/media/161198/download. Accessed August 15, 2024
- 20. Lindmark B, Li X‐Q, Bhattacharya C, et al. Mass balance and absorption, distribution, metabolism, and excretion properties of balcinrenone following oral administration in combination with intravenous microtracer in healthy subjects. Drug Metab Dispos. 2023;51:995‐1004. doi: 10.1124/dmd.122.001240 [DOI] [PubMed] [Google Scholar]
- 21. Whittaker A, Kragh ÅM, Hartleib‐Geschwindner J, et al. Safety, tolerability, and pharmacokinetics of the mineralocorticoid receptor modulator AZD9977 in healthy men: a phase I multiple ascending dose study. Clin Transl Sci. 2020;13:275‐283. doi: 10.1111/cts.12705 [DOI] [PMC free article] [PubMed] [Google Scholar]
Associated Data
This section collects any data citations, data availability statements, or supplementary materials included in this article.
Supplementary Materials
Table S1
Table S2
Figure S1
Figure S2
Figure S3
Figure S4
Figure S5
supplementary materials
Data Availability Statement
Data underlying the findings described in this manuscript may be obtained in accordance with AstraZeneca's data‐sharing policy described at: https://astrazenecagrouptrials.pharmacm.com/ST/Submission/Disclosure. Data for studies directly listed on Vivli can be requested through Vivli at: www.vivli.org. Data for clinical not listed on Vivli could be requested through Vivli at: https://vivli.org/members/enquiries‐about‐studies‐not‐listed‐on‐the‐vivli‐platform/. AstraZeneca Vivli member page is also available outlining further details: https://vivli.org/ourmember/astrazeneca/.