

Abstract
Compared with ordinary steels, stainless steels possess advantages such as robust corrosion resistance, beautiful appearance, and excellent ductility. This article investigated the performance of a novel C-shaped folded flange section stainless steel beam with web stiffeners under bending and shear interaction, with a focus on the effect of the web tension field on its performance after transverse constraint. Stiffeners can effectively promote the bearing capacity of cold-formed thin-wall components, and folded flanges are convenient for connecting to floors, thus expanding the application range of stainless steel components. This study detailed the three-point bending tests conducted on specimens with shear span ratios of 1.5 and 2, as well as the numerical analysis methods employed. The experimental results of ultimate bearing capacity were compared with the predictions made by the Direct Strength Method (DSM) and Continuous Strength Method (CSM) adopted in current design codes. It was found that positioning the stiffeners closer to the compression flange enhanced the bearing capacity of the member, and this enhancement effect became more pronounced with an increase in the shear span ratio. Furthermore, the Continuous Strength Method (CSM) predicts the moment and shear bearing capacity more accurately. Furthermore, the Continuous Strength Method (CSM) provided more precise predictions of both the bending moment and shear capacity under the web tension field. The research results are helpful to provide theoretical basis and technical support for such members in engineering applications.
Keywords: Stainless steel, C-shaped folded flange beams, Web-stiffened, Design rules, Combined bending and shear
Subject terms: Engineering, Civil engineering, Materials science, Structural materials, Metals and alloys
Introduction
With the deepening of the concept of sustainable development and the gradual promotion of life cycle cost accounting, stainless steel materials are increasingly applied in structural engineering due to their excellent corrosion resistance, ease of maintenance, and elegant appearance1–4. However, one of the major obstacles to the large-scale application of stainless steel members lies in their relatively high material costs. Additionally, the higher hardness of stainless steel compared to ordinary carbon steel leads to a corresponding increase in manufacturing and processing costs. Therefore, under fixed costs, how to design the cross-sections of stainless steel members more efficiently has become a key and significant topic.
Previous research on cold-formed thin-walled steel sections has primarily focused on the mechanical properties of C-shaped beams5–9, C-shaped columns with or without lips10, and hat-shaped, I-shaped, and Z-shaped beams11. To design more efficient sections, Sabbagh et al.12 designed curved flange sections by stiffening the flange in-plane and adding lips to improve the flexural capacity of the section. Analysis showed that bending the flanges into an arc shape significantly enhanced the ductility and energy dissipation capacity of the section. However, the processing of curved flanges is challenging, and connecting arc-shaped flanges to floor slabs poses certain problems in practical applications. To address these issues, Ye et al.13 extended the effective width method in the Eurocode 3: Design of Steel Structures14 and designed a novel folded flange section by considering multiple buckling modes. They used a particle swarm optimization algorithm to calculate the ultimate flexural capacity of different types of sections. The results highlight a 57% improvement compared to a standard commercially available channel section and 22% compared to an optimum lipped channel section. Due to their large width-to-thickness ratios, cold-formed thin-walled steel members are prone to local and distortional buckling under external loads. To prevent premature local buckling of plates, the most commonly used method is to install bend stiffeners within the section15–19. Experimental research by Kwon et al.20 found that installing bend stiffeners within the section can significantly improve the ultimate flexural capacity of members and increase the critical stress for local buckling of the stiffened section. Pham and Hancock21 demonstrated that the tension field effect, which occurs after the web undergoes transverse constraint, enhances the post-shear buckling strength of the web. While web-stiffened stainless steel members have been studied extensively in contexts such as lipped channels9, built-up sections22,23, and cold-formed profiles24,25, research on C-shaped folded flange sections remains sparse. The interaction of bending and shear in such sections26,27, combined with the strategic positioning of web stiffeners to enhance compression flange performance, introduces a unique perspective that has not been previously addressed. This study aims to fill this gap by investigating the behavior of C-shaped folded flange stainless steel beams with web stiffened under combined bending and shear. Therefore, this study investigated the influence of the web tension field on the bending-shear performance of web-stiffened folded flange C-beams, using both experiments and numerical simulations.
Many countries have published their own design standards for stainless steel structures, including the American National Standard ANSI/AISC 370-202128, the European Standard EN 1993-1-4+A1: 201529, and China’s Technical Specification for Stainless Steel Structures CECS 410:201530. Currently, the Direct Strength Method (DSM) and Continuous Strength Method (CSM) have become widely adopted approaches in the design of stainless steel members. DSM was initially proposed by Schafer and Peköz31 for cold-formed carbon steel structures and has been incorporated into the North American Specification for the Design of Cold-Formed Steel Structural Members (AISI S100-16)32 and the Australia/New Zealand Standard Cold-formed Steel Structures AS/NZS 4600:201833. The CSM was first developed by Gardner and Nethercot34 for stainless steel hollow structural members, utilizing the material’s strain hardening characteristics to achieve more accurate and consistent load capacity predictions by considering the interaction between elements and the base curve associated with the overall cross-sectional slenderness ratio. Zhao and Gardner35 proposed the CSM for non-biaxial symmetric sections such as angle, channel, and T-shaped stainless steel beams.
In this study, experimental and numerical calculations were conducted on a web-stiffened folded flange C-beam subjected to web tension field under bending-shear action. Eight groups of austenitic 304 stainless steel three-point bent members were tested. A nonlinear finite element model of the C-shaped beam was developed using ABAQUS/CAE (V6.14, https://www.3ds.com/products/simulia/abaqus/cae)36, and the model was validated against the experimental results. The test results were compared with the design strengths predicted by AS/NZS 4600:201833, CSM35,37, and DSM38–40. The findings indicated that the calculation of bending and shear capacities based on CSM design rules more accurately reflected the web tension field effect of web-stiffened folded flange C-beam under combined bending and shear action.
Experimental study
Specimen design
Based on the specifications of Eurocode 314 regarding the angles between individual plate components, width-to-thickness ratios of plates, and relative dimensions, this study designed four cross-section forms. Two shear span ratios of a/h = 1.5 and a/h = 2 (where 'a' is the bolt center-to-center distance inside the web, as shown in Fig. 1; and 'h' is the height of the web) were considered to investigate the mechanical behavior of C-shaped folded flange sections with web stiffeners under combined bending and shear loads. The cross-section forms and geometric dimensions of the specimens are illustrated in Fig. 2, where SP-V-3 (SP-V-4) and SP-V-1 (SP-V-2) share identical geometric parameters, with the only difference being the location of the stiffening, positioned 1/3 from the edge fibers of the upper compression flange (80 mm), to compare the enhancement in load-bearing capacity.
Fig. 1.

Schematic diagram of shear-span ratio parameters.
Fig. 2.

Cross-section forms and geometric dimensions of specimens.
Figure 3 defines the geometric parameters of the four cross-section forms. The measured dimensions from the experiments are listed in Table 1, where h, c, e, f, and t represent the web height, folded flange width, flat flange width, edge flange width, and section thickness, respectively. Swb and Swh represent the opening width and height of the V-shaped stiffener, while θ1 and θ2 represent the internal and external angles of the folded flange.
Fig. 3.
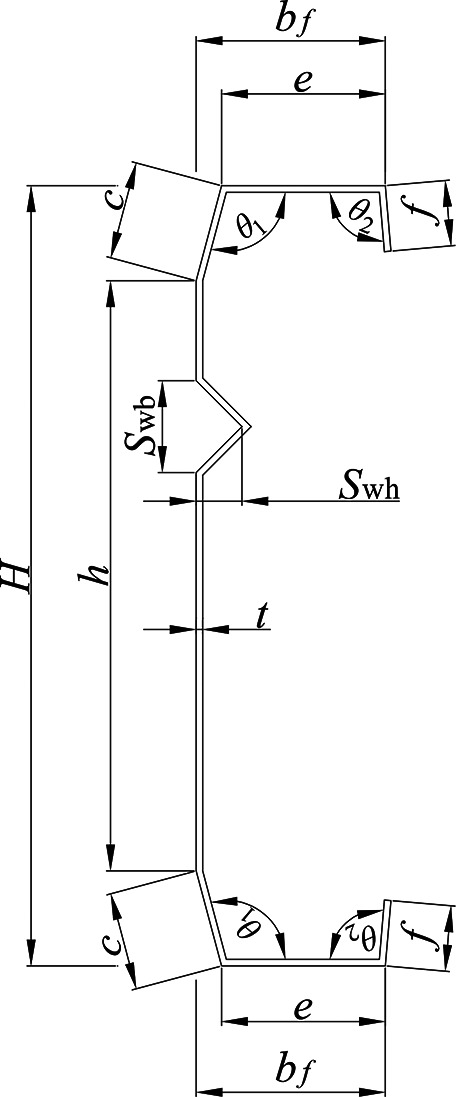
Definitions of geometric parameters for the cross-sections of specimens.
Table 1.
Measured geometric dimensions of specimens.
| Specimen | h/mm | c/mm | e/mm | f/mm | t/mm | Swb/mm | Swh/mm | θ1/º | θ2/º | a/h | Δl/mm |
|---|---|---|---|---|---|---|---|---|---|---|---|
| SP-V-1 | 182.00 | 28.88 | 48.55 | 19.25 | 2.00 | 36.05 | 17.55 | 107.75 | 97.50 | 1.50 | 0.13 |
| SP-V-2 | 182.00 | 29.42 | 48.72 | 18.92 | 2.00 | 36.33 | 17.93 | 106.50 | 100.50 | 2.00 | 0.16 |
| SP-V-3 | 181.75 | 29.64 | 48.81 | 18.79 | 2.00 | 37.86 | 17.82 | 107.75 | 96.25 | 1.50 | 0.15 |
| SP-V-4 | 181.50 | 29.46 | 48.50 | 19.01 | 2.00 | 36.10 | 17.74 | 106.50 | 97.50 | 2.00 | 0.18 |
| SP-V-5 | 222.00 | 38.40 | 54.03 | 19.15 | 2.00 | 36.89 | 17.05 | 106.00 | 97.00 | 1.50 | 0.21 |
| SP-V-6 | 222.00 | 38.57 | 53.36 | 19.25 | 2.00 | 35.38 | 18.30 | 105.50 | 96.50 | 2.00 | 0.24 |
| SP-V-7 | 262.10 | 47.18 | 57.92 | 18.70 | 2.00 | 37.81 | 18.57 | 106.50 | 97.00 | 1.50 | 0.28 |
| SP-V-8 | 262.00 | 47.97 | 59.15 | 19.25 | 2.00 | 35.40 | 17.71 | 104.50 | 97.50 | 2.00 | 0.30 |
Geometric imperfections
Before testing the specimens, the local geometric initial imperfections of the webs and flanges between the supports at both ends of the specimens were measured using the method described in literature41. Each test group consists of two specimens, numbered as SP-V-n-1 and SP-V-n-2. The distribution of imperfections in the longest specimen, SP-V-8, is shown in Fig. 4. The defect measurement value, Δl, represents the absolute maximum imperfection among the plate components of each specimen, as listed in Table 1. The measurement results indicate that the initial imperfections in the inclined flanges are relatively large, with the maximum amplitude of plate imperfections being 0.3 mm (c/160), which complies with the requirements specified in the GB 50205-2001 Code for Acceptance of Construction Quality of Steel Structures42.
Fig. 4.

Distribution of local imperfections in SP-V-8. (a) SP-V-8-1. (b) SP-V-8-2
Material properties
The tensile coupon tests were cut from stainless steel members using a laser cutting machine. Three specimens were extracted from the web, tension flange, and compression flange of the test specimen, respectively. A material testing machine was employed to conduct the tensile tests. Experimental data were obtained through an extensometer and strain data collection instrument, yielding an average elastic modulus (E) of 197GPa, a nominal yield strength ( ) of 327 MPa, an ultimate tensile strength (
 ) of 621 MPa, and an elongation after fracture (
 ) of 56%. The stress–strain curves for the three sets of specimens are detailed in Fig. 5.
Fig. 5.

Stress–strain curves of specimens.
Test setup and procedure
The experimental setup is illustrated in Fig. 6. When designing the experimental setup, the CUFSM software (V5.01, http://www.ce.jhu.edu/bschafer/cufsm/)43 was first used to analyze the C-shaped section properties in the test, determining the location of the shear center. The dimensions of this shear center dictated the gap between two identical opposing C-shaped specimens, as well as the positions of the loading points and support centers. During the test, two C-channel specimens with folded-flange, exhibiting identical cross-sections, were placed back-to-back, leaving a gap equal to twice the distance from the web to the shear center between them. By placing T-shaped plates and steel plates between the two specimens, the vertical load was directed through the shear center. Following the relevant provisions in the GB 50,017–2017 Standard for Design of Steel Structures44, the nominal diameter of high-strength bolts, bolt hole spacing, edge distance, and end distance were designed. A 30 mm thick, 85 mm wide T-plate and two web side plates were used to fill the gaps at the supports and loading points at both ends of the two opposing C-shaped specimens. The webs of the two specimens were then connected to the T-plate and the two web side plates using M10 high-strength bolts. An outer steel plate was attached to the side of the bolts in contact with the specimens to prevent local pressure overload at the bolt holes from damaging the specimens. The T-plate (the dimensions of the T-plate are shown in Fig. 6c), web side plates (whose thickness was the shear center dimensions minus half of the T-plate thickness, and the width was the same as the T-plate), and outer steel plates (the thickness was10mm, and the width was the same as the T-plate) were all made of Q235B-grade hot-rolled steel plates. The load was evenly transmitted to the webs of the two opposing specimens through the friction between the web of the T-plate and the high-strength bolts, and then transferred to the entire specimen through the webs. To prevent overturning of the specimen flanges, eight equal-leg angle steels (40 × 40 × 5 in size) were installed near the loading points and supports to connect the upper or lower flanges of the two C-beams. The incorporation of T-plates and web side plates enhances the lateral restraint of C-beams, altering the stress–strain distribution within the web and creating a "tension field action effect,"21,45 which boosts the post-shear buckling strength of the web. Although these plates alter the “natural behavior” of the specimens, they represent an effective means of enhancing structural capacity in engineering practice.
Fig. 6.

Experimental Setup. (a) Laboratory TestSetup. (b) Schematic Diagram of Test Setup. (c) T-plate Dimensions.
In this test, each group of specimens was equipped with corresponding rosette strain gauges and uniaxial strain gauges to monitor the changes and development of strains in the web and flanges during loading, as detailed in Fig. 7. Additionally, eight displacement sensors were arranged for each group of test specimens. Four of them were located at the centers of the four grids formed by the web side plates and web stiffeners, used to measure the lateral deflection of the specimens. The other four displacement sensors were used to measure the vertical deflection at both ends of the supports and at the mid-span of the two specimens, respectively. Installing the displacement sensors for measuring the vertical deflection of the supports at both ends on the lower flange outside the supports may introduce potential inaccuracies due to the influence of beam body deformation and local flange bending. To mitigate this, this study employed finite element analysis in subsequent data processing to simulate the deformation of the lower flange under the test load, calculated the deformation of the lower flange independently, and then subtracted this calculated deformation from the total displacement value measured by the displacement sensors, thereby obtaining a more precise vertical deflection of the supports.
Fig. 7.

Location of Strain and Displacement Sensors.
Prior to formal loading, a pre-load was applied in three stages up to 15% of the estimated ultimate load. The uniformity of load distribution between the two specimens was assessed by checking the readings of the displacement gauges and strain gauges at the same cross-section. Adjustments were made to the jack’s position as needed until the forces on both specimens were equal. During formal loading, a displacement-controlled method was employed at a constant rate of 0.5 mm/s, applying the load at the center of the T-shaped plate at mid-span. Loading was halted when the load dropped to 80% of the peak load or when significant deformation occurred, marking the end of the test.
Experimental results and analysis
Experimental observations
Each test group consists of two specimens, numbered as SP-V-n-1 and SP-V-n-2. As shown in Fig. 8, the failure modes of the two specimens within the same group are generally identical. Throughout the tests, the specimens exhibited web shear buckling and local flange buckling failure. The failure modes after peak load are shown in Fig. 8, where significant bulging deformation was observed in the web near the loading plate, and local flange buckling mainly occurred in the compression flange region near the loading plate. Figure 8e–h indicated that when the stiffening position was closer to the compression flange, the development range of the larger quadrant formed by the web side plates and stiffeners was wider, while the smaller quadrant exhibited less bulging. The specimens of SP-V-6 in Fig. 8k,l and SP-V-8 in Fig. 8o,p failed on one side of the loading plate, primarily attributed to the stress redistribution that occurred solely within one side of the span under the antisymmetric defective buckling mode45. The failure of the single web side resulted in the need to redistribute the shear force to the flanges and the remaining webs, but the shear capacity of the flanges was weak. This caused a reduction in the maximum shear force that the entire member could withstand, potentially leading to failure at a shear force lower than the design value.
Fig. 8.

Combined Buckling Failure Modes of Test Specimens. (a) SP-V-1-1. (b) SP-V-1-2. (c) SP-V-2-1. (d) SP-V-2-2. (e) SP-V-3-1. (f) SP-V-3-2. (g) SP-V-4-1. (h) SP-V-4-2. (i) SP-V-5-1. (j) SP-V-5-2. (k) SP-V-6-1. (l) SP-V-6-2. (m) SP-V-7-1. (n) SP-V-7-2. (o) SP-V-8-1. (p) SP-V-8-2.
Peak load
Table 2 lists the peak loads from the tests. The peak loads for the test specimens with a/h = 1.5 were all greater than those for a/h = 2. Specimens with stiffening closer to the compression flange showed an increase in peak load: by 0.94% for a/h = 1.5 and by 6.37% for a/h = 2. This indicates that positioning the stiffening closer to the compression flange can enhance the load-bearing capacity of bending and shear loaded members. However, by normalizing the ultimate load with the yield strength, i.e., the ratio of the ultimate load (MP = Wpl·σ0.2) to the peak test load (MTest), it can be seen that the bearing capacity of the specimens is affected by initial defects and the cross-sectional area of the web. For example, when the shear span ratio (a/h) is 1.5, the specimens with h of 220 mm exhibit the minimum bearing capacity. On the other hand, when the shear span ratio is 2, the bearing capacity of the specimens increases as the web’s height-to-thickness ratio decreases.
Table 2.
Comparison of experimental and finite element results.
| Specimen | a/h | Test results | Finite element results | MP (kN·m) |  |
 |
||||
|---|---|---|---|---|---|---|---|---|---|---|
| Put | VTest | MTest | Puf | VFEA | MFEA | |||||
| (kN) | (kN) | (kN·m) | (kN) | (kN) | (kN·m) | |||||
| SP-V-1 | 1.50 | 181.36 | 45.34 | 9.97 | 181.81 | 45.45 | 10.00 | 19.10 | 1.916 | 0.998 |
| SP-V-2 | 2.00 | 150.66 | 37.67 | 11.68 | 152.77 | 38.19 | 11.84 | 19.23 | 1.646 | 0.986 |
| SP-V-3 | 1.50 | 183.07 | 45.77 | 10.07 | 185.66 | 46.42 | 10.21 | 19.28 | 1.915 | 0.986 |
| SP-V-4 | 2.00 | 160.26 | 40.07 | 12.42 | 160.40 | 40.10 | 12.43 | 19.20 | 1.546 | 0.999 |
| SP-V-5 | 1.50 | 194.63 | 48.66 | 13.14 | 195.81 | 48.95 | 13.22 | 27.81 | 2.116 | 0.994 |
| SP-V-6 | 2.00 | 167.30 | 41.83 | 15.90 | 169.54 | 42.39 | 16.11 | 27.74 | 1.745 | 0.987 |
| SP-V-7 | 1.50 | 209.06 | 52.27 | 17.77 | 204.17 | 51.04 | 17.35 | 37.34 | 2.101 | 1.024 |
| SP-V-8 | 2.00 | 177.87 | 44.47 | 20.90 | 176.92 | 44.23 | 20.79 | 38.03 | 1.820 | 1.005 |
| Mean | 0.997 | |||||||||
| COV | 0.013 | |||||||||
Load-midspan displacement curves
The load-midspan vertical displacement curves of the average readings from the two mid-span sensors in each group of the test specimens in Fig. 9 show that the overall trends of the curves for each specimen are roughly the same, divisible into three stages: elastic stage, elastoplastic stage, and descending stage. At the same shear span ratio, the ascending segments of the curves for specimens with a larger web height-to-thickness ratio were positioned above those of specimens with a smaller web height-to-thickness ratio, indicating that as the web area increased, leading to higher moment of inertia and resistance to deflection, which suggests that the material contribution from the increased web area dominates over the potential buckling effects. When the cross-sectional forms of the members are the same, the curves of specimens with a smaller shear span ratio (a/h = 1.5) were positioned higher than those of specimens with a larger shear span ratio (a/h = 2).
Fig. 9.

Load-midspan Vertical Displacement Curves for Specimens. (a) Comparison of curves for different cross-sections at a/h = 1.5. (b) Comparison of curves for different cross-sections at a/h = 2.
The load-midspan lateral displacement curve of the test specimens SP-V-n-2 in Fig. 10 indicates that the lateral displacement of the specimen increases inward or outward as a result of web buckling deformation. In the initial stage of test loading, the displacement develops slowly while the load increases rapidly. When entering the plastic stage (post-buckling strength stage), the displacement increases at an accelerated rate. When the load reaches its maximum, the displacement keeps rising while the bearing capacity drastically decreases. The tensile field effect increases the bearing capacity of C-shaped folded flange flexural members.
Fig. 10.

Load-midspan Lateral Displacement Curves for Specimens. (a) SP-V-1-2. (b) SP-V-2-2. (c) SP-V-3-2. (d) SP-V-4-2. (e) SP-V-5-2. (f) SP-V-6-2. (g) SP-V-7-2. (h) SP-V-8-2.
Load-strain curve
It was examined how different web stiffener positions affected the specimens’ buckling deformation. Three specimens, SP-V-2, SP-V-4, and SP-V-8, were chosen in consideration of the relatively large initial defects in long specimens. As seen in Fig. 11, plotting of load-strain curves for these specimens at sites with notable web and compressed flange deformation was done in conjunction with the failure modes depicted in Fig. 8. The deformation in the section above the web stiffener of SP-V-2 is relatively small. In comparison to SP-V-2, SP-V-4 exhibits a larger deformation in the compressed flange and a wider deformation range in the lower section of the web due to the web stiffener’s proximity to the compressed flange. The main cause is that when the web stiffener is placed near the flange, the distribution of interaction forces between the web and the flange changes. This results in a higher percentage of internal forces being borne by the compressed flange and, consequently, more load, which causes deformation that is greater than that of C-beams where the web stiffener is placed farther away from the compressed flange. In the longest specimen SP-V-8, the maximum deformation occurs in the compressed web section near the loading plate, with significant local buckling deformation observed in the adjacent flange at this location.
Fig. 11.

Load-strain Curves for Specimens. (a) Web of SP-V-2-1. (b) Web of SP-V-2-2. (c) Flange of SP-V-2. (d) Web of SP-V-4-1. (e) Web of SP-V-4-2. (f) Flange of SP-V-4. (g) Web of SP-V-8-1. (h) Web of SP-V-8-2. (i) Flange of SP-V-8.
Numerical study
Using ABAQUS/CAE (V6.14, https://www.3ds.com/products/simulia/abaqus/cae)36, a finite element model was established to simulate the mechanical behavior of a web-stiffened C-shaped folded flange section under combined bending and shear loads. Identical material properties and boundary conditions were set to ensure that the simulation results were as consistent as possible with the experimental data. Given that two opposing C-shaped sections were used in the experiment, only one of the C-shaped section beams was modeled in this study. The following is a detailed description of the model development process.
Model establishment
In the software, the geometric components were created using the Part module, as shown in Fig. 12. The web-stiffened C-shaped folded flange stainless steel beam was modeled using the S4R shell elements, with the thickness defined in the section manager of the Property module.
Fig. 12.

Geometric model and mesh division.
Material properties
As detailed in Chapter 2, mechanical property tests were conducted on stainless steel to obtain the various mechanical performance indicators and the engineering stress–strain curves. However, in the finite element model, the engineering stress σ and the engineering strain ε obtained from the tensile tests need to be converted into true stress σtrue and true plastic strain εtrue using the following equations:
 |
1 |
 |
2 |
Mesh type and size division
The selection of mesh type and the division of mesh size are crucial steps in finite element simulation analysis. To ensure the necessary computational accuracy and minimize the time required for calculations, this study adopted the S4R shell element for simulation9,46. Based on the results of mesh sensitivity analysis, a mesh size of 5 mm × 5 mm was selected for meshing, as shown in Fig. 8. Similar element types and mesh sizes have also been used in the numerical studies conducted by Chandramohan et al.8 and Wang and Young17 for modeling thin-walled open cross-section members.
Boundary conditions and loading method
The boundary conditions of the numerical model matched those of the experiments. Three reference points were established at the shear center locations at mid-span and support center of the specimens, with rigid body constraints created between the web plates and reference points. The width of the rigid body constraint matched that of the T-shaped plate. In the simulation, roller supports were formed by restricting horizontal movement in the ux and uy directions and rotations in the θy and θz directions at one end of the corresponding shear center positions at the supports at both ends of the model, while hinged supports were created by restricting horizontal movement in the ux, uy, and uz directions and rotations in the θy and θz directions at the other end. The positions of the shear centers corresponding to the loading points, as well as the connections between the angle steel and the C-shaped beam, were restricted from horizontal movement in the ux direction and rotation in the θz direction. Displacement loading was applied at the shear center to simulate the mid-span displacement curve and ultimate load during three-point bending, as shown in Fig. 13.
Fig. 13.

Loading and Boundary Conditions. (a) Steel angle constraints. (b) Load point and supports constraints.
Simulation analysis method
This study first performed a linear perturbation buckling analysis to obtain the low-order buckling modes for eigenvalue buckling analysis, followed by a nonlinear analysis using the static Riks method. Local geometric initial imperfections were introduced using the *IMPERFECTION option in the finite element software, defining the defect size as h/150. Similar initial geometric imperfections have been successfully applied in numerical studies by Keerthan et al.39 and Rouholamin et al.47.
Validation of finite element model
Numerical analysis models were established for eight web-stiffened C-shaped folded flange stainless steel beams. The failure modes, ultimate loads, and load-midspan vertical displacement curves obtained from finite element analysis were compared with the experimental results. As shown in Fig. 14, the simulated load-midspan vertical displacement curves for both identical C-shaped specimens combined were compared with the experimental curves for the web-stiffened C-shaped folded flange sections under combined bending and shear actions. Aside from some differences in the descending segments of individual curves, the overall simulation curves aligned well with the experimental curves. This discrepancy can be attributed to the gaps between the C-shaped beam and the T-shaped plate and web stiffeners.
Fig. 14.

Comparison of Load-Midspan Vertical Displacement Curves for C-Shaped Beams. (a) SP-V-1. (b) SP-V-2. (c) SP-V-3. (d) SP-V-4. (e) SP-V-5. (f) SP-V-6. (g) SP-V-7. (h) SP-V-8.
As shown in Fig. 15, the failure mode observed at the peak load during the experiment is essentially consistent with the failure mode simulated by the finite element method. Table 2 compares the simulated ultimate loads with the experimental ultimate loads, showing an average value of 0.997 and a standard deviation of 0.013. This indicates that the finite element method can accurately predict the ultimate bearing capacity of C-shaped beams.
Fig. 15.

Comparison of Experimental and Finite Element Failure Modes. (a) SP-V-1. (b) SP-V-2. (c) SP-V-3. (d) SP-V-4. (e) SP-V-5. (f) SP-V-6. (g) SP-V-7. (h) SP-V-8.
Existing design methods
Design rules based on direct strength method (DSM)
DSM eliminates the need for calculating complex effective sections and adopts a simplified design approach to predict the flexural and shear capacities of cold-formed thin-walled members. DSM has been officially adopted in AS/NZS 4600:201833.
Calculation of flexural capacity
In AS/NZS 4600:201833, the flexural capacity of a section predicted based on DSM is calculated using Eqs. (3 and 4).
 |
3 |
 |
4 |
 |
5 |
 |
6 |
 |
7 |
 |
8 |
 |
9 |
where, The elastic local buckling stress σcrl and distortional buckling stress σcrd are determined using the CUFSM (V5.01, http://www.ce.jhu.edu/bschafer/cufsm/)43. The incorporation of outer steel plates and steel angles in the test device serves to bolster the overall stiffness and constraint of the specimen, thereby elevating the elastic buckling stress. According to Reference48, the utilization of these components increases the ultimate load of the specimen by approximately 5% and 10% respectively. However, this effect has not been accounted for in the current calculation. This study intends to incorporate a corresponding correction coefficient into the future analytical formula for elastic buckling stress to make up for this deficiency.
Calculation of shear capacity
Research by Pham and Hancock21 indicates that bolting along the entire depth of the web at the loading points and supports to a force-transmitting plate provides a tension field action in the web under shear. AS/NZS 4600:201833 allows the prediction of the shear capacity of a section incorporating the tension field action effect using Eq. (10), with key parameters calculated by Eqs. (11–16).
 |
10 |
 |
11 |
 |
12 |
 |
13 |
 |
14 |
 |
15 |
 |
16 |
Keerthan and Mahendran40 proposed Eq. (17) for calculating the shear capacity of lipped channel beams expressed in DSM form.
 |
17 |
Calculation of bending and shear interaction capacity
According to AS/NZS 4600:201833, for beams without web stiffeners, Eq. (18) is adopted for calculation; whereas for transversely stiffened beams, Eq. (19) is used for calculating the bending and shear interaction.
 |
18 |
 |
19 |
Keerthan and Mahendran40 predicted that the combined bending and shear capacity of lipped channel beams can be calculated using Eqs. (20 and 21).
 |
20 |
 |
21 |
Design rules based on continuous strength method (CSM)
CSM, originally developed by Gardner and Nethercot34, is a deformation-based design approach that eliminates the need for section classification and iteration, resulting in higher accuracy in calculating section capacities.
Calculation of flexural capacity
Gardner et al.49 established the CSM for stainless steel beams with mono-symmetric and asymmetric cross-sections. The flexural capacity is calculated using Eq. (22), with key parameters provided by Eqs. (23–27).
 |
22 |
 |
23 |
The deformation capacity of the section is calculated using Eqs. (24 and 25):
 |
24 |
 |
25 |
 |
26 |
 |
27 |
The CSM design stress is calculated using Eq. (28):
 |
28 |
Calculation of shear capacity
The shear capacity of laterally stiffened beams is calculated in EN 1993-1-4+A1: 201529 based on the Rotational Stress Field (RSF) method, which utilizes the post-buckling strength of webs and considers the contribution of flanges to the shear capacity of the cross-section. Gardner and Saliba37 established the CSM shear design equation for laterally stiffened beams, as shown in Eqs. (29–31).
 |
29 |
 |
30 |
 |
31 |
The distance c1 in the equations represents the distance from the plastic hinge within the flange to the lateral stiffener support point, calculated as per Eq. (32) in EN 1993-1-4+A1: 201529. Aw = area of web = h × tw. The ultimate shear stress τcsm is calculated using Eq. (33).
 |
32 |
 |
33 |
 |
34 |
 |
35 |
where, hw is the web height, and hw = h; fyf and fyw are the yield strength of the flange and web respectively; χw is calculated as per Eq. (36) in EN 1993-1-4+A1: 201529; η equals 1.2; and γy, G, Gsh, γu are provided by Eqs. (37–40).
 |
36 |
 |
37 |
 |
38 |
 |
39 |
 |
40 |
Analysis of test results based on DSM and CSM calculations
Figure 16a,b demonstrate that when Vu is derived from DSM, regardless of whether Mu is determined based on the local buckling moment capacity Mul,DSM within the DSM framework (primarily considering failure due to local buckling of the compression flange of the C-shaped beam, reinforced with angle connections near supports and load points), or through CSM, the current design rule AS/NZS 4600:201833, which uses Eq. (18) for describing bending and shear interaction, is not suitable for predicting the bearing capacity of C-shaped folded flange beams with web stiffeners under combined action. Furthermore, the calculation results obtained from Eqs. (19–21) are not conservative.
Fig. 16.

Interaction of M /Mu and V /Vu (Vu calculated using DSM, Mu calculated using either DSM or CSM). (a) Vu calculated using Eq. (10); Mu calculated using Eq. (3). (b) Vu calculated using Eq. (10); Mu calculated using Eq. (22).
Figure 17a,b demonstrate that when Vu is calculated based on the method proposed by Keerthan and Mahendran40, the Eq. (18) can predict the bearing capacity under combined loading, irrespective of whether Mu is calculated using Mul,DSM or through CSM. Nevertheless, it is important to note that this predictive curve does not incorporate the influence of transverse stiffeners. Compared to Fig. 17a, the moment capacity predicted by CSM in Fig. 17b is more accurate. Furthermore, the calculation results obtained from Eqs. (19–21) remain non-conservative, as illustrated in Fig. 17a,b.
Fig. 17.

Interaction of M /Mu and V /Vu (Vu calculated using the modified DSM by Keerthan and Mahendran40, Mu calculated using either DSM or CSM). (a) Vu calculated using Eq. (17); Mu calculated using Eq. (3). (b) Vu calculated using Eq. (17); Mu calculated using Eq. (22).
Equations (18), (19), (20), and (21) all predict the combined capacity of a C-beam when Vu is derived from DSM, regardless of whether Mu is calculated using Mul,DSM or through CSM, as shown in Fig. 18a,b. However, the circular curve Eq. (18) provides an overly conservative prediction. When using the Eq. (19) from AS/NZS 4600:201833, which addresses the shear-bending interaction for laterally stiffened beams, to predict the bearing capacity of C-shaped beams under combined actions, the bending-shear interaction is evident, but the prediction tends to be conservative. In Fig. 18a, where Vu is calculated based on CSM and Mu is calculated using Mul,DSM, the bending-shear interaction predicted by Eqs. (20, 21) is not obvious in some test results. In Fig. 18b, where both Vu and Mu are calculated based on CSM, Eqs. (20) and (21) predict a more significant bending-shear interaction, with Eq. (21) aligning more closely with the predicted test results. This indicates that calculating shear and bending capacities based on CSM can predict enhanced load-carrying capacities. It is evident that CSM provides more accurate predictions for shear bearing capacity. Comparing Fig. 17a,b, it can be seen that although calculating Vu based on the improved DSM40 and Mu based on Mul,DSM or CSM can predict the bearing capacity under combined actions, it significantly underestimates the bearing capacity of the C-shaped folded flange beams with web stiffeners under combined actions. This is because the circular curve Eq. (18) in AS/NZS 4600:201833 is formulated for the bending and shear interaction of non-laterally stiffened beams.
Fig. 18.

Interaction of M /Mu and V /Vu (Vu calculated using CSM, Mu calculated using either DSM or CSM). (a) Vu calculated using Eq. (29); Mu calculated using Eq. (3). (b) Vu calculated using Eq. (29); Mu calculated using Eq. (22).
Figure 18b demonstrates that by utilizing the CSM design rules to calculate Vu and Mu, and considering post-buckling strength, Eq. (21)40 is better able to accurately reflect the combined bending and shear effect in web-stiffened C-shaped folded flange beams. However, this study has only tested eight sets of specimens for bending and shear interaction, hence further experimental data and numerical analysis results are required to confirm this conclusion.
Conclusions
This study has presented an experimental and numerical study on the bending and shear interaction under the web tension field of web-stiffened C-shaped folded flange beams. The results illustrated that the specimens underwent web shear buckling and local buckling failure of the compression flange near the mid-span loading plate, with the web exhibiting significant post-buckling strength. When the stiffening position was close to the compression flange, it enhanced the bearing capacity of the bending and shear member, and the improvement increased with the increase in shear span ratio.
Different methods were used to calculate Vu and Mu, and the experimental results were graphically compared with the calculations from existing design methods for bending and shear interaction. The results show that the Continuous Strength Method (CSM) predicts the moment and shear bearing capacity under the web tension field more accurately. It is recommended to use the formulas based on CSM—specifically Eq. (22)49 and Eq. (29)37—along with Eq. (21) proposed by Keerthan and Mahendran40 for designing web-stiffened C-shaped folded flange beams. However, this study only tested eight sets of specimens under bending and shear interaction. Therefore, to fully validate the reliability and universality of these findings, more experimental data and corresponding numerical results are required for robust support and verification. Future work will involve additional experiments and parameter analyses to investigate the effects of stiffening position, stiffness, and section parameters on the bending and shear load-bearing capacity of this novel beam design, aiming to establish design rules that can accurately predict the behavior of such structural members.
List of symbols
- L
Overall member length of the three-point bending specimen
- H
Overall height of the section
- h
Depth of the flat portion of the web
- t
Cross-sectional thickness
- bf
Overall flange width
- tw
Web thickness
- tf
Flange thickness
- yc
Distance from the neutral axis to the outer compressive fibre
- Put
Peak load of the test for both identical C-shaped specimens combined
- Puf
Peak load of the numerical simulation for both identical C-shaped specimens combined
- MTest
Moment capacity obtained from the test
- MFEA
Moment capacity obtained by the finite element analysis
- MP
Plastic moment of the unreduced C-shaped section about the neutral axis parallel to the flanges
- My
Yield moment of the unreduced C-shaped section about the neutral axis parallel to the flanges
- Mul,DSM
Local buckling capacity
- Mud,DSM
Distortional buckling capacity
- Mu,csm
CSM moment capacity
- Mcrl
Critical moment of elastic local buckling
- Mcrd
Critical moment of elastic distortional buckling
- M
Design bending moment
- Mu
Moment capacity
- MEd
Design bending moment by the flange
- Mf,csm,Rd
Moment capacity by the flange
- Wel
Elastic section modulus of the unreduced C-shaped section about the neutral axis parallel to the flanges
- Wpl
Plastic section modulus of the unreduced C-shaped section about the neutral axis parallel to the flanges
- VTest
Shear capacity obtained from the test
- VFEA
Shear capacity obtained by the finite element analysis
- Vu
Shear capacity
- Vy
Yield shear strength
- Vcr
Elastic shear buckling force of web
- V
Design shear force
- Vbw,csm,Rd
Shear capacity of the web
- Vbf,csm,Rd
Contribution of the flange to the shear capacity
- Vu,csm
CSM shear capacity
- E
Young’s modulus
- Esh
Strain hardening modulus
- ν
Poisson’s ratio
- G
Shear modulus
- Gsh
Shear strain hardening modulus
- σ
Engineering stress
- σtrue
True stress
- σ0.2
0.2% Proof strength
- σcrl
Elastic local buckling stress
- σcrd
Elastic distortional buckling stress
- σcsm
CSM limiting stress
- σcr
Elastic buckling stress
- σu
Ultimate tensile stress
- ε
Engineering strain
- εtrue
True plastic strain
- εy
Yield strain
- εcsm
CSM limiting strain
- εcsm,c
Design maximum attainable compressive strain
- εcsm,t
Design maximum attainable outer-fibre tensile strain
- εu
Ultimate tensile strain
- τcsm
CSM limiting shear stress
- τy
0.2% Proof strength in shear
- τcr
Elastic shear buckling stress of the web
- kv
Shear buckling coefficient
- kss
Shear buckling coefficient for plates with simple-simple boundary
- ksf
Shear buckling coefficient for plates with simple-fixed boundary
- λl
Local buckling slenderness ratio
- λd
Distortional buckling slenderness ratio
- λv
Non-dimensional slenderness ratio

CSM local buckling slenderness ratio

Shear buckling slenderness ratio of the web
- γM0
Partial safety factor for cross-section resistance
- γM1
Partial safety factor
- γcsm
CSM limiting shear strain of the section
- γy
Shear yield strain
- γu
Ultimate shear strain
- χw
Web shear buckling reduction factor
Author contributions
S.-E.H. and Z. T. contributed to the conception of the study; S.-E.H.; Y.M. Z.; H.X. L. and Z.H. Y. performed the experiment; S.-E.H. and Y.M. Z. contributed significantly to analysis and manuscript preparation; S.-E.H.; Z.Q. Z. and Y.M. Z. performed the data analyses and wrote the manuscript; S.-E.H. and Z. T. helped perform the analysis with constructive discussions.
Data availability
All data generated or analysed during this study are included in this published article.
Declarations
Competing interests
The authors declare no competing interests.
Footnotes
Publisher’s note
Springer Nature remains neutral with regard to jurisdictional claims in published maps and institutional affiliations.
References
- 1.Baddoo, N. R. Stainless steel in construction: A review of research, applications, challenges and opportunities. J. Constr. Steel Res.64, 1199–1206. 10.1016/j.jcsr.2008.07.011 (2008). [Google Scholar]
- 2.Gedge, G. Structural uses of stainless steel—Buildings and civil engineering. J. Constr. Steel Res.64, 1194–1198. 10.1016/j.jcsr.2008.05.006 (2008). [Google Scholar]
- 3.Rossi, B. Discussion on the use of stainless steel in constructions in view of sustainability. Thin-Walled Struct.83, 182–189. 10.1016/j.tws.2014.01.021 (2014). [Google Scholar]
- 4.Fan, S. et al. Stainless steel lipped C-section beams: Numerical modelling and development of design rules. J. Constr. Steel Res.152, 29–41. 10.1016/j.jcsr.2018.05.036 (2019). [Google Scholar]
- 5.Rouholamin, M., Gunalan, S., Poologanathan, K. & Karampour, H. Shear design rules for roll-formed aluminium lipped channel beams. Structures27, 1139–1164. 10.1016/j.istruc.2020.07.011 (2020). [Google Scholar]
- 6.Chen, M.-T., Young, B., Martins, A. D., Camotim, D. & Dinis, P. B. Experimental investigation on cold-formed steel lipped channel beams affected by local-distortional interaction under non-uniform bending. Thin-Walled Struct.161, 107494. 10.1016/j.tws.2021.107494 (2021). [Google Scholar]
- 7.Dissanayake, D. M. M. P. et al. Bending-shear interaction of cold-formed stainless steel lipped channel sections. Structures30, 1042–1055. 10.1016/j.istruc.2020.12.071 (2021). [Google Scholar]
- 8.Chandramohan, D. L., Roy, K., Fang, Z., Beulah Gnana Ananthi, G. & Lim, J. B. P. Numerical investigation of cold-formed steel channels with edge-stiffened and unstiffened elongated web holes under shear. Thin-Walled Struct.196, 111472. 10.1016/j.tws.2023.111472 (2024). [Google Scholar]
- 9.Dissanayake, D. M. M. P. et al. Numerical investigation of cold-formed stainless steel lipped channels with longitudinal stiffeners subjected to shear. Thin-Walled Struct.158, 107171. 10.1016/j.tws.2020.107179 (2021). [Google Scholar]
- 10.Tian, Y. S. & Lu, T. J. Minimum weight of cold-formed steel sections under compression. Thin-Walled Struct.42, 515–532. 10.1016/j.tws.2003.12.011 (2004). [Google Scholar]
- 11.Adeli, H. & Karim, A. Neural network model for optimization of cold-formed steel beams. J. Struct. Eng.123, 1535–1543. 10.1061/(asce)0733-9445(1997)123:11(1535) (1997). [Google Scholar]
- 12.Bagheri Sabbagh, A., Petkovski, M., Pilakoutas, K. & Mirghaderi, R. Development of cold-formed steel elements for earthquake resistant moment frame buildings. Thin-Walled Struct.53, 99–108. 10.1016/j.tws.2012.01.004 (2012). [Google Scholar]
- 13.Ye, J., Hajirasouliha, I., Becque, J. & Pilakoutas, K. Development of more efficient cold-formed steel channel sections in bending. Thin-Walled Struct.101, 1–13. 10.1016/j.tws.2015.12.021 (2016). [Google Scholar]
- 14.CEN. Eurocode 3: Design of Steel Structures, Part 1.3: General Rules—Supplementary rules for cold-formed steel members and sheeting. (2005).
- 15.Schafer, B. W. & Peköz, T. The behavior and design of longitudinally stiffened thin-walled compression elements. Thin-Walled Struct.27, 65–78. 10.1016/0263-8231(96)00016-x (1997). [Google Scholar]
- 16.Zhang, J.-H. & Young, B. Compression tests of cold-formed steel I-shaped open sections with edge and web stiffeners. Thin-Walled Struct.52, 1–11. 10.1016/j.tws.2011.11.006 (2012). [Google Scholar]
- 17.Wang, L. & Young, B. Design of cold-formed steel channels with stiffened webs subjected to bending. Thin-Walled Struct.85, 81–92. 10.1016/j.tws.2014.08.002 (2014). [Google Scholar]
- 18.Pham, C. H. & Hancock, G. J. Numerical investigation of longitudinally stiffened web channels predominantly in shear. Thin-Walled Struct.86, 47–55. 10.1016/j.tws.2014.09.005 (2015). [Google Scholar]
- 19.Nguyen, V. B., Pham, C. H., Cartwright, B. & English, M. A. Design of new cold rolled purlins by experimental testing and Direct Strength Method. Thin-Walled Struct.118, 105–112. 10.1016/j.tws.2017.05.011 (2017). [Google Scholar]
- 20.Kwon, Y. B., Kim, B. S. & Hancock, G. J. Compression tests of high strength cold-formed steel channels with buckling interaction. J. Construct. Steel Res.65, 278–289. 10.1016/j.jcsr.2008.07.005 (2009). [Google Scholar]
- 21.Pham, C. H. & Hancock, G. J. Tension field action for cold-formed sections in shear. J. Construct. Steel Res.72, 168–178. 10.1016/j.jcsr.2011.12.001 (2012). [Google Scholar]
- 22.Li, H.-T., Jin, C.-C., Li, Q.-Y. & Young, B. Experimental investigation of cold-formed stainless steel built-up closed section stub columns. Eng. Struct.306, 117657. 10.1016/j.engstruct.2024.117657 (2024). [Google Scholar]
- 23.Beulah Gnana Ananthi, G., Roy, K., Ahmed, A. M. M. & Lim, J. B. P. Non-linear behaviour and design of web stiffened battened built-up stainless steel channel sections under axial compression. Structures30, 477–494. 10.1016/j.istruc.2021.01.014 (2021). [Google Scholar]
- 24.Roy, K., Ho Lau, H., Ahmed, A. M. M. & Lim, J. B. P. Nonlinear behavior of cold-formed stainless steel built-up box sections under axial compression. Structures30, 390–408. 10.1016/j.istruc.2020.12.058 (2021). [Google Scholar]
- 25.Ananthi, G. B. G., Roy, K. & Lim, J. B. P. Tests and finite element modelling of cold-formed steel zed and hat section columns under axial compression. Int. J. Steel Struct.21, 1305–1331. 10.1007/s13296-021-00504-y (2021). [Google Scholar]
- 26.Chen, X. & Yuan, H. Local buckling behaviour of longitudinally stiffened stainless steel plate girders under combined bending and shear. Thin-Walled Struct.184, 110541. 10.1016/j.tws.2023.110541 (2023). [Google Scholar]
- 27.Yuan, H., He, K., Gao, L., Wang, A. & Du, X. Shear behaviour and design of bolted steel girders with trapezoidal corrugated webs. J. Construct. Steel Res.216, 108570. 10.1016/j.jcsr.2024.108573 (2024). [Google Scholar]
- 28.ANSI/AISC370-2021. Specification for structural stainless steel buildings (2021).
- 29.EN1993-1-4+A1. Eurocode 3: Design of steel structures–Part 1.4: General Rules– Supplementary Rules for Stainless Steel (2015).
- 30.CECS410:2015. Technical specification for stainless steel structures (2015).
- 31.Schafer, B.W. & Peköz, T. Direct strength prediction of cold-formed steel members using numerical elastic buckling solutions. In Proceedings of the Fourteenth International Specialty Conference on Cold-Formed Steel Structures: Recent Research and Developments in Cold-Formed Steel Design and Construction, (St. Louis, MO, United States, 1998).
- 32.AISIS100-16. North American specification for the design of cold-formed steel structural members. AISI S100-16 (2016).
- 33.AS/NZS4600:2018. Cold-formed steel structures (2018).
- 34.Gardner, L. & Nethercot, D. A. Structural stainless steel design: A new approach. Struct. Eng.82, 21–28 (2004). [Google Scholar]
- 35.Zhao, O. & Gardner, L. The continuous strength method for the design of mono-symmetric and asymmetric stainless steel cross-sections in bending. J. Construct. Steel Res.150, 141–152. 10.1016/j.jcsr.2018.08.001 (2018). [Google Scholar]
- 36.Systèmes, D. ABAQUS analysis user’s manual version 6.14, (Dassault Systèmes: Waltham, MA, 2014).
- 37.Saliba, N. G. & Gardner, L. Deformation-based design of stainless steel cross-sections in shear. Thin-Walled Struct.123, 324–332. 10.1016/j.tws.2017.11.035 (2018). [Google Scholar]
- 38.Keerthan, P., Hughes, D. & Mahendran, M. Experimental studies of hollow flange channel beams subject to combined bending and shear actions. Thin-Walled Struct.77, 129–140. 10.1016/j.tws.2013.12.003 (2014). [Google Scholar]
- 39.Keerthan, P., Mahendran, M. & Hughes, D. Numerical studies and design of hollow flange channel beams subject to combined bending and shear actions. Eng. Struct.75, 197–212. 10.1016/j.engstruct.2014.05.022 (2014). [Google Scholar]
- 40.Keerthan, P. & Mahendran, M. Experimental investigation and design of lipped channel beams in shear. Thin-Walled Struct.86, 174–184. 10.1016/j.tws.2014.08.024 (2015). [Google Scholar]
- 41.Šorf, M. & Jandera, M. Lateral-torsional buckling of slender cross-section stainless steel beams. Structures28, 1466–1478. 10.1016/j.istruc.2020.09.073 (2020). [Google Scholar]
- 42.GB50205-2001. Code for acceptance of construction quality of steel structures, (2002).
- 43.Seif, M. & Schafer, B. W. Local buckling of structural steel shapes. J. Construct. Steel Res.66, 1232–1247. 10.1016/j.jcsr.2010.03.015 (2010). [Google Scholar]
- 44.GB50017-2017. Standard for Design of Steel Structures (2018).
- 45.Pham, C. H. & Hancock, G. J. Numerical simulation of high strength cold-formed purlins in combined bending and shear. J. Construct. Steel Res.66, 1205–1217. 10.1016/j.jcsr.2010.04.014 (2010). [Google Scholar]
- 46.Fan, S., Wu, Y., Du, L., Liu, M. & Wu, Q. Experimental study and numerical simulation analysis of distortional buckling capacity of stainless steel lipped C-section beams. Eng. Struct.250, 113428. 10.1016/j.engstruct.2021.113428 (2022). [Google Scholar]
- 47.Rouholamin, M., Gunalan, S., Poologanathan, K. & Karampour, H. Shear strength reduction of aluminium lipped channel beams due to web openings. Thin-Walled Struct.164, 107697. 10.1016/j.tws.2021.107697 (2021). [Google Scholar]
- 48.Rouholamin, M., Gunalan, S., Poologanathan, K. & Karampour, H. Experimental study of roll-formed aluminium lipped channel beams in shear. Thin-Walled Struct.153, 106687. 10.1016/j.tws.2020.106687 (2020). [Google Scholar]
- 49.Gardner, L., Yun, X. & Walport, F. The continuous strength method—Review and outlook. Eng. Struct.275, 114924. 10.1016/j.engstruct.2022.114924 (2023). [Google Scholar]
Associated Data
This section collects any data citations, data availability statements, or supplementary materials included in this article.
Data Availability Statement
All data generated or analysed during this study are included in this published article.