

Abstract
Hemodialysis employing molecular hydrogen (H2)-enriched dialysis solution rendered by water electrolysis (E-HD), has been reported to alleviate dialysis-related fatigue, but its association with metabolic profiles remains unclear. Eighty-one patients undergoing standard HD were classified into 3 groups [Group A (n = 25, 30.9%): fatigue with activity reduction—subgroups A1: chronic persistent fatigue (n = 11), A2: fatigue only on dialysis days (n = 14); Group B: fatigue without activity reduction (n = 24, 29.6%); Group C (n = 32, 39.5%): no fatigue], and their changes in fatigue, body composition, and metabolic profiles were studied following 12 months of E-HD. There were no significant differences in baseline characteristics among the groups. Over the 12 months after E-HD initiation, fatigue in Group A significantly decreased, while no changes in Group-B and C. Bio-impedance analysis revealed no significant changes in A1, but significant reductions in body fat and increases in skeletal muscle mass were observed despite no significant weight change in A2. Enrichment analysis suggested significant differences in metabolic pathways such as fatty acid metabolism, citric acid cycle, and glycolysis between Groups A and C at baseline, and these differences were mitigated by E-HD. E-HD could suppress dialysis-related fatigue, through possible involvement of altered energy metabolism of patients. E-HD may represent a new paradigm for uremia treatment beyond traditional solute removal-based dialysis therapies.
Keywords: Molecular hydrogen, Water electrolysis, Hemodialysis, Fatigue, Metabolomics, Glycolysis, Fatty acid, Citric acid cycle, Glutathione
Subject terms: Computational biology and bioinformatics, Medical research, Nephrology, Pathogenesis, Signs and symptoms, Energy science and technology
Introduction
Fatigue is recognized as a crucial patient-reported outcome in dialysis patients1–3. Fatigue not only impacts daily activities, but it is also considered a risk factor for malnutrition and frailty due to decreased appetite and physical activity4. Furthermore, fatigue has been identified as an independent predictor of patient prognosis5–8, suggesting the formation of a detrimental cycle driven by fatigue symptoms. Therefore, understanding the pathophysiology of dialysis-related fatigue and developing effective treatment strategies are critically important medical challenges.
Clinically, presentation of fatigue may develop by commencement of hemodialysis (HD) and subjective symptoms are mostly limited on HD day, or may be present persistently irrespective of HD8. However, it remains unclear whether they are different entities or not. There are many uncertainties regarding the pathophysiology of dialysis fatigue. Factors such as uremia, nutrition, anemia, and commodities9, as well as HD system-related issues like biocompatibility-related oxidative stress10,11, including iron administration12, may contribute to its development. Biocompatibility in hemodialysis systems remains an unresolved issue. Contact between blood and dialysis equipment can stimulate white blood cells, platelets, and complement activation, leading to inflammatory cytokine release, platelet aggregation, neutrophil degranulation, e.g., myeloperoxidase release, and neutrophil extracellular traps13–15. Currently, there is no treatment system that completely suppresses these reactions.
Molecular hydrogen (H2) has biological effects such as scavenging reactive oxygen species in mitochondria and activating a wide-ranging anti-inflammatory and antioxidant system through master redox regulator, NF-E2-related factor 2(Nrf2)16–23. Focusing on the antioxidant and anti-inflammatory properties of H2, we developed electrolyzed water hemodialysis (E-HD), which adds H2 to dialysis fluid to improve biocompatibility24–26. E-HD has been shown to reduce oxidative stress during HD treatment27 and correct the basal redox state of patients by continuous treatment28. Furthermore, our study groups have been independently reported that fatigue of patients on E-HD is alleviated29–32. These observations suggest that the impact of biocompatibility on the development of dialysis-related fatigue may be considerable. However, the mechanisms by which improvement in biocompatibility through H2 leads to clinical suppression of fatigue are still poorly understood.
Therefore, this study aimed to conduct long-term assessments of fatigue during E-HD and investigate changes in fatigue and their mechanisms from the perspectives of metabolism in the body.
Results
Assessments of fatigue and patients grouping by fatigue grade (Fig. 1)
Fig. 1.
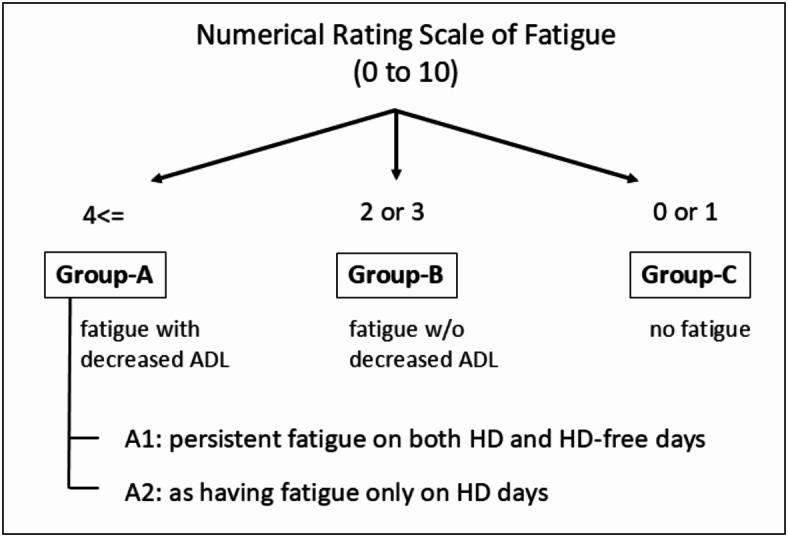
Grouping of patients at M0 on standard hemodialysis. ADL: Activities of Daily Living; M0: During the period of standard HD, and within 2 weeks before commencement of E-HD; E-HD: electrolyzed water hemodialysis.
The cut off value of Numerical Rating Scale (NRS) score ≥ 4 for the presence of substantial fatigue was determined by analysis of the receiver operating characteristic (ROC) curve, in which original fatigue scale Grade 3 or 4 on HD day was defined as presenting with fatigue accompanying decreased activities of daily life (ADL) in the study (NRS = 3.75: sensitivity 0.909, specificity 0.764; NRS = 4.5: sensitivity 0.909, specificity 0.833). In the same way, NRS = 0 or 1, was defined as presenting no fatigue in the study (NRS = 1.5: sensitivity 0.936, specificity 0.806; NRS = 2.25: sensitivity 0.851, specificity 0.861 for Grade 1). According to the result, patients were classified into 3 groups: Group A (presenting fatigue with decreased ADL defined by NRS 4 or more: n = 25, 30.9%), Group B (presenting fatigue without decreased ADL defined by NRS = 2 or 3: n = 24, 29.6%), and Group C (no fatigue defined by NRS = 0 or 1: n = 32, 39.5%). Furthermore, Group A was sub-classified into two types: Group A1; chronic persistent fatigue (NRS 4 or more) on both HD and HD-free days (n = 11), Group A2 as having fatigue only on HD days (n = 14).
Patient demographics by fatigue grade at baseline and changes of fatigue levels during 12 months observation
Informed consent regarding the present study was obtained from 92 cases among 96 patients, and they were followed thereafter for 12 months. During the period, 6 patients were transferred to other clinics due to the reasons of patients’ convenience, 2 patients died due to severe pneumonia (COVID-19 in one case, and community-acquired in one) and 3 patients were dropped-out due to poor response to questionnaires during the study (one case due to long-term hospital admission, two cases due to lack of cooperation to the survey). As a result, 81 cases completed the 12-months survey. The data were analyzed in the 81 patients (60 males; 74.1%, mean age of 71.4 years old, and mean HD vintage of 10.6 years.
The patient characteristics of respective groups are shown in Table 1. There were significant differences in NRS on HD day, NRS on HD-free day, age among the 3 groups, otherwise no significant differences were found.
Table 1.
Patients characteristics by fatigue grade at baseline (Month 0).
| Group | A | B | C | P-value |
|---|---|---|---|---|
| N(%) | 25 (30.9%) | 24(29.6%) | 32(39.5%) | |
| NRS on HD | 5.56±1.32 | 2.75±0.44 | 0.43±0.50 | 0.000 |
| NRS off HD | 3.36±2.19 | 1.79±1.25 | 0.25±0.43 | 0.000 |
| Age (years old) | 73±12 | 63±11 | 66±11 | 0.019 |
| Male (%) | 15 (60.0%) | 17 (70.8%) | 28 (87.5%) | 0.057 |
| HD vintage (days) | 3430±1811 | 4032±2974 | 4232±2554 | 0.529 |
| Presence of DM (%) | 10 (40.0%) | 8 (33.3%) | 12 (37.5%) | 0.887 |
| Past history of CVD (%) | 10 (40.0%) | 5 (20.8%) | 10 (31.2%) | 0.347 |
| BMI | 22.0±3.3 | 21.9±2.9 | 23.2±4.5 | 0.406 |
| DW (kg) | 59.2±13.4 | 60.0±13.8 | 65.0±17.0 | 0.290 |
| Fat volume (kg) | 16.1±8.2 | 12.0±5.9 | 15.2±10.0 | 0.239 |
| Muscle volume (kg) | 19.1±5.0 | 19.9±7.5 | 22.5±6.5 | 0.155 |
| ECV/TBW (%) | 47.5±4.3 | 46.6±4.7 | 44.7±3.1 | 0.053 |
| Pre HD MBP (mmHg) | 102±15 | 105±14 | 102±13 | 0.720 |
| Post HD MBP (mmHg) | 99±14 | 98±12 | 100±12 | 0.807 |
| MMSE | 27±3 | 26±2 | 27±3 | 0.258 |
| Hemoglobin (g/dL) | 11.1±1.3 | 10.7±1.2 | 11.0±1.0 | 0.554 |
| Albumin (g/dL) | 3.5±0.4 | 3.8±0.3 | 3.7±0.3 | 0.118 |
| CRP (mg/dL) | 0.19±0.20 | 0.23±0.49 | 0.20±0.26 | 0.943 |
| ANP (pg/mL) | 77.3±52.6 | 62.3±36.3 | 55.1±37.4 | 0.149 |
| cfDNA (unit) | 3.62±0.75 | 3.41±0.85 | 3.58±0.81 | 0.628 |
| MPO-DNA (unit) | 2.80±2.02 | 2.76±1.72 | 2.51±1.10 | 0.760 |
Group-A; NRS 4 or more at baseline (Month 0), Group-B; NRS 2 or 3 at baseline (Month 0), Group-C: NRS 0 or 1 at baseline (Month 0).
NRS: Numerical Rating Scale (0 to 10); HD: hemodialysis; DM: Diabetes Mellitus; CVD: cardiovascular disease; angina pectoris, and myocardial infarction; BMI: Body mass index; DW: dry weight; ECF: Extracellular fluid; TBW: Total body water; MBP: Mean blood pressure; MMSE: mini-mental scale examination; CRP: C-reactive protein; ANP: human atrial natric peptide; cfDNA: cell-free DNA; MPO-DNA: myeloperoxidase and DNA complex (data is expressed as mean +/- standard deviation).
The neutrophil NETosis phenomenon, as a marker of biocompatibility, was investigated through cell-free DNA (cfDNA) and myeloperoxidase and DNA complex (MPO-DNA) levels, but no significant differences were found at baseline (Table 1) or during follow-up at 6 months, and 12 months in respective groups; cfDNA (unit): 3.70 ± 0.75 (6 months) and 3.83 ± 0.91 (12 months) in Group A, 3.46 ± 0.90 and 3.57 ± 0.95 in Group B, 3.67 ± 0.99 and 3.72 ± 1.11 in Group C; MPO-DNA (unit): 2.86 ± 1.89 (6 months) and 2.82 ± 1.74 (12 months) in Group A, 2.59 ± 1.23 and 3.01 ± 1.49 in Group B, 2.44 ± 1.10 and 2.64 ± 1.31 in Group C, respectively.
Table 2 shows patient characteristics of sub-group of Group-A. There was a significant difference in skeletal muscle mass between A1 and A2 at baseline (M0), and there were significant differences in fat mass, skeletal muscle mass, and ECV/TBW% between M0 and M12 in A2.
Table 2.
Patient characteristics of sub-group of Group-A: baseline (Month 0) and end of observation (Month 12).
| Sub-group (n) | A1 (n=11) | A2 (n=14) | A1 vs. A2 (M0) |
||||
|---|---|---|---|---|---|---|---|
| Period | Month 0 | Month 12 | P-value | M0 | M12 | P-value | P-value |
| NRS on HD day | 6.36±1.12 | 4.54±2.54 | 0.024 | 4.92±1.14 | 2.78±2.19 | 0.002 | 0.004 |
| NRS on HD-free day | 5.45±1.19 | 2.81±2.78 | 0.040 | 1.71±0.99 | 1.21±2.04 | 0.265 | 0.000 |
| Age (yo) | 75±11 | 72±13 | 0.522 | ||||
| Male (%) | 4 (36.4%) | 11 (78.6%) | 0.057 | ||||
| HD vintage (days) | 4067±2316 | 2951±1218 | 0.168 | ||||
| Presence of DM (%) | 4 (36.4%) | 6 (42.9%) | 0.887 | ||||
| Past history of CVD (%) | 5 (45.5%) | 5 (35.7%) | 0.347 | ||||
| BMI | 22.1±4.3 | 21.9±2.4 | 0.904 | ||||
| DW (kg) | 54.7±15.7 | 55.2±15.0 | 0.470 | 62.8±10.0 | 61.3±11.0 | 0.072 | 0.137 |
| Fat mass (kg) | 16.3±10.8 | 17.9±8.1 | 0.284 | 17.6±6.4 | 13.8±5.5 | 0.048 | 0.925 |
| Skeletal muscle mass (kg) | 16.4±5.1 | 15.6±5.5 | 0.238 | 21.2±4.0 | 22.9±4.3 | 0.029 | 0.027 |
| ECV/TBW (%) | 49.1±4.4 | 50.3±4.7 | 0.110 | 49.3±4.0 | 47.2±3.3 | 0.017 | 0.144 |
| Pre HD MBP (mmHg) | 104±19 | 100±7 | 0.649 | 100±11 | 101±17 | 0.865 | 0.524 |
| Post HD MBP (mmHg) | 96±14 | 98±14 | 0.817 | 101±14 | 99±14 | 0.571 | 0.422 |
| MMSE (arbitrary) | 27±4 | 27±4 | 0.680 | 27±3 | 27±4 | 0.523 | 0.725 |
A1; chronic persistent fatigue (NRS 4 or more) on both HD and HD-free days at baseline (Month 0), A2; as having fatigue (NRS 4 or more) only on HD days at baseline (Month 0).
NRS: Numerical Rating Scale (0 to 10); HD: hemodialysis; CVD: cardiovascular disease; BMI: Body mass index; DW: Dry weight; ECF: Extracellular fluid; TBW: Total body water; MBP: Mean blood pressure; MMSE: mini-mental scale examination; (Data is expressed as mean +/- standard deviation)
The changes of NRS of HD day, and HD-free day during the 12 months periods are shown in Fig. 2a and b, respectively. A significant decrease was observed in NRS in HD day of Group-A, although no statistical changes were not observed in HD-free days. No significant changes were found in HD and HD-free days in Group-B and C.
Fig. 2.

(a) Changes of Numerical Rating Scale (average) of fatigue at respective points during 12 months on HD day (a) and HD-free day (b). M0: During the period of standard HD, and within 2 weeks before commencement of E-HD. M1, M3, M6, M12: 1st month (M1), 3rd months (M3), 6th months (M6), and 12th months (M12) after commencement of E-HD. E-HD: electrolyzed water hemodialysis. A: Group A; presenting fatigue with decreased activities of daily life (ADL) defined by Numerical Rating Scale (NRS) 4 or more: n = 25. B: Group B; presenting fatigue without decreased ADL defined by NRS 2 or 3: n = 24. C: Group-C; no fatigue defined by NRS 0 or 1: n = 32. Group-A on HD day (a); 5.56 ± 1.33 (M0), 4.48 ± 1.96 (M1), 4.92 ± 1.87 (M3), 4.72 ± 1.67 (M6), 3.56 ± 2.47 (M12) (average +/- standard deviation). A significant change was observed on HD day (* p < 0.05; M0 vs. M12, by repeated-measure-ANOVA). Group-A on HD-free day (b); 3.36 ± 2.20 (M0), 1.80 ± 1.78 (M1), 2.28 ± 2.01 (M3), 2.40 ± 1.98 (M6), 1.92 ± 2.48 (M12) (average +/- standard deviation). No statistical change was observed on HD-free day. (Bars of Group A denote 95% confidence intervals). (b) Changes of Numerical Rating Scale (average) of fatigue at respective points during 12 months on HD day (a) and HD-free day (b) in Group A1 and A2. A1: chronic persistent fatigue (NRS 4 or more) on both HD and HD-free days at baseline (Month 0): n = 11. A2: as having fatigue (NRS 4 or more) only on HD days at baseline (Month 0): n = 14 (Bars of Group A1 and 2 denote 95% confidence intervals). In Group A1, no statistical change was observed on HD day, while there was a significant change in HD-free day (* p = 0.017; M0 vs. M1, by repeated-measure-ANOVA). In Group A2, there was a significant change in HD day (* p = 0.018; M0 vs. M12, by repeated-measure-ANOVA), no statistical change was observed on HD-free day. There were significant differences between A1 and A2 at baseline (M0) on HD and HD-free days (# p = 0.004, ## p < 0.001), respectively. A significant difference was observed at M3 on HD-free day between the two groups (### p = 0.001). Besides them, no statistical differences were observed between the groups.
Regarding Group-A1 and A2, there were significant decreases in NRS on HD and HD-free days at M12 in both A1 and A2 groups, as compared to basal line at M0. No differences were found in basal parameters except for the significant lower skeletal muscle mass in Group-A1. At M12, a significant decrease of fat mass and a significant increase in skeletal muscle mass were found in Group-A2 as compared to M0, otherwise no significant changes were found in other parameters.
There were discrepancies of the statistical results of NRS in Group-A, (i.e., no statistical differences in NRS in Group A on HD-free days from M0 to M12 by repeated-measure ANOVA, while significant decreases between M0 and M12 in sub-groups A1 and A2 by paired-t test). Regarding the reasons, we think that the small size of the groups, and the non-normal distribution data of M12 in Group A2 (presence of outlier(s)), may attribute to the puzzling results. Sub-group analysis of Group A (A1 and A2) presented the same trends as shown in The Fig. 2b.
Patient-sets for metabolome analysis and measurement of uremic toxin (Fig. 3)
Fig. 3.

Schematic diagram of 3 patient-sets. NRS: Numerical Rating Scale of Fatigue; M0: During the period of standard HD, and within 2 weeks before commencement of E-HD; M12: 12 months after commencement of E-HD; S-HD: standard hemodialysis; E-HD: electrolyzed water hemodialysis. Patient-sets: (a) Fatigue-S (FS); At the period of M0, available samples of fatigued patients (n = 23) were obtained from Group-A, while samples of non-fatigued patients (n = 12) were randomly selected from Group-C. Samples at M0 were compared between the fatigued and non-fatigued patients. (b) Fatigue-E (FE); At the period of M12, fatigue had completely disappeared (NRS = 0 or 1) in 5 patients of the fatigued group at M0. Patients were re-classified according to the NRS of M12, i.e., fatigued- (n = 18), and non-fatigued patients (n = 17). Samples at M12 were compared between the fatigued and non-fatigued patients. (c) S-HD at M0 vs. E-HD at M12 (EHD), n = 35, respectively. Samples of all patients at M0 and M12 were compared.
Metabolome analysis and measurements of uremic toxins were conducted in 35 patients extracted from Group-A and C, to compare between the fatigued and non-fatigued patients, and between M0 at standard HD (S-HD) and M12 at E-HD. As to patient-sets, the fatigued and non-fatigued group at S-HD (M0) was defined as “Fatigue-S (FS)”, and at E-HD (M12) as “Fatigue-E (FE)”, and comparisons of all patients between at S-HD (M0) and E-HD (M12) as “EHD”. The details of number of patients of respective sets are shown in Fig. 3.
Comprehensive metabolomic analysis and possible impact of E-HD on dialysis-fatigue
Among 170 individual metabolites detected by non-targeted metabolomic analysis, overview of Enriched metabolite sets (Top 25) is shown in Fig. 4a (Patient-set: FS), Fig. 5a (Patient-set: EHD), and Fig. 6a (Patient-set: FE), respectively. Notable changes were found in several metabolites in between the groups. Details of the significant changes of each metabolite among 3 patient-sets are shown in Figs. 4b and 5b, and 6b, respectively.
Fig. 4.

(a) Overview of Top 25 metabolite sets (metabolic pathways) by KEGG Enrichment analysis: Comparison between the fatigued and non-fatigued patients during period of standard hemodialysis at M0 (patient-set: FS). TCA: Tricarboxylic Acid Cycle. Enrichment ratio: The enrichment ratio refers to the ratio of the frequency of metabolites within a specific metabolic pathway (metabolite set) to their frequency in the entire dataset. (b) Different plasma metabolites between the fatigued and non-fatigued patients during period of standard hemodialysis at M0 (patient-set: FS). *p < 0.05, **p < 0.001, ***p < 0.0001, F: Fatigued group, NF: Non-fatigued group, F6P: Fructose-6-phosphate (data expressed as mean +/- standard error).
Fig. 5.

(a) Overview of Top 25 metabolite sets (metabolic pathways) by KEGG Enrichment analysis: Comparison between the standard hemodialysis at M0 and the E-HD at M12 (patient-set: EHD). (b) Different plasma metabolites between the standard hemodialysis at M0 and the E-HD at M12 (patient-set: EHD). *p < 0.05, **p < 0.001, ***p < 0.0001. F6P: Fructose-6-phosphate, SHD: standard hemodialysis, EHD: electrolyzed water hemodialysis (data expressed as mean +/- standard error).
Fig. 6.

(a) Overview of Top 25 metabolite sets (metabolic pathways) by KEGG Enrichment analysis: Comparison between the fatigued and non-fatigued patients during period of E-HD at M12 (patient-set: FE). E-HD: electrolyzed water hemodialysis. (b) Different plasma metabolites between the fatigued and non-fatigued patients during period of E-HD at M12 (patient-set: FE). *p < 0.05. F: Fatigued group, NF: Non-fatigued group (data expressed as mean +/- standard error).
Figure 7 shows the summary of mutual relationship among Enriched metabolite sets of respective patient-sets. There were 16 metabolite sets common to both FS and EHD, and 12 metabolite sets common to both FS and FE. Among the common metabolite sets between FS and EHD, eight metabolite sets were found to be common with metabolites which did not overlap with FE (Pathway A), and 8 sets which are common with FS and FE (Pathway B), respectively. A schematic diagram of the crucial candidates of metabolic pathways altered by E-HD is shown in Fig. 8.
Fig. 7.

Summary of relationships among Enriched metabolite sets (metabolic pathways) (Top 25) of respective patients-sets and inferred pathophysiology of fatigue mechanism. FS: Comparison between fatigue and non-fatigue groups at baseline (M0) with the standard dialysis. EHD: Comparison between S-HD and E-HD (M0 vs. M12). FE: Comparison between fatigue and non-fatigue groups at months 12 (M12) with the electrolyzed water dialysis. S-HD: standard hemodialysis, E-HD: electrolyzed water hemodialysis. There were 16 metabolite sets (metabolic pathways) common to both FS and EHD (i), and 12 metabolite sets common to both FS and FE (iii). Among (i), eight metabolite sets were found to be common with (ii) (Pathway A), and 8 sets with (iii) (Pathway B), respectively. Pathway A may be fatigue-related factors corrected by E-HD, while Pathway B may be fatigue-related factors affected by E-HD, but not corrected enough to reduce fatigue. Among (iii), the 4 metabolite sets which did not overlap (i), may be common phenomenon to fatigue pathologies unaffected by E-HD (Pathway C). Finally, the 13 sets (iv) may represent fatigue factors not affected by E-HD (Pathway D).
Fig. 8.

Working-hypothesis: Schematic diagram of the metabolic pathways altered by a shift from S-HD to E-HD. Relatively enhanced metabolic pathways, i.e., glycolysis, and fatty acid metabolism in S-HD, are suppressed in E-HD, while relatively suppressed citric acid cycle in S-HD, is ameliorated in E-HD (a). Glutathion synsethis is facilitated in E-HD as compared to S-HD (b). S-HD: standard hemodialysis, E-HD: electrolyzed water hemodialysis.
Uremic toxin concentrations (Tables 3, 4)
Table 3.
Comparison of uremic toxin levels between fatigued and non-fatigued groups (Patient-set: Fatigue-S) at baseline (Month 0).
| Fatigued (M0) 4<=NRS |
Non-fatigued (M0) NRS<=1 |
P-value | |
|---|---|---|---|
| Hippuric_acid (µg/mL) | 37.2±23.1 | 24.2±25.5 | 0.153 |
| p-crecyl sulfate (µg/mL) | 43.4±24.8 | 38.6±23.6 | 0.242 |
| Indoxyl sulfate (µg/mL) | 41.5±27.2 | 41.8±21.6 | 0.974 |
| Methylglyoxal(µM) | 0.81±0.57 | 0.81±0.65 | 0.996 |
| Glyoxal (µM) | 0.79±0.24 | 0.82±0.23 | 0.788 |
| 3-Deoxyglucosone (µM) | 0.76±0.22 | 0.69±0.22 | 0.383 |
M0: Month 0 (baseline) (data is expressed as mean +/- standard deviation).
Table 4.
Comparison of uremic toxin levels between baseline (Month 0) and 12 months after commencement of E-HD (Month 12) (Patient-set: EHD).
| Month 0 | Month 12 | P-value | |
|---|---|---|---|
| Hippuric_acid (µg/mL) | 32.9±24.4 | 32.1±23.6 | 0.844 |
| p-crecyl sulfate (µg/mL) | 45.1±24.1 | 38.6±23.6 | 0.173 |
| Indoxyl sulfate (µg/mL) | 41.0±24.2 | 31.2±20.6 | 0.004 |
| Methylglyoxal(µM) | 0.80±0.58 | 0.61±0.34 | 0.029 |
| Glyoxal (µM) | 0.80±0.22 | 0.75±0.28 | 0.336 |
| 3-Deoxyglucosone (µM) | 0.72±0.22 | 0.70±0.26 | 0.699 |
E-HD: electrolyzed water hemodialysis (data is expressed as mean +/- standard deviation).
There were no significant differences between the fatigued and non-fatigued groups in serum concentrations of uremic toxins at baseline (M0) (Patient-set: FS). In the overall comparison between M0 and M12 (Patient-set: EHD), there were no significant changes in hippuric acid, p-cresyl sulfate, glyoxal, and 3-deoxyglucosone, while there were significant decreases in indoxyl sulfate and methylglyoxal at M12.
Discussion
Amelioration in dialysis-related fatigue through E-HD has been reported29–32. This study assessed long-term changes of fatigue, and investigated metabolic profile, and uremic toxins following the introduction of E-HD to explore the mechanisms behind its anti-fatigue effects. In patients who experienced fatigue with activity reduction during S-HD, fatigue significantly improved over a 12-month period. Among them, patients who presented fatigue only on HD days, body fat mass significantly decreased, while skeletal muscle mass significantly increased. Metabolome analysis revealed significant differences in energy metabolism between the fatigued and non-fatigued groups at baseline, and these differences were mitigated by E-HD at 12 months. There were no notable differences in the uremic toxin profile between the two groups at baseline, but levels of indoxyl sulfate and methylglyoxal were significantly decreased at 12 months after E-HD.
In the present study, we classified patients of Group-A into two sub-groups, i.e., patients who have persistent fatigue on both HD and HD-free days (Group-A1), and having fatigue on only HD days (Group-A2), based on our hypothesis that they are clinically different entities.
Between the two groups, there were differences in the basal fatigue levels, and in the basal skeletal muscle mass. Furthermore, the changes of body composition (i.e., M0 vs. M12 in fat mass, skeletal muscle mass, and ECV/TBW) were different between the two groups. These data may support our notion. However, the both groups showed significant decreases in fatigue of HD day at M12 as compared with M0. Furthermore, there was a significant decrease in fatigue of HD-free day in Group A1 (M0 vs. M12), with no statistical difference between Group A1 and A2 at M12. Upon the results, we speculate that HD-related pathological factors for fatigue might be suppressed by E-HD, and this may result in the amelioration of exaggerated fatigue in Group A1. These results may indicate the presence of common pathologies among the two groups. Taken together the results, the validity of our hypothesis has remained to be addressed, and further study is needed to conclude the issues.
The pathophysiology of fatigue in dialysis patients remains largely unclear. In this study, we classified HD patients into 3 groups by fatigue levels by NRS. Regarding patient characteristics, the fatigued patients (Group-A) were older, and female dominance. But except for them, no differences were found in medical background, body composition, and labolatory data, such as, hemoglobin, serum albumin, and C-reactive protein. The neutrophil NETosis phenomenon, as a marker of biocompatibility, was investigated through cfDNA and MPO-DNA levels, but no significant differences were found at baseline or during follow-up. However, results of metabolome analysis suggested significant differences in metabolic profiles between the fatigued and non-fatigued group at baseline (M0) (Patient-set: FS), including energy metabolic pathways. In the fatigued group as compared with the non-fatigued group, fatty acid metabolism, and glycolysis were relatively enhanced, while in the citric acid cycle, despite higher levels of citrate and isocitrate, succinate was significantly lower, suggesting a blockade in metabolism beyond isocitrate. This indicates potential derangement in the energy metabolism may be involved with dialysis-related fatigue. Interestingly, the presence of disturbed energy metabolism has been reported among disorders accompanying fatigue and exhaustion, such as myalgic encephalomyelitis/chronic fatigue syndrome33,34, systemic lupus erythematosus35, Fabry’s disease36, and cancer37. The fatigue of dialysis patients may have pathological homologies with those disorders.
After switching from S-HD to E-HD, previous studied reported the recovery of autonomic balance30, and the suppression of oxidative stress, and prevention of antioxidant depletion31. The present study suggested the differences of metabolic profiles between the fatigued- and non-fatigued group at S-HD, as well as at E-HD, furthermore, between S-HD and E-HD (Figs. 4a, 5a and 6a).
As summarized in Fig. 7, we speculated 4 pathway groups, which potentially influence on fatigue development, according to the results of Enrichment analysis, i.e., fatigue-related factors corrected by E-HD (Pathway A), as factors possibly affected by E-HD (Pathway B), or as events common to fatigue pathologies not influenced by E-HD (Pathway C), and as factors not affected by E-HD at all (Pathway D). Pathway A which are corrected by E-HD include energy metabolism, such as, fatty acid synthesis/degradation, glycolysis/gluconeogenesis, and dicarboxylic acid metabolism—likely involving the polyol pathway. On the other hand, the citric acid cycle was suggested as a fatigue-related factor that may be affected by E-HD but not sufficiently corrected (Pathway B). Upon these results, we speculated that E-HD could ameliorate dialysis-related fatigue by interfering with glycolysis, fatty acid metabolism, and citric acid cycle. Figure 8 summarizes the central metabolic pathways which might be altered by E-HD; relatively enhanced metabolic pathways, i.e., glycolysis, and fatty acid metabolism in S-HD, may be suppressed in E-HD, while relatively suppressed citric acid cycle in S-HD, may ameliorated in E-HD. In addition, glutathion synthesis may be facilitated in E-HD as compared to S-HD.
Regarding citric acid cycle dysfunction, it seems that the formation deficiency of succinyl-CoA, a precursor to succinate, and α-ketoglutarate may be involved with the mechanism (Fig. 8). For the former, it cannot be ruled out that a lack of supply of propionic acid, a short-chain fatty acid produced by the intestinal microbiota, may be involved. In comparison between S-HD and E-HD (Patient-set: EHD), significant differences were indicated in the metabolism of propionic acid, and the higher levels of proline and ornithine at E-HD, which are derived from α-ketoglutarate, were observed, suggesting the recovery of citric acid cycle function by E-HD. Furthermore, in comparison between the fatigued and non-fatigued groups at E-HD (Patient-set: FE), glycolysis and fatty acid metabolism were not identified as significant factors. Taken together these results, regarding the mechanism of dialysis-related fatigue, we speculate that glycolysis and fatty acid synthesis may be enhanced, at least partly, as compensatory mechanisms for ATP production in a state where mitochondrial function is impaired, as reported elsewhere38. And we speculate that E-HD may have affected on mitochondria function in patients with fatigue, as accumulative reports have suggested the role of H2 for mitochondria protection, through partly by suppressing oxidative stress39,40. Recently, it is reported that palmitic acid plays a central role for lipotoxic cardiomyocyte damage through mitochondria injury41. Interestingly, in the present study, significant increase was observed in the fatigue group of S-HD, and it was ameliorated by E-HD, which may indicate the possible role of E-HD for cardioprotection as reported elsewhere42.
Additionally, the decrease in pyroglutamate at M12 as compared to M0, may indicate recovery of glutathione metabolism by introduction of E-HD. This could imply that E-HD could improve antioxidant capacity or reduces oxidative stress stimulation, preventing antioxidant depletion, as reported elsewhere27,30. Improved energy metabolism and antioxidant capacity likely may had contributed to the clinical reduction in fatigue, with accompanying nutritional improvement as shown in Group-A2, i.e., increased muscle mass after the introduction of E-HD, which suggests a shift to an anabolic state from catabolic environment of patients. However, the interrelationships between these processes remains hypothetical, understanding this pathophysiology remains a challenge for the future.
Interestingly, Enriched metabolite sets between the fatigued and the non-fatigued groups at E-HD (Patient-set: FE) were different from those of S-HD (Patient-set: FS), and factors including nutritional elements, such as, taurine and branched-chain amino acid (Valine, Leucine) metabolisms, were suggested. We speculate that those fatigue-related factors have been brought to light after the improvement of energy and redox profiles by E-HD. Regarding nutrition issue, it is reported that plasma levels of branched-chain amino acids are lower than healthy subjects in HD patients43, while their levels have a positive correlation with fatigue grade in HD patients44. In the present analysis, valine and leucine levels were tended to be higher in the fatigued group irrespective of HD modalities, possibly reflecting delayed muscle metabolism of branched-chain amino acids in fatigued patients due to reduced muscle mass45. Taurine, a non-essential amino acid with antioxidant properties, is absorbed from dietary sources such as seafood. And its higher level is reportedly correlated with low fatigue in HD patients46. Upon the report and the result of the present study, it is a clinical challenge to test whether fatigued patients may benefit nutritional support, including taurine supplementation.
No differences were found in profiles of uremic toxins between the fatigued and non-fatigued patients at baseline (Patient-set: FS). However, comparing all patients, indoxyl sulfate and methylglyoxal, both the oxidative stress inducer47,48, were significantly decreased at 12 months of E-HD.
Indoxyl sulfate, generated from tryptophan metabolism in the gut and subsequently metabolized in the liver, is a protein-bound uremic toxin challenging to remove via dialysis49. Thus, the significant reduction of the molecule by E-HD is clinically noteworthy. Since levels of tryptophan and its intestinal metabolites, tryptamine and indoleacetic acid, remained unchanged (data not shown), as to the reduction in indoxyl sulfate, several mechanisms might be speculated, i.e., suppressed indole production in intestinal cells, decreased indoxyl sulfate generation in the body, or increased clearance by E-HD as suggested elsewhere50. Considering the possible changes in the production of short-chain fatty acid (propionic acid) from gut microbiota by E-HD, it remains a topic for future research if H2 load during HD may impact dysbiosis.
Methylglyoxal, a uremic toxin produced during the process of enhanced glycolysis and polyol pathway, induces oxidative stress51. Recent reports suggest methylglyoxal can cause mitochondrial damage in muscle progenitor cells, contributing to uremic sarcopenia52. The tendency for lower skeletal muscle mass in the fatigued group highlights the clinical significance of the reduction in methylglyoxal.
This study’s limitations include its single-arm observational design, the interpretation of metabolome analysis being hypothetical and not direct data, and the inability to exclude the impact of external factors or patients’ internal criteria changes on fatigue evaluation during the study periods. Additionally, the present study could not evaluate the differences between Group-A1 and A2 in details, because of the limited number of cases, in which we suppose psychological factors may influence in chronic fatigue type53.
Nevertheless, we think the present study could suggest that E-HD may alleviate fatigue by influencing energy metabolism and potentially antioxidant metabolism. However, the precise mechanisms affecting these metabolic systems by E-HD still remain unclear. Recent research indicates that H2 can directly impact mitochondrial function39,40 and induce Nrf2 expression16, regulating the body’s redox system. Investigating whether H2 contained in electrolyzed water improves mitochondrial function and enhances the overall antioxidant system through Nrf2 activation remains a critical challenge in future.
In conclusion, E-HD appears to suppress dialysis-related fatigue. The mechanisms likely involve changes in energy metabolism and antioxidant systems, along with reduced oxidative stress-related uremic toxins. E-HD is positioned as a novel uremic treatment that goes beyond conventional solute removal-based dialysis therapy by regulating body metabolism.
Method
Patients
Participants in this prospective observational study comprised patients on regular dialysis therapy who were treated at out-patients clinic of St Luke’s International Hospital (Tokyo, Japan) between October 2020 and September 2021. All patients had been receiving standard HD regularly three times a week for 4–5 h/session, using a high-performance membrane dialyzer (membrane materials: polysulfone, poly ether sulfone, polymethyl methacrylate, and cellulose triacetate). As of the 1st week of October 2020, E-HD was introduced for all patients of out-patients clinic, and was provided regularly thereafter. There were no any contraindications to switching to E-HD, and there was no any change in the dialysis protocol except for the change in dialysate. All out-clinic patients on HD (n = 96) were invited to the study enrollment. Informed consent regarding the present study was obtained from 92 cases among 96 patients, and they were followed thereafter for 12 months. During the period, 6 patients were transferred to other clinics due to the reasons of patients’ convenience, 2 patients died due to severe pneumonia (COVID-19 in one case, and community-acquired in one) and 3 patients were dropped-out due to poor response to questionnaires during the study (one case due to long-term hospital admission, two cases due to lack of cooperation to the survey). As a result, 81 cases completed the 12-months survey. The data were analyzed in the 81 patients (60 males; 74.1%, mean age of 71.4 years old, and mean HD vintage of 10.6 years.
The study protocol was fully approved by the Ethics Review Committee at St Luke’s International Hospital (approval date: June 19, 2019; research number: 18-RZ013). All methods were performed in accordance with the relevant guidelines and regulations.
Fatigue assessment
Patient fatigue was evaluated using both a numerical rating scale (NRS) and our own original fatigue scale, as reported elsewhere29–32,54. All questionnaires were provided in written format. NRS is a unidimensional scale with the left end anchored to “no tiredness at all (0)” and the right end to “complete exhaustion10.” Our original fatigue scale is a four-grade self-evaluation by the patient: Grade 1 (no fatigue), patient acts in the ordinary way without any sense of fatigue; Grade 2 (mild fatigue), patient acts in the ordinary way but feels tired; Grade 3 (moderate fatigue), patient feels tired even with light work; and Grade 4 (intense fatigue), patient feels very tired and falls asleep. Thus, it is supposed that the activities of daily life (ADL) are maintained in patients with Grade 1 and 2, while they are substantially decreased in the Grade 3 and 4, respectively.
Assessments of fatigue were performed by all patients at the first time point during the period of standard HD, and within 2 weeks before commencement of EHD system (M0) using questionnaire asking “How did you feel tired in the previous HD day, and the next day of HD?” And NRS (HD and HD-free days) were repeatedly asked at the 1st month (M1), 3rd months (M3), 6th months (M6), and 12th months (M12) after commencement of E-HD system. Assessments of fatigue were made before the start of HD on a randomly chosen HD day during the particular week in each period.
Overview of the E-HD system31
Briefy, E-HD solutions were prepared as follows: Tap water was supplied to the electrolyzed water-hemodialysis system (Trim Medical Institute Co., Osaka, Japan), where water was processed using activated charcoal filtration and water softening and then electrolyzed by direct current supply to the anode and cathode electrode plates. Water on the anode side was drained, and water from the cathode side (electrolyzed water) was collected to supply the reverse osmosis module. The intensity of electrolysis was adjusted to the target H2 concentration. Reverse osmosis water containing H2 produced by the electrolyzed water-hemodialysis system was supplied to prepare the HD solution. The composition of the infow E-HD solution was the same as the dialysis solution using at CHD, with the exception of the presence of dissolved H2 in the E-HD, with no differences in terms of electrolyte levels or pH. H2 levels in dialysate were within the range of 70–130 ppb. The amount of H2 dissolved in the HD solution was measured using a DH Meter (DH-35 A; DKK-TOA, Tokyo, Japan).
Measurements
Blood samples were obtained from all patients at baseline period (M0) and the test points during the study (1 month (M1), 3 months (3 M), 6months (6 M), 12 months (12 M)), before and after a session of HD. Patients were free to meals before sampling. Blood samples were centrifuged with ethylenediaminetetraacetic acid, and all samples were stored at − 80 ℃ until needed for measurements.
Measurements of uremic toxins and carbonyl compounds, and metabolome analysis were conducted in plasma samples of M0 and M12 (Group-A1, n = 11; A2, n = 12, and C, n = 12). In Group-A2, two cases were not measured due to lack of samples, and in Group-C, 12 samples were randomly selected from 32 cases.
Markers of NETosis
Cell-free DNA was detected directly in biological fluids. SYBR Gold Nucleic Acid Gel Stain (Invitrogen, USA) was diluted first at 1:1000 in dimethyl sulphoxide (DMSO, Sigma-Aldrich, USA) and then at 1:8 in phosphate-buffered saline (PBS, Biological Industries, Beth Haemek, Israel). 20 µL of DNA standard solutions (Sigma-Aldrich, USA), and test samples were applied to a black 96-well plates (Greiner Bio-One, Germany), respectively. 40 µL of SYBR Gold solution prepared above was added to each well (final dilution 1:10,000) and fluorescence was measured with a 96well fluorometer (PerkinElmer, USA) at an emission wavelength of 535 nm and an excitation wavelength of 485 nm.
For the detection of NET, following procedure was conducted referencing report by Lood55 to measure myeloperoxidase (MPO) and DNA complex (MPO-DNA). A 96-well microtiter plate (Corning) was coated with a mouse monoclonal anti-MPO antibody (4 µg/ml, Biorad, clone 4A4) overnight at 4 °C, followed by blocking with 1% bovine serum albumin in phosphate buffered saline for 2 h at room temperature. After blocking, plasma samples (10%) were added and incubated overnight at 4 °C. For detection, anti-dsDNA-horseradish peroxidase antibody (diluted 1/100, Roche Diagnostics) was added for 2 h at room temperature. The reaction was developed with 3,3′,5,5′-tetrameth-ylbenzidine (BD Biosciences), and ended by the addition of 2 N sulfuric acid. Absorbance was measured at 450 nm by a plate reader (Synergy, BioTek). Isolated NETs were used as a standard curve with 1 U/ml equaling NET released by 10,000 neutrophils.
Plasma metabolites
The levels of plasma metabolites were measured using gas chromatography-mass spectrometry (GC-MS) based the metabolomics approach. Fifty µL of plasma was mixed with 250 µL of a solution containing 55% methanol and 22% chloroform dissolved in distilled water containing 0.5 mg/mL 2-isopropylmalate (Sigma-Aldrich). Then, the sample was incubated in ThermoMixer C (Eppendorf) at 37 ºC with 1,200 rpm shaking for 30 min. The sample was centrifuged at 4ºC and 16,000 × g for 3 min. Two hundred µL of supernatant was collected and 200 µL of distilled water was added. The sample was centrifuged at 4ºC and 16,000 × g for 3 min. Two hundred and fifty µL of supernatant was dried using an evaporator under reduced pressure and lyophilized. Eighty µL of 20 mg/mL methoxyamine hydrochloride (Sigma-Aldrich) dissolved in pyridine were mixed with the lyophilized sample, sonicated for 20 min, and shaken at 1,200 rpm for 90 min at 30ºC. Next, 40 µL of N-methyl-N-trimethylsilyl-trifluoroacetamide (MSTFA) (GL Sciences, Tokyo, Japan) were added for derivatization. The mixture was then mixed at 1,200 rpm for 30 min at 37ºC, centrifuged at 16,000 × g for 5 min at 4ºC, and the resulting supernatant (1 µL) was subjected to GC-MS. GC-MS analysis was performed using a GC-MS QP2010 Ultra (Shimadzu) with a fused silica capillary column (BPX-5; 30 m × 0.25 mm inner diameter, film thickness: 0.25 μm; Shimadzu) and a front inlet temperature of 250 °C, and a helium gas flow rate through the column of 39.0 cm/seconds. The column temperature was held at 60 °C for 2 min, then raised by 15 °C/min to 330 °C and maintained for 3 min. The interface and ion source temperatures were 280 °C and 200 °C, respectively. All data obtained by GC-MS analysis. The retention times indicated in the Smart Metabolites Database (Shimadzu) were used. To perform a semi-quantitative assessment, the peak area of each quantified ion was calculated and normalized using 2-isopropylmalate peak area.
Uremic toxins
For sample preparation to measure uremic toxins, 75 µL of 0.1% formate methanol containing 1.25 µg/mL indoxyl sulfate-d3, and 2.5 µg/mL hippuric accid-d5 were added to 25 µL of each plasma and vortexed for a few sec. Then, the samples were sonicated for 5 min and centrifuged at 16,400 ×g for 20 min at 4 °C. The supernatant was filtered through 0.2 μm Duo-filter membranes (YMC Co., Ltd., Kyoto, Japan). Quantitative analysis of indoxyl sulfate and hippuric acid was performed using LC–MS/MS using Nanospace SI-2 3033 coupled to a TSQ Quantum Ultra mass spectrometer and operated in negative mode. For indoxyl sulfate and hippuric acid measurements, each sample (1 µL) was injected into 100 × 2.0 mm CAPCELL PAK C18 MG III, 3-µm column (OOSAKA SODA, Osaka, Japan) with Scherzo SM-C18 guard column 5 × 2.0 mm (Imtakt Corporation, Kyoto, Japan) at a flow rate of 0.2 mL/min. For gradient elution, mobile phase A was 10 mM ammonium acetate in pure water, and mobile phase B was acetonitrile. Linear and stepwise gradients were programmed as follows: 0–8 min: 0–100% solvent B; 8–12 min: 100% solvent B; 12–15 min: 0% solvent B. Quantification analysis by MS/MS was performed in SRM mode, wherein the transitions of the precursor ion to the product ion and collision energy were monitored: m/z 212 → 80, 21 V for indoxyl sulfate; m/z 216 → 80, 30 V for indoxyl sulfate-d4,m/z 178 → 134, 13 V for hippuric acid; and m/z 183 → 139, 27 V, for hippuric acid-d5,m/z 187 → 107, 23 V for p-cresy sulfate. Spray voltage was 2,500 V, vaporizer temperature was 450 °C, and capillary temperature was 220 °C.
Body composition and cognitive function
In all patients, bioimpedance analysis was performed using the Seca® medical body composition analyzer 525 (Seca GmbH & Co. KG, Hamburg, Germany), 20 min after the hemodialysis procedure at M0 and M12, with the patients in the supine position. The parameters assessed by bioimpedance analysis were at mass, skeletal muscle mass, extracellular water (ECW), and total body water (TBW)56. Mini mental scale examination (MMSE) was conducted in all patients at M0 and M12.
Analysis
Variables are expressed as mean ± standard deviation (SD) or percentage (%), as appropriate. Statistical significance was set at the level of P < 0.05. Comparisons between groups were made using the paired t test, nonparametric Wilcoxon signed-rank test, and chi-square test. Time courses were analyzed using repeated-measures analysis of variance and the Bonferroni procedure for multiple comparisons. Statistical analyses were performed using SPSS version 22.0 (IBM Corp. in Armonk, NY, USA), and JMP Pro software version 16.0.0 (SAS Institute Inc., Cary, NC, USA) for GC-MS Measurement.
In metabolomics, metabolite set enrichment analysis is used to identify the altered metabolite sets (metabolic pathways) associated with phenotypes of interest, e.g., presence of fatigue, using algorithms which is run on a general metabolite network constructed based on public databases, i.e., KEGG (Kyoto Encyclopedia of Genes and Genomes) in the present study57–59.
Acknowledgements
The authors appreciate Kidney Center of St Luke’s International Hospital for supporting this research.
Author contributions
MN was the principal investigator and wrote the main manuscript text. MN, KW, and ES organized the study. MN and ES prepared all figures. KW, YI, CA, KK, NK, MN, and FT collected data. MN, KW, ES, and YM analyzed the data. MN, KW, ES, YI, TF, MN, FT, and MS confirmed the manuscript. MN supervised the progress of research of all aspects.
Funding
This research is supported by the fund (2018–2021) of Tohoku University Hospital.
Data availability
The datasets generated and analysed during the current study are not publicly available due to regulation of St Luke’s International Hospital, but they are available from the corresponding author on reasonable request.
Declarations
Competing interests
The authors declare no competing interests.
Footnotes
Publisher’s note
Springer Nature remains neutral with regard to jurisdictional claims in published maps and institutional affiliations.
References
- 1.Ju, A. et al. SONG-HD fatigue workshop collaborators. Establishing a core outcome measure for fatigue in patients on hemodialysis: a standardized outcomes in nephrology-hemodialysis (SONG-HD) consensus workshop report. Am. J. Kidney Dis.72(1), 104–112 (2018). [DOI] [PubMed] [Google Scholar]
- 2.Jhamb, M. et al. Fatigue in patients receiving maintenance dialysis: a review of definitions, measures, and contributing factors. Am. J. Kidney Dis.52, 353–365 (2008). [DOI] [PMC free article] [PubMed] [Google Scholar]
- 3.Ju, A. et al. Patient-reported outcome measures for fatigue in patients on hemodialysis: a systematic review. Am. J. Kidney Dis.71, 327–343 (2018). [DOI] [PubMed] [Google Scholar]
- 4.Jacobson, J. et al. Patient perspectives on the meaning and impact of fatigue in hemodialysis: a systematic review and thematic analysis of qualitative studies. Am. J. Kidney Dis.74(2), 179–192 (2019). [DOI] [PubMed] [Google Scholar]
- 5.Koyama, H. et al. Fatigue is a predictor for cardiovascular outcomes in patients undergoing hemodialysis. Clin. J. Am. Soc. Nephrol.5, 659–666 (2010). [DOI] [PMC free article] [PubMed] [Google Scholar]
- 6.Jhamb, M. et al. Impact of fatigue on outcomes in the hemodialysis (HEMO) study. Am. J. Nephrol.33, 515–523 (2011). [DOI] [PMC free article] [PubMed] [Google Scholar]
- 7.Bossola, M. et al. Fatigue is associated with increased risk of mortality in patients on chronic hemodialysis. Nephron130, 113–118 (2015). [DOI] [PubMed] [Google Scholar]
- 8.Watanabe, G. et al. Post-dialysis fatigue predicts all-cause mortality in patients on chronic hemodialysis. Ther. Apher Dial. 10.1111/1744-9987.14186 (2024). [DOI] [PubMed] [Google Scholar]
- 9.Flythe, J. E. et al. Kidney health initiative prioritizing symptoms of esrd patients for developing therapeutic interventions stakeholder meeting participants. Fostering innovation in symptom management among hemodialysis patients: paths forward for insomnia, muscle cramps, and fatigue. Clin. J. Am. Soc. Nephrol.14(1), 150–160 (2019). [DOI] [PMC free article] [PubMed] [Google Scholar]
- 10.Singh, N. P. et al. Effect of membrane composition on cytokine production and clinical symptoms during hemodialysis: a crossover study. Ren. Fail.25(3), 419–430. 10.1081/jdi-120021154 (2003). [DOI] [PubMed] [Google Scholar]
- 11.Brys, A. D. H. et al. Serum interleukin-6 and endotoxin levels and their relationship with fatigue and depressive symptoms in patients on chronic haemodialysis. Cytokine. 125, 154823 (2020). [DOI] [PubMed]
- 12.Nakayama, M. et al. Oral ferric citrate hydrate associated with less oxidative stress than intravenous saccharated ferric oxide. Kidney Int. Rep.3(2), 364–373 (2017). [DOI] [PMC free article] [PubMed] [Google Scholar]
- 13.Bowry, S. K., Kircelli, F., Himmele, R. & Nigwekar, S. U. Blood-incompatibility in haemodialysis: alleviating inflammation and effects of coagulation. Clin. Kidney J.14(Suppl 4), i59–i71 (2021). [DOI] [PMC free article] [PubMed] [Google Scholar]
- 14.Fukushi, T. et al. Enhanced neutrophil apoptosis accompanying myeloperoxidase release during hemodialysis. Sci. Rep.10(1), 21747. 10.1038/s41598-020-78742-z (2020). [DOI] [PMC free article] [PubMed] [Google Scholar]
- 15.Korabecna, M. & Tesar, V. NETosis provides the link between activation of neutrophils on hemodialysis membrane and comorbidities in dialyzed patients. Inflamm. Res.66(5), 369–378. 10.1007/s00011-016-1010-6 (2017). (Epub 2016 Nov 24). [DOI] [PMC free article] [PubMed] [Google Scholar]
- 16.Nakayama, M., Kabayama, S. & Miyazaki, M. Application of electrolyzed hydrogen water for management of chronic kidney disease and dialysis treatment-perspective view. Antioxidants13(1), 90. 10.3390/antiox13010090 (2024). [DOI] [PMC free article] [PubMed] [Google Scholar]
- 17.Zhu, W. J. et al. Amelioration of cardio-renal injury with aging in dahl salt-sensitive rats by H2-enriched electrolyzed water. Med. Gas Res.3, 26 (2013). [DOI] [PMC free article] [PubMed] [Google Scholar]
- 18.Yuan, J. et al. Hydrogen-rich water attenuates oxidative stress in rats with traumatic brain injury via Nrf2 pathway. J. Surg. Res.228, 238–246 (2018). [DOI] [PubMed] [Google Scholar]
- 19.Kura, B. et al. Molecular hydrogen: potential in mitigating oxidative-stress-induced radiation injury. Can. J. Physiol. Pharmacol.97, 287–292 (2019). [DOI] [PubMed] [Google Scholar]
- 20.Yu, Y. et al. Hydrogen gas alleviates blood-brain barrier impairment and cognitive dysfunction of septic mice in an Nrf2-dependent pathway. Int. Immunopharmacol.85, 106585 (2020). [DOI] [PubMed] [Google Scholar]
- 21.Lu, Y. et al. Hydrogen-rich water alleviates cyclosporine A-induced nephrotoxicity via the Keap1/Nrf2 signaling pathway. J. Biochem. Mol. Toxicol.34, e22467 (2020). [DOI] [PubMed] [Google Scholar]
- 22.Hu, Y., Wang, P. & Han, K. Hydrogen attenuated inflammation response and oxidative in hypoxic ischemic encephalopathy via Nrf2 mediated the inhibition of NLRP3 and NF-κB. Neuroscience485, 23–36 (2022). [DOI] [PubMed] [Google Scholar]
- 23.Peng, J., He, Q., Li, S., Liu, T. & Zhang, J. Hydrogen-rich water mitigates lps-induced chronic intestinal inflammatory response in rats via Nrf-2 and NF-κB signaling pathways. Vet. Sci.9, 621 (2022). [DOI] [PMC free article] [PubMed] [Google Scholar]
- 24.Nakayama, M., Kabayama, S. & Ito, S. The hydrogen molecule as antioxidant therapy: clinical application in hemodialysis and perspectives. Ren. Replace. Ther.2, 23 (2016). [Google Scholar]
- 25.Nakayama, M. et al. Less-oxidative hemodialysis solution rendered by cathode-side application of electrolyzed water. Hemodial. Int.11(3), 322–327 (2007). [DOI] [PubMed] [Google Scholar]
- 26.Nakayama, M. et al. Biological effects of electrolyzed water in hemodialysis. Nephron Clin. Pract.112, c9–c15 (2009). [DOI] [PubMed] [Google Scholar]
- 27.Terawaki, H. et al. Effect of a hydrogen (H2)-enriched solution on the albumin redox of hemodialysis patients. Hemodial. Int.18(2), 459–466 (2014). [DOI] [PubMed] [Google Scholar]
- 28.Maeda et al. Improvement of the fraction of human mercaptalbumin on hemodialysis treatment using hydrogen-dissolved hemodialysis fluid: a prospective observational study. Ren. Replace. Ther.2, 42 (2016). [Google Scholar]
- 29.Nakayama, M. et al. Possible clinical effects of molecular hydrogen (H2) delivery during hemodialysis in chronic dialysis patients: interim analysis in a 12 month observation. PLoS ONE. 12, e0184535 (2017). [DOI] [PMC free article] [PubMed] [Google Scholar]
- 30.Satta, H. et al. Amelioration of hemodialysis-induced oxidative stress and fatigue with a hemodialysis system employing electrolyzed water containing molecular hydrogen. Ren. Replace. Ther.7, 37 (2021). [Google Scholar]
- 31.Tsujimoto, Y. et al. Amelioration of fatigue in chronic dialysis patients with dialysis solution employing electrolyzed water containing molecular hydrogen (H2) and its association with autonomic function balance. Ren. Replace. Ther.7, 58 (2021). [Google Scholar]
- 32.Uemura, S. et al. Impact of hemodialysis solutions containing different levels of molecular hydrogen (H2) on the patient-reported outcome of fatigue. Ren. Replace. Ther.8, 32 (2022). [Google Scholar]
- 33.Yamano, E. et al. Index markers of chronic fatigue syndrome with dysfunction of TCA and urea cycles. Sci. Rep.6, 34990. 10.1038/srep34990 (2016). [DOI] [PMC free article] [PubMed] [Google Scholar]
- 34.Tomas, C., Elson, J. L., Strassheim, V., Newton, J. L. & Walker, M. The effect of myalgic encephalomyelitis/chronic fatigue syndrome (ME/CFS) severity on cellular bioenergetic function. PLoS One. 15(4), e0231136. 10.1371/journal.pone.0231136 (2020) eCollection 2020. [DOI] [PMC free article] [PubMed] [Google Scholar]
- 35.Kimble, L. P. et al. Associations between TCA cycle plasma metabolites and fatigue in black females with systemic lupus erythematosus: an untargeted metabolomics pilot study. Lupus33(9), 948–961 (2024). [DOI] [PMC free article] [PubMed] [Google Scholar]
- 36.Gambardella, J. et al. Experimental evidence and clinical implications of Warburg effect in the skeletal muscle of fabry disease. iScience26(3), 106074. 10.1016/j.isci.2023.106074 (2023) eCollection 2023 Mar 17. [DOI] [PMC free article] [PubMed] [Google Scholar]
- 37.Pin, F., Barreto, R., Couch, M. E., Bonetto, A. & O’Connell, T. M. Cachexia induced by cancer and chemotherapy yield distinct perturbations to energy metabolism. J. Cachexia Sarcopenia Muscle. 10, 140–154. 10.1002/jcsm.12360 (2019). [DOI] [PMC free article] [PubMed] [Google Scholar]
- 38.Thome, T. et al. Impaired muscle mitochondrial energetics is associated with uremic metabolite accumulation in chronic kidney disease. JCI Insight. 6(1), e139826. 10.1172/jci.insight.139826 (2020). [DOI] [PMC free article] [PubMed] [Google Scholar]
- 39.Shingu, C. et al. Hydrogen-rich saline solution attenuates renal ischemia-reperfusion injury. J. Anesth.24, 569–574 (2010). [DOI] [PubMed] [Google Scholar]
- 40.Gvozdjáková, A. et al. A new insight into the molecular hydrogen effect on coenzyme Q and mitochondrial function of rats. Can. J. Physiol. Pharmacol.98, 29–34 (2020). [DOI] [PubMed] [Google Scholar]
- 41.Tsushima, K. et al. Mitochondrial reactive oxygen species in lipotoxic hearts induce post-translational modifications of AKAP121, DRP1, and OPA1 that promote mitochondrial fission. Circ. Res.122(1), 58–73 (2018). [DOI] [PMC free article] [PubMed] [Google Scholar]
- 42.Nakayama, M. et al. Novel haemodialysis (HD) treatment employing molecular hydrogen (H2)-enriched dialysis solution improves prognosis of chronic dialysis patients: a prospective observational study. Sci. Rep.8(1), 254. 10.1038/s41598-017-18537-x (2018). [DOI] [PMC free article] [PubMed] [Google Scholar]
- 43.Pallerla, P. et al. Evaluation of amino acids and other related metabolites levels in end-stage renal disease (ESRD) patients on hemodialysis by LC/MS/MS and GC/MS. Anal. Bioanal Chem.415(26), 6491–6509 (2023). [DOI] [PubMed] [Google Scholar]
- 44.Debnath, S. et al. Amino acids depletion during hemodialysis is associated with fatigue. Am. J. Nephrol.51(7), 565–571 (2020). [DOI] [PubMed] [Google Scholar]
- 45.Harper, A. E., Miller, R. H. & Block, K. P. Branched-chain amino acid metabolism. Annu. Rev. Nutr.4, 409–454 (1984). [DOI] [PubMed] [Google Scholar]
- 46.Post, A. et al. Amino acid homeostasis and fatigue in chronic hemodialysis patients. Nutrients14(14), 2810. 10.3390/nu14142810 (2022). [DOI] [PMC free article] [PubMed] [Google Scholar]
- 47.Tsutsumi, S. et al. Investigation of the effects of indoxyl sulfate, a uremic toxin, on the intracellular oxidation level and phagocytic activity using an HL-60-differentiated human macrophage cell model. Biosci. Biotechnol. Biochem.84, 1023–1029 (2020). [DOI] [PubMed] [Google Scholar]
- 48.Miyazawa, N. et al. Methylglyoxal augments intracellular oxidative stress in human aortic endothelial cells. Free Radic Res.44(1), 101–107 (2010). [DOI] [PubMed] [Google Scholar]
- 49.Wakamatsu, T., Yamamoto, S., Yoshida, S. & Narita, I. Indoxyl sulfate-induced macrophage toxicity and therapeutic strategies in uremic atherosclerosis. Toxins16(6), 254. 10.3390/Toxins16060254 (2024). [DOI] [PMC free article] [PubMed] [Google Scholar]
- 50.Tange, Y., Takesawa, S. & Yoshitake, S. Dialysate with high dissolved hydrogen facilitates dissociation of indoxyl sulfate from albumin. Nephrourol Mon. 7(2), e26847. 10.5812/numonthly.26847 (2015) eCollection 2015 Mar. [DOI] [PMC free article] [PubMed] [Google Scholar]
- 51.de Bari, L. et al. Interplay among oxidative stress, methylglyoxal pathway and s-glutathionylation. Antioxidants10(1), 19. 10.3390/antiox10010019 (2020). [DOI] [PMC free article] [PubMed] [Google Scholar]
- 52.Sato, E. et al. Methylglyoxal induces inflammation, metabolic modulation and oxidative stress in myoblast cells. Toxins14(4), 263. 10.3390/toxins14040263 (2022). [DOI] [PMC free article] [PubMed] [Google Scholar]
- 53.Tanemoto, Y. et al. Association of illness perception and alexithymia with fatigue in hemodialysis recipients: a single-center, cross-sectional study. Sci. Rep.13(1), 16592. 10.1038/s41598-023-43935-9 (2023). [DOI] [PMC free article] [PubMed] [Google Scholar]
- 54.Maruyama, Y., Nakayama, M., Ueda, A., Miyazaki, M. & Yokoo, T. Comparisons of fatigue between dialysis modalities: a cross-sectional study. PLoS One. 16(2), e0246890. 10.1371/journal.pone.0246890 (2021) eCollection 2021. [DOI] [PMC free article] [PubMed] [Google Scholar]
- 55.Moore, S. et al. J. Role of neutrophil extracellular traps regarding patients at risk of increased disease activity and cardiovascular comorbidity in systemic lupus erythematosus. Rheumatol47(11), 1652–1660 (2020). [DOI] [PMC free article] [PubMed] [Google Scholar]
- 56.Watanabe, K. et al. Role of the new bioimpedance monitoring device (Seca®) in assessing dry weight in hemodialysis patients. Clin. Exp. Nephrol.26(5), 460–465 (2022). [DOI] [PubMed] [Google Scholar]
- 57.Kanehisa, M. & Goto, S. K. E. G. G. Kyoto Encyclopedia of genes and genomes. Nucleic Acids Res.28, 27–30 (2000). [DOI] [PMC free article] [PubMed] [Google Scholar]
- 58.Kanehisa, M. Toward understanding the origin and evolution of cellular organisms. Protein Sci.28, 1947–1951 (2019). [DOI] [PMC free article] [PubMed] [Google Scholar]
- 59.Kanehisa, M., Furumichi, M., Sato, Y., Kawashima, M. & Ishiguro-Watanabe, M. KEGG for taxonomy-based analysis of pathways and genomes. Nucleic Acids Res.51, D587–D592 (2023). [DOI] [PMC free article] [PubMed] [Google Scholar]
Associated Data
This section collects any data citations, data availability statements, or supplementary materials included in this article.
Data Availability Statement
The datasets generated and analysed during the current study are not publicly available due to regulation of St Luke’s International Hospital, but they are available from the corresponding author on reasonable request.