

Summary
The intestine is characterized by an environment where host requirements for nutrient and water absorption are consequently paired with the requirements to establish tolerance to the outside environment. To better understand how the intestine functions in health and disease, large efforts have been made to characterize the identity and composition of cells from different intestinal regions1–8. However, the robustness, nature of adaptability, and extent of resilience of the transcriptional landscape and cellular underpinning of the intestine in space is still poorly understood. Here, we generated an integrated resource of the spatial and cellular landscape of the murine intestine in the steady and perturbed states. Leveraging these data, we demonstrated that the spatial landscape of the intestine was robust to the influence of the microbiota and was adaptable in a spatially restricted manner. Deploying a model of spatiotemporal acute inflammation, we demonstrated that both robust and adaptable features of the landscape were resilient. Moreover, highlighting the physiological relevance and value of our dataset, we identified a region of the middle colon characterized by an immune-driven multicellular spatial adaptation of structural cells to the microbiota. Our results demonstrate that intestinal regionalization is characterized by robust and resilient structural cell states and that the intestine can adapt to environmental stress in a spatially controlled manner via the crosstalk between immunity and structural cell homeostasis.
Introduction
The intestine serves as a central control organ via the integration of environmental derived chemical cues with broad-ranging consequences on host metabolism, immunity, and neurological function. Complex intestinal disorders such as celiac disease (CeD), Crohn’s disease (CD), and ulcerative colitis (UC) manifest in specific regions where environmental pressures presumably intersect with host genetic risk factors and disrupt homeostatic regulation9. Why specific regions of the tissue are targeted over others and how the interplay between niche-specific physiological burdens and host homeostatic mechanisms influence disease outcomes remains unclear. The cellular landscape that defines intestinal regionalization and its robustness to changes in the local environment brought about by homeostatic drivers, such as the microbiota and circadian rhythm, are not well characterized. Additionally, the extent and nature of adaptability of intestinal niches to these environmental pressures has not been completely characterized. Finally, the resilience of niche-specific circuits upon resolution of inflammation has not been fully explored. A deeper understanding of these principles with spatial resolution is critical to define and interpret trajectories required to achieve resolution of human disease.
To gain a better understanding of the molecular wiring of the intestine and decipher the principles that govern its physiology, adaptability, and resilience we mapped the spatial transcriptome of both the mouse small intestine (SI) and colon at steady state and in response to homeostatic regulators including the microbiota, circadian rhythm, and inflammation. Importantly, we found the spatial landscape of the intestine was robust to the influence of the microbiota and circadian rhythm and was adaptable in a spatially restricted manner. Both the robust and adapted identities of the intestine were resilient to acute damage-induced inflammation, illustrating the value of maintaining these microenvironments for intestinal function. Leveraging spatial and single-cell transcriptomics, we characterized the cellular underpinnings of these paradigms and identified region-associated transcriptional profiles characterized by neighborhoods of unique structural cell states in the colon. Finally, we identified a spatially restricted adaptation to the microbiota in the middle colon defined by an immune-mediated multicellular adaptation of structural cells. Our data provide a spatially and cellularly resolved profile of the intestine and identify principles governing intestinal physiology, adaptability, and resilience with broad implications for better understanding health and disease.
Results
Constructing the spatial transcriptome
To interrogate the spatial transcriptome of the murine intestine, we adapted the swiss roll technique (Extended Data Fig. 1a and Methods), a classical dimensionality reduction solution for histological study. We generated data from 46 swiss rolls, covering both the SI and colon for a total of 138,243 spots at 50µm resolution per spot with an average recovery of 4,153 (standard deviation 1,250) genes per spot (Extended Data Fig. 1b). To study the tissue in its native orientation across mice and conditions, we computationally unrolled each roll and integrated fully reconstructed coordinates from different animals into a unified space, allowing for data visualization and integrative analysis in the Cartesian coordinate system (Extended Data Fig. 1c,d and Methods). Our approach was validated by re-mapping clusters generated from variable gene expression onto the unified axes (Methods), which marked intestine relevant spatial regions (e.g., muscle or epithelial layers) as well as segments (e.g.,duodenum or ileum) (Extended Data Fig. 1e,f). Additionally, we captured and mapped cell type signatures for immune cells, fibroblasts, mural cells, and epithelial cells – including rare subsets such as tuft and enteroendocrine cells in their appropriate tissue layers (i.e., mural cells in muscle, B cells in crypt/lamina propria) (Extended Data Fig. 1g). We therefore generated a comprehensive map of the spatial landscape of the murine intestine.
Steady state intestinal transcriptome
To interrogate gene expression along the intestine in the steady state, we established region-enriched gene expression by performing differential expression analysis on SI regions (D, J1, J2, I) (Extended Data Fig. 1a) and three colon regions with distinct expression patterns (proximal, C1; middle, C2; and distal, C3) (Extended Data Fig. 1d and Methods). We identified 2,453 genes with differential enrichment across regions (two-sided Wilcoxon test Padj<0.05; Fig. 1a and Supplementary Data 1). Pathway enrichment analysis identified region-associated gene programs, including intestinal absorption in the duodenum, cholesterol homeostasis in the jejunum, and immune-mediated defense responses in the ileum (Extended Data Fig. 2a). We observed regionally discrete expression, as well as continuous gradients, for genes along the length of the intestine and varied expression of genes across tissue layers from serosa to epithelium (Fig. 1a and Supplementary Data 1). Expression of many SI and colon genes could not be exclusively binned into the duodenum, jejunum, ileum, proximal colon, and distal colon but rather spanned multiple regions. We extended our analysis to interrogate pathways implicated in nutrient absorption and environmental sensing by examining solute carrier (SLC) transporters, G protein-coupled receptors (GPCRs) and nuclear receptors (Extended Data Fig. 2b,c,d), and observed discrete and continuous expression patterns along the length of the intestine for both, highlighting both the specific compartmentalization and wider distribution of absorptive and sensing processes. We then charted all fine-mapped exome variants for IBD and regionally variable monogenic IBD genes (Extended Data Fig. 2e,f and Methods) as well as genetic variants associated with other intestinal disorders, including celiac disease and diverticular disease (Extended Data Fig. 3a and Methods). In line with general expression patterns observed above, we noted expression or enrichment of many genes was not restricted to the region of disease association (e.g. Gpx1, Rela, Adap1, Helz2) suggesting local niche environments must exacerbate certain genetic vulnerabilities to reveal a role in disease processes. Finally, to gain a better understanding of how the various intestinal transcriptional signatures above are established, we mapped expression of transcription factors (TFs). We identified TFs with expression specific to either the SI (Gata5, Myrfl, Pitx2, and Foxd2) or colon (Hoxb13 and Tcf7l1) as well as examples of region-specific expression of these TFs within these segments (Prdm16 and Phdx1 in the duodenum and Hoxd13 in the distal colon) (Extended Data Fig. 3b and Extended Data Fig. 3c). However, we noted that expression of many TFs spanned multiple regions, suggesting that the establishment and maintenance of the intestinal transcriptional landscape is likely achieved by cooperation of many TFs rather than singular drivers.
Fig. 1 |. Mapping the spatial landscape of the intestine reveals regional and shared expression along the gut at steady state.

a, Expression along the unrolled axis of the top 30 enriched genes per region compared to other regions in SI (left) and colon (right), respectively (n=3 biological replicates). Heatmaps on the left edge summarize the average scaled expression of genes along the serosa-to-epithelium axis (only spots with scaled expression >0.5 considered). Swiss roll cartoon made in Adobe Illustrator. b, Upset plot showing the number of shared region enriched genes in each region (average log2 fold-change (log2FC) >0.25 and expressed in >30% of cells). Inset chord diagram shows the distribution of shared genes between SI and colon. c, Smoothed expression of solute carrier (Slc) transporter genes enriched in at least one region in both small and large intestine in b with proposed ligands on the right (n=3 biological replicates). D - duodenum, J1 - jejunum 2, J2 - jejunum 1, I - ileum, C1 - proximal colon, C2 - middle colon, C3 - distal colon.
Distal region shared expression
The SI and colon are traditionally studied as separate entities with distinct biological functions of nutrient absorption and water resorption, respectively. However, intestinal function requires coordination between regions for processes such as peristalsis, secretion of digestive enzymes during food intake or the feeding-induced gastrocolic reflex. In addition to the shared expression of genes across adjacent segments in the SI or colon, we also noted a set of genes, such as S100g, Slc10a2 and TFs Osr2 and Hoxb7, which were associated with regional identity independently in the SI as well as in the colon (Fig. 1a, Extended Data Fig. 3c). To determine if gene expression programs are coordinated between non-contiguous intestine regions, we identified the overlapped segment-specific genes between all SI and colon regions (Fig. 1b and Supplementary Data 2). Adjacent regions such as the duodenum and jejunum showed high sharing as expected given their proximity, but unexpectedly we also noted sharing between non-adjacent regions of the SI and colon (Fig. 1b). To contextualize this across regions, we focused on the critical process of solute transport, which we interrogated through a set of Slc transporter genes expressed throughout the intestine and summarized all shared genes between a given SI region and colon region (Fig.1c). We identified 16 genes, including the bile acid transporter-encoding gene Slc10a2 (shared between ileum and proximal colon), the proposed glucose-6-phosphate antiporter-encoding gene Slc37a2 (duodenum and distal colon), and the iron transporter-encoding gene Slc40a1 (D and C3) (Fig. 1c and Extended Data Fig. 3d). Consistent with recent reports that creatine levels in the murine intestine peak in the jejunum, drop in the ileum, and increase again in the colon (the latter being microbiota dependent)10, we observed a similar pattern for expression of the creatine receptor-encoding gene Slc6a8. Slc6a8 expression was shared between J2 and distal colon (Fig.1c and Extended Data Fig.2b), suggesting coordinated gene expression in distal regions might reflect shared features of these regional lumen microenvironments.
Importantly, although we observed several TFs with expression in one or more SI segments and the proximal colon (Osr2 and Isx) and extensive sharing of TFs between the ileum and proximal colon (Hoxb7, Hoxb9, Hoxb6, Hoxb3) (Extended Data Fig. 3c), these patterns did not capture the full set of segment-to-segment sharing patterns we observed (Fig.1b). Therefore, it is likely that the expression of genes in non-contiguous regions can be regulated by different TFs. In line with this, the TF PDX1, which controls duodenal expression of Slc40a1 and Slc37a211, is not expressed in the colon (Fig. 1b, whereas Slc40a1 and Slc37a2 are (Fig. 1c), thus supporting different regulatory processes in the two regions. Additionally, using TF binding motif overrepresentation analysis on shared genes (Methods), we identified expression of the D-C3 gene Tmprss2, a transmembrane serine protease reported to facilitate coronavirus entry12, as a potential regulatory target for the duodenum and distal colon-specific TFs Onecut2 and Hoxb13 (Extended Data Fig. 3e), respectively (Fig. 1b).
Altogether, our approach permitted us to identify genes with region-specific expression or expression patterns that spanned both adjacent and non-contiguous intestinal regions.
The intestinal landscape is robust
We next sought to address the role of homeostatic regulators, starting with the gut microbiota, in establishing and/or altering the spatial transcriptional landscape. As previously reported13, we observed many DEGs (4,265) between specific pathogen free (SPF) and gnotobiotic germ free (GF) animals from all regions compared (Extended Data Fig. 4a and Supplementary Data 3). While we identified 2,453 genes that showed region-enriched expression in the steady state, only a minority of DEGs between SPF and GF mice (7%; two-sided Wilcoxon test, Padj<0.05) altered the prevalence of expression of a particular gene within a given region (Extended Data Fig. 4a), and a smaller fraction of the genes exhibited a large effect size (<0.1% with absolute log2FC>1; Extended Data Fig. 4b). The majority showed microbiota-independent spatial expression patterns even for genes implicated in antimicrobial defense, such as antimicrobial peptides (AMPs) and defensins (Extended Data Fig. 4c). We did, however, note some genes where the microbiota had a major impact on regionality of expression, such as the mannose binding lectin (MBL) encoding gene Mbl2, which was highly prevalent in the GF jejunum and almost completely turned off in SPF tissue (71.8% and 9.4% non-zero expression in GF and SPF J1, respectively) (Extended Data Fig. 4d). MBL exhibits selective binding of the gut microbiota14, suggesting a targeted regulation of host-microbiota homeostasis in this region. Conversely, the vitamin D-dependent calcium-binding protein-encoding gene S100g was specifically turned on in the proximal colon of SPF animals (91.7% and 24.8% non-zero expression in SPF and GF, respectively) (Extended Data Fig. 4e).
To more comprehensively test the impact of the microbiota on the transcriptional landscape of the intestine, we leveraged our spatially integrated intestine to measure the spatial association for each gene along the SI or colon (Extended Data Fig. 4f and Methods). Strikingly, for both the SI and colon we observed a high concordance of spatial association for all genes both within conditions (SPF vs. SPF) and between conditions (SPF vs. GF) (Pearson correlation >0.63; Extended Data Fig. 4g). As a control, we observed little to no correlation between the SI and colon (Pearson correlation <0.17; Extended Data Fig. 4g). Finally, we also extended this approach to circadian rhythm, a homeostatic regulator of both the host and microbiota15, and observed region-independent oscillation of clock genes such as Nr1d1 and Per2 (Extended Data Fig. 4h) and preservation of spatial association for genes in the colon of both SPF and GF mice (Extended Data Fig. 4i). Collectively, these results demonstrated that the spatial landscape of the intestine is robust to homeostatic drivers including the microbiota and circadian rhythm.
Adaptation of the middle colon
Having established the robustness of the spatial transcriptome at regional resolution, we next sought to assess if and how the intestine adapts to perturbations at steady state in more spatially confined niches not captured by our approach above. We leveraged our spatial dataset to capture irregular, sparse, or layer-specific differences between SPF and GF tissues using unsupervised clustering of SI and colon expression data (Extended Data Fig. 1f). Consistent with the above observations, most clusters were associated with region as well as layer within either SI or colon tissue (Extended Data Fig. 5a–c). However, clustering of expression from colon tissue revealed a cluster associated with microbial colonization (microbe-induced cluster, yellow) in SPF and FMT animals (Extended Data Fig. 5d,e). When mapped back onto space, this cluster was enriched in the middle colon (Extended Data Fig. 5f). To test the extent to which the regional identity of the middle colon was driven by the microbiota, we compared effect sizes (log2FC) for DEGs identified when comparing SPF with GF and FMT with GF animals (Fig. 2a). Genes exhibiting a high fold change in the presence of the microbiota (SPF or FMT) also showed a high region-specific expression pattern (high fold change compared to other regions) for the middle colon, but not for the proximal or distal colon (Spearman correlation between log2FC FMT-GF and regional expression = 0.00, 0.54 and −0.20 for proximal, middle and distal colon, respectively) (Fig. 2a,b). Interestingly, pathway enrichment analysis revealed the middle colon signature was enriched for biological processes and molecular functions associated with cellular stress, including regulation of apoptotic processes and wound healing, indicative of a homeostatic adaptation to local stress (Extended Data Fig. 5g).
Fig. 2 |. Spatial transcriptomics reveals a microbiota driven adaptation in the middle colon.

a, Scatter plots showing the log2FC of gene expression comparing SPF (X-axis) or FMT (Y-axis) against GF mice in proximal, middle and distal colon. Points colored by log2FC of expression in the indicated region compared to other two regions (genes with absolute log2FC >0.1 colored). Outliers of the two tails in each plot are shown in insets. b, Upregulated genes in C2 compared to C1 and C3 colored by log2FC for the comparison between SPF and GF animals (genes with absolute log2 FC >0.1 were colored). c, Antibody staining of ANG4 protein (green; Minimum display value = 7 and maximum display value = 25) on colon tissue from an SPF mouse showing enrichment in the C2 region. Nuclei stained with DAPI (gray; Minimum display value = 5 and maximum display value = 100). Processed using ImageJ and representative of n=5 biological replicates.
In line with evidence of an epithelial stress response, we noted upregulation of genes such as Retnlb in the middle colon of SPF mice (Fig. 2b and Extended Data Fig. 5h), which encodes for RELM-β, a protein induced in response to both helminth16 and bacterial infections17. Another of these genes, Ang4 (Fig. 2b,c), is constitutively expressed in SI Paneth cells and encodes for a protein with bactericidal activity18. Ang4 is also induced in colonic goblet cells in response to helminth infection19,20 as well as in the colon of mice with disrupted mucin glycosylation21. Strikingly, immunofluorescent staining of ANG4 protein confirmed a distinct enrichment in the middle colon (Fig. 2c) and provided a robust biomarker for the adaptation to the microbiota. Interestingly, we also noted middle colon-specific expression of Itln1 (Extended Data Fig. 5h), a gene that encodes for the lectin ITLN1, which is associated with risk for and dysregulated in IBD22. We also observed spatial upregulation of Pla2g4c and Gsdmc4 (Fig. 2b and Extended Data Fig. 5h), genes directly induced in small intestinal organoids in response to IL-423. Genes encoding for the core components of mucus, including mucin-2 (Muc2), Fcγ binding protein (Fcgbp), and calcium-activated chloride channel regulator 1 (Clca1), were also significantly induced by the microbiota in the middle colon (Fig. 2b), suggesting that enhanced mucus secretion may also accompany the microbe-induced upregulation of genes highlighted above. We also observed higher expression of genes potentially involved in the canonical colonic function of water and solute absorption, such as aquaporin-encoding genes Aqp8 and Aqp4 and the Na/H exchanger-encoding gene Slc9a3 (Fig. 2b), suggesting that the middle colon may represent a niche where host physiological processes indirectly promote heightened host-microbiota interactions in the steady state, necessitating the induction of protective responses normally associated with infection. Together, these data demonstrated the capacity for host spatial niche adaptation within the framework of a robust landscape in response to microbiota-dependent steady state perturbations.
Resilience of the intestinal landscape
To investigate the resilience of the spatial landscape of the colon we induced inflammation in mice using dextran sodium sulfate (DSS) and mapped the landscape throughout the post-treatment recovery course for up to 73 days (Extended Data Fig. 6a). We observed the largest number of DEGs during inflammation (D12 compared to sham) in the middle colon followed by the distal and proximal colon (Extended Data Fig. 6b). Pathway analysis of the inflamed state at D12 revealed enrichment for genes in biological processes covering inflammation, responses to bacteria, cell migration, and extracellular matrix organization, validating the disruptive impact of DSS on the tissue (Extended Data Fig. 6c). Gene expression levels perturbed at D12 started to recover to steady state levels by D30, with the majority recovered by D73 (Extended Data Fig. 6b). Importantly, this axis of perturbation and recovery was confirmed when we compared the spatial association (Spearman correlation coefficient) for each gene along the length of the colon at different time points, with D12 showing a disruption of the steady state transcriptional landscape when compared to D0, and D30 and D73, subsequently displaying a gradual recovery to the steady state (Fig. 3a).
Fig. 3 |. A model of spatiotemporal damage reveals the steady state spatial landscape and adaptations in the colon are resilient to inflammation.

a, Spatial association (Spearman correlation coefficient) for each gene along proximal-distal axis of the colon in mice treated with DSS and allowed to recover for varying amounts of time compared to non DSS treated mice (sham) (Pearson correlation, r). Points are expressed genes and lines represent the fitted linear regression curve. b, DSS disruption and recovery of spatial clusters derived from expression visualized on the UMAP (left) and swiss rolls (middle), coupled with tissue H&E staining (right). Images are representative of the exact tissue slice that was processed for Visium. DSS treatment and associated recovery period was conducted once per time-point. c, Expression of Ang4 on swiss rolls at different stages of recovery. d, Proximal, middle, and distal colonspecific gene module scores plotted along the unrolled axis of the colon at different stages of recovery. Fitted curve and shaded area represents the fitted locally estimated scatterplot smoother (LOESS) with 95% confidence interval, respectively. Day 0 curve shown as red lines overlaid on D12, D30, and D73 plots.
Next, we investigated the spatial architecture of inflammation-induced transcriptional changes using unsupervised clustering of expression data. In line with individual gene expression changes, D12 exhibited region-specific clustering that deviated from D0, while D30 and D73 recovered the steady state pattern (Fig. 3b and Extended Data Fig. 6d and Supplementary Data 4). In particular, we observed an enrichment for two inflammation associated clusters (clusters 8 and 10) that were differentially enriched on the serosa-to-epithelium axis and associated with regions of tissue with histological signs of severe damage such as ulcerations (Fig. 3b, orange arrows). Cluster 8, associated with the epithelial space, was enriched for epithelial wound-response associated genes, such as Clca4b, Wfdc18, Ly6m, and Marcksl124 and other genes upregulated in inflamed tissue of patients with IBD such as Ido17, Duox2, Duoxa2, and Nos26,7, genes which are involved in oxidative stress and associated with mitochondrial dysfunction (Extended Data Fig. 6e and Supplementary Data 4). Cluster 10, more closely associated with the muscular mucosa space, was enriched for expression of immune- and stroma-associated inflammatory signatures, such as Il1b, S100a8/9, Il11, and Igfbp4/5. Interestingly, while Clca4b was expressed in all regions of tissue covered by cluster 8, we found Ido1 was only enriched in regions associated with ulcerations and the immune and stromal signature of cluster 10, thus highlighting the spatiotemporal complexity of restitution programs along the path to resolution (Extended Data Fig. 6e). To further interrogate whether these regions of tissue were associated with a unique transcriptional program, we compared high- to low-expressing regions of Ido1 and identified a set of genes significantly upregulated in tissue regions with high Ido1 expression that were enriched in WAE cells24 (78% of top 50 genes), such as Aldh1a3, Ly6m, S100a11, Marcksl1, Pmepa1, Lamc2, and Emp1 (Extended Data Fig. 6f). Interestingly, Ido1, which can be induced in inflamed enterocytes25, was not upregulated in WAE cells24 and Clu, a WAE cell-specific gene was not upregulated in tissue where Ido1 is highly expressed. These observations suggest unique transcriptional programs are induced at different time points along the restitution process, as the original study assessed wounds at two days post damage and our data captured the tissue at D12.
We next sought to determine whether the adaptation to the microbiota in the middle colon was also resilient. Strikingly, expression of Ang4, a proxy for the middle colon adaptation (Fig. 2c and Extended Data 6g), was almost completely absent in the tissue at the peak of inflammation on D12, but recovered by D30 and persisted at D73 (Fig. 3c). In line with this observation, we observed a depletion of the microbe-induced middle colon cluster (cluster 2) in space at D12 and a recovery at days 30 and 73 (Fig. 3b). Finally, genes characterizing the middle colon region showed a lower average expression at D12 compared to D0 with a recovery at D30 and D73 (Fig. 3d and Extended Data Fig. 6g and Methods). Altogether, these data demonstrated that both the steady state spatial landscape and inducible spatial adaptations to perturbation in the colon are resilient to acute inflammation.
Structural cell spatial adaptations
To uncover the cellular drivers that establish and maintain the spatial landscape of the intestine as well as those that characterize the middle colon adaptation, we utilized single-cell RNA-sequencing of cells collected from four approximately equal partitions covering the proximal, middle and distal regions of the colon (A-D) from SPF, GF, and FMT treated animals (Fig. 4a, Extended Data Fig. 7a and Methods). We profiled 234,613 cells and annotated 99 cell subsets based on differential gene expression to provide an in-depth transcriptional characterization of the mouse colon spanning epithelial, stromal, and immune cell subsets in SPF, GF, and FMT states (Extended Data Fig. 7a,b,c Supplementary Data 5, and Methods).
Fig. 4 |. Single cell RNA-seq coupled with spatial transcriptomics reveals spatially restricted structural cell neighborhoods and microbiota-driven adaptations.

a, Four regions of colon from which single-cell transcriptomics was generated (created with BioRender.com). Relative abundances of annotated cell types in the enterocyte (top), fibroblast (middle) and goblet cell (bottom) lineages (for SPF and GF, averaged for n=2 biological replicates for fibroblast and n=3 biological replicates for enterocyte and goblet cells and for FMT, averaged for n=2 biological replicates). Black borders indicate cell types unique to each region. b, Left: distribution of cell types in (a) assigned to the Xenium sample of SPF mouse colon. Region B enriched cell types highlighted with black border. Right: counts of spatially variable structural cell subsets along the bins (N=20) from proximal-to-distal axis of the colon in SPF and GF mice. Swiss roll cartoon made in Adobe Illustrator. c, Marker genes (average log2FC >0.1 compared to other cell types in the same lineage; Mature enterocytes II vs. other Mature enterocytes (top) Igfbp3+/Serpina3g-hi fibroblasts vs. other Igfbp3+ fibroblasts (middle) Retnlb/Ang4+ GCs vs. all other GCs (bottom). Top 50 genes ranked by average log2FC or highly specific to the cell type (log2FC in prevalence >1.5) are labeled.
Given their high abundance in space, we hypothesized our spatial observations were likely primarily characterized by features assigned to structural cells. We identified compositional differences in enterocyte, fibroblast, and goblet cell (GC) subsets along the proximal-distal axis in SPF mice with regional enrichment of subsets (Fig. 4a and Extended Data Fig. 7d–f). Furthermore, we identified subsets specific to the middle colon-associated region B in enterocytes, fibroblasts, and GCs in SPF mice. Strikingly, all three B-specific subsets were underrepresented in GF mice and recovered in FMT mice (Fig. 4a and Extended Data Fig. 7c–e), in line with our identification of a spatial adaptation in this region that depended on the microbiota (Fig. 2).
To provide a spatial context to these observations and validate the regional enrichment in our single-cell compositional data, we leveraged our whole transcriptome Visium spatial dataset and deconvolved the colon spatial data from SPF mice using cell-type signatures learned from our single-cell data (with Cell2location, Methods). In line with our single-cell compositional data, unique subsets of each lineage were differentially enriched in proximal, middle, and distal colon, thus providing a cellular underpinning to the spatial gene expression patterns observed above (Extended Data Fig. 8a). To further validate these observations with an alternative marker gene-based method and at higher resolution, we generated a customized list of 480 genes to spatially map our cell states in SPF and GF mice with Xenium technology (Methods and Supplementary Data 7). Our Xenium results recapitulated the association of regionally unique structural cell subsets while also capturing the spatial distribution of all other cell types in our dataset (Extended Data Fig. 8b,c). Furthermore, we elucidated the distribution of cell types along the serosa-to-mucosa axis and identified differential enrichment for epithelial cells, fibroblasts, mural and endothelial cells, as well as immune cells along this axis (Extended Data Fig. 8d). Finally, we confirmed the microbiota-dependent enrichment of middle colon adapted structural cell subsets (Fig. 4b and Extended Data Fig. 8b).
We next characterized the diversity of cell subsets defining the spatial adaptation in the middle colon, starting with profiling of 102,802 enterocytes. We identified three mature cell states that were differentially abundant (Mature enterocytes I, II, III) (Fig. 4a,b and Extended Data Fig. 8b,c,d). We also noted immature states (Immature enterocytes I, IV, III) that were associated with each mature subset where immature cells were closer to the crypt and mature cells were closest to the lumen-facing region (Fig. 4b and Extended Data Fig. 8d). Marker genes for these subsets matched regional genes identified above (Fig. 1a), such as Hmgcs2 and Slc10a2 for Mature enterocytes I (proximal) and Saa1 and Ly6g for Mature enterocytes III (distal)26 (Extended Data Fig. 8e and Supplementary Data 5). Importantly, we identified a subset of enterocytes that were specifically enriched in the middle colon associated region B (Mature enterocytes II) that acquired their identity in response to microbiota colonization (Fig. 4a,b and Extended Data Fig. 8b,c and Supplementary Data 5). These cells were characterized by unique expression of middle colon identity genes (Fig. 2b) including Clca4a, Ly6m, Slc9a3, Aqp4, and GPCR-encoding genes Gprc5a and Ptger4 (Fig. 4c). Enrichment for Slc9a3 expression in middle colon enterocytes was supported by staining for SLC9A3 on the apical membrane of cells closest to the lumen (Extended Data Fig. 8f). Mature enterocyte II-specific genes Clac4a and Ly6m, together with upregulated gene Duox2 (Fig. 4c), were recently described as marker genes for wound associated epithelial (WAE) cells in the colon24. Correspondingly, pathway analysis showed enrichment for the wound healing biological process in the middle colon (Extended Data Fig. 5g). Therefore, a portion of the spatial transcriptional profile of the middle colon is attributable to a unique subset of mature enterocytes that exhibit signs of stress in the steady state in addition to their unique expression of solute transporters, water channels, and environmental sensory receptors.
We next profiled 19,899 fibroblasts and identified three major subsets characterized by unique expression of Igfbp3, Hhip, or C3 (Fig. 4b and Extended Data Fig. 8g) that capture expected intestine-associated lineages such as myofibroblasts and interstitial fibroblasts27. Our spatial mapping results matched expected spatial assignment27, with the Igfbp3+ lineage enriched in the space of crypts and the lamina propria while the C3+ lineage was enriched in the muscle-associated space (Fig. 4b and Extended Data Fig. 8d). We identified subsets of each lineage differentially enriched along the proximal-to-distal colon axis, once again highlighting the complexity of cell states for different lineages and their association with intestinal regionality (Fig. 4b and Extended Data Fig. 8b,c). We observed a microbiota-dependent enrichment of an Igfbp3+ myofibroblast subset in region B characterized by unique expression of two serine protease inhibitor (serpin) genes, Serpina3g and Serpina3n, when compared to all other Igfbp3+ subsets (Fig. 4c). The balance of interactions between host and microbial serine proteases and serpins has been implicated in IBD pathogenesis28,29. SerpinA3N is secreted by epithelial cells infected with C. rodentium and mitigates infection severity30, however the role of serpins in intestinal fibroblasts is still unknown. Given the association of serpins with anti-inflammatory processes28, the fibroblast adaptation in the middle colon is likely tailored towards maintaining and supporting homeostasis in response to local microbiota-induced perturbations.
Finally, we profiled 22,918 GCs and identified 16 clusters that displayed differential enrichment along the proximal-to-distal axis (Fig. 4b and Extended Data Fig. 8b,c). We recovered previously characterized specialized lineages of colonic GCs including Reg4+ deep crypt GCs31, sentinel/non-canonical GCs32,33, and two subsets of intercrypt GCs33 (characterized by high expression of Spink1) with differential distribution across segments and in space along the crypt-to-mucosal surface axis (Fig. 4a,b, Extended Data Fig. 8c,d,h and Supplementary Data 5). One prevailing model of mucus deposition by GCs positions the proximal colon as the source of the outer mucus layer that subsequently coats the luminal content21,34, however in-depth characterization of GC subsets at single-cell resolution has focused on the distal colon33 (D/C3). We found the proximal colon GC compartment (segment A) was less diverse than other regions and lacked most GC subsets enriched in more distal regions (Fig. 4a). Instead, we identified two primary subsets characterized by Car8 expression and unique non-canonical GCs expressing the C1 gene Hmgcs2 (Fig. 4a and Extended Data Fig. 8c,h). These subsets and their distribution were mostly preserved in GF mice. However, as in enterocytes and fibroblasts, we identified a subset of GCs in the middle colon-associated segment B that is microbiota-dependent and characterized by expression of Retnlb and Ang4 (Fig. 4c and Extended Data Fig. 8b,c,h), genes that characterized the C2 microbiota-driven adaptation signature (Fig. 2b). When compared to other GC subsets, these cells were further characterized by their unique expression of genes such as Meg3, Chrm3, and Cd177, in addition to spatially low prevalence genes such as Itln1, Pla2g4c and Pnliprp2 (Fig. 2 and Extended Data Fig. 5h), which were also expressed in a small fraction of Retnlb/Ang4+ GCs (Fig. 4c; 13.8%–32.7% in Retnlb/Ang4+ GCs but 1.2%–8.7% in other GCs). We noted the presence of a GC subset, unique to segment B but also present in GF mice, characterized by high expression of Ccn3, a gene coding for an angiogenesis-associated matricellular protein enriched in middle colon GCs35 (Fig.5a,b and Extended Data Fig. 8c,h). RNA velocity analysis revealed the Ccn3-hi GC subset as a potential precursor cell state for the microbiota-adapted Retnlb/Ang4+ GCs (Extended Data Fig. 8i). In line with an immature precursor state, we noted enrichment of Ccn3-hi GCs closer to the crypt when compared to Retnlb/Ang4+ GCs (Fig. 4b and Extended Data Fig. 8d). Interestingly, within the middle colon there was an inverse relationship between the abundance of the two GC states along the proximal-to-distal axis (Extended Data Fig. 8c). Therefore, it is possible that microbially-derived cues drive the adaptive differentiation of Ccn3-hi GCs towards the Retnlb/Ang4+ GC subset. Altogether, these data provided evidence for spatially restricted cellular states in the colon, identified structural cells as key contributors to regional transcriptional identity, and uncovered a niche-specific enrichment of unique subsets of enterocytes, fibroblasts, and GCs in the middle colon-associated region that are driven by the microbiota, supporting a spatial adaptation within the framework of robust spatial landscape signatures and cell states.
Fig. 5 |. Immune-mediated control of spatially restricted structural cell adaptations to the microbiota.

a, Number of DEGs for immune cell types across regions of colon between SPF and GF mice (FDR<0.001, absolute log2 fold change > 0.5). b, Log2 fold change of DEGs for ILC2s in (a). c, Data summarizing median fluorescence intensity (MFI) of the surface protein marker CD28 on colonic ILC2s (A-D; proximal-distal) of SPF (purple) and GF (black) mice. n=15 mice from 5 independent experiments for SPF and n=9 from 3 independent experiments for GF. Boxplot displays first and third quartiles with the middle line representing the median, and whiskers show 1.5 times the interquartile range from the box. d, Antibody staining of ANG4 protein (green; Minimum display value = 10 and maximum display value = 30) on colon tissue from DT treated ROSA26LSL-DTR (left, n=4 mice) and Nmur1iCre-eGFPROSA26LSL-DTR (right, n=4 mice) mice showing loss of ANG4 in ILC2-depleted mice (right). Nuclei stained with DAPI (gray; Minimum display value = 0 and maximum display value = 150). Processed using ImageJ and representative of two independent experiments. e, Counts of spatially variable goblet cell subsets along the bins (N=20) from proximal-to-distal axis of the colon in DT treated ROSA26LSL-DTR (left) and Nmur1iCre-eGFPROSA26LSL-DTR (right) mice showing loss of Retnlb/Ang4+ GCs in ILC2-depleted mice. Swiss roll cartoons made in Adobe Illustrator.
Immune mediated spatial adaptations
Given the established role of immunity in adapting to the microbiota36, we profiled changes in immune cells to gain insights into mechanisms underlying structural cell integrity and adaptations. We performed DEG analysis on 15 major immune cell subsets recovered in both SPF and GF mice for each of the 4 colon segments described above (Methods). We observed regional differences for subsets such as macrophages, CD8aa T cells, and other cell types. Strikingly, ILC2s showed the highest number of DEGs overall while also showing a selective enrichment of DEGs in region B (Fig. 5a,b and Extended Data Fig. 9a and Supplementary Data 6). Among upregulated genes were those associated with ILC2 effector function such as Il4, alarmin-induced activation of ILC2s such as Zeb2 and Arg137,38, transcription factors implicated in ILC2 responses such as Irf439 and Pou2f240, and downregulation of negative regulators of ILC2 activation such as Calca38,41 (Fig. 5b and Supplementary Data 6). To further establish the profile of ILC2s in region B, we measured the surface protein expression of molecules that were DEGs between SPF and GF mice in region B as well as other receptors relevant for ILC2 function42 that were expressed transcriptionally (Extended Data Fig. 9b–f). In line with our single-cell results (Fig. 5b), we found elevated cell surface protein expression of CD28 and the IL-33 receptor ST2 (Il1rl1) in region B of SPF mice when compared to other regions and, importantly, when compared to region B in GF mice (Fig. 5c and Extended Data Fig. 9d–f). Expanding the set of markers beyond those observed in our DEG analysis revealed that expression of IL17RB (IL-25 receptor) was selectively reduced on ILC2s in region B of SPF mice in a microbiota-dependent manner (Extended Data Fig. 9e,f). Interestingly, expression of CD25, which is downregulated on activated ILC2s43, was generally higher in all regions in SPF mice when compared to GF mice. However, expression in region B within SPF mice was still slightly reduced when compared to regions A, C, or D (Extended Data Fig. 9e,f). Lastly, expression of the IL-7 receptor CD127 was unchanged across regions (Extended Data Fig. 9e,f). The impact of the microbiota on ILC2 biology in region B was further supported by increased numbers of ILC2s capable of producing the canonical type 2 immunity cytokines IL-5 and IL-13 in SPF mice when compared to GF mice (Extended Data Fig. 9g,h). It must be noted, however, that a significant proportion of ILC2s in GF mice showed the capacity to produce both cytokines, pointing to the anticipatory function imprinted by the tissue on these cells, giving them the capacity to respond quickly to local tissue cues44. Interestingly, we did not observe an expansion of ILC2s in region B in SPF mice and even observed a slight increase in ILC2 numbers in this region in GF mice (Extended Data Fig. 9i), suggesting the impact of the microbiota on this compartment was likely limited to the function of these cells. Together, these results demonstrated axes of ILC2 biology that were (i) not regulated by the microbiota, (ii) were regulated by the microbiota independent of region, or (iii) that were regulated by the microbiota uniquely in space (e.g. middle colon).
ILC2 responses are regulated by tissue alarmin signals, such as cytokines IL-25 and IL-3345. Having observed changes in expression of both IL17RB and ST-2 on ILC2s in region B, we determined whether we could activate ILC2s in situ in GF mice by exposing explant colon tissue from region B to recombinant IL-33 and IL-25. ILC2s from treated tissue showed an increase in CD28 expression (Extended Data Fig. 9j) while elevated levels of the type 2 cytokines IL-5 and IL-13 were detected in supernatants harvested from treated tissue (Extended Data Fig. 9k). While characterizing the middle colon-adapted Retnlb/Ang4+ GCs above, we noted that marker genes of this subset, such as Ang4 and Pla2g4c, were previously implicated in epithelial responses to type 2 immunity19,20,23. We therefore tested whether elements of the adapted gene signature could be induced in situ in GF mice by treating explant colon tissue from region B with recombinant IL-4, IL-5, and IL-13, cytokines which we observed as significantly upregulated in region B ILC2s from SPF mice in our single-cell analysis (Fig. 5b) or increased in the proportion of ILC2s from region B producing them ex vivo (Extended Data Fig. 9h). Supporting a role for ILC2-derived cytokines to induce this gene program, we observed an upregulation of gene expression for the middle colon-associated genes Ang4, Itln1, Pla2g4c, and Pnliprp2 (Fig. 4c and Extended Data Fig. 5h) in treated tissue (Extended Data Fig. 9l). Collectively, these results implicated ILC2s as potential regulators of the spatial adaptation to the microbiota in the middle colon.
To formally test the role of ILC2s in regulating the adaptation, we leveraged the Nmur1iCre-eGFPROSA26LSL-DTR mouse model46 which allowed for inducible depletion of ILC2s (Methods). We observed a striking reduction in ANG4 protein by microscopy in the middle colon of ILC2-depleted mice when compared to control animals (Fig. 5d and Extended data Fig. 10a,b), suggesting that ILC2s may regulate the middle colon goblet cell adaptation in a spatially restricted manner. Importantly, we noted eosinophils were slightly expanded in the middle colon-associated region B (Extended Data Fig. 10c) and also had higher levels of SIGLEC-F expression (Extended Data Fig. 10d,e), which has been associated with active eosinophils47. Given that the abundance of eosinophils in tissues depends on ILC2s20 and that eosinophils are capable of regulating epithelial responses in the small intestine48,49, we interrogated their role in the middle colon adaptation. We depleted eosinophils over the course of two weeks (Methods); however, critically, we did not observe disruption of ANG4 spatial expression, pointing to a primary role for ILC2s in regulating this host adaptation, independent of bystander eosinophils (Extended Data Fig. 10f,g).
Given that ANG4 staining served only as a proxy for the middle colon adaptation and that different GC subsets could express Ang4 transcript (Extended Data Fig. 8h), we used Xenium to spatially resolve the impact of ILC2 depletion at the level of cell states. We noted significant downregulation of Ang4 transcript in the middle colon as well as other Retnlb/Ang4+ GC-associated genes (Fig. 4c) including Pla2g4c, Itln1, Pnliprp2, and Spta1 (Extended Data Fig. 10h). Strikingly, we observed a selective depletion of Retnlb/Ang4+ GCs in the middle colon of ILC2-depleted mice when compared to DT control treated animals (Fig. 5e and Extended Data Fig. 10i). Importantly, we did not observe an overall loss of GCs in this region (Fig. 5e, black bars) but instead an enrichment for alternative GC states such as Ccn3-hi GCs (Extended Data Fig. 10i), supporting these cells as potential precursors for the adapted GC state (Extended Data Fig. 8d,i). Finally, we also did not see a disruption in the middle colon-associated enterocyte and fibroblast subsets, suggesting the adaptation of these cells is not under the control of ILC2s (Extended Data Fig. 10i). Altogether, our results identified that ILC2s responded to the microbiota in a spatially restricted manner in the middle colon at steady state and demonstrated that this response was required for the structural cell adaptation in this region.
Discussion
In this study we set out to gain insights into gut physiology by defining the molecular and cellular underpinnings of regional landscapes along the intestine. We accomplished this by profiling the spatial landscape of the whole mouse intestine while leveraging scRNA-seq and regulators of homeostasis like the microbiota, circadian rhythm, inflammation, and the immune system. The nature of our dataset opens the door for future applications, and to demonstrate the physiological relevance and value of our dataset, we highlight one such application where we discovered a spatial adaptation to the microbiota characterized by immune-mediated regulation of structural cell adaptations in the middle colon. Interestingly, immune-structural cell crosstalk was constitutively required for the adaptation, suggesting that it is not imprinted into tissue epithelial memory50 and that the immune system is actively integrating cues induced by the microbiota in real time, continuously reprogramming the GC niche in the middle colon. The full extent to which GCs can transition between cell states is still poorly understood51, but our results suggest differentiated GCs may have more plasticity in the steady state than previously thought, with implications for disease states such as UC1,51 where GC dysregulation has been implicated.
Furthermore, we utilized a model of spatiotemporal acute inflammation to extract gene programs associated with different stages of inflammation and noted that the middle colon-adapted GC signature was not captured in inflamed and damaged tissue. This finding suggests that host adaptations in the steady state are distinct from those associated with inflammation and its resolution. Moreover, the resilience of this adaptation suggests that spatially-restricted host-microbiota interactions are recoverable, highlighting the importance of such interactions to host physiology. Whether chronic inflammation can perturb these tissue niches and predispose the host to disease development, as shown for tissue-regulated immune cell subsets52, remains to be determined.
Given that we show the host controls establishment of the intestinal transcriptional landscape (and to a large extent, intestinal niches), the pressure is on the microbes to adapt to the local environment53; in this way the host may shape the regional microbiome54 to suit its purposes. In the context of diseases where dysbiosis is often implicated, it is important to consider that dysbiosis might be a consequence of perturbations to these hard-wired niches that may subsequently result in local environmental alterations that favor changes in the balance of local microbial communities. However, there are regions where host/microbiota interactions may be more volatile even in the steady state and require continuous adaptation by the host, such as the response we identified in the middle colon. Future characterization of other such “hot spots’’ across the intestine (including the cecum, which we do not study here) under different conditions will be important, as maladaptation of these responses – for which we noted enriched expression of disease-associated genes in the middle colon – may also predispose the host to disease55.
Methods
Mice
Germ-Free (GF) mice on the C57BL/6Ntac background were originally purchased from Taconic Laboratories and bred and maintained at the Broad Institute of MIT and Harvard germ free facility. Specific-Pathogen-Free (SPF) were either purchased from Taconic Laboratories (57BL/6Ntac) for direct use in experiments or originally purchased from Jackson Laboratories (C57BL/6J) and maintained over several generations at Massachusetts General Hospital. Experiments involving these mice were conducted under protocol 0216-07-18 approved by the Institutional Animal Care and Use Committee (IACUC) at the Broad Institute of MIT and Harvard or under protocol 2003N000158 approved by the IACUC at Massachusetts General Hospital (MGH). Mice ranging in age from 3–18 wk old were used in this study across different experiments. Male mice were used for all experiments except one of three biological replicates for GF mice being female for the scRNA-seq data on colon. No Mice were maintained on a 12 hr - 12 hr dark-light cycle and provided food and water ad libitum and maintained at an ambient temperature between 18–24°C and 30–70% relative humidity.
For ILC2- and eosinophil-depletion experiments conducted at Weill Cornell Medicine (New York, NY), C57BL/6J (JAX:000664) and ROSA26LSL-DTR (ROSA26iDTR; JAX:007900) mice were purchased from Jackson Laboratory. To generate Nmur1iCre-eGFPROSA26LSL-DTR mice, ROSA26LSL-DTR strain was crossed to Nmur1iCre-eGFP mice as previously described20,46. The mice were maintained under specific pathogen-free conditions on a 12 hr - 12 hr dark-light cycle with an average ambient temperature of 21°C and an average humidity of 48%, and provided food and water ad libitum, following the guideline provided by the Institutional Animal Care and Use Committee at Weill Cornell Medicine (protocol 2014–0032).
Microbial colonization of germ free mice
4–5wk old male C57BL/6Ntac GF mice were colonized via a single gavage with content collected from 10–12-wk old male C57BL/6Ntac mice. Briefly, one fecal pellet (approximately 25mg of stool per mouse) was collected from 3 mice and placed directly in reduced PBS (0.05% cysteine) to protect anaerobic species. The sample was vortexed and centrifuged at 3000g to remove debris. 100uL of the resulting fecal slurry was gavaged into GF mice. For generation of Visium spatial data mice were sacrificed 4-wks after colonization. For generation of single-cell RNA-seq data mice were sacrificed 5-wks after colonization. Different donor mice were used for the two separate experiments and in each case mice were co-housed to limit microbiota driven cage effects.
Treatment with dextran sodium sulfate
8-wk old male C57BL/6J mice at MGH (protocol 2003N000158) were treated with 2.25% DSS (Affymetrix) in drinking water for 5 days at which time regular drinking water was introduced. Animals were then allowed to recover for varying amounts of time and were subsequently sacrificed at 12, 30, or 73 days from the onset of treatment. Intestinal tissue was then collected for swiss rolls and processed for spatial transcriptomics as described below.
ILC2 depletion
8-wk old male ROSA26LSL-DTR and Nmur1iCre-eGFPROSA26LSL-DTR mice were treated with 100 ng diphtheria toxin (Sigma) on day 0, 1, and 4 via intraperitoneal injection. The mice were euthanized on day 7 for tissue collection. ILC2-depletion efficiency was assessed with flow cytometric profiling of mesenteric lymph nodes (MLN) as described below.
Eosinophil depletion
8-wk old male C57BL/6J mice were purchased from Jackson Laboratory and were provided with bedding from in-house bred mice at Weill Cornell Medicine vivarium 5 days prior to eosinophil depletion. The mice were then treated with 300µg InVivoMAb rat IgG1 isotype control (clone HRPN; BioXCell) or InVivoMAb anti-mouse/human IL-5 (clone TRFK5; BioXCell) on days 0, 2, 4, 7, 10, and 13 via intraperitoneal injection. The mice were euthanized on day 14 for tissue collection. Eosinophil-depletion efficiency was assessed with flow cytometric profiling of mesenteric lymph nodes (MLN) as described below.
Generating swiss rolls for Visium, Xenium, and immunostaining
Mouse intestine was dissected and removed from mice as a single in-tact unit (maintaining in situ structure) from duodenum to anus and submerged in cold PBS on ice. For data generated during the light cycle mice were sacrificed between 11AM-2PM. For data generated during the dark cycle mice were sacrificed between 12AM-1AM. The intestine was then carefully unwound ensuring not to tear the tissue. Colon was cut at the neck of the cecum. Ileum was cut away from the cecum and separated from the rest of the small intestine by cutting 10 cm up from the distal ileum. Duodenum was measured and cut 5 cm from the end of the stomach. Jejunum pieces were then cut into equal halves from the remaining pieces to create J1 and J2 segments.
For the small intestine, content was carefully flushed out using a gavage needle and syringe filled with cold PBS. For colon, distal content was gently pushed out using forceps while proximal content was flushed as for the small intestine. The intestine pieces were then cut open longitudinally and laid flat with lumen side up and gently rolled onto a 1 cm diameter rubber tube in a spiral ensuring not to have any layers of tissue touching one another. The tissue was then carefully rolled off the tube and onto a thinly shaved toothpick edge with two circular pieces of plastic on either end to secure the tissue in place and while maintaining alignment of the tissue as it rolls. Finally, the circular plastic piece closest to the edge of the toothpick was gently removed and the tissue was gently pushed off the toothpick by applying force with forceps to the remaining circular piece of plastic into optimal cutting temperature (O.C.T) liquid (Sakura) in a 25 mm x 20 mm x 5 mm cryomold (VWR/Avantor) and flash frozen on an aluminum foil boat floating on liquid nitrogen in a styrofoam container.
Cryosectioning and tissue section mounting
Frozen tissue was sectioned on a Leica cryostat at 10-micron thickness for 10x Visium and immunostaining and at 7-micron thickness for 10x Xenium. Sections were first stained with a quick H&E kit (Abcam) to establish both the quality of the tissue and the cut to ensure as much of the intestinal architecture was preserved along the full length of the roll. Once determined, the subsequent cut was then used for spatial analysis via careful mounting directly onto 10x Visium or Xenium slides (10x Genomics) making sure to ensure the maximum amount of tissue was captured within the provided capture area. Small intestine tissue was separated into four pieces as described above allowing for mounting one complete mouse small intestine per 4 capture window 10x Visium slide. Colon samples were mounted only with other colon samples to allow for processing 4 mice per 10x Visium capture window. For 10x Xenium slides 3 colon samples were mounted per slide capture area. Visium and Xenium slides were then stored at −80C and processed at a later date. For tissue used for immunostaining, sections were mounted onto ProbeOn Plus slides (Fisher) and stored at −20 °C.
Spatial transcriptomics data generation
For Visium data, a tissue optimization experiment (10x Genomics, Visium Spatial Tissue Optimization, RevD) was performed on mouse colon swiss roll tissue using a confocal microscope (Nikon) to study signal quality so that transcript diffusion across the tissue was minimized and 10 minutes of tissue permeabilization time was chosen as the optimal condition for all subsequent samples. Visium slides were removed from −80 °C storage and processed following the standard Visium protocol. Briefly, tissue was fixed for 30 min in methanol at −20 °C and stained with hematoxylin (5 min) and eosin (1 min) and imaged on a Zeiss Axio microscope with a Metafer slide-scanning platform (metasystems) using a 10x objective. Samples were processed to generate cDNA which was then PCR amplified for 11–14 cycles using 10x protocol recommendations based on qPCR. For library preparation 8–12 indexing PCR cycles were used. Finally, libraries were sequenced on the NextSeq 550, NovaSeq SP or NovaSeq S1 Illumina platforms. 9–12-wk old male mice were used for Visium results covering SPF, GF, and circadian experiments.
For Xenium data, the Xenium workflow was conducted following the manufacturer’s protocol for fresh frozen tissue processing (GC000581 RevC, 10x Genomics). Briefly, the tissues were fixed with 4% paraformaldehyde for 30 min at room temperature, followed by permeabilization and probe hybridization with the 480-plex custom gene panel for 19 hours at 50°C. Following probe hybridization, the manufacturer’s instructions from the In Situ Gene Expression (GC000582 Rev E, 10x Genomics) and Xenium Analyzer (GC00584 Rev C) user guides were followed. The tissue slides were imaged on the Xenium Analyzer instrument where ROIs covering the full tissues were selected and processed with the fully automated and on-instrument analysis pipeline Xenium analyzer software v1.8.1.0. For Xenium data, mice were 12-wk old for SPF, 13-wk old for GF, and for ILC2 depletion experiments mice were 9-wks old on sacrifice.
Droplet-based single-cell RNA-seq on colon segments
10–13-wk old C57BL/6Ntac mice were used. Mouse colon tissue was dissected and straightened out onto a ruler. Four segments were cut for each colon to generate samples covering the proximal-to-distal axis of the colon (samples A, B, C, D). Segment A covering the proximal colon (C1) was generated by measuring 2 cm from the cecum. Segment D covering the distal colon (C3) was then generated by measuring 2 cm from the end of the colon. The remaining tissue was assigned as the middle colon (C2) and further segmented into two pieces B and C each accounting for ~1.5cm of tissue. To better discretize the regions C1, C2, and C3; 0.5cm of tissue was trimmed from the distal end of segment A, the proximal end of B, distal end of C, and proximal end of D. Each piece of tissue was then cut open longitudinally and content was washed away. Equally sized pieces of tissue were then generated from each segment utilizing a 3mm skin biopsy punch tool to generate 4 punches per segment which were then pooled to extract cells in the subsequent steps.
Tissue was processed via an experiment specific, customized protocol involving a series of digestion steps. The first focused on extracting high quality epithelial cells and the second on extracting and enriching for immune and stromal cells from the remaining tissue without the need for magnetic enrichment or cell sorting. First, tissue was subjected to mechanical disruption via stirring at 1,000rpm for 45 minutes at 37 °C using a small magnet and a magnetic stir plate in 5mL of RPMI 1640 media supplemented with 1% FBS and 2mM EDTA. Cells collected from this fraction constituted cells used to generate data on epithelial cells. Cells were washed with Advanced DMEM/F12 supplemented with 10% FBS. Cells were resuspended in 1 mL TripLE and incubated at 37 °C for 10 minutes. After 10 minutes, cells were mixed by pipetting up and down 50 times to disrupt crypts and clumping to help create a single-cell suspension. Cells were washed in Advanced DMEM/F12 supplemented with 10% FBS and held on ice for mixing with the following fraction of cells. As the epithelial fraction was being processed as stated above, the flask containing the remaining tissue was subjected to a second epithelial strip to limit epithelial contamination in the final step. This was done in 5mL of RPMI 1640 media supplemented with 1% FBS and 5mM EDTA at 37 °C for 50 min at 1,600rpm. Media and cells from this fraction were decanted and discarded. Tissue was then digested via stirring at 1,600rpm for 60 minutes at 37 °C in 5mL of RPMI 1640 media supplemented with 20% FBS and 0.5 mg/mL of Collagenase VIII (Sigma). These cells were then subjected to a 30% / 70% Percoll (Millipore Sigma) gradient to help deplete residual epithelial cells and enrich for immune and stromal cells by collecting the interphase post centrifugation. Cells from this fraction constituted the enriched immune and stromal cell fraction. Cells from the epithelial fraction and immune/stromal fraction were then counted separately and mixed at approximately a 1:1 ratio to help capture more rare cell types in the immune/stromal fraction. 25,000 cells per sample were loaded per single channel following the 10x Chromium Single 3’ Gene Expression protocol (10x Genomics). Libraries were pooled and sequenced on a NovaSeq 6000 S4 300 cycles (Illumina).
Immunostaining and imaging
Tissue was cryosectioned as described above and mounted onto ProbeOn Plus slides (Fisher) and stored at −20 °C. On the day of staining, tissue was taken from −20 °C and first fixed with 4% PFA for 30 minutes at −20 °C. Tissue was subsequently washed 3 times for 10 minutes each time in PBS. Tissue was then permeabilized by treatment with 0.1% Triton x 100 (Sigma-Aldrich) for 10 minutes at room temperature. Tissue was then washed 3 times for 10 minutes each time in PBS. Tissue was then blocked using Blocking one (Nacalai) for 45 minutes at room temperature. Tissue was again washed as before. Antibodies of interest were then applied to the tissue and stained overnight at 4 °C. The next morning tissue was washed 3×15min and a secondary antibody (Donkey anti-Rabbit IgG (H+L) Highly Cross-Adsorbed Secondary Antibody, Alexa Fluor™ 647, ThermoFisher) was applied for 1hr at RT. Tissue was again washed 3×15min and nuclei were stained with DAPI (Millipore Sigma) at 300mM for 5 min at RT. Tissue was washed 3×10min and finally VECTASHIELD mounting media (VectorLabs) was applied to seal the tissue with a coverslip and stored at 4 °C until imaging. Imaging was performed on a Nikon Ti-2 inverted microscope equipped with Zyla 4.2 sCMOS camera and CSU-W1 spinning disc at 10–20x objective. Primary antibodies used for staining included: rabbit anti-ANG4 (polyclonal, Cusabio; 1:800) and rabbit anti-SLC9A3 (polyclonal, Novus; 1:1000). Images were processed with ImageJ56 and image brightness/contrast settings were set and fixed within a given experiment as described in figure legends.
Isolating immune cells from tissue
Mouse colon tissue was dissected into four equal segments (A-D) as described for generation of single-cell data above. Each piece was then cut open longitudinally and content was washed away. Subsequently, each piece was divided into 3 smaller pieces, all of which were pooled for cell extraction. Tissue was then subjected to mechanical disruption via stirring at 1,100rpm for 1h at 37 °C using a small magnet and a magnetic stir plate in 7mL of complete RPMI-1640 medium with GlutaMAX Supplement and HEPES (Gibco) containing 1% FBS and 5mM EDTA (Invitrogen). Supernatant was discarded and tissue was then digested via stirring at 1,600rpm for 1 h at 37 °C in 7mL of complete RPMI-1640 medium with GlutaMAX Supplement and HEPES (Gibco) containing 20% FBS and 0.5mg/mL of Collagenase VIII (Sigma). Cells were passed through a 70 micron filter and subjected to a 45% Percoll (Millipore Sigma) centrifugation in a 10mL volume to help deplete residual epithelial cells and enrich for immune and stromal cells. Washed cells were either immediately prepared for flow cytometry surface marker staining or for ex-vivo stimulation for intracellular cytokine staining as described below.
Ex vivo stimulation of colonic ILC2s
8–12-wk old male C57BL/6Ntac mice were used. To detect intracellular IL-13 and IL-5, isolated cells were stimulated for 4h with the eBioscience Cell Stimulation Cocktail (500X) (ThermoFisher Scientific), with a final concentration of 81nM phorbol 12-myristate 13-acetate (PMA) and 6.7nM ionomycin. Stimulation was performed in the presence of the eBioscience Protein Transport Inhibitor Cocktail (500X) (ThermoFisher Scientific), with a final concentration of 10.6uM brefeldin A and 2uM monensin. Cell stimulation was performed in complete RPMI-1640 medium with GlutaMAX Supplement and HEPES (Gibco) containing 10% FBS. Cell stimulation was followed by pre-treatment with TruStain FcX (anti-mouse CD16/32) (Biolegend). Dead cells were excluded with Zombie UV™ Fixable Viability Kit (Biolegend), and then surface marker staining was performed as below on ice in FACS buffer. Intracellular cytokine staining was performed according to manufacturer’s instructions using a BD Cytofix/Cytoperm Fixation/Permeabilization Kit (BD Biosciences). Intracellular IL-13 and IL-5 was then detected by staining for IL-13 (eBio13A) and IL-5 (TRFK5). All antibodies listed above were purchased from Thermo Scientific. Stained cells were then analyzed on a 5-laser 40-color configuration Cytek Aurora System. The data were acquired using SpectroFlo software (v.3.0.3). Exported fcs data files were further analyzed using FlowJo software (v.10.10.0; BD Life Sciences).
Flow cytometry
8–12-wk old male mice (both C57BL/6Ntac mice and C57BL/6J) mice were used for immunophenotyping of colonic ILC2s and eosinophils, single-cell suspensions were pretreated with TruStain FcX (1:150) (anti-mouse CD16/32) (Biolegend) and then incubated on ice with conjugated antibodies in PBS or flow cytometry staining buffer (FACS buffer; 2% FBS in PBS). Dead cells were routinely excluded with Zombie UVTM Fixable Viability Kit (Biolegend). For colon samples, the following surface markers were used: CCR6 BV605 (29–2L17; 1:200), CD19 BUV737 (1D3; 1:400), CD25 BUV661 (PC61.5; 1:200), CD3ε PE-Cy5 (145–2C11; 1:300), CD45 BUV805 (30-F11; 1:400), CD90.2 BV570 (30-H12; 1:300), EpCAM BV711 (G8.8; 1:1000), KLRG1 BV421 (2F1/KLRG1; 1:200), MHC-II BUV563 (M5/114.15.12, 1:500), F4/80 APC (BM8; 1:200), SIGLEC-F PE-CF594 (E50–2440; 1:400), ST2 RY586 (U29–93; 1:100), IL17RB RB744 (6B7; 1:100), CD28 PE-Cy7 (37.51; 1:200) and CD127 BV785 (A7R34; 1:100). Cytokines were stained using IL-13 PE-Cy7 (eBio13A; 1:50) and IL-5 ef450 (TRFK5; 1:100) after fixation and permeabilization using a BD Cytofix/Cytoperm Fixation/Permeabilization Kit (BD Biosciences). All antibodies listed above were purchased from Thermo Scientific, Southern Biotech, BioLegend or BD Biosciences. Stained cells were then analyzed on a 5-laser 40-color configuration Cytek Aurora System. The data were acquired using SpectroFlo software (v.3.0.3). Exported fcs data files were further analyzed using FlowJo software (v.10.10.0; BD Life Sciences).
For ILC2 and eosinophil depletion analysis, single-cell suspensions of MLN samples were first stained with LIVE/DEAD Fixable Aqua Dead Cell Stain Kit (Thermo Scientific) in PBS, followed by treatment with TruStain FcX (1:150) (anti-mouse CD16/32) (Biolegend) and 5% normal mouse serum (Jackson ImmunoResearch) in FACS buffer containing 1% fatty acid free bovine serum albumin (Gold Biotechnology). The cells were then stained with following antibodies: CD45 BV785 (30-F11; 1:300), CD3ε PerCP-Cy5.5 (145-2C11; 1:200), CD5 PerCP-Cy5.5 (53-7.3; 1:200), CD11b APC-ef780 (M1/70; 1:200), CD11c APC-ef780 (N418; 1:200), B220 APC-ef780 (RA3-6B2; 1:200), F4/80 APC-ef780 (BM8; 1:200), FcεR1α APC-ef780 (MAR-1; 1:200), NK1.1 PerCP-Cy5.5 (PK136; 1:200), CD90.2 AF700 (30-H12; 1:300), CD127 BV421 (A7R34; 1:50), KLRG1 PE-ef610 (2F1; 1:300), and Siglec-F BV421 (E50-2440; 1:200). Cells were washed and treated with 2% PFA in PBS prior to analysis. Stained cells were then analyzed on a 5-laser, 18-colour custom configuration LSRFortessa (BD). The data were acquired using BD FACSDiva software (version 2019 09 17 11 11). Exported fcs data files were further analyzed using FlowJo software (v.10.9.0; BD Life Sciences).
Explants
Germ free colon tissue (~1cm) from region B was dissected as described above. Tissue was opened and cleared then cut into two equal halves vertically and incubated with 2ug/mL of recombinant IL-33 and IL-25 (Peprotech) or media alone (RPMI-1640, 1% glutamax, 10%FBS and 1% of 1:1 penicillin-streptomycin). Tissue was incubated for 12 hrs at 37 °C, 5% CO2, in 48 well plates with 300uL of media. Supernatant was collected for cytokine analysis and tissue cells were then isolated as above for flow cytometry to determine their activation markers (e.g. CD28 expression). For determination of tissue gene expression by qPCR, approximately 1cm of colon region B was dissected from germ-free mice in an identical manner as above. Resulting tissues were incubated with 1ug/mL of recombinant IL-4, IL-5 and IL-13 (Peprotech) or media control, for 6 hrs at 37 °C, 5% CO2, in 48 well plates with 300uL of media. Tissues were collected and stored in RNAlater for later transcriptional analysis using qPCR.
Cytokine bead arrays
For ex vivo quantification of cytokine secretion, media from explants of the colon in complete tissue culture media (RPMI-1640, 1% glutamax, 10%FBS and 1% of 1:1 penicillin-streptomycin) were collected and centrifuged at 8000g for 5 min. The resulting supernatants were used to determine the concentration of each cytokine secreted by cells into the media using a murine-specific cytokine bead array assay for mouse T-helper and inflammatory cytokines (Legendplex kit from BioLegend). Samples were analyzed using a CytoFlex LS (Beckman Coulter), and concentrations of each cytokine were derived utilizing a standard curve, according to the manufacturer’s recommendations.
Quantitative PCR
Colonic tissue (from a 1 cm tissue explant of section B of the middle colon cultured in complete tissue culture media) were harvested at 6 hours post stimulation and stored in RNAlater, at −80 °C before further analysis. The cells were next thawed and 600uL of a tissue lysis buffer specific for RNA extraction (Qiagen) was added. Samples were then transferred to sterile snap-cap tubes filled with 1g of zirconium beads and placed on a TissueLyser for cell disruption. RNA was then harvested using a tissue RNA extraction kit (Qiagen), with on-column DNase treatment, following manufacturer’s instructions. RNA was eluted in 50uL of ultrapure, nuclease free water. Synthesis of cDNA was performed using the iScript cDNA synthesis kit (BioRad) following the manufacturer instructions. Quantitative PCR was performed using the iTaq Universal SYBR green Supermix (Biorad), with 40 cycles of 95 °C for 20 sec and 60C for 1 min. The following primers were utilized all listed 5’ to 3’ and organized by gene; Ang4-F (CTCTGGCTCAGAATGTAAGGTACGA), Ang4-R (GAAATCTTTAAAGGCTCGGTACCC), Itln1-F (ACCGCACCTTCACTGGCTTC), Itln1-R (CCAACACTTTCCTTCTCCGTATTTC), Pla2g4c-F (GGACCGTTGCGTTTTTGTGA), Pla2g4c-R (GCAAAACCAGCATCCACCAG), Pnliprp2-F (GCTCTGTACGGATGTAACGGA), Pnliprp2-R (TTCATGCACAGTGTTGCTGC), Gapdh-F (CCTCGTCCCGTAGACAAAATG) and Gapdh-R (TCTCCACTTTGCCACTGCAA). Primers were selected from the literature19,57–59. The gene Gapdh was used as a reference and results were quantitated using the 2−ΔΔCt method.
Analysis
Spatial transcriptomics data processing
Raw Visium datasets were processed using the Spaceranger workflow (version 1.2.1) on Terra (https://terra.bio/) with manual spot selection given the complex artificial spatial architecture created by using swiss rolls and subsequently analyzed following the standard Seurat60 (version 4.3; default parameters if not specified) protocol (https://satijalab.org/seurat/articles/spatial_vignette.html) using R (version 4.2.3). Briefly, the counts in each roll were normalized using “SCTtransform” and merged. Principal component analysis (PCA) was performed on merged rolls using the variable features selected from each roll. Unsupervised clustering was performed on the 20-nearest-neighbor graph build with the top 30 principal components (cluster resolution 0.01 to 6). Differentially expressed genes (DEGs) for each cluster were identified using the “FindAllMarker” function on normalized and log transformed counts. Clusters of spots covering spatially artificial regions of tissue such as the tip of one villous in contact with the muscle layer of the next loop outwards were identified and removed using mixed expression signatures and the spatial location of such clusters. Low quality Visium spots were removed using the following additional criteria: (1) percentage of mitochondrial genes > 15%; (2) UMI counts > 75,000; (3) gene counts < 100. PCA and clustering were then re-run on the filtered object. DEGs for each cluster, tissue section (higher expression compared to the remaining SI or colon segments, respectively) or between conditions were run with the “FindMarker” function on normalized and log transformed counts (logfc.threshold = 0.1). The full list of DEGs can be found at the gitlab repository hosting the code (https://gitlab.com/xavier-lab-computation/public/molecular-cartography-mouse-gut/table_outputs/marker_genes). Gene ontology (GO) enrichment analyses were performed on the top 500 DE genes (ranked by p-values) with enrichR (version 3.2; “GO_Biological_Process_2023” and “GO_Molecular_Function_2023” databases)61. DSS treated samples were analyzed following the same protocol. Patches and immune follicles were removed from all rolls except DSS study where patch formation is part of the biology. Statistical analysis was performed using two-sided tests and the Benjamini & Hochberg method was used to adjust for multiple comparisons. The transcription factor binding motifs for Tmprss2 were extracted using the RcisTarget package (version 1.18.2)62.
A Xenium gene panel was designed using marker genes selected by a random forest classifier (N=153) and a set of curated genes (N=327) based on biological themes of interest (Supplementary Data 7). To train the random forest classifier, we started from a set of markers for each annotated cell type using the “FindMarker” function (test.use = “roc”) and re-trained a random forest classifier using all the selected markers as well as the major lineage assignment (enterocytes, goblet cells, enteroendocrine cells, T/ILC cells, fibroblast cells Tuft cells, mural/endothelial cells, myeloid cells, B cells; training data downsampled to maximum 1000 cells per cell type) using the “ranger” R package (version 0.15.1; mtry = 30, num.trees = 2000, importance = “impurity_corrected”). Top 200 marker genes were selected by the rank of feature importance and redundant features (Spearman correlation > 0.7) were removed. We used a 30-nearest-neighbor (30-NN) classifier with respect to the single-cell data (normalized and log transformed counts; downsampled to maximum 3000 cells for each lineage after removing cells with no greater than 30 genes) to assign cell type to each segmented Xenium cell. The raw Xenium expression data was normalized and log transformed (normalized expression trimmed to 0 for genes with raw expression value = 1 to remove potential noise). Normalized Xenium and single-cell expression values were Z-score transformed. Cell type for each Xenium cell was assigned with the cell type of 30-NNs in the single-cell data by majority vote. The low quality (number of transcripts ≤30 or number of genes ≤10) or ambiguously classified (majority votes ≤30%) Xenium cells were removed from the downstream analysis.
Computational unrolling and alignment
A continuous green line following the serosa layer was drawn on the low resolution tissue image. The image was loaded into the Seurat object with the “Read10X_Image” function and the pixels corresponding to the green line were extracted via their RGB channels (R<70%, G>70%, B<70%). A nearest neighbor graph was created with the extracted pixels and the path between the furthest two pixels (from the edge of the image to the center of the image) were used as the distal-proximal axis (X-axis) for unrolling. All the Visium spot coordinates were then projected onto the X-axis by looking for the nearest pixel on X-axis (pixels further to the center of the image than the spot of interest were not considered to force the projection towards the center). The projected distance to the X-axis was used as the serosa-epithelial axis value (Y-axis). X-axis values of different tissue segments from the same mouse were concatenated into a single coordinate system. The X coordinates from different mice were then aligned to the X coordinates of a SPF mouse based on the expression of 146 genes highly correlated with the X coordinates (Spearman correlation > 0.5 or < −0.5 in at least 6 mouse, calculated based on each tissue segment) using dynamic time warping (“dtw” function in the “dtw” R package, version 1.23, step.pattern=asymmetric). To identify potential subclusters on the X axis in each tissue section, we performed PCA using the genes correlated with the X coordinates above and found breakpoints of PC1 along the X axis using the “strucchange” R package (version 1.5–3; h=0.3), identifying three subsections for ileum and colon and two for the other regions. The DSS treated samples were unrolled with the same method and aligned to the control (Sham), where we performed the sub-sectioning analysis. To unroll the Xenium data, we created an image for each sample where each cell was plotted with the muscle layer highlighted to facilitate line tracing. A frame was plotted on the image (blue vertical lines marking coordinates x=0 and x=8000, red horizontal lines marking coordinates y=0 and y=8000) for mapping the image pixels back to the original coordinate system. The image was then processed for unrolling the same way as above.
Single cell transcriptomics data processing
Single cell datasets were processed on Terra using Cellranger (version 7.0.0) followed by background noise removal using CellBender (version 0.2.0)63 and analyzed using the Seurat package in R. Cells with percentage of mitochondrial genes > 30% or gene counts < 100 were removed. Raw counts were normalized and log transformed and principal component analysis (PCA) were performed on the top 2000 variable genes. Doublets were marked and removed using DoubletFinder (commit 4c470a6; pN = 0.25, pK = 0.09, nExp = 0.08×number of cells, PCs = 1:10). Filtered datasets were integrated using reciprocal PCA with the top 30 principal components (PCs). Graph-based clustering, and non-linear dimension reduction (UMAP) were then performed on the integrated data (top 30 PCs). Clusters (res=0.1) were annotated for major cell lineages including enterocytes, goblet cells, enteroendocrine cells, tuft cells, T cells and innate lymphoid cells, B cells, myeloid cells and granulocytes, fibroblast/mural and endothelial cells based on known markers such as Muc2 for GCs, Cd3e for T cells, and Igha for IgA B cells. Sub-clustering was performed (res=0.4 for enterocytes, res=0.8 for goblet cells, res=1 for enteroendocrine cells, res=0.5 for tuft cells, res=2 for T cells and innate lymphoid cells, res=0.5 for B cells, res=0.5 for myeloid cells and granulocytes, res=0.4 for fibroblasts, and res0.5 for mural and endothelial cells) for individually subsetted lineages followed by marker gene analysis using the “FindAllMarker” function on normalized and log transformed counts (test.use=”MAST”, min.diff.pct=0.1, max.cells.per.ident=1000). Clusters were manually annotated either based on known marker genes such as Il17a for Th17 cells or based on their unique expression relative to other cells in the same lineage such as was done for mature enterocytes I, II, III, and IV within the enterocyte lineage. Clusters showing mixed lineage gene signatures (a technical artifact of droplet based methods) such as expression of Igha and Muc2 in a goblet cell subset were removed. DEGs for each annotated cell type were identified relative to all 99 annotated cell and again separately within the relevant lineage subclustering using the “FindAllMarker’’ function on normalized and log transformed counts (test.use=”MAST”, min.diff.pct=0.1, max.cells.per.ident=1000). RNA velocity analysis on GCs was performed on cells from regions A and B using scvelo (version 0.2.5; min_shared_counts=20, n_top_genes=2000, n_pcs=30, n_neighbors=10)64. Annotated single-cell datasets for SPF animals were used to deconvolute one SPF colon Visium slide with Cell2location (version 0.1.3)65,66. Effect size (η2) of spatial association of each cell type was estimated by fitting a linear model of log transformation abundance of the cell type with coordinates of X and Y axes as covariates. To construct a cell type co-enrichment network using the deconvoluted data, we consider a cell type is present in a Visium spot if its abundance is greater than one standard deviation compared to its mean abundance across the Visium slide. Jaccard similarity score was then calculated for each pair of cell types and pairs with low Jaccard similarity (<0.3) were filtered for visualizing the co-enrichment network. Statistical analysis was performed using two-sided tests and the Benjamini & Hochberg method was used to adjust for multiple comparisons.
Extended Data
Extended Data Fig. 1. Experiential and computational construction of the transcriptional landscape of the intestine.

a, Hematoxylin and eosin (H&E) stain image of the partitioned intestine. b, Boxplots showing the number of genes detected in each spot on each Visium slide (the center line is the median; box limits are the upper and lower quartiles; and whiskers show 1.5 times the interquartile range from the box). The line on the secondary Y-axis shows the number of spots with tissue on each Visium slide. (For intestinal regions, data is shown for n=3 SPF and GF mice and n=2 FMT mice. For DSS and light/dark cycle, data from n=1 SPF or GF mouse is shown). c, Schematic of experimental design (created with R, Adobe Illustrator and BioRender.com). d, Expression of Epcam (left) and Tagln (right) in each Visium spot on the unrolled and aligned axes. e, Clusters of Visium spots (Louvain algorithm with clustering resolution =0.5) shown on the original Visium slide (top) and the unrolled and aligned axes (bottom). f, Cluster annotation of spots along the serosa-epithelium axis (left). Dot plot (right) of marker genes for each annotated cluster (top 20 genes in each cluster ranked by Wilcoxon rank sum test p-values; all of them have adjusted p-value<0.05; expressed in >50% within the cluster and <30% in other clusters). g, Module score for each cell type (Methods) in different tissue layers.
Extended Data Fig. 2. Biological circuit maps.

a, Top 10 Gene Ontology (GO) terms (left, Biological Processes; right, Molecular Functions) enriched for marker genes of each tissue (top 100 marker genes ranked by Wilcoxon test p-value; all have adjusted p-value<0.05; enriched GOs are significant with adjusted p-value<0.05 by Fisher’s exact test). b, Spatial heatmap showing the expression (Z-score) of the upregulated SLC transporter genes in Fig. 1c. The heatmap columns are arranged based on the coordinates of the unrolled axes aligned across three replicates. The network to the right connects the SLC transporters with their known ligands. c, Dot plot showing the expression of regionally variable curated GPCRs (upregulated in at least one section of SI or colon). d, Dot plots showing the expression of disease risk-associated nuclear receptors. e, Dot plot showing the expression of all fine mapped IBD risk genes irrespective of regional enrichment. f, Dot plot showing the expression of regionally variable (upregulated in at least one section of SI or colon) monogenic IBD genes with average expression >0.6 (normalized and log transformed).
Extended Data Fig. 3. Biological circuit maps and distal region shared gene expression.

a-b, Dot plots showing the expression of disease risk-associated genes: (a) transcription factors (b) along the intestine. Only regionally variable genes and with average expression >0.6 (normalized and log transformed) in at least one segment of SI or colon were shown. c, Expression of regionally variable transcription factors (expressed in >30% in any one region but <5% in any other regions) along the unrolled axis (n=3 biological replicates). Heatmaps on the left summarize the average scaled expression of genes along the serosa-to-epithelium axis (only spots with scaled expression >0.5 considered). d, Expression of solute carrier family transporters along the intestinal length. e, Scaled expression of Onecut2, Hoxb13, Tmprss2 along the intestine of SPF mice (n=3). Lines depict the locally weighted scatterplot smoothing curves.
Extended Data Fig. 4. The steady state intestinal spatial landscape is robust.

a, Average log FC of gene expression comparing SPF and GF animals (absolute value >0.1). Genes that are prevalent in SPF (top, expressed in >20% of the SPF but <20% of GF Visium spots) or GF (bottom, expressed in >20% of the GF but <20% of SPF Visium spots) were highlighted in color. b, Prevalence (% expressed per Visium spot) of genes in each region. Highlighted genes with high log2FC in expression between SPF and GF mice (absolute average log2 FC >1). c, Dot plot of expression of select genes by region and condition. de, Expression of Mbl2 (d) and S100g (e) along the intestine of SPF, GF and FMT mice. Biological replicates are shown for each condition (SPF and GF, n=3; FMT n=2). f, Examples of genes that exhibit expression gradients along the unified X axis in the SI (Guca2a, top) and colon (Hmgcs2, bottom). g, Scatter plots showing the concordance (Pearson correlation, r) of spatial association (the Spearman correlation between the proximal-distal axis and gene expression) across biological replicates (n=3 SPF, n=3 GF, n=2 FMT). Points show the spatial association of an expressed gene and lines represent the fitted linear regression curve. Examples shown in panel f are highlighted in the corresponding panels (circle - Guca2a; triangle - Hmgcs2) h, Expression of the circadian clock associated genes Nr1d1 and Per2 in the colon of SPF and GF mice measured during the light or dark cycle (n=1 per condition). i, Scatter plots showing concordance of spatial association between animals studied during the light or dark cycle (n=1 for each cycle).
Extended Data Fig. 5. Identification and characterization of spatial niches in the small and large intestine.

a-c, Clustering of SI Visium data (resolution=0.2). (a) UMAPs showing the clustering. (b) Boxplots showing the fraction of each cluster. Box limits are the upper and lower quartiles; and whiskers are 1.5 times the interquartile range from the box (3 biological replicates per box). (c) Expression of marker genes for each cluster. d-e, Clustering of colon Visium data (resolution=0.8). (d) UMAPs showing the clustering. (e) Expression of marker genes for each cluster. f, Spatial distribution of each cluster on one example of SPF colon. g, Top 10 Gene Ontology (GO) terms (Biological Processes) enriched for marker genes of each colon section (top 500 maker genes ranked by Wilcoxon test p-value; all of them have adjusted p-value<0.05; enriched GOs are significant with adjusted p-value<0.05 by Fisher’s exact test). h, Spatial expression of C2 enriched, microbiota induced genes Ang4, Retnlb, Itln1, and Pnliprp2 on SPF colon tissue from 3 mice (top down).
Extended Data Fig. 6. Spatial characterization of DSS-induced inflammation over time.

a, Schematic of experimental design (n=1 at each time point, (created with BioRender.com)). b, Recovery of DSSdisrupted gene expression across time. Genes that are differentially expressed (absolute log2 FC >1) in the D12 DSS-treated mouse are shown. c, Top 10 Gene Ontology (GO) terms (Biological Processes) enriched for upregulated genes in each colon section of the D12 mouse compared to the sham (top 500 maker genes ranked by Wilcoxon test p-value; all have adjusted p-value<0.05; enriched GOs are significant with adjusted p-value<0.05 by Fisher’s exact test). d, Marker genes for each cluster shown in Fig. 3b (resolution = 0.3) obtained from colon samples across all time points. e, Expression of example marker genes for the epithelial cluster (cluster 8) (Clca4b and Ido1) and the mucosal cluster (cluster 10) (Il1b and Il11) in colon samples across all time points. White boxes indicate regions with residual expression at later time points. f, Volcano plot of DEGs comparing Ido1-positive spots (log transformed expression >2; Wilcoxon test) and Ido1-negative spots in cluster 8. g, Proximal (top), middle (middle), and distal colon (bottom) specific gene module scores plotted on swiss rolls at different stages of recovery.
Extended Data Fig. 7. Single-cell characterization of the proximal, middle, and distal regions of the colon in SPF, GF, and FMT mice.
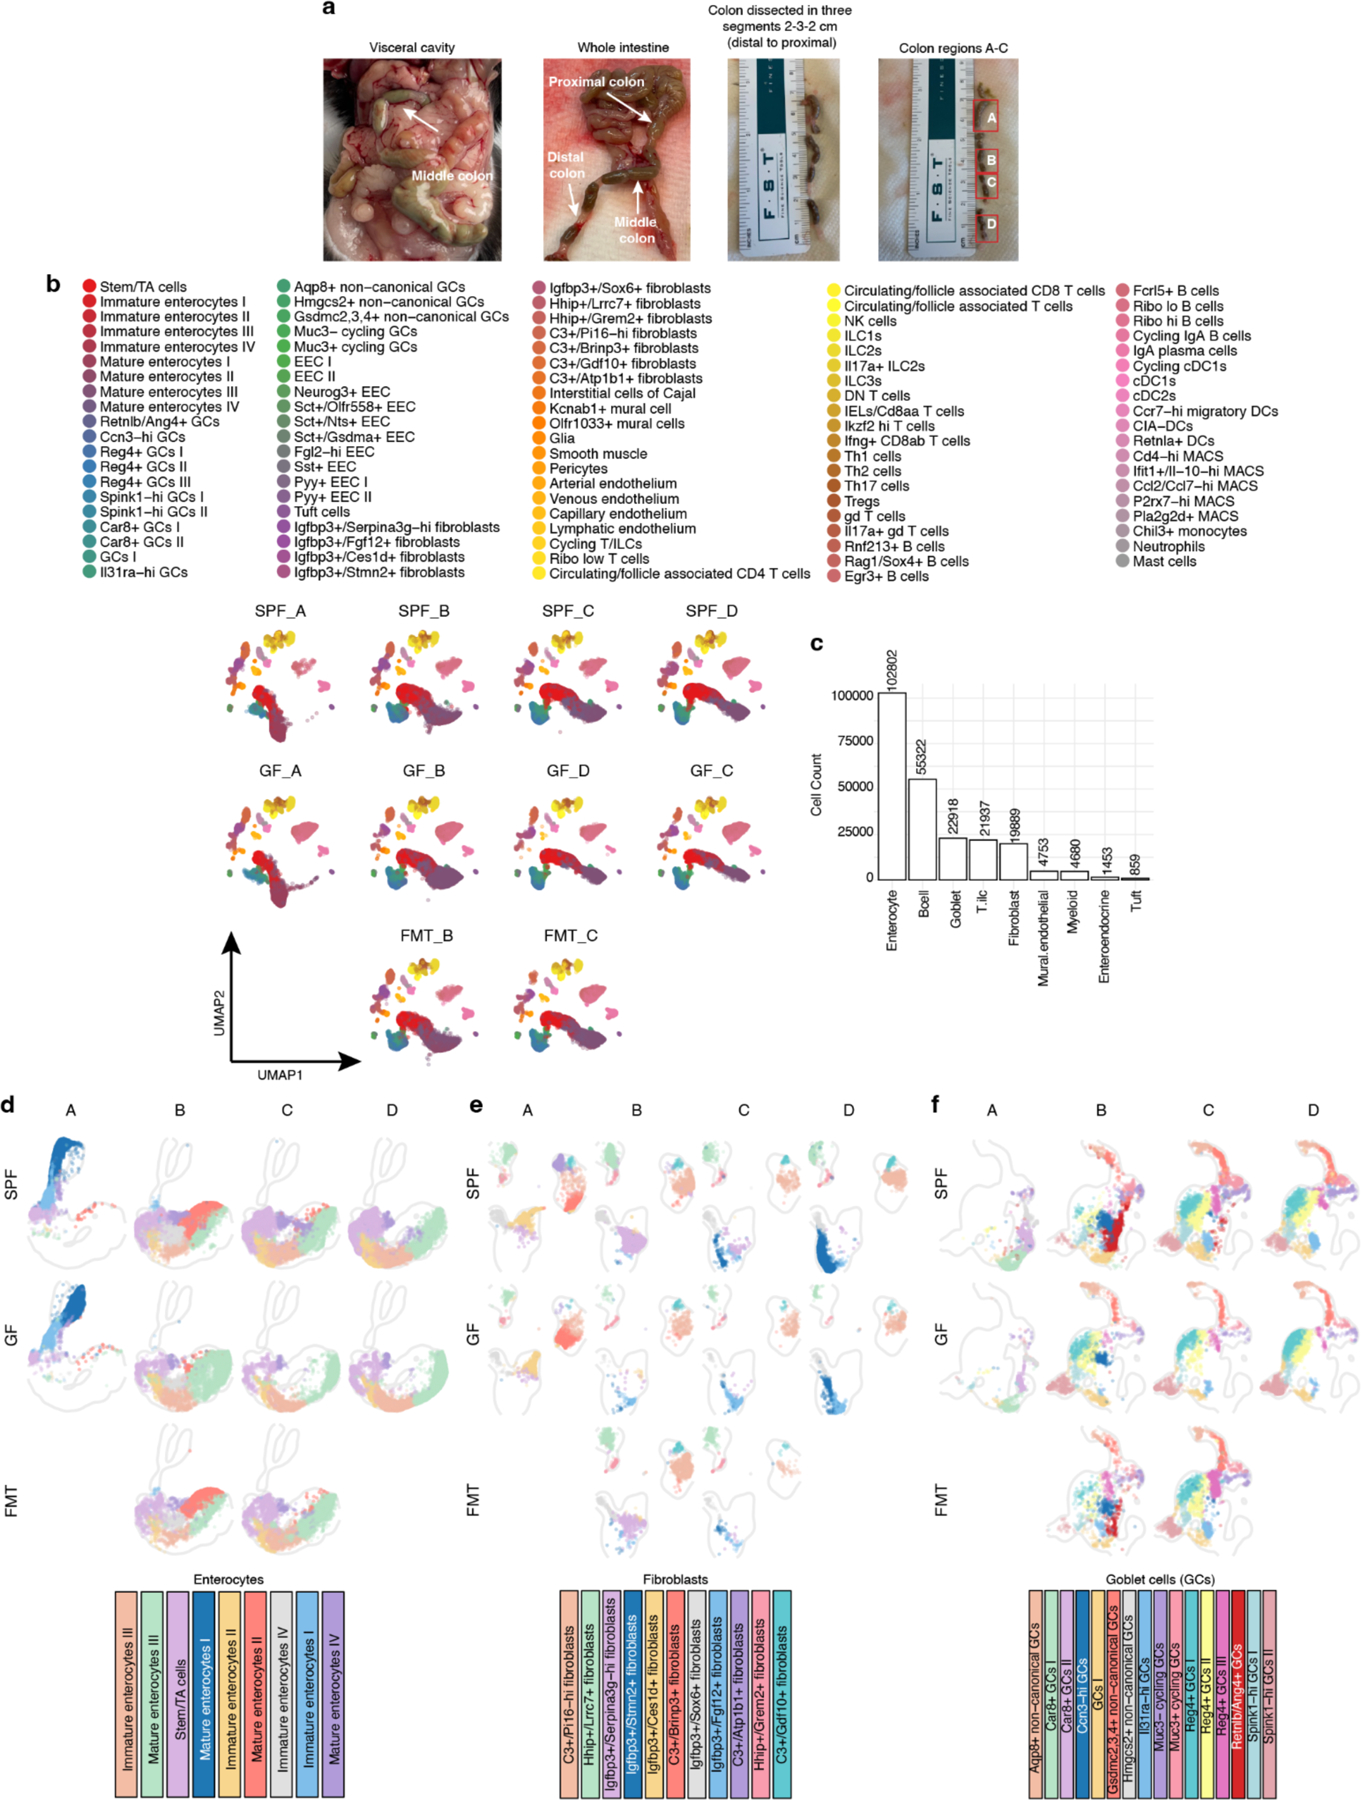
a, Schematic of the different regions of the colon showing anatomical location of the middle colon in the visceral cavity (left) and the delineation of the proximal, middle, and distal colon (middle). Regions A to D as they were partitioned for scRNA-seq are then shown (right). b, UMAP of single-cell transcriptomics showing 99 annotated cell subsets. b, Number of cells of each major cell lineage captured by the single-cell dataset. c-e, UMAPs of enterocyte (c), fibroblast (d) and goblet cell (e) lineages.
Extended Data Fig. 8. Single-cell coupled with spatial transcriptomics reveals spatially restricted structural cell subsets and spatially restricted adaptations to the microbiota.

a, Estimated abundance (Cell2location on Visium samples from 3 biological replicates; cells with abundance lower than 0.5 or one standard deviation from the mean for each cell type are removed) of spatially variable structural cell subsets (the center line is the median; box limits are the upper and lower quartiles; and whiskers are 1.5 times the interquartile range). b, Distribution of spatially variable structural cell subsets mapped onto space for colon tissue (Xenium). c-d, Spatial heatmaps showing the counts of cell types (Z-score) assigned to the Xenium sample of SPF mouse colon. The heatmap columns are arranged based on the coordinates of the unrolled proximal-distal axis from left to right (c; summarized into 1000 bins) and projected serosa-mucosa axis (b; summarized into 50 bins). e, Expression of marker genes for enterocytes. f, Antibody staining of SLC9A3 protein (magenta) on colon tissue. Image is representative of n=3 biological replicates. g, Expression of marker genes for fibroblasts. h, Expression of marker genes for goblet cells. Nuclei are stained with DAPI (blue). i, UMAP of RNA velocity analysis of goblet cell subtypes.
Extended Data Fig. 9. ILC2s are uniquely activated by the microbiota in the middle colon.

a, Number of DEGs between SPF and GF mice in immune cell populations from the single-cell data (stars mark the section without comparison due to low number of cells, N<30). b, Expression of genes from single-cell RNA-seq data of ILC2s from different regions of colon (A-D; proximal-distal). Data summarize pooling of SPF, GF, and FMT treated mice. c, Representative flow cytometric gating strategy for ILC2s and eosinophils isolated from mouse colon. This gating strategy was used for summary data presented in f, h, i, and j and Extended Data Fig.10c,e. Gating shown is from n=1 SPF mouse region B. d, Representative histograms showing expression of CD28 on the surface of ILC2s gated as in c for SPF (purple) and GF (black) mice from colon region B. e, Representative histograms for the expression of surface markers ST2, IL17RB, CD25, and CD127 from left to right on ILC2s from colon region B. f, Data summarizing the median fluorescence intensity (MFI) for surface markers in e on ILC2s from regions A to D in SPF (purple) and GF (black) mice. n=9 mice from 3 independent experiments for SPF and n=6 mice from 2 independent experiments for GF for ST2 and IL17RB. n=15 mice from 5 independent experiments for SPF and n=9 mice from 3 independent experiments for GF for CD25. n=12 mice from 4 independent experiments for SPF and n=9 mice from 3 independent experiments for GF for CD127. Box limits are the upper and lower quartiles with the middle line representing the median; and whiskers are 1.5 times the interquartile range from the box. g, Representative flow cytometric gating for IL-5 and IL-13 on ILC2s from colon region B gated as shown in b. Box limits are the upper and lower quartiles with the middle line representing the median; and whiskers are 1.5 times the interquartile range from the box. h, Data summarizing the frequency of ILC2s from colon regions A to D expressing IL-5, IL-13, or both from left to right in SPF (purple) and GF (black) mice. n=6 mice per group summarized from 2 independent experiments. i, Data summarizing the number of ILC2s recovered from colon regions A-D gated as in c in SPF (purple) and GF (black) mice. n=22 mice from 7 independent experiments for SPF and n=9 mice from 3 independent experiments for GF. j, Data summarizing MFI of CD28 on ILC2s isolated from GF colon region B following explant treatment with recombinant IL-33 and IL-25 (purple) or media control (black) for 12hrs. Data summarizing n=6 mice from 2 independent experiments. Box limits are the upper and lower quartiles with the middle line representing the median; and whiskers are 1.5 times the interquartile range from the box. k, Data summarizing the amount of IL-5 and IL-13 detected in pg/mL in supernatants from explants of colon tissue from GF colon region B treated with IL-33 and IL-25 as in j. Data summarizing n=6 mice from 2 independent experiments. Box limits are the upper and lower quartiles with the middle line representing the median; and whiskers are 1.5 times the interquartile range from the box. i, Data summarizing expression of selected middle colon genes by quantitative PCR from explants of GF colon region B treated with IL-4/5/13 for 6 hrs. Gene expression relative to the housekeeping gene Gapdh. n=4 mice representative of 2 independent experiments. Box limits are the upper and lower quartiles with the middle line representing the median; and whiskers are 1.5 times the interquartile range from the box.
Extended Data Fig. 10. ILC2s are required for the goblet cell adaptation to the microbiota in the middle colon in the steady state.

a, Representative flow cytometric gating strategy for total ILC2s isolated from mouse MLN. b, Experimental schematic (created with BioRender.com) for ILC2 depletion (left) and gating strategy and summary (right) of ILC2s from MLNs in control and Cre+ mice. n=4 mice per group and summarize 2 independent experiments. Unpaired two-sided t-test. Data are presented as the mean +− s.e.m. c, Data summarizing the number of eosinophils recovered from colon regions A-D gated as in Extended Data Fig. 9c for SPF (purple) and GF (black) mice. n=22 mice from 7 independent experiments for SPF and n=9 mice from 3 independent experiments for GF. Box limits are the upper and lower quartiles with the middle line representing the median; and whiskers are 1.5 times the interquartile range from the box. d, Representative histograms showing expression of SIGLEC-F on the surface of eosinophils gated as in Extended Data Fig. 9c for SPF (purple) and GF (black) mice from colon region B. e, Data summarizing MFI of SIGLEC-F on eosinophils recovered from GF colon regions A-D gated as in c in SPF (purple) and GF (black) mice. n=21 mice from 7 independent experiments for SPF and n=9 mice from 3 independent experiments for GF. Box limits are the upper and lower quartiles with the middle line representing the median; and whiskers are 1.5 times the interquartile range from the box. f, Experimental schematic (created with BioRender.com) for eosinophil depletion via anti-IL-5 administration (top) and gating strategy and summary (bottom) of eosinophils from MLNs in isotype and anti-IL-5-treated WT SPF mice. n=4 mice per group; data summarize 2 independent experiments. Unpaired two-sided t-test. Data are presented as the mean +− s.e.m. g, Antibody staining of ANG4 protein (green; Minimum display value = 10 and maximum display value = 30) on colon tissue from isotype and anti-IL-5 treated SPF mice showing enrichment in the C2 region in all conditions. Nuclei are stained with DAPI (gray; Minimum display value = 0 and maximum display value = 150). n=2 mice per group and images representative of 2 independent experiments. h, Expression of example middle colon genes in Xenium colon samples (n=2 mice for each condition). i, Difference in cell counts assigned to the Xenium colon samples between DT treated ROSA26LSL-DTR and Nmur1iCre-eGFPROSA26LSL-DTR mice (t statistic with pooled variance). Colon samples were binned into four bins following the way single-cell data were generated along the unrolled X axis. Boxplots display first and third quartiles.
Supplementary Material
Acknowledgments
We would like to thank the mouse facilities at both the Broad Institute and in particular Allan Discua and Carlos Umana at the Broad Institute GF mouse facility for their contributions to maintaining the mice used in this study as well as facilitating and assisting with GF experiments. We would also like to thank the Genomics Platform at the Broad Institute for their contributions to library generation and sequencing of our spatial and single-cell transcriptomics datasets. We thank Amanda Bumber for her assistance in FMT related experiments. We would also like to thank Elizabeth Creasey and Yanhua Zhao for their lab managerial work that helps ensure experimental success. We thank Kathryn Devaney for her contributions to maintaining and updating mouse protocols to ensure smooth experiential execution. We thank Toshimi Yoshida for her assistance in cell counting on short notice on the day of the single-cell experiment. We thank Orr Ashenberg, Caroline Uhler, and Mehrtash Babadi for helpful discussions and suggestions on analysis. We thank Masahiro Kanai for his assistance with curating disease associated risk genes and in particular fine-mapped IBD risk genes. We thank Motohiko Kadoki for curating a list of GPCRs. We thank Toni Delorey for coordinating acquisition of the Xenium panel. We thank Sam Zimmerman for assistance with compiling Xenium data. We thank Crystal Lin for help with processing samples through the Xenium workflow. We thank Martin Stražar and Jacques Deguine for critically reviewing the manuscript. We thank Heather Kang for her editorial assistance in figure compilation and text editing/formatting. We would also like to thank Caroline Uhler, Marco Colonna and Bana Jabri for their valuable insights and feedback on our manuscript. Lastly, a special thank you to Chirag Krishna for valuable input, advice, and general excitement towards the project throughout the journey. Work done at the Broad Institute and MGH was supported by the National Institutes of Health (RC2 DK135492 and P30 DK043351 to R.J.X.), the Helmsley Charitable Trust, and the Klarman Cell Observatory. Work done at Weill Cornell Medicine (New York, NY) was supported by the Crohn’s and Colitis Foundation Research Fellowship Award (Award #937437 to H.Y.), CURE for IBD, the Jill Roberts Institute for Research in IBD, Kenneth Rainin Foundation, the Sanders Family Foundation, Rosanne H. Silbermann Foundation, Linda and Glenn Greenberg, the Allen Discovery Center Program, a Paul G. Allen Frontiers Group advised program of the Paul G. Allen Family Foundation (all to D.A.), and the National Institutes of Health (DK126871, AI151599, AI095466, AI095608, AR070116, AI172027, DK132244 to D.A. and K99AI180354 to H.Y.).
Footnotes
Code availability
Code and processed data for reproducing the analysis can be accessed via GitLab (https://gitlab.com/xavier-lab-computation/public/molecular-cartography-mouse-gut). A snapshot of the code at the time of submission is available through Zenodo (doi:10.5281/zenodo.8383894).
Competing interests
R.J.X. is a co-founder of Jnana Therapeutics, board director at MoonLake Immunotherapeutics, a consultant to Nestlé, and serves on the advisory board of Magnet Biomedicine; these organizations had no role in the study.
Data availability
All raw sequencing data was deposited into GEO under accession number GSE245316. Single-cell RNA-seq and Visium datasets are available through the Broad Institute Single Cell Portal under accession numbers SCP2760 (RNA-seq), SCP2762 (Visium, microbiome experiment) and SCP2771 (Visium, DSS experiment).
Mouse transcription factor genes were retrieved from AnimalTFDB 3.0 (http://guolab.wchscu.cn/AnimalTFDB#!/)67. IBD and celiac diseases associated genes were retrieved from Ontology Lookup Service (https://www.ebi.ac.uk/ols/index; accession number EFO_0003767 (IBD) and EFO_0001060 (celiac diseases))68. The list of nuclear receptors was retrieved from the IUPHAR/BPS Guide to Pharmacology website (https://www.guidetopharmacology.org/GRAC/NHRListForward). The fine-mapped IBD risk genes were curated from literature69–73. The celiac disease68 and diverticular disease74 genes were retrieved from recently published work. These lists can be found in GitLab (https://gitlab.com/xavier-lab-computation/public/molecular-cartography-mouse-gut/-/tree/main/visium/data).
References
- 1.Parikh K et al. Colonic epithelial cell diversity in health and inflammatory bowel disease. Nature 567, 49–55 (2019). [DOI] [PubMed] [Google Scholar]
- 2.Fawkner-Corbett D et al. Spatiotemporal analysis of human intestinal development at single-cell resolution. Cell 184, 810–826.e23 (2021). [DOI] [PMC free article] [PubMed] [Google Scholar]
- 3.Hickey JW et al. Organization of the human intestine at single-cell resolution. Nature 619, 572–584 (2023). [DOI] [PMC free article] [PubMed] [Google Scholar]
- 4.Elmentaite R et al. Cells of the human intestinal tract mapped across space and time. Nature 597, 250–255 (2021). [DOI] [PMC free article] [PubMed] [Google Scholar]
- 5.Haber AL et al. A single-cell survey of the small intestinal epithelium. Nature 551, 333–339 (2017). [DOI] [PMC free article] [PubMed] [Google Scholar]
- 6.Smillie CS et al. Intra- and Inter-cellular Rewiring of the Human Colon during Ulcerative Colitis. Cell 178, 714–730.e22 (2019). [DOI] [PMC free article] [PubMed] [Google Scholar]
- 7.Kong L et al. The landscape of immune dysregulation in Crohn’s disease revealed through single-cell transcriptomic profiling in the ileum and colon. Immunity 56, 444–458.e5 (2023). [DOI] [PMC free article] [PubMed] [Google Scholar]
- 8.Zwick RK et al. Epithelial zonation along the mouse and human small intestine defines five discrete metabolic domains. Nat. Cell Biol 26, 250–262 (2024). [DOI] [PMC free article] [PubMed] [Google Scholar]
- 9.Graham DB & Xavier RJ Pathway paradigms revealed from the genetics of inflammatory bowel disease. Nature 578, 527–539 (2020). [DOI] [PMC free article] [PubMed] [Google Scholar]
- 10.Meier KHU et al. Metabolic landscape of the male mouse gut identifies different niches determined by microbial activities. Nat Metab (2023) doi: 10.1038/s42255-023-00802-1. [DOI] [PMC free article] [PubMed] [Google Scholar]
- 11.Chen C & Sibley E Expression profiling identifies novel gene targets and functions for Pdx1 in the duodenum of mature mice. Am. J. Physiol. Gastrointest. Liver Physiol 302, G407–19 (2012). [DOI] [PMC free article] [PubMed] [Google Scholar]
- 12.Wang H et al. TMPRSS2 and glycan receptors synergistically facilitate coronavirus entry. Cell (2024). [DOI] [PubMed] [Google Scholar]
- 13.Camp JG et al. Microbiota modulate transcription in the intestinal epithelium without remodeling the accessible chromatin landscape. Genome Res 24, 1504–1516 (2014). [DOI] [PMC free article] [PubMed] [Google Scholar]
- 14.McPherson RL et al. Lectin-Seq: A method to profile lectin-microbe interactions in native communities. Sci Adv 9, eadd8766 (2023). [DOI] [PMC free article] [PubMed] [Google Scholar]
- 15.Brooks JF 2nd & Hooper LV Interactions among microbes, the immune system, and the circadian clock. Semin. Immunopathol 42, 697–708 (2020). [DOI] [PubMed] [Google Scholar]
- 16.Artis D et al. RELMβ/FIZZ2 is a goblet cell-specific immune-effector molecule in the gastrointestinal tract. Proceedings of the National Academy of Sciences 101, 13596–13600 (2004). [DOI] [PMC free article] [PubMed] [Google Scholar]
- 17.Bergstrom KSB et al. Goblet Cell Derived RELM-β Recruits CD4+ T Cells during Infectious Colitis to Promote Protective Intestinal Epithelial Cell Proliferation. PLoS Pathog 11, e1005108 (2015). [DOI] [PMC free article] [PubMed] [Google Scholar]
- 18.Hooper LV, Stappenbeck TS, Hong CV & Gordon JI Angiogenins: a new class of microbicidal proteins involved in innate immunity. Nat. Immunol 4, 269–273 (2003). [DOI] [PubMed] [Google Scholar]
- 19.Forman RA et al. The goblet cell is the cellular source of the anti-microbial angiogenin 4 in the large intestine post Trichuris muris infection. PLoS One 7, e42248 (2012). [DOI] [PMC free article] [PubMed] [Google Scholar]
- 20.Jarick KJ et al. Non-redundant functions of group 2 innate lymphoid cells. Nature 611, 794–800 (2022). [DOI] [PMC free article] [PubMed] [Google Scholar]
- 21.Bergstrom K et al. Proximal colon–derived O-glycosylated mucus encapsulates and modulates the microbiota. Science 370, 467–472 (2020). [DOI] [PMC free article] [PubMed] [Google Scholar]
- 22.Matute JD et al. Intelectin-1 binds and alters the localization of the mucus barrier-modifying bacterium Akkermansia muciniphila. J. Exp. Med 220, (2023). [DOI] [PMC free article] [PubMed] [Google Scholar]
- 23.Xi R et al. Up-regulation of gasdermin C in mouse small intestine is associated with lytic cell death in enterocytes in worm-induced type 2 immunity. Proc. Natl. Acad. Sci. U. S. A 118, (2021). [DOI] [PMC free article] [PubMed] [Google Scholar]
- 24.Nakata T et al. Genetic vulnerability to Crohn’s disease reveals a spatially resolved epithelial restitution program. Sci. Transl. Med 15, eadg5252 (2023). [DOI] [PMC free article] [PubMed] [Google Scholar]
- 25.Ferdinande L et al. Inflamed intestinal mucosa features a specific epithelial expression pattern of indoleamine 2,3-dioxygenase. Int. J. Immunopathol. Pharmacol 21, 289–295 (2008). [DOI] [PubMed] [Google Scholar]
- 26.Zindl CL et al. Distal colonocytes targeted by C. rodentium recruit T-cell help for barrier defence. Nature 629, 669–678 (2024). [DOI] [PMC free article] [PubMed] [Google Scholar]
- 27.Jasso GJ et al. Colon stroma mediates an inflammation-driven fibroblastic response controlling matrix remodeling and healing. PLoS Biol 20, e3001532 (2022). [DOI] [PMC free article] [PubMed] [Google Scholar]
- 28.Mkaouar H et al. Gut Serpinome: Emerging Evidence in IBD. Int. J. Mol. Sci 22, (2021). [DOI] [PMC free article] [PubMed] [Google Scholar]
- 29.Mkaouar H et al. Siropins, novel serine protease inhibitors from gut microbiota acting on human proteases involved in inflammatory bowel diseases. Microb. Cell Fact 15, 201 (2016). [DOI] [PMC free article] [PubMed] [Google Scholar]
- 30.Barry R et al. Faecal neutrophil elastase-antiprotease balance reflects colitis severity. Mucosal Immunol 13, 322–333 (2020). [DOI] [PMC free article] [PubMed] [Google Scholar]
- 31.Sasaki N et al. Reg4+ deep crypt secretory cells function as epithelial niche for Lgr5+ stem cells in colon. Proc. Natl. Acad. Sci. U. S. A 113, E5399–407 (2016). [DOI] [PMC free article] [PubMed] [Google Scholar]
- 32.Birchenough GMH, Nyström EEL, Johansson MEV & Hansson GC A sentinel goblet cell guards the colonic crypt by triggering Nlrp6-dependent Muc2 secretion. Science 352, 1535–1542 (2016). [DOI] [PMC free article] [PubMed] [Google Scholar]
- 33.Nyström EEL et al. An intercrypt subpopulation of goblet cells is essential for colonic mucus barrier function. Science 372, (2021). [DOI] [PMC free article] [PubMed] [Google Scholar]
- 34.Inaba R, Vujakovic S & Bergstrom K The gut mucus network: A dynamic liaison between microbes and the immune system. Semin. Immunol 69, 101807 (2023). [DOI] [PubMed] [Google Scholar]
- 35.Akiyama S et al. CCN3 Expression Marks a Sulfomucin-nonproducing Unique Subset of Colonic Goblet Cells in Mice. Acta Histochem. Cytochem 50, 159–168 (2017). [DOI] [PMC free article] [PubMed] [Google Scholar]
- 36.Hooper LV, Littman DR & Macpherson AJ Interactions between the microbiota and the immune system. Science 336, 1268–1273 (2012). [DOI] [PMC free article] [PubMed] [Google Scholar]
- 37.Monticelli LA et al. Arginase 1 is an innate lymphoid-cell-intrinsic metabolic checkpoint controlling type 2 inflammation. Nat. Immunol 17, 656–665 (2016). [DOI] [PMC free article] [PubMed] [Google Scholar]
- 38.Wallrapp A et al. Calcitonin Gene-Related Peptide Negatively Regulates Alarmin-Driven Type 2 Innate Lymphoid Cell Responses. Immunity 51, 709–723.e6 (2019). [DOI] [PMC free article] [PubMed] [Google Scholar]
- 39.Mohapatra A et al. Group 2 innate lymphoid cells utilize the IRF4-IL-9 module to coordinate epithelial cell maintenance of lung homeostasis. Mucosal Immunol 9, 275–286 (2016). [DOI] [PMC free article] [PubMed] [Google Scholar]
- 40.Pokrovskii M et al. Characterization of Transcriptional Regulatory Networks that Promote and Restrict Identities and Functions of Intestinal Innate Lymphoid Cells. Immunity 51, 185–197.e6 (2019). [DOI] [PMC free article] [PubMed] [Google Scholar]
- 41.Xu H et al. Transcriptional Atlas of Intestinal Immune Cells Reveals that Neuropeptide α-CGRP Modulates Group 2 Innate Lymphoid Cell Responses. Immunity 51, 696–708.e9 (2019). [DOI] [PMC free article] [PubMed] [Google Scholar]
- 42.Molofsky AB & Locksley RM The ins and outs of innate and adaptive type 2 immunity. Immunity 56, 704–722 (2023). [DOI] [PMC free article] [PubMed] [Google Scholar]
- 43.Flamar A-L et al. Interleukin-33 Induces the Enzyme Tryptophan Hydroxylase 1 to Promote Inflammatory Group 2 Innate Lymphoid Cell-Mediated Immunity. Immunity 52, 606–619.e6 (2020). [DOI] [PMC free article] [PubMed] [Google Scholar]
- 44.Ricardo-Gonzalez RR et al. Tissue signals imprint ILC2 identity with anticipatory function. Nat. Immunol 19, 1093–1099 (2018). [DOI] [PMC free article] [PubMed] [Google Scholar]
- 45.Vivier E et al. Innate Lymphoid Cells: 10 Years On. Cell 174, 1054–1066 (2018). [DOI] [PubMed] [Google Scholar]
- 46.Tsou AM et al. Neuropeptide regulation of non-redundant ILC2 responses at barrier surfaces. Nature 611, 787–793 (2022). [DOI] [PMC free article] [PubMed] [Google Scholar]
- 47.Gurtner A et al. Active eosinophils regulate host defence and immune responses in colitis. Nature 615, 151–157 (2023). [DOI] [PMC free article] [PubMed] [Google Scholar]
- 48.Li Y et al. Neuromedin U programs eosinophils to promote mucosal immunity of the small intestine. Science 381, 1189–1196 (2023). [DOI] [PubMed] [Google Scholar]
- 49.Ignacio A et al. Small intestinal resident eosinophils maintain gut homeostasis following microbial colonization. Immunity 55, 1250–1267.e12 (2022). [DOI] [PubMed] [Google Scholar]
- 50.Naik S & Fuchs E Inflammatory memory and tissue adaptation in sickness and in health. Nature 607, 249–255 (2022). [DOI] [PMC free article] [PubMed] [Google Scholar]
- 51.Gustafsson JK & Johansson MEV The role of goblet cells and mucus in intestinal homeostasis. Nat. Rev. Gastroenterol. Hepatol 19, 785–803 (2022). [DOI] [PubMed] [Google Scholar]
- 52.Mayassi T et al. Chronic Inflammation Permanently Reshapes Tissue-Resident Immunity in Celiac Disease. Cell 176, 967–981.e19 (2019). [DOI] [PMC free article] [PubMed] [Google Scholar]
- 53.Wilde J, Slack E & Foster KR Host control of the microbiome: Mechanisms, evolution, and disease. Science 385, eadi3338 (2024). [DOI] [PubMed] [Google Scholar]
- 54.McCallum G & Tropini C The gut microbiota and its biogeography. Nat. Rev. Microbiol (2023). [DOI] [PubMed] [Google Scholar]
- 55.Casanova J-L & Abel L The Microbe, the Infection Enigma, and the Host. Annu. Rev. Microbiol (2024). [DOI] [PMC free article] [PubMed] [Google Scholar]
- 56.Schneider CA, Rasband WS & Eliceiri KW NIH Image to ImageJ: 25 years of image analysis. Nat. Methods 9, 671–675 (2012). [DOI] [PMC free article] [PubMed] [Google Scholar]
- 57.Nonnecke EB et al. Characterization of an intelectin-1 (Itln1) knockout mouse model. Front. Immunol 13, 894649 (2022). [DOI] [PMC free article] [PubMed] [Google Scholar]
- 58.Chiba Y, Suto W & Sakai H Augmented Pla2g4c/Ptgs2/Hpgds axis in bronchial smooth muscle tissues of experimental asthma. PLoS One 13, e0202623 (2018). [DOI] [PMC free article] [PubMed] [Google Scholar]
- 59.Tao H-P et al. Pancreatic lipase-related protein 2 is selectively expressed by peritubular myoid cells in the murine testis and sustains long-term spermatogenesis. Cell. Mol. Life Sci 80, 217 (2023). [DOI] [PMC free article] [PubMed] [Google Scholar]
- 60.Hao Y et al. Integrated analysis of multimodal single-cell data. Cell 184, 3573–3587.e29 (2021). [DOI] [PMC free article] [PubMed] [Google Scholar]
- 61.Xie Z et al. Gene Set Knowledge Discovery with Enrichr. Curr Protoc 1, e90 (2021). [DOI] [PMC free article] [PubMed] [Google Scholar]
- 62.Aibar S et al. SCENIC: single-cell regulatory network inference and clustering. Nat. Methods 14, 1083–1086 (2017). [DOI] [PMC free article] [PubMed] [Google Scholar]
- 63.Fleming SJ et al. Unsupervised removal of systematic background noise from droplet-based single-cell experiments using CellBender. Nat. Methods 20, 1323–1335 (2023). [DOI] [PubMed] [Google Scholar]
- 64.Bergen V, Lange M, Peidli S, Wolf FA & Theis FJ Generalizing RNA velocity to transient cell states through dynamical modeling. Nat. Biotechnol 38, 1408–1414 (2020). [DOI] [PubMed] [Google Scholar]
- 65.Kleshchevnikov V et al. Cell2location maps fine-grained cell types in spatial transcriptomics. Nat. Biotechnol 40, 661–671 (2022). [DOI] [PubMed] [Google Scholar]
- 66.Li B et al. Benchmarking spatial and single-cell transcriptomics integration methods for transcript distribution prediction and cell type deconvolution. Nat. Methods 19, 662–670 (2022). [DOI] [PubMed] [Google Scholar]
- 67.Hu H et al. AnimalTFDB 3.0: a comprehensive resource for annotation and prediction of animal transcription factors. Nucleic Acids Res 47, D33–D38 (2019). [DOI] [PMC free article] [PubMed] [Google Scholar]
- 68.Sollis E et al. The NHGRI-EBI GWAS Catalog: knowledgebase and deposition resource. Nucleic Acids Res 51, D977–D985 (2023). [DOI] [PMC free article] [PubMed] [Google Scholar]
- 69.Huang H et al. Fine-mapping inflammatory bowel disease loci to single-variant resolution. Nature 547, 173–178 (2017). [DOI] [PMC free article] [PubMed] [Google Scholar]
- 70.Liu Z et al. Genetic architecture of the inflammatory bowel diseases across East Asian and European ancestries. Nat. Genet 55, 796–806 (2023). [DOI] [PMC free article] [PubMed] [Google Scholar]
- 71.Sazonovs A et al. Large-scale sequencing identifies multiple genes and rare variants associated with Crohn’s disease susceptibility. Nat. Genet 54, 1275–1283 (2022). [DOI] [PMC free article] [PubMed] [Google Scholar]
- 72.Kurki MI et al. FinnGen provides genetic insights from a well-phenotyped isolated population. Nature 613, 508–518 (2023). [DOI] [PMC free article] [PubMed] [Google Scholar]
- 73.Bolton C et al. An Integrated Taxonomy for Monogenic Inflammatory Bowel Disease. Gastroenterology 162, 859–876 (2022). [DOI] [PMC free article] [PubMed] [Google Scholar]
- 74.Wu Y et al. 150 risk variants for diverticular disease of intestine prioritize cell types and enable polygenic prediction of disease susceptibility. Cell Genom 3, 100326 (2023). [DOI] [PMC free article] [PubMed] [Google Scholar]
Associated Data
This section collects any data citations, data availability statements, or supplementary materials included in this article.
Supplementary Materials
Data Availability Statement
All raw sequencing data was deposited into GEO under accession number GSE245316. Single-cell RNA-seq and Visium datasets are available through the Broad Institute Single Cell Portal under accession numbers SCP2760 (RNA-seq), SCP2762 (Visium, microbiome experiment) and SCP2771 (Visium, DSS experiment).
Mouse transcription factor genes were retrieved from AnimalTFDB 3.0 (http://guolab.wchscu.cn/AnimalTFDB#!/)67. IBD and celiac diseases associated genes were retrieved from Ontology Lookup Service (https://www.ebi.ac.uk/ols/index; accession number EFO_0003767 (IBD) and EFO_0001060 (celiac diseases))68. The list of nuclear receptors was retrieved from the IUPHAR/BPS Guide to Pharmacology website (https://www.guidetopharmacology.org/GRAC/NHRListForward). The fine-mapped IBD risk genes were curated from literature69–73. The celiac disease68 and diverticular disease74 genes were retrieved from recently published work. These lists can be found in GitLab (https://gitlab.com/xavier-lab-computation/public/molecular-cartography-mouse-gut/-/tree/main/visium/data).