

Abstract
Purpose
Single nucleotide polymorphisms (SNPs) in angiogenesis-associated genes might play an important role in activity of the tyrosine kinase inhibitor sunitinib and could affect survival of cancer patients treated with this drug. The aim of this retrospective study was to elucidate the role of 10 known SNPs in VEGFA, VEGFR1, VEGFR2 and VEGFR3 as potential prognostic and predictive markers in an independent cohort of patients with metastatic renal cell carcinoma (mRCC).
Methods
DNA from 121 mRCC patients treated with sunitinib was used to analyze SNPs by TaqMan genotyping assays. Disease control rate was evaluated according to RECIST. Adverse effects of sunitinib were registered from medical records. The results of Cox and logistic regression were verified by correction for multiple testing.
Results
Kaplan–Meier analysis revealed a reduced progression-free survival in patients with the wild-type (WT) allele of the VEGFA SNP rs699947 compared to variant alleles. Patients with the AA/AC-alleles of the VEGFR1 SNP rs9582036 had an improved median overall survival compared to those with the CC–WT allele what could be confirmed by multivariable Cox proportional hazard regression analyses. No statistically significant associations between the analyzed SNPs and higher risk for adverse effects were observed.
Conclusions
The results of this study suggest that most of the selected SNPs in angiogenesis-related genes are not associated with survival of mRCC patients after sunitinib therapy or with adverse effects. Only the VEGFR1 SNP rs9582036 showed a statistically significant association with overall survival. The potential of SNPs as prognostic and predictive markers for sunitinib-treated mRCC patients should be finally assessed by prospective studies.
Keywords: FLT1, FLT4, KDR, mRCC, SNP, Sunitinib, VEGFA, VEGFR
Introduction
Clear cell renal cell carcinoma (ccRCC) is a malignancy with 270,000 new cases and 100,000 deaths annually worldwide due to the high incidence of metastases (Ferlay et al. 2010). Inactivation of the von Hippel–Lindau (VHL) tumor suppressor gene and elevated protein levels of angiogenesis-associated genes such as vascular endothelial growth factor (VEGF) and platelet-derived growth factor (PDGF) accompany the occurrence of metastatic RCC (mRCC) (Baldewijns et al. 2010; Mellado and Gascón 2006). The tyrosine kinase receptors of VEGF (VEGFR), PDGF (PDGFR) and other genes are frequently overexpressed or mutated in tumors and could specifically be inhibited by targeted therapies with tyrosine kinase inhibitors (TKIs) (Négrier and Raymond 2012). These include sunitinib, sorafenib, pazopanib and axitinib which are currently standard treatment options for mRCC (Ljungberg et al. 2015).
Sunitinib is an orally administered therapeutic with reported objective response rates of up to 47 % (Motzer et al. 2009). Nevertheless, a number of patients with mRCC exhibit no clinical benefits from sunitinib treatment or show progressive disease which is probably a consequence of drug resistance after different cycles of treatment (Rini and Atkins 2009). Different prognostic models comprising clinical parameters can be applied to predict outcome and survival in mRCC disease (Heng et al. 2013) and are used to categorize mRCC patients into groups with favorable, intermediate and poor prognosis (Heng et al. 2009; Motzer et al. 2004). Sunitinib is a standard of care for treatment of mRCC patients with a favorable, intermediate and poor prognosis because of its therapeutic efficacy proven in prospective studies, its safety profile and only mild to moderate adverse events (Castellano et al. 2013; Ljungberg et al. 2015). So far there is a lack of validated biomarkers, which could be used to predict treatment benefit and would allow individualization of therapy. Biomarkers including VEGF, interleukin (IL)-6, hepatocyte growth factor (HGF), osteopontin and single nucleotide polymorphisms (SNPs) in IL-8 might be predictive parameters for anti-VEGF therapy (Funakoshi et al. 2014). However, the first study results and the clinical relevance of these potential markers in mRCC are insufficient and need to be validated in further studies. A reliable prediction of response to TKIs by molecular factors could improve outcome of patients, avoid undesirable adverse effects and limit costs (Yuasa et al. 2011).
Several studies reported effects of genetic variability in selected genes on pharmacokinetics and pharmacodynamics of sunitinib in patients with mRCC. SNPs in genes of drug transport (ABCB1) or drug metabolism (CYP3A5, NR1/2, NR1/3) as well as genes involved in angiogenesis (HIF1A, VEGFA, PDGFRA, VEGFR1, VEGFR2, VEGFR3) and in VEGF-independent pathways (FGFR2, IL8) were investigated in these studies (Beuselinck et al. 2013a, b; Garcia-Donas et al. 2011; Scartozzi et al. 2013; van der Veldt et al. 2011). Scartozzi et al. (2013) found statistically significant associations for VEGFA SNPs rs699947 and rs2010963 with progression-free (PFS) and overall survival (OS). In another cohort of 91 mRCC patients the CC–wild type (WT) of the SNP rs9582036 in VEGFR1 was linked to poorer PFS and OS compared to patients with the AC/AA-variant genotype (Beuselinck et al. 2013b). Gracia-Donas et al. (2011) identified a significantly longer PFS (p = 0.0079) for carriers of the AA-genotype of the VEGFR3 SNP rs307826. Furthermore, adverse effects of a sunitinib therapy such as hand-foot syndrome (HFS) and hypertension (HTN) were associated with SNPs in VEGFA (Eechoute et al. 2012; Kim et al. 2012) and ABCB1 (van Erp et al. 2009).
The aim of the present study was to validate previously described associations between known SNPs in angiogenesis-associated genes and prognosis as well as with prediction of response and adverse effects of the sunitinib therapy in mRCC patients. For this purpose, 10 selected SNPs in VEGFA, VEGFR1, VEGFR2 and VEGFR3 were analyzed and compared with established clinical prognostic factors in RCC such as pathological tumor stage (pT), Fuhrman grade (G), primary lymph node status and distant metastasis (combined M/N stage) as well as TNM staging. Furthermore, associations of the different alleles of the examined SNPs with prognosis and treatment response were investigated by survival analyses and logistic regression.
Materials and methods
Patients
The study was approved by the institutional review board of the participating universities (ethics committee votes EK59032007, EK195092004 and 188/05). Written informed consent was obtained from each patient. In the present study, 121 sunitinib-treated patients of Caucasian descent with clear cell mRCC were selected for SNP analyses. Primary tumors were resected by radical or partial nephrectomy in the Departments of Urology Dresden, Jena and Homburg, which are all members of the German Renal Cell Cancer Network. The occurrence of metastases was diagnosed by computed tomography (CT). Patients were treated with sunitinib between 2005 and 2013 in the respective departments. For some patients the clinicopathological parameters were missing. Sunitinib was self-administered orally at a daily dose of 50 mg in repeated 6-week cycles of 4-week-on treatment followed by a 2-week-off schedule. Dose reduction to 37.5 and 25 mg sunitinib was allowed on the basis of individual tolerability. A total of five patients received sorafenib before sunitinib treatment. CT scans were obtained before treatment start and after every second cycle (3 months) of therapy. The disease control rate was evaluated 3, 6 and 9 months after initiation of therapy as well as after last report (12–88 months, median 18 months) according to the Response Evaluation Criteria in Solid Tumors (RECIST) version 1.0 (Therasse et al. 2000). Complete response, partial response and stable disease were summarized as disease control rate. Patients with mixed response further received sunitinib therapy and were therefore also considered as responders. The clinical decision was made more restrained in such cases due to the restricted number of possible further therapy options at this time. Patients with progression were considered as non-responders. Adverse effects of sunitinib such as HFS and HTN were also registered.
DNA extraction and SNP analyses
DNA from cryo-preserved non-malignant kidney tissue specimens, originating from the surgery of the primary tumor (n = 81) or from lymphocytes of peripheral blood (n = 40) from 121 ccRCC patients, was isolated using the Invisorb Spin Cell and Tissue Mini Kits (STRATEC Molecular, Berlin, Germany) according to the manufacturer’s protocol.
Ten polymorphisms within the genes of VEGFA, VEGFR1, VEGFR2 and VEGFR3 were selected for SNP analysis after review of the relevant literature (Table 1). Polymorphic sites were analyzed in 25 ng genomic DNA of normal kidney tissue and lymphocytes with TaqMan® SNP Genotyping Assays (rs-number is ID-number) (Life Technologies, Darmstadt, Germany). The PCR-based amplification with a subsequent endpoint genotyping step was performed with the Type-it Fast SNP Probe PCR master mix (Qiagen, Hilden, Germany) on a LC480 Real-Time PCR system (Roche, Mannheim, Germany). The comparability of the genotyping results was ascertained by the parallel determination in both sample DNA types from 14 patients.
Table 1.
Analyzed polymorphisms in the genes of VEGFA and its receptors VEGFR1-3
| Gene | SNP ID | Chr. positiona | Allele WT > variant | Function | Previously studied by |
|---|---|---|---|---|---|
| VEGFA | rs699947 | 43768652 | A > C | 5′-UTR variant | Kim et al. (2012), Motzer et al. (2014), Scartozzi et al. (2013) |
| (Chr. 6p12) | rs1570360 | 43770093 | G > A | 5′-UTR variant | Motzer et al. (2014) |
| rs2010963 | 43770613 | G > C | 5′-UTR variant | Kim et al. (2012), Scartozzi et al. (2013) | |
| rs3025039 | 43784799 | C > T | 3′-UTR variant | Kim et al. (2012), Scartozzi et al. (2013) | |
| VEGFR1 | rs9582036 | 28311271 | C > A | Intron variant | Beuselinck et al. (2013b) |
| (Chr. 13q12) | rs9554320 | 28312790 | A > C | Intron variant | Beuselinck et al. (2013b) |
| VEGFR2 | rs1870377 | 55106807 | T > A | aa replacement (Gln > His) | Garcia-Donas et al. (2011), van der Veldt et al. (2011) |
| (Chr. 4q11-q12) | rs2305948 | 55113391 | C > T | aa replacement (Val > Ile) | Garcia-Donas et al. (2011), Kim et al. (2012), Scartozzi et al. (2013) |
| VEGFR3 | rs307821 | 180603313 | C > A | aa replacement (Arg > Leu) | Beuselinck et al. (2013a), Garcia-Donas et al. (2011), Motzer et al. (2014) |
| (Chr. 5q35.3) | rs307826 | 180624003 | T > C | aa replacement (Thr > Ala) | Beuselinck et al. (2013a), Garcia-Donas et al. (2011), Motzer et al. (2014) |
Chr chromosome, aa amino acid, UTR untranslated region, WT wild type
aChromosomal localization is derived from GRCh38 Primary Assembly (NCBI)
Statistical analysis
The clinicopathological parameters were categorized for all analyses as follows: pT stage into organ-confined disease (OCD; pT1+2) and non-organ-confined disease (NOCD; pT3+4), Fuhrman grading into “low” (G1+2) and “high” (G3+4), primary lymph node status and distant metastasis into “negative” (M0+N0) and “positive” (M1/N1) and TNM stage into “low” (stage I+II) and “high” (stage III+IV). For survival analyses, patients were dichotomized by allele splitting into groups with the WT carriers (according to the dbSNP database) and carriers of the homozygous or heterozygous variant (http://www.ncbi.nlm.nih.gov/SNP/).
Follow-up data concerning PFS and OS of 121 patients were obtained from medical records and by contacting the treating urologists and oncologists. PFS as the primary endpoint was defined as time between the first day of sunitinib treatment and date of assessing progressive disease (PD) according to RECIST, date of death after the last response evaluation or date of therapy stop because of strong adverse effects, all defined as event. Patients with PD switching to another therapeutic (e.g., sorafenib, everolimus or temsirolimus) were excluded from further PFS analyses at the subsequent time points of response evaluation. If a patient did not progress, PFS was censored at the time of last follow-up. OS as the secondary endpoint was calculated from date of sunitinib initiation until date of death of any cause, which was defined as event, or last known date of patients being alive used for censoring.
The allele frequencies and Hardy–Weinberg equilibrium were calculated using the OEGE-software (http://www.oege.org/software/hwe-mr-calc.shtml) (Rodriguez et al. 2009). Deviation in the allele distribution of the SNPs from the Hardy–Weinberg equilibrium and associations between the SNPs and the clinicopathological parameters were tested by Fisher’s exact test. Survival analyses of PFS and OS were performed by Kaplan–Meier method, log-rank test and univariable Cox proportional hazards regression. In bivariable Cox proportional hazards regression analyses, the prognostic potential of the SNPs for PFS and OS was assessed separately for each SNP after adjustment to TNM stage (low TNM stage and WT of SNPs were set as references). In order to avoid too many false positive test results caused by multiple testing, the p values of bivariable Cox regressions were adjusted by using the Bonferroni method (Dunn 1961). Additionally, multivariable Cox proportional hazards regression including all SNPs, TNM stage and Fuhrman grading were performed.
Odds ratios (OR) describe the risk for occurrence of an adverse effect (HFS or HTN) dependent on a certain allele and were estimated by univariable logistic regression. The calculated p values were also adjusted by using Bonferroni method. The Haploview v.4.2 software was used to calculate the linkage disequilibrium (LD) relationships between the analyzed SNPs and haplotype blocks (Barrett et al. 2005). A p value <0.05 was defined to be statistically significant. Statistical analyses were performed by SPSS statistics (version 21; IBM, Ehningen, Germany).
Results
Patients and follow-up
Characteristics of the patients are summarized in Table 2. Their median age at time of surgery was 59 (53.5–67.0 years). OCD and NOCD were observed in 54 patients each, and low and high Fuhrman grading was ascertained in 60 and 43 patients, respectively (Table 2). A total of 64 patients showed primary lymph node or distant metastasis at the time of surgery resulting in 23 patients with low and 82 with high TNM stage. During sunitinib treatment, 54 and 37 of the patients exhibited HFS and/or HTN, respectively (Table 2). The median follow-up was 24.6 months (interquartile range (IQR) 10.5–41.6 months), and 55 of the patients died of disease during the follow-up time. The median PFS under therapy of all patients was 14.0 months (IQR 5.4–24.8 months), and their OS was 24.7 months (IQR 12.9–42.0 months; Table 2).
Table 2.
Characteristics of mRCC patients at time of surgery and during follow-up
| Parameter | Total |
|---|---|
| Total number of patients | 121 |
| Age at surgery (years) | |
| Median (IQR) | 59 (53.5–67.0) |
| Sex | |
| Male | 95 |
| Female | 26 |
| pTa (n = 108) | |
| 1 | 32 (29.6 %) |
| 2 | 22 (20.4 %) |
| 3 | 51 (47.2 %) |
| 4 | 3 (2.8 %) |
| Fuhrman gradinga (n = 103) | |
| 1 | 6 (5.8 %) |
| 2 | 54 (52.4 %) |
| 3 | 36 (35.0 %) |
| 4 | 7 (6.8 %) |
| Primary lymph node AND distant metastasisa (n = 104) | |
| Yes (M1/N1) | 64 (61.5 %) |
| No (M0 + N0) | 40 (38.5 %) |
| TNM stagea (n = 105) | |
| I | 11 (10.5 %) |
| II | 12 (11.4 %) |
| III | 16 (15.2 %) |
| IV | 66 (62.9 %) |
| Adverse effects | |
| Hand-foot syndrome (n = 99) | |
| Yes | 54 (54.5 %) |
| No | 45 (45.5 %) |
| Hypertension (n = 95) | |
| Yes | 37 (38.9 %) |
| No | 58 (61.1 %) |
| PFS (months) | |
| Median (IQR) | 14.0 (5.4–24.8) |
| OS (months) | |
| Median (IQR) | 24.7 (12.9–42.0) |
IQR interquartile range, PFS progression-free survival, OS overall survival, TNM tumor, node and metastasis status
aFor some patients, the clinicopathological parameters were missing
Genotype analysis
The investigated SNPs in VEGFA are located in the 5′- and 3′-untranslated regions (UTR) of the gene, and the VEGFR1 SNPs are intron variants (Table 1). In contrast, SNPs in the coding region of VEGFR2 and VEGFR3 resulted in amino acid replacements. The detected allele frequencies of the analyzed SNPs (Table 3) were comparable to other genotyping data of Caucasians in the dbSNP. There were no significant deviations from the Hardy–Weinberg equilibrium except for VEGFR2 rs2305948. The observed frequencies for the alleles TT, CT and CC of rs2305948 were 6, 10 and 105 instead of the expected frequencies of 1, 20 and 100, respectively. Thus, the VEGFR2 rs2305948 SNP was excluded from further analysis.
Table 3.
Allele frequencies
| Gene/SNP ID | Alleles | Number of patients | Allele frequency | HWE p valueb |
|---|---|---|---|---|
| VEGFA | ||||
| rs699947 | AAa | 19 (15.7 %) | A = 0.43 | 0.196 |
| AC | 67 (55.4 %) | C = 0.57 | ||
| CC | 35 (28.9 %) | |||
| rs1570360 | AA | 10 (8.3 %) | A = 0.30 | 0.830 |
| AG | 52 (43.0 %) | G = 0.70 | ||
| GGa | 59 (48.8 %) | |||
| rs2010963 | CC | 17 (14.0 %) | C = 0.37 | 0.846 |
| CG | 55 (45.5 %) | G = 0.63 | ||
| GGa | 49 (40.5 %) | |||
| rs3025039 | CCa | 92 (76.0 %) | C = 0.87 | 1.000 |
| CT | 27 (22.3 %) | T = 0.13 | ||
| TT | 2 (1.7 %) | |||
| VEGFR1 | ||||
| rs9582036c | AA | 67 (55.4 %) | A = 0.74 | 0.480 |
| AC | 43 (35.5 %) | C = 0.26 | ||
| CCa | 10 (8.3 %) | |||
| rs9554320 | AAa | 23 (19.0 %) | A = 0.43 | 0.713 |
| AC | 57 (47.1 %) | C = 0.57 | ||
| CC | 41 (33.9 %) | |||
| VEGFR2 | ||||
| rs1870377c | AA | 6 (5.0 %) | A = 0.25 | 0.628 |
| AT | 47 (38.8 %) | T = 0.75 | ||
| TTa | 67 (55.4 %) | |||
| rs2305948 | CCa | 105 (86.8 %) | C = 0.91 | <0.001 |
| CT | 10 (8.3 %) | T = 0.09 | ||
| TT | 6 (5.0 %) | |||
| VEGFR3 | ||||
| rs307821 | AA | 2 (1.7 %) | A = 0.10 | 0.616 |
| AC | 21 (17.4 %) | C = 0.90 | ||
| CCa | 98 (81.0 %) | |||
| rs307826 | CC | 2 (1.7 %) | C = 0.10 | 0.298 |
| CT | 19 (15.7 %) | T = 0.90 | ||
| TTa | 100 (82.6 %) |
Significant p values are highlighted in bold
aWT allele
bCalculated with Fisher’s exact test
cAllele distribution could not be definitely determined for one patient
Response to sunitinib therapy
Based on the number of patients with available data for the response to sunitinib (n = 113), a disease control rate of 79 % at 3 months, 63 % at 6 months, 55 % at 9 months and 20 % at last report (in median after 18 months) was observed (data not shown). Significant associations between the allele groups of the analyzed polymorphisms and the disease control rates at the different points of evaluation were not found (data not shown).
Clinical importance of polymorphisms
Fisher’s exact test showed no significant associations between SNPs and the clinicopathological parameters (Table 4). In Kaplan–Meier analyses and univariable Cox proportional hazards regression analyses, an association with shorter PFS was identified for the WT allele of the VEGFA SNP rs699947 (Fig. 1; Table 5). The observed median PFS of carriers of the AA-WT and CC/AC-variant alleles was 5 and 16 months, respectively (Fig. 1). Furthermore, there was no statistically significant association between the WT alleles of the VEGFA SNP rs2010963 and of the VEGFR3 SNP rs307826 and shorter PFS (Fig. 1; Table 5). Patients with the AA/AC-alleles of the VEGFR1 SNP rs9582036 had a significantly improved median OS compared to those with the CC-WT allele (42 vs 16 months; Fig. 1). For the other SNPs, no significant associations with PFS or OS were observed in univariable Cox proportional hazards regression analyses (Tables 5, 6).
Table 4.
Associations between SNPs and clinicopathological parameters
| SNP ID | Clinicopathological parameters | |||
|---|---|---|---|---|
| pT | Fuhrman grade | M/N | TNM | |
| rs699947 | 0.192 | 1.000 | 0.792 | 1.000 |
| rs1570360 | 0.700 | 1.000 | 0.841 | 0.643 |
| rs2010963 | 0.117 | 0.687 | 1.000 | 0.647 |
| rs3025039 | 1.000 | 0.652 | 0.496 | 0.425 |
| rs9582036 | 1.000 | 0.482 | 1.000 | 0.428 |
| rs9554320 | 0.629 | 0.798 | 0.796 | 0.368 |
| rs1870377 | 0.846 | 0.839 | 0.307 | 0.642 |
| rs307821 | 1.000 | 0.614 | 0.300 | 1.000 |
| rs307826 | 0.616 | 0.799 | 0.187 | 1.000 |
p values calculated with Fisher’s exact test are presented
Fig. 1.

Kaplan–Meier plots for SNPs in angiogenesis-related genes with associations to PFS (a–c) and OS (d). Differences in survival were calculated by the log-rank test for VEGFA SNP rs699947 (a), VEGFA SNP rs2010963 (b), VEGFR3 SNP rs307826 (c) and VEGFR1 SNP rs9582036 (d). The tables contain numbers of patients and events in each group, the median PFS or OS as well as the 1- and 5-year PFS or OS rates for the respective SNPs
Table 5.
Results of the univariable and bivariable Cox proportional hazard regression analyses (adjusted to TNM) for PFS of mRCC patients dependent on distribution of SNP alleles
| SNP ID | Progression-free survival | ||||||
|---|---|---|---|---|---|---|---|
| Univariable Cox analysis | Bivariable Cox analysisc | ||||||
| HR | 95 %–CI | Unadj. p valuea | HR | 95 %–CI | Unadj. p valuea | Adj. p valueb | |
| rs699947 | 0.535 | 0.317–0.904 | 0.019 | 0.563 | 0.321–0.987 | 0.045 | 0.405 |
| rs1570360 | 1.087 | 0.741–1.595 | 0.670 | 1.021 | 0.676–1.542 | 0.922 | 1.000 |
| rs2010963 | 0.683 | 0.463–1.008 | 0.055 | 0.622 | 0.407–0.953 | 0.029 | 0.261 |
| rs3025039 | 1.359 | 0.870–2.123 | 0.178 | 1.571 | 0.980–2.520 | 0.061 | 0.549 |
| rs9582036 | 0.721 | 0.362–1.434 | 0.351 | 0.658 | 0.314–1.380 | 0.268 | 1.000 |
| rs9554320 | 1.107 | 0.672–1.823 | 0.690 | 1.026 | 0.596–1.768 | 0.926 | 1.000 |
| rs1870377 | 0.929 | 0.626–1.378 | 0.714 | 0.893 | 0.575–1.386 | 0.613 | 1.000 |
| rs307821 | 0.722 | 0.438–1.190 | 0.201 | 0.808 | 0.468–1.393 | 0.442 | 1.000 |
| rs307826 | 0.645 | 0.382–1.088 | 0.100 | 0.708 | 0.398–1.260 | 0.241 | 1.000 |
WT is reference
Significant associations (p value < 0.05) are highlighted in bold
aUnadj.—unadjusted p value
bAdj.—p values were adjusted by using Bonferroni method
cBivariable Cox regression models included always TNM stage and the specified SNP
Table 6.
Results of the univariable and bivariable Cox proportional hazard regression analyses (adjusted to TNM) for OS of mRCC patients dependent on distribution of SNP alleles
| SNP ID | Overall survival | ||||||
|---|---|---|---|---|---|---|---|
| Univariable Cox analysis | Bivariable Cox analysisc | ||||||
| HR | 95 %–CI | unadj. p valuea | HR | 95 %–CI | unadj. p valuea | adj. p valueb | |
| rs699947 | 0.614 | 0.316–1.192 | 0.149 | 0.418 | 0.210–0.833 | 0.013 | 0.117 |
| rs1570360 | 0.884 | 0.520–1.502 | 0.649 | 0.933 | 0.530–1.641 | 0.809 | 1.000 |
| rs2010963 | 0.687 | 0.403–1.173 | 0.169 | 0.586 | 0.328–1.047 | 0.071 | 0.639 |
| rs3025039 | 1.400 | 0.761–2.577 | 0.280 | 1.474 | 0.778–2.793 | 0.234 | 1.000 |
| rs9582036 | 0.294 | 0.128–0.676 | 0.004 | 0.241 | 0.097–0.602 | 0.002 | 0.018 |
| rs9554320 | 0.959 | 0.504–1.825 | 0.899 | 0.764 | 0.380–1.537 | 0.451 | 1.000 |
| rs1870377 | 0.807 | 0.467–1.393 | 0.441 | 0.770 | 0.422–1.406 | 0.394 | 1.000 |
| rs307821 | 1.239 | 0.637–2.408 | 0.528 | 1.353 | 0.648–2.826 | 0.420 | 1.000 |
| rs307826 | 1.245 | 0.640–2.419 | 0.519 | 1.368 | 0.656–2.855 | 0.403 | 1.000 |
WT is reference
Significant associations (p value < 0.05) are highlighted in bold
aUnadj.—unadjusted p value
bAdj.—p values were adjusted by using Bonferroni method
cBivariable Cox regression models included always TNM stage and the specified SNP
The bivariable Cox regression analyses for PFS and OS always included TNM stage, the only clinicopathological parameter with statistical significance in univariable Cox regression analyses (data not shown), and the separate SNPs. In a second step, the p values of these analyses were corrected for multiple testing (Tables 5, 6). Only the VEGFR1 SNP rs9582036 was ascertained to be a potential prognostic marker for OS (HR 0.241; CI-95 % 0.097–0.602; adj. p = 0.018) (Table 6). This was confirmed by multivariable Cox regression analyses comprising all SNPs, TNM stage and Fuhrman grading (Table 8). All other SNPs did not show any association with the outcome of the patients in multivariable Cox regression analyses (Tables 7, 8).
Table 8.
Results of the multivariable Cox proportional hazard regression (including all SNPs, TNM and Fuhrman grading) for OS of mRCC patients dependent on distribution of SNP alleles
| Overall survival | |||
|---|---|---|---|
| SNP ID/parameter | Multivariable Cox analysis | ||
| HR | 95 %–CI | p value | |
| rs699947 | 0.626 | 0.256–1.531 | 0.304 |
| rs1570360 | 0.757 | 0.406–1.410 | 0.380 |
| rs2010963 | 0.751 | 0.354–1.593 | 0.455 |
| rs3025039 | 1.445 | 0.717–2.913 | 0.303 |
| rs9582036 | 0.294 | 0.092–0.938 | 0.039 |
| rs9554320 | 1.233 | 0.504–3.015 | 0.646 |
| rs1870377 | 0.799 | 0.428–1.494 | 0.482 |
| rs307821 | 1.349 | 0.226–8.066 | 0.743 |
| rs307826 | 0.907 | 0.150–5.481 | 0.915 |
| TNM | 2.391 | 0.992–5.764 | 0.052 |
| Fuhrman grading | 1.548 | 0.838–2.861 | 0.163 |
WT, low TNM stage and low grade served as references
Significant associations (p value < 0.05) are highlighted in bold
Table 7.
Results of the multivariable Cox proportional hazard regression (including all SNPs, TNM and Fuhrman grading) for PFS of mRCC patients dependent on distribution of SNP alleles
| Progression-free survival | |||
|---|---|---|---|
| SNP ID/parameter | Multivariable Cox analysis | ||
| HR | 95 %–CI | p value | |
| rs699947 | 1.029 | 0.496–2.135 | 0.939 |
| rs1570360 | 0.981 | 0.616–1.563 | 0.936 |
| rs2010963 | 0.615 | 0.357–1.061 | 0.080 |
| rs3025039 | 1.428 | 0.831–2.454 | 0.198 |
| rs9582036 | 0.550 | 0.197–1.533 | 0.253 |
| rs9554320 | 1.454 | 0.688–3.070 | 0.327 |
| rs1870377 | 1.005 | 0.620–1.630 | 0.984 |
| rs307821 | 1.351 | 0.388–4.707 | 0.636 |
| rs307826 | 0.460 | 0.125–1.694 | 0.243 |
| TNM | 1.956 | 1.056–3.621 | 0.033 |
| Fuhrman grading | 1.151 | 0.731–1.813 | 0.543 |
WT, low TNM stage and low grade served as references
Significant associations (p value < 0.05) are highlighted in bold
After p value correction by using the Bonferroni method, the univariable logistic regression results indicated that SNPs were not associated with an increased risk of HFS or HTN (Table 9).
Table 9.
Logistic regression for the adverse effects hand-foot syndrome (HFS) and hypertension (HTN)
| SNP ID | Logistic regressiona | |||||||
|---|---|---|---|---|---|---|---|---|
| HFS | HTN | |||||||
| OR | 95 %–CI | Unadj. p valueb | Adj. p valuec | OR | 95 %–CI | Unadj. p valueb | Adj. p valuec | |
| rs699947 | 3.981 | 1.294–12.245 | 0.017 | 0.153 | 2.383 | 0.713–7.971 | 0.179 | 1.000 |
| rs1570360 | 0.523 | 0.234–1.172 | 0.157 | 1.000 | 0.600 | 0.261–1.378 | 0.292 | 1.000 |
| rs2010963 | 1.943 | 0.869–4.346 | 0.111 | 0.999 | 1.533 | 0.662–3.554 | 0.398 | 1.000 |
| rs3025039 | 0.786 | 0.313–1.973 | 0.644 | 1.000 | 0.563 | 0.207–1.527 | 0.335 | 1.000 |
| rs9582036 | 2.083 | 0.469–9.249 | 0.464 | 1.000 | 1.090 | 0.244–4.861 | 1.000 | 1.000 |
| rs9554320 | 1.429 | 0.524–3.895 | 0.610 | 1.000 | 1.118 | 0.395–3.161 | 1.000 | 1.000 |
| rs1870377 | 1.263 | 0.561–2.842 | 0.681 | 1.000 | 1.008 | 0.434–2.342 | 1.000 | 1.000 |
| rs307821 | 0.800 | 0.288–2.224 | 0.795 | 1.000 | 2.315 | 0.817–6.555 | 0.118 | 1.000 |
| rs307826 | 0.596 | 0.203–1.752 | 0.461 | 1.000 | 1.724 | 0.585–5.085 | 0.402 | 1.000 |
aWT is reference
bUnadj.—unadjusted p value
cAdj.—p values were adjusted by using Bonferroni method
Haplotype analysis
The LD of the analyzed SNPs of VEGFA, VEGFR1 and VEGFR3 is shown in LD-plots (Fig. 2a). Strong LD was found between the VEGFA SNPs rs699947 and rs1570360 (D′ = 0.94), rs699947 and rs2010963 (D′ = 1.00) as well as between rs1570360 and rs2010963 (D′ = 1.00). In addition, the analyzed SNPs in VEGFR1 (D′ = 1.00) and VEGFR3 (D′ = 0.90) were each in tight LD. A longer OS (unadjusted p = 0.019) was observed for patients with the simultaneous occurrence of the variant alleles of the VEGFA SNPs (AC/CC of rs699947, AA/AG of rs1570360 and CC/CG of rs2010963) in contrast to all other allele combinations (Fig. 2b).
Fig. 2.
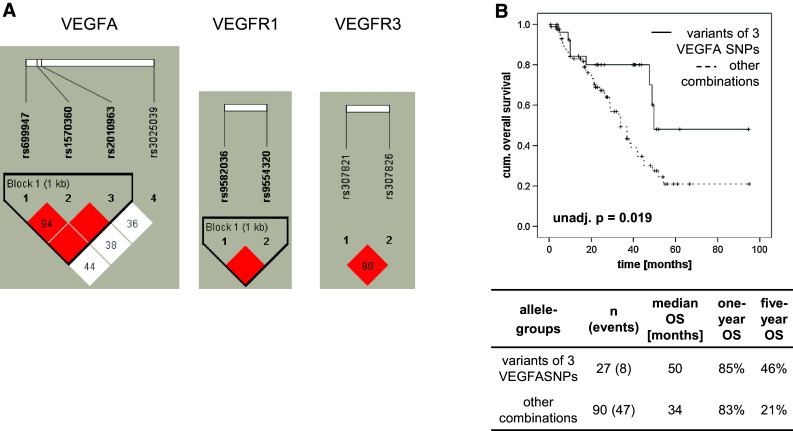
LD-plots of the analyzed SNPs and Kaplan–Meier curve for the combination of three VEGFA SNPs. The LD-plots show the non-random associations of the SNPs in VEGFA, VEGFR1 and VEGFR3 (a). The numbers in the squares represent the D′-values, which describe the strength of the linkage disequilibrium. Empty squares mean a LD of 1.0. Strong and weak LDs between SNPs are represented by red and white squares, respectively. Following categorizing patients into groups with variant alleles of VEGFA SNP rs699947 (AC/CC), rs1570360 (AA/AG) and rs2010963 (CC/CG) or all other WT/variant combinations a longer OS was observed for patients carrying simultaneously the variant alleles of the mentioned SNPs (b). The table below the Kaplan–Meier curves contains numbers of patients and events in each group, the median OS as well as the 1- and 5-year OS rates for the respective allele combinations
Discussion
The overall aim of this retrospective study was to validate potential associations between selected SNPs and the therapeutic response as well as with the prognosis of sunitinib-treated mRCC patients in a larger, independent patient cohort. Such patients need predictive markers to identify those who would benefit from a sunitinib therapy to avoid ineffective therapies and undesirable adverse effects. Thus, the main focus was to reveal and validate the role of SNPs in angiogenesis-associated genes with regard to response prediction for such a therapy. For this purpose, we evaluated 10 selected SNPs in the genes VEGFA, VEGFR1, VEGFR2 and VEGFR3 with previously claimed associations between a sunitinib therapy and patients’ survival.
Associations of the SNPs with therapeutic response or clinicopathological parameters could not be observed in the present study, but there were associations between the survival of patients and the occurrence of some alleles. For example, survival analyses revealed that the variant alleles CC/CG of the VEGFA SNP rs2010963 were related to a longer PFS (Fig. 1). In contrast, Scartozzi et al. (2013) reported significant differences in PFS (2, 8 and 18 months, p = 0.0001) for the alleles CC, CG and GG of the same SNP (84 patients). When we examined the allele distribution of this SNP in the same way, a median PFS of 20, 17 and 10 months was observed for CC, CG and GG, respectively (Fig. 3a). Scartozzi et al. (2013) also analyzed the VEGFA SNP rs699947 and found an improved median PFS (18 vs 4 months) for patients carrying the AA/AC-genotypes compared to those with the CC-allele. For a better comparison of these results with our data, we plotted an additional Kaplan–Meier curve for the VEGFA SNP rs699947 which indicated no significant differences in PFS between patients with the AA/AC-alleles and the CC-genotype (Fig. 3b). In a recent report by Motzer et al., no significant correlation between the VEGFA SNP rs699947 and outcome was observed in accordance with our findings which did not reveal a statistically significant association in bi- and multivariable Cox regression analyses (Motzer et al. 2014).
Fig. 3.

Kaplan–Meier plots for PFS of patients with different allele variants of VEGFA SNP rs2010963 (a) and VEGFA SNP rs699947 (b). The alleles of these SNPs were combined in an alternative way to compare our results with another study (Scartozzi et al. 2013). Differences in survival were calculated by the log-rank test. The tables contain numbers of patients and events in each group, the median PFS as well as the 1- and 5-year PFS rates for the respective SNPs
Garcia-Donas et al. (101 patients) identified a significantly improved PFS for carriers of the AA-genotype of the VEGFR3 SNP rs307826 (p = 0.0079) and for carriers of the GG-genotype of the VEGFR3 SNP rs307821 (p = 0.014) (Garcia-Donas et al. 2011). This was one of the few studies in which results were corrected for multiple testing. Additionally, Beuselinck et al. (2013a) already showed in a cohort of 88 patients that the AA-allele of the SNP rs307826 was associated with a significantly longer median PFS (19 vs 10 months) and OS (31 vs 22 months) compared to patients with AG/GG-alleles. Unexpectedly, wild-type carriers (GG) of the VEGFR3 SNP rs307821 showed a longer PFS, but a shorter OS than carriers of the variant alleles in their study (Beuselinck et al. 2013a). In contrast to these reports, patients with the TT-alleles of the VEGFR3 SNP rs307826 (corresponding to the AA-allele on the complementary DNA strand) tended to show a poorer PFS than patients with CC/CT-genotypes in our cohort. Furthermore, no association of the VEGFR3 SNP rs307821 with PFS or OS of the patients could be assessed. We suppose that these inconsistent results might be caused by differences in size of patient groups, sample types (lymphocytes, tumor or normal tissue) or diversity of ethnic groups (Klug et al. 2009). However, lack of significant associations of these two SNPs in VEGFR3 with time to progression, PFS and OS was also reported by Motzer et al. (Motzer et al. 2014).
In our study, the median OS of patients with the variant alleles AA/AC of rs9582036 in VEGFR1 was significantly improved (42 vs 16 months) compared to WT carriers. These results are in accordance with findings of Beuselinck et al. (91 patients) who described a significantly lower response rate, shorter PFS (10 vs 18 months) and poorer OS (14 vs 31 months) of patients carrying the CC-WT allele of the VEGFR1 SNP rs9582036 as assessed by univariable Cox regression (Beuselinck et al. 2013b). So far, these are the only available reports on this SNP in relation to mRCC patients under sunitinib treatment, both showing a prognostic potential of rs9582036. Therefore, this SNP appears to be worth validating its prognostic value in a prospective study.
Kim et al. identified an association of the GG-WT allele of VEGFR2 rs2305948 in combination with the CC-WT allele of the VEGFA SNP rs3025039 and shorter OS in a cohort of 63 patients (Kim et al. 2012). In contrast, no associations of allele distribution of these SNPs with PFS and OS were found in other studies (Diekstra et al. 2015; Garcia-Donas et al. 2011; Scartozzi et al. 2013). We observed a deviation in the allele distribution of VEGFR2 rs2305948 from the Hardy–Weinberg equilibrium. Therefore, we excluded this SNP from further evaluations and could not assess its prognostic potential. Whereas rs1870377, the second SNP in VEGR2 analyzed, did not show any association with the outcome of the patients in our and other studies (Beuselinck et al. 2013a; Garcia-Donas et al. 2011; Scartozzi et al. 2013), a significant association with PFS and/or OS was described by van der Veldt et al. (2011) and Diekstra et al. (2015).
Our haplotype analysis of the respective SNPs in each gene revealed strong evidences of LD between three SNPs in VEGFA, which was also shown in previous studies (Howell et al. 2002; Kim et al. 2008; Langsenlehner et al. 2008; Sáenz-López et al. 2013). Analysis of possible associations between the variant combination of rs699947, rs1570360 and rs2010963 revealed a longer OS for patients carrying the variant alleles of the three VEGFA SNPs. To our knowledge, this is the first time that a combinatory effect of VEGFA SNPs on OS was shown. Similarly, van der Veldt et al. (2011) and Diekstra et al. (2015) described associations with PFS and OS for haplotypes in NR1/3 and ABCB1.
So far, only a limited number of reports about associations between polymorphism and adverse effects of a TKI therapy exist, in which results were corrected for multiple testing. Most studies had an exploratory character and reported data without adjustment of p values. For example, an increased incidence of HTN during sunitinib treatment was reported for mRCC patients with the AA-allele of the VEGFA SNP rs699947 and with the GG-allele of the VEGFA SNP rs2010963 (Kim et al. 2012). These observations could not be confirmed in our study. After correction for multiple testing, there were no associations between the analyzed SNPs in angiogenesis-related genes and HTN as well as HFS. Similar observations were reported by Garcia-Donas et al. (Garcia-Donas et al. 2011). However, potential associations between polymorphisms and sunitinib-related side effects like HTN and HFS were described for SNPs in genes determining pharmacokinetics like ABCB1, ABCG2 or CYP3A5 (Diekstra et al. 2015; Kim et al. 2013; van Erp et al. 2009).
In summary, the results suggest that adjustment for multiple testing is an important approach to avoid misinterpretation of randomly significant p values and to confirm real effects. In the present study, only the VEGFR1 SNP rs9582036 was significantly associated with OS of sunitinib-treated mRCC patients. However, our study is potentially limited by the use of heterogeneous DNA samples from lymphocytes and non-malignant kidney tissues as well as by its retrospective design without a unified strategy for clinical assessment and making therapeutic decisions. The relatively low number of patients also appears as limitation even if it is higher than in most of the previous reports. Because of general deficiency in available material from patients under sunitinib treatment, we tried to increase the number of cases by cooperating within the German Renal Cell Cancer Network. In the meantime, a large joint analysis of 333 patients pooled from three exploratory studies delivered a comprehensive evaluation on a number of SNPs as pharmacogenetic biomarkers (Diekstra et al. 2015). Nevertheless, due to contrary results to previous studies a meta-analysis and a subsequent prospective validation study on a larger cohort of patients are needed to evaluate former findings and to define the real impact of SNPs on outcome of sunitinib treatment of mRCC patients.
Acknowledgments
We thank the German Renal Cell Cancer Network for the successful cooperation and Kati Erdmann for her critical review of the manuscript.
Compliance with ethical standards
Conflict of interest
The authors declare that they have no conflict of interest.
Ethical approval
All procedures performed in studies involving human participants were in accordance with the ethical standards of the institutional and/or national research committee and with the 1964 Helsinki Declaration and its later amendments or comparable ethical standards.
Informed consent
Written informed consent was obtained from all individual participants included in the study.
Footnotes
On behalf of the German Renal Cell Cancer Network.
References
- Ljungberg B et al (2015) Guidelines on renal cell carcinoma. http://uroweb.org/wp-content/uploads/EAU-Guidelines-Renal-Cell-Cancer-2015-v2.pdf
- Baldewijns MM, van Vlodrop IJ, Vermeulen PB, Soetekouw PM, van Engeland M, de Bruine AP (2010) VHL and HIF signalling in renal cell carcinogenesis. J Pathol 221:125–138. doi:10.1002/path.2689 [DOI] [PubMed] [Google Scholar]
- Barrett JC, Fry B, Maller J, Daly MJ (2005) Haploview: analysis and visualization of LD and haplotype maps. Bioinformatics. doi:10.1093/bioinformatics/bth457 [DOI] [PubMed] [Google Scholar]
- Beuselinck B et al (2013a) Single-nucleotide polymorphisms associated with outcome in metastatic renal cell carcinoma treated with sunitinib. Br J Cancer 108:887–900. doi:10.1038/bjc.2012.548 [DOI] [PMC free article] [PubMed] [Google Scholar]
- Beuselinck B et al (2013b) VEGFR1 single nucleotide polymorphisms associated with outcome in patients with metastatic renal cell carcinoma treated with sunitinib—a multicentric retrospective analysis. Acta Oncol 53:103–112. doi:10.3109/0284186X.2013.770600 [DOI] [PubMed] [Google Scholar]
- Castellano D, Ravaud A, Schmidinger M, De Velasco G, Vazquez F (2013) Therapy management with sunitinib in patients with metastatic renal cell carcinoma: key concepts and the impact of clinical biomarkers. Cancer Treat Rev 39:230–240. doi:10.1016/j.ctrv.2012.04.009 [DOI] [PubMed] [Google Scholar]
- Diekstra MH et al (2015) CYP3A5 and ABCB1 polymorphisms as predictors for sunitinib outcome in metastatic renal cell carcinoma. Eur Urol 68:621–629. doi:10.1016/j.eururo.2015.04.018 [DOI] [PubMed] [Google Scholar]
- Dunn OJ (1961) Multiple comparisons among means. J Am Stat Assoc 56:52–64. doi:10.1080/01621459.1961.10482090 [Google Scholar]
- Eechoute K et al (2012) Polymorphisms in endothelial nitric oxide synthase (eNOS) and vascular endothelial growth factor (VEGF) predict sunitinib-induced hypertension. Clin Pharmacol Ther 92:503–510. doi:10.1038/clpt.2012.136 [DOI] [PubMed] [Google Scholar]
- Ferlay J, Shin HR, Bray F, Forman D, Mathers C, Parkin DM (2010) Estimates of worldwide burden of cancer in 2008: GLOBOCAN. Int J Cancer 127:2893–2917. doi:10.1002/ijc.25516 [DOI] [PubMed] [Google Scholar]
- Funakoshi T, Lee CH, Hsieh JJ (2014) A systematic review of predictive and prognostic biomarkers for VEGF-targeted therapy in renal cell carcinoma Cancer Treat Rev 40:533–547. doi:10.1016/j.ctrv.2013.11.008 [DOI] [PubMed] [Google Scholar]
- Garcia-Donas J et al (2011) Single nucleotide polymorphism associations with response and toxic effects in patients with advanced renal-cell carcinoma treated with first-line sunitinib: a multicentre, observational, prospective study. Lancet Oncol 12:1143–1150. doi:10.1016/S1470-2045(11)70266-2 [DOI] [PubMed] [Google Scholar]
- Heng DY et al (2009) Prognostic factors for overall survival in patients with metastatic renal cell carcinoma treated with vascular endothelial growth factor-targeted agents: results from a large, multicenter study. J Clin Oncol 27:5794–5799. doi:10.1200/JCO.2008.21.4809 [DOI] [PubMed] [Google Scholar]
- Heng DY et al (2013) External validation and comparison with other models of the International Metastatic Renal-Cell Carcinoma Database Consortium prognostic model: a population-based study. Lancet Oncol 14:141–148. doi:10.1016/S1470-2045(12)70559-4 [DOI] [PMC free article] [PubMed] [Google Scholar]
- Howell WM, Bateman AC, Turner SJ, Collins A, Theaker JM (2002) Influence of vascular endothelial growth factor single nucleotide polymorphisms on tumour development in cutaneous malignant melanoma. Genes Immun 3:229–232. doi:10.1038/sj.gene.6363851 [DOI] [PubMed] [Google Scholar]
- Kim DH, Lee NY, Lee MH, Sohn SK, Do YR, Park JY (2008) Vascular endothelial growth factor (VEGF) gene (VEGFA) polymorphism can predict the prognosis in acute myeloid leukaemia patients. Br J Haematol 140:71–79. doi:10.1111/j.1365-2141.2007.06887.x [DOI] [PubMed] [Google Scholar]
- Kim JJ et al (2012) Association of VEGF and VEGFR2 single nucleotide polymorphisms with hypertension and clinical outcome in metastatic clear cell renal cell carcinoma patients treated with sunitinib. Cancer 118:1946–1954. doi:10.1002/cncr.26491 [DOI] [PMC free article] [PubMed] [Google Scholar]
- Kim HR et al (2013) Pharmacogenetic determinants associated with sunitinib-induced toxicity and ethnic difference in Korean metastatic renal cell carcinoma patients. Cancer Chemother Pharmacol 72:825–835. doi:10.1007/s00280-013-2258-y [DOI] [PubMed] [Google Scholar]
- Klug SJ et al (2009) TP53 codon 72 polymorphism and cervical cancer: a pooled analysis of individual data from 49 studies. Lancet Oncol 10:772–784. doi:10.1016/s1470-2045(09)70187-1 [DOI] [PubMed] [Google Scholar]
- Langsenlehner T, Langsenlehner U, Renner W, Krippl P, Mayer R, Wascher TC, Kapp KS (2008) Single nucleotide polymorphisms and haplotypes in the gene for vascular endothelial growth factor and risk of prostate cancer. Eur J Cancer 44:1572–1576. doi:10.1016/j.ejca.2008.04.021 [DOI] [PubMed] [Google Scholar]
- Mellado B, Gascón P (2006) Molecular biology of renal cell carcinoma. Clin Transl Oncol 8:706–710 [DOI] [PubMed] [Google Scholar]
- Motzer RJ, Bacik J, Schwartz LH, Reuter V, Russo P, Marion S, Mazumdar M (2004) Prognostic factors for survival in previously treated patients with metastatic renal cell carcinoma. J Clin Oncol 22:454–463. doi:10.1200/JCO.2004.06.132 [DOI] [PubMed] [Google Scholar]
- Motzer RJ et al (2009) Overall survival and updated results for sunitinib compared with interferon alfa in patients with metastatic renal cell carcinoma. J Clin Oncol 27:3584–3590. doi:10.1200/JCO.2008.20.1293 [DOI] [PMC free article] [PubMed] [Google Scholar]
- Motzer RJ et al (2014) Investigation of novel circulating proteins, germ line single-nucleotide polymorphisms, and molecular tumor markers as potential efficacy biomarkers of first-line sunitinib therapy for advanced renal cell carcinoma. Cancer Chemother Pharmacol 74:739–750. doi:10.1007/s00280-014-2539-0 [DOI] [PMC free article] [PubMed] [Google Scholar]
- Négrier S, Raymond E (2012) Antiangiogenic treatments and mechanisms of action in renal cell carcinoma. Invest New Drugs 30:1791–1801. doi:10.1007/s10637-011-9677-6 [DOI] [PubMed] [Google Scholar]
- Rini BI, Atkins MB (2009) Resistance to targeted therapy in renal-cell carcinoma. Lancet Oncol 10:992–1000. doi:10.1016/S1470-2045(09)70240-2 [DOI] [PubMed] [Google Scholar]
- Rodriguez S, Gaunt TR, Day IN (2009) Hardy–Weinberg equilibrium testing of biological ascertainment for Mendelian randomization studies. Am J Epidemiol 169:505–514. doi:10.1093/aje/kwn359 [DOI] [PMC free article] [PubMed] [Google Scholar]
- Sáenz-López P, Vazquez F, Cozar JM, Carretero R, Garrido F, Ruiz-Cabello F (2013) VEGF polymorphisms are not associated with an increased risk of developing renal cell carcinoma in Spanish population. Hum Immunol 74:98–103. doi:10.1016/j.humimm.2012.10.014 [DOI] [PubMed] [Google Scholar]
- Scartozzi M et al (2013) VEGF and VEGFR polymorphisms affect clinical outcome in advanced renal cell carcinoma patients receiving first-line sunitinib Br J Cancer 108:1126–1132. doi:10.1038/bjc.2012.501 [DOI] [PMC free article] [PubMed] [Google Scholar]
- Therasse P et al (2000) New guidelines to evaluate the response to treatment in solid tumors. European Organization for Research and Treatment of Cancer, National Cancer Institute of the United States, National Cancer Institute of Canada. J Natl Cancer Inst 92:205–216 [DOI] [PubMed] [Google Scholar]
- van der Veldt AA et al (2011) Genetic polymorphisms associated with a prolonged progression-free survival in patients with metastatic renal cell cancer treated with sunitinib. Clin Cancer Res 17:620–629. doi:10.1158/1078-0432.CCR-10-1828 [DOI] [PubMed] [Google Scholar]
- van Erp NP et al (2009) Pharmacogenetic pathway analysis for determination of sunitinib-induced toxicity. J Clin Oncol 27:4406–4412. doi:10.1200/JCO.2008.21.7679 [DOI] [PubMed] [Google Scholar]
- Yuasa T, Takahashi S, Hatake K, Yonese J, Fukui I (2011) Biomarkers to predict response to sunitinib therapy and prognosis in metastatic renal cell cancer. Cancer Sci 102:1949–1957. doi:10.1111/j.1349-7006.2011.02054.x [DOI] [PubMed] [Google Scholar]