

Abstract
Traditional nonparametric “multipoint” statistical procedures have been developed for assigning allele-sharing values at a locus of interest to pairs of relatives for linkage studies. These procedures attempt to accommodate a lack of informativity, nongenotyped loci, missing data, and related issues concerning the genetic markers used in a linkage study. However, such procedures often cannot overcome these phenomena in compelling ways and, as a result, assign relevant relative pairs allele-sharing values that are “expected” for those pairs. The practice of assigning expected allele-sharing values to relative pairs in the face of a lack of explicit allele-transmission information can bias traditional nonparametric linkage test statistics toward the null hypothesis of no locus effect. This bias is due to the use of expected values, rather than to a lack of information about actual allele sharing at relevant marker loci. The bias will vary from study to study on the basis of the DNA markers, sample size, relative-pair types, and pedigree structures used, but it can be extremely pronounced and could contribute to a lack of consistent success in the application of traditional nonparametric linkage analyses to complex human traits and diseases. There are several potential ways to overcome this problem, but their foundations deserve greater research. We expose many of the issues concerning allele sharing with data from a large affected-sibling-pair study investigating the genetic basis of autism.
Introduction
Linkage analysis has been a workhorse for gene discovery in human genetics research for the past 50 years or so (Lander and Schork 1994; Schork and Chakravarti 1996). Although there have been spectacular successes in the application of parametric linkage analysis to overtly Mendelian, monogenic traits and diseases (e.g., cystic fibrosis and neurofibromatosis), there has been a noticeable and somewhat discouraging lack of success in the application of nonparametric linkage analyses to more complex traits and diseases, such as hypertension and psychiatric disorders. This is the case despite the fact that nonparametric linkage analysis models have been developed, expanded, and tested for years in complex trait analysis (Weeks and Lange 1988; Lander and Schork 1994; Whittemore 1996; Blangero et al. 2001; Sengul et al. 2001). This lack of success has raised many questions, including the suggestion that traditional nonparametric linkage analysis strategies are inherently flawed and should be replaced with other gene-discovery strategies and study designs (Risch and Botstein 1996; Risch and Merikangas 1996). However, despite the fact that nonparametric linkage analysis strategies are plagued by certain problems, many of these problems are not only identifiable but potentially correctable. Thus, before abandoning nonparametric linkage-analysis gene-discovery strategies, it makes sense to attempt to identify and correct any problems they might possess, in an effort to determine their ultimate utility.
One problem plaguing traditional nonparametric linkage analysis techniques is rooted in the use and estimation of a quantity of fundamental significance to their foundation: the fraction of alleles that are shared identical by descent (IBD) at a locus of interest between pairs of relatives. This quantity is often tested directly for its significance in, for example, affected sibling pair analyses (as a deviation from an expected null hypothesis value of 0.5), or it is related to some measure of phenotypic similarity for quantitative trait analyses (e.g., squared difference in phenotypic values between the relative pairs for Haseman-Elston regression analysis [Haseman and Elston 1972] or covariation in relative-pair trait values for variance-components–based analysis [Blangero et al. 2001]). In this article, we argue that the manner in which measures of allele sharing are computed and assigned to pairs of relatives in traditional nonparametric linkage analyses can be very problematic and can induce biases in associated test statistics toward the null hypothesis of no linkage—a fact that may explain why many applications of nonparametric linkage analysis to complex traits and diseases are controversial or not compelling. These problems stem from the use or assignment of expected allele-sharing values to pairs of relatives when marker information is uninformative (to whatever degree) and/or when interpolating allele-sharing values at loci between distant marker loci. To introduce our discussion, we provide a simple analogy.
Consider a situation in which one believes that a coin may not be fair or weighted evenly; this coin, for example, lands on “heads” more often than expected. The null hypothesis is that heads and tails each have an equal chance of occurring with any toss—that is, H0: 50/50⇒Pr(heads)=0.50 versus H1: Pr(heads)>0.50. To test the null hypothesis, an experimenter flips a coin 100 times. The experimenter can only observe with certainty whether a coin landed heads or tails in 50 of the 100 flips. Let’s say that 40 heads were observed in these 50 tosses. On the basis of these tosses, the experimenter constructs an estimate of the probability of heads as 40/50=0.80. Now the question is what to do with the other 50 tosses? One could argue that, on the basis of expectation (under the null hypothesis), the probability that the coin landed heads in these 50 tosses is 0.50. Assigning expected values to these tosses and including them in the construction of an estimate of the probability of heads (and ultimately a test statistic that uses this estimate) would lead to an estimate of (40+25)/100=0.65—a value that is much closer to the null hypothesis value than if one excluded those observations. This bias toward the null hypothesis, which results from using expected values, will occur even if there is no more than a tendency (no matter how strong) for the assigned probabilities to be consistent with the null hypothesis. The use of a simple mixture model that considers each alternative outcome of the toss and then weights each outcome by probability will not overcome this problem as long as those probabilities are consistent with expectation.
Now the connection to allele-sharing–based nonparametric linkage analyses can be made. Consider the simplest case of an affected sibling pair analysis in which one wants to test the hypothesis that there is skewing at a locus toward greater allele sharing among the affected sibling pairs than expected (i.e., expected allele-sharing values are consistent with expected values dictated by Mendel’s laws). If some fraction of the sibling pairs’ genotypes are uninformative at the locus, then assigning them allele-sharing values consistent with expectation will bias the test toward the expected, null hypothesis outcome that there is no skewing toward greater allele sharing, just as in the case of the coin tosses! The problem with using expected allele-sharing values is not unique to affected sibling pair analyses; it carries over to regression and variance-component–analysis techniques for quantitative traits, although the effect of the bias is more subtle.
The problems inherent in the use of the traditional allele-sharing measures that we describe can be overcome, to some degree, through the use of weighting procedures, modified (and more appropriate) mixture models, and/or removing uninformative relative pairs from the analysis. These strategies are considered in more detail in the “Discussion” section. We argue that such strategies should motivate greater theoretical research into nonparametric linkage analysis methods.
Subjects and Methods
Autism Study Data
A sample of 122 affected sibling pairs was abstracted from the Autism Genetic Resource Exchange (AGRE). These sibling pairs were considered affected under the “narrow” definition of autism discussed on the AGRE Web site. For example-data analyses, we focused on 26 microsatellite markers collected on chromosome 2 for these sibling pairs.
Simulation Studies
A set of 200 affected sibling pairs was simulated under the assumption that a hypothetical disease was influenced by genes with the properties provided in table 1. Simulated fully informative parental marker data (assuming complete linkage of the marker and trait locus) were generated and, combined with simulated Mendelian segregation, were used to generate two hypothetical offspring—that is, sibling pairs. These sibling pairs were then ascertained, or “sampled,” on the basis of both individuals being affected by the disease. Allele-sharing values—that is,  values—were then computed. A fraction of the sibling pairs, chosen randomly from the 200, were then assigned allele-sharing values of p(0)=0.25, p(1)=0.50, and p(2)=0.25 (ultimately leading to assigned
  values of 0.5) to simulate a complete lack of allele-sharing information among sibling pairs in the sample. To investigate linkage of the disease to the simulated locus, we computed LOD scores by use of a simple multinomial mixture model. The relationship between the computed LOD scores and the fraction of uninformative sibling pairs was examined (as in fig. 5). The calculations for the multinomial-model–based LOD score were straightforward. Let n0, n1, and n2 (N=n0+n1+n2) be the observed number of affected sibling pairs sharing 0, 1, and 2 alleles IBD, respectively. The expected number of sibling pairs sharing 0, 1, and 2 alleles for N sibling pairs under the null hypothesis of no linkage follows a multinomial distribution with probabilities p0=0.25, p1=0.50, and p2=0.25. The maximum-likelihood estimates (MLEs) of p0, p1, and p2, for a sample of N affected sibling pairs, are simply
  ,
,  , and
, and  . The uninformative sibling pairs contribute values of 0.25, 0.50, and 0.25 to n0, n1, and n2. In this way, the uncertainty in allele-sharing values for the uninformative sibling pairs is accounted for in the construction of the test statistic by considering the possible allele-sharing values for each of these pairs and their associated probabilities. A likelihood-ratio-statistic–based LOD score for linkage at a single locus can be calculated (ignoring a constant) as follows:
 |
Here, it is understood that a deviation from expected values for expected sibling pairs, in which there is an excess of sibling pairs sharing 0 alleles, is not consistent with linkage. This simple simulation study focused on the effect of completely uninformative pairs in an analysis and therefore reflects a worst-case scenario. This was done to make certain points, not to provide a comprehensive survey of what could happen in any given data set. Essentially, most studies will have a mixture of completely and partially informative pairs in their data, so the results of our simulation studies are not unrealistic.
Table 1.
Parameter Values Used in the Simulation Studies to Assess the Impact of Noninformative Sibling Pairs on LOD Scores Calculated for 200 Affected Sibling Pairs and Estimates of Bias As a Function of the Frequency of Uninformative Sibling Pairs
|
LOD Score, by % Designated Uninformative |
||||||||||||
| 5% |
10% |
25% |
50% |
|||||||||
| Simulation | Disease Prevalence | Allele Frequency | Homozygote Penetrance | Phenocopy Frequency | Missinga | Expectedb | Missinga | Expectedb | Missinga | Expectedb | Missinga | Expectedb |
| 1 | .050 | .100 | .500 | .000 | 8.61 | 8.05 | 8.34 | 7.28 | 8.28 | 5.75 | 7.47 | 3.07 |
| 2 | .083 | .050 | .750 | .050 | 4.52 | 4.31 | 4.31 | 3.89 | 2.98 | 2.28 | 2.37 | 1.21 |
| 3 | .082 | .150 | .500 | .010 | 4.23 | 4.00 | 5.07 | 4.49 | 4.29 | 3.13 | 4.61 | 2.15 |
| 4 | .114 | .200 | .250 | .100 | .19 | .18 | .35 | .31 | .24 | .18 | .12 | .06 |
| 5 | .012 | .010 | .750 | .005 | 19.06 | 17.54 | 19.84 | 16.57 | 17.76 | 11.47 | 10.88 | 4.03 |
| 6 | .116 | .100 | .750 | .050 | 2.68 | 2.54 | 2.53 | 2.26 | 2.24 | 1.65 | 1.01 | .52 |
The LOD score achieved when the uninformative pairs are removed form the analysis.
The LOD score achieved when uninformative sibling pairs are kept in the analysis but expected allele-sharing probabilities are used for them in the construction of the LOD score.
Figure 5.

The effect of uninformative sibling pairs on the power of affected sibling pair LOD score statistics assessing linkage. The X-axis simply reflects the number of sibling pairs assigned a  value of 0.5 because of a lack of informativity. A, Each curve represents a different locus effect (in terms of risk of disease) on the basis of the hypothetical gene effects outlined in table 1. The heavy solid line represents simulation 1 with uninformative sibling pairs removed (missing); the solid line represents simulation 1 with uninformative sibling pairs assigned expected values (expected); the heavy dotted line represents simulation 2, missing; and the dotted line represents simulation 2, expected. B, Five simulations assuming the same genetic model (equivalent to simulation 2 in table 1) and showing variation in LOD score because of the random sampling of uninformative sibling pairs.
Results
The Calculation of 
The fundamental quantity in traditional nonparametric linkage analysis models, including variance-component models, is, as noted in the introduction, the fraction of alleles that are shared IBD between pairs of relatives. For expository purposes, we will focus on allele-sharing measures for sibling pairs, but our arguments and their implications apply to all pairs of relatives. For sibling pairs, this fundamental allele-sharing quantity is often referred to mathematically as  . In expectation, pairs of siblings should share half of their genes, and, hence,
  should be 0.5, on average, over the autosomal genome as a whole. Deviation of
  from 0.5 for any given sibling pair or set of sibling pairs at a particular locus reflects random Mendelian segregation of transmitted alleles. Since different sibling pairs may have
  values that deviate from 0.5 at different loci, variation in the average
  value for a group of sibling pairs will occur over the genome. This variation in the value of
  over the genome and across different sibling pairs can be used to form tests of linkage implicating a trait-influencing locus and a particular marker locus or genomic position: intuition suggests that siblings with similar phenotypes should share more alleles at loci encoding genes that influence those phenotypes.
To estimate  at a particular marker locus, one needs to compute the probabilities that the sibling pair shares 0, 1, or 2 alleles IBD. Let these probabilities be p0, p1, and p2. The value for
  can then be estimated as a simple weighted average:
Algebraic formulations for computing  from marker data have been discussed extensively in the literature (see, for example, the groundbreaking work of Haseman and Elston [1972]). If the marker data are completely informative (i.e., it is obvious which alleles were transmitted to the sibling pairs by their parents) then one of p0, p1, or p2 will equal 1.0, and
  will equal either 0.0, 0.5, or 1.0, respectively. If the marker data are not completely informative, then p0, p1, p2 will be <1 and the resulting
  values will tend to 0.5, the expected allele-sharing value for siblings. To estimate
  at a locus for which no genotype information is available, one can exploit “multipoint” statistical procedures. These procedures leverage information about
  at marker loci in the vicinity of the locus in question to draw inferences about
  at that locus. This is typically pursued either by using a simple weighted sum (Fulker et al. 1995; Olson 1995) or by considering all possible multilocus genotype and haplotype combinations that could have been transmitted to a pair of offspring and then computing their probabilities (Lander and Green 1987; Kruglyak and Lander 1998; Abecasis et al. 2002). The details of the weighted average approach are simple, and they expose aspects of the proposed problems associated with traditional nonparametric linkage statistics. Let
  be the allele-sharing fraction that is to be estimated at locus ℓ from
  values at K loci that neighbor ℓ on either side (denoted through subscripts,
  , that identify their positions relative to ℓ), then the basic multipoint weighted average formula can be represented as
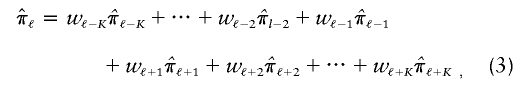 |
where  (j≠ℓ) is computed at the observed (genotyped) flanking marker loci. The value of wj is a weight assigned to each various
  , given knowledge about the distances in base pairs and the recombination frequencies between the loci j and the target locus, ℓ. If the value of each
  is not based on completely informative markers, and, hence, tends toward values of 0.5,
  will also tend toward a value of 0.5. In addition, because the estimate of
  is based, in part, on the probability of recombination occurring between the locus ℓ and the neighboring marker loci, which, although possibly small, will always be greater than 0, there will never be complete certainty or a lack of ambiguity in the fraction of alleles shared at locus ℓ. Thus,
  will tend toward 0.5 even if the neighboring marker loci used in the multipoint calculation are completely informative.
A Worst-Case Example of the Use of Expected Allele-Sharing Probabilities
As an example of problems encountered in assigning  values to sibling pairs with uninformative markers, consider the situation involving the doubly heterozygous mating in figure 1. The heterozygosity of the two offspring creates ambiguity in the fraction of alleles that they share IBD: the siblings either share 0 alleles, with 0.5 probability, or 2 alleles, with 0.5 probability. However, the conventional (and correct) estimate of the fraction of alleles shared by this sibling pair would be, from equation 2:
  . Oddly, though, the probability that this sibling pair shares 0.5 alleles (i.e., one allele out of two) is 0!
Figure 1.

A mating between individuals heterozygous for the same alleles at a single locus that produces two heterozygous offspring (A). In this situation, the fraction of alleles shared between the siblings is not known with certainty: the siblings either share 0 alleles with 0.5 probability (B) or 2 alleles with 0.5 probability (C). However, the conventional (and correct) estimate of the fraction of alleles shared by this sibling pair would be 
Algorithms for Computing Allele-Sharing Probabilities
The probabilities p0, p1, and p2, which are used to compute  values in single-point and multipoint settings, are provided to the user by many of the available nonparametric linkage analysis software packages and computer programs. Figure 2 displays a sample of the output from the programs ASPEX sib_ibd (Hinds and Risch 1996) and MERLIN (Abecasis et al. 2002) for a set of affected sibling pairs abstracted from a study on the genetic basis of autism. This output is merely representative of the complete output obtained from these programs, since it focuses on a single locus on chromosome 2 for a selected number of sibling pairs. Figure 2 shows that, for many loci, p0, p1, and p2 are <1.0, suggesting that there is ambiguity in the fraction of alleles that are shared IBD for these sibling pairs at this locus. This is not to suggest that the multipoint procedures implemented in these programs are incorrect but rather that they can only take advantage of the information about allele-sharing provided by the marker loci. If that information is lacking, multipoint procedures cannot overcome it. Of course, the way these programs take advantage of this information is based on different mathematical and statistical assumptions and constructs. Figure 3 provides scatter plots reflecting the agreement between values for
  , as computed by use of MERLIN, ASPEX sib_ibd, and ASPEX sib_phase, for 122 autistic sibling pairs at loci on chromosome 2. Figure 3a compares the results from MERLIN and ASPEX sib_ibd and suggests that there is considerable disagreement between these two procedures. Figure 3b compares the results from MERLIN and ASPEX sib_phase and suggests that, although there is better agreement in assigned
  values, both procedures agree that some sibling pairs (those inside the ovals) have been assigned values on the basis of a lack of information. Figure 4 provides a histogram reporting the number of sibling pairs assigned certain
  values and the frequency distribution of the variances in assigned
  for the 122 autistic sibling pairs. Ambiguity in allele-sharing assignments is evident from this figure in both the percentage of sibling pairs with
  values ≠0, 0.5, or 1, as well as in sibling pairs with a variance in
  that is >0.
Figure 2.

Example of output from MERLIN (A) and ASPEX sib_ibd (B) providing probabilities that a set of sibling pairs with autism share 0, 1, or 2 alleles IBD at a particular locus. Note that since the locus chosen was a locus at which marker data were available, results will therefore be more informative for allele sharing than a locus for which marker locus information is not available. Note also that, for the third sibling pair (family 17, sibling pair identifiers 3 and 4), MERLIN and ASPEX give discrepant probabilities, despite the use of the same marker loci.
Figure 3.

Scatter plots of the relationships and agreement between  estimates for 122 sibling pairs with autism, generated by use of MERLIN and either ASPEX sib_ibd (A) or sib_phase (B) options at a particular locus on chromosome 2.
Figure 4.

The frequency distributions of  values (A) and the variance in
  (B) for 122 affected sibling at a particular locus on chromosome 2. Varying degrees of ambiguity in allele-sharing assignments are reflected both in sibling pairs with
  values ≠0, 0.5, or 1 (A) and in sibling pairs with a variance in
  (B).
(B).
The Effect of Ambiguity in  on Linkage Analyses
As noted, when ambiguity in  exists for a large number of sibling pairs and expected values are used to guide relevant allele-sharing probabilities, the effect will be to bias the average
  for the entire collection of sibling pairs toward a value of 0.5. This occurs as a result of the fact that the three allele-sharing probabilities, p0, p1, and p2, assigned to individuals with uninformative marker data will tend to the expected values of 0.25, 0.50, and 0.25, respectively. The effect of this bias in
  toward values of 0.5 is most easily interpreted, and most intuitive, for cases involving the analysis of affected sibling pairs: the allele-sharing value 0.5, to which
  values obtained from uninformative markers and multipoint calculations tend, is the value implicated in the null hypothesis of no linkage! Thus, sibling pairs that have been assigned a
  value of 0.5 because of ambiguities in allele-transmission data weaken a linkage signal, despite the fact that these sibling pairs may actually harbor the relevant disease-susceptibility alleles at or near the marker loci used to assess allele sharing.
The degree to which a lack of marker informativity can influence a linkage signal can be explored in a straightforward manner via simulation studies. Figure 5a presents the relationship between LOD scores by use of 200 affected sibling pairs and the fraction of these affected sibling pairs that are completely uninformative (assigned  value of 0.5; see the “Subjects and Methods” section), by use of the hypothetical genetic models described in table 1. Figure 5 clearly shows a rapid decrease in evidence for linkage as a function of
  values biased toward 0.5, as well as considerable variation in the decrease in LOD score. This variation occurs because the assignment of a
  value of 0.5 to sibling pairs that are uninformative may involve the assignment of a value of 0.5 to pairs that actually share 0 alleles, hence increasing evidence for linkage. Thus, it is likely random which sibling pairs (i.e., those that actually share 0, 1, or 2 alleles IBD at a disease-relevant locus) will be uninformative at a given marker locus, including those carrying disease-relevant alleles. We explored this phenomenon further by simulating different sets of 200 sibling pairs whose hypothetical disease was influenced by the same genetic mechanism and then considering the relationship between the decay in LOD score and the fraction of uninformative sibling pairs. Figure 5b plots the results from five different simulations, showing the variation in the decay of linkage evidence. Although this phenomenon is considered further in the “Discussion” section, one can conceptualize the problem of a lack of allele-sharing information and the assignment of
  as one in which measurement error (i.e., trying to estimate
  from uninformative markers) confounds the detection of a “signal” (i.e., the actual allele-sharing value).
To show that the practice of using expected allele-sharing values in the construction of linkage statistics results in a true bias (and not just a power loss because of a lack of marker genotype information and a consequent reduction in sample size) we simply compared LOD scores computed when sibling pairs with uninformative genotype data are removed from an analysis to those computed when they are kept in the analysis but have expected allele-sharing probabilities. The results are provided in table 1, and they show that there is a considerable loss of power (i.e., a drop in LOD score) associated with the traditional practice of keeping uninformative sibling pairs in an analysis with expected allele-sharing values. This drop in LOD score is more dramatic than that associated with the exclusion of these uninformative sibling paris and is thus due to a bias, not a sample-size–related power loss.
Obviously, our simulation studies examining the effect of completely uninformative sibling pairs in an affected sibling pair study should be complemented by studies investigating, for example, partially informative sibling pairs and other analysis contexts, such as Haseman-Elston regression tests for linkage involving a quantitative trait (Haseman and Elston 1972). The effect of uninformative assigned  values on quantitative trait linkage analysis can be anticipated, however. For Haseman-Elston regression analysis, assignment of
  values biased toward 0.5 will essentially “flatten” the regression toward the null hypothesis slope value of 0 (the same applies to mixture models that merely consider all possible allele-sharing values if the probabilities of those allele-sharing values are expected values). For variance-component analysis, bias in
  values toward expected values will cause the locus-specific allele-sharing coefficient matrix to have entries very close to those in the general kinship coefficient used to model residual genetic effects (Blangero et al. 2001). This would make it difficult to distinguish specific locus effects from general genetic background effects, hence depleting evidence for specific locus effects.
A Practical Example: Affected Sibling Pairs with Autism
We also examined the effect of ambiguity in  values on an actual affected sibling pair linkage study. We computed
  values for 122 affected sibling pairs in a genomewide linkage study of autism, but we limited attention to chromosome 2. Figure 6a plots the fraction of sibling pairs with at least one of the three allele-sharing probabilities (i.e., the probability of sharing 0, 1, or 2 alleles IBD) >0.95 (solid line), >0.75 (dashed line), and >0.5 (dotted line) at loci on chromosome 2. Clearly, imprecise assignments of
  exist in this data set for chromosome 2 because of ambiguity in allele sharing. The effect of this ambiguity on evidence for linkage is depicted in figure 6b. Subsets of the affected sibling pairs were considered in the calculation of a simple t statistic assessing the departure of the average
  value from 0.5, on the basis of confidence in their assigned individual
  values. In this figure, confidence in assigned
  values was assessed on the basis of the variance associated with the assigned
  values (a variance of 0 would indicate that one of the three allele-sharing probabilities was equal to 1.0). As can be seen in figure 6b, although no linkage signal emerged from the analysis, evidence for linkage was influenced by the inclusion and/or exclusion of sibling pairs with ambiguous
  values.
Figure 6.

A, Number of affected sibling pairs with at least one of the three allele-sharing probabilities (i.e., sharing 0, 1, or 2 alleles) IBD greater than 0.95 (solid line), 0.75 (dashed line), and 0.5 (dotted line) for the autism data on chromosome 2. The horizontal line corresponds to the number of sibling pairs in the study. B, Affected sibling pair t statistic values assessing the departure of the average  value from the “no linkage” null hypothesis value for all sibling pairs (dashed line), sibling pairs with
  variance values ⩽ 0.10 (dotted line), and sibling pairs with
  variance values ⩽0.05 (solid line) for chromosome 2.
Discussion
The phenomenon discussed in this paper—the influence of a lack of marker informativity on assigned relative-pair  values and nonparametric linkage statistics—invites comparison to the effects of marker informativity on traditional parametric linkage analyses. For example, it is well known that the contribution to the overall LOD-score obtained in parametric linkage settings will simply be 0 for pedigrees with uninformative marker information. Although a LOD score of 0 is not consistent with linkage in parametric settings, and, hence, uninformative families detract from a linkage signal in parametric settings as well, there is greater concern in the assignment of
  values to sibling pairs with uninformative-marker loci in constructing nonparametric linkage statistics. This is both because of the bias inherent in the use of expected allele-sharing values and the variation, or “noise,” in linkage signals associated with the fact that different relative pairs will provide more or less information to a linkage signal (and hence more or less bias) at different loci. Thus, as noted, for some sibling pairs, an assigned
  value of 0.5 on the basis of expectation (and not on the basis of informative-marker information) may actually provide greater evidence for linkage for that sibling pair (e.g., consider the case where those sibling pairs would reveal a
  value of 0 if markers were informative but instead are assigned a value of 0.5 because of the practice of using expected values in the face of a lack of informativity). Thus, lack of marker informativity and the use of ambiguously assigned
  values in nonparametric linkage analysis create variation in linkage signals that uninformative pedigrees do not create in parametric linkage analysis settings.
There is an important caveat in assessing the impact of uninformative sibling pairs on nonparametric linkage analyses. Claiming “no evidence for linkage” on the basis of, for example, insignificant test statistics in nonparametric linkage analyses that use allele-sharing values, needs to be qualified: if, in fact, there is a problem with marker informativity in a relevant nonparametric linkage study, then the bias toward the null hypothesis of no linkage should not actually be taken as evidence for no linkage. In this light, statistical geneticists should define “exclusion criteria” for linkage in nonparametric linkage settings that would be analogous to the exclusion criteria (e.g., a LOD score <−2.0) used in parametric settings. There are potential ways of overcoming the bias we discuss. We describe five methods below, all of which demand greater attention.
Identifying Genomic Areas for Which Marker Data Are Uninformative
As part of a linkage study, one could critically examine the information content of the markers by use of the strategies described by Kruglyak et al. (1996) and Rijsdijk and Sham (2002) and note areas of the genome for which there is a lack of genotypic information. In addition, one could simply examine, for each relative pair, the computed allele-sharing probabilities p0, p1, and p2, as well as the assigned  values, that go into the construction of a linkage statistic (e.g., fig. 2) to identify both areas of the genome and particular relative pairs that contribute to potential bias in the test statistics.
Removing Uninformative Relative Pairs
An easy solution—one discussed in the context of the coin-flip example detailed in the introduction—is simply to remove from the analysis sibling pairs that have been assigned allele-sharing probabilities and values consistent with expectation because of a lack of marker genotype information. As discussed, the loss in power resulting from a smaller sample size may not be as great as the loss in power resulting from the bias toward the null hypothesis of no linkage when uninformative relative pairs are kept in the analysis but with assigned allele-sharing probabilities consistent with expectation (table 1). Removal of relative pairs can be problematic if the relative pairs are not completely uninformative, since one would have to make a potentially arbitrary decision as to the “level” of informativity that must be surpassed for a pair to be considered in the calculation of a test statistic.
Downweighting Uninformative Relative Pairs
Instead of removing uninformative relative pairs from an analysis, one could “downweight” their contribution to a linkage test statistic by taking advantage of some measure of the degree of confidence in assigned  values (e.g., the inverse of the variance in assigned
  value). The determination of an optimal method for weighting the relative pairs, however, may be complicated, in that there are an infinite number of ways one could potentially assign confidence levels to allele-sharing probabilities, with some being more advantageous than others in certain situations.
Using Appropriate Mixture Models
As emphasized, the use of a mixture model in the construction of a relevant linkage test statistic will not overcome the bias problem we raise if the allele-sharing probabilities, or “mixing weights,” used to evaluate the mixture have been assigned on the basis of expected allele-sharing values. However, mixture models do help in certain (rare) situations, including the “double heterozygote mating with two heterozygous offspring” example discussed in the context of figure 1: using a simple  value for the two siblings leads to the absurd result that they share 1 allele, whereas considering the true (and valid) allele-sharing possibilities of 0 and 2 alleles for this pair in a mixture model makes more sense. There are, however, very serious issues in the formulation of the type of mixture model used currently in linkage analysis (e.g., the formulation discussed in Kruglyak et al. 1996). Mixture models in nonparametric linkage analyses use information about allele-sharing probabilities computed solely on the basis of marker genotype data (e.g., from Mendel’s laws with parental genotypes, from multipoint calculations using flanking genotype information that account for recombination, etc.). If there are any uncertainties in this genotype data, they are supplanted or dealt with by resorting to expected values in relevant calculations, as this study has made clear. Probabilities of various genotype configurations then act as “mixing weights” in nonparametric linkage analysis mixture models. This is where the problem lies. For most mixture model formulations, some additional or ancillary piece of information is brought into the relevant computations to inform the calculation of the mixing weights. For example, in most mixture models involving a quantitative trait, the actual quantitative values of the trait in question are used to inform the mixing weights; for example, individuals with higher trait values are assumed to have a higher probability of belonging to a group whose average trait value is higher than individuals in other groups (see, e.g., Titterington et al. 1985 and numerous references therein). This is simply not done in nonparametric linkage analysis mixture models, although it could be. Thus, if one had, for example, data that included both phenotypically concordant and discordant sibling pairs, and if, for some of those sibling pairs, there was ambiguity in their allele-sharing status, then an appropriately formed maximum-likelihood–based mixture model might consider the possibility that the discordant pairs are more likely to share fewer alleles and the concordant pairs are more likely to share more alleles. As such, the phenotypic information would help guide the assignment to ambiguous allele-sharing probabilities that are meant to capture linkage information about the phenotype in question. One could formulate such a model, compute relevant MLEs under an appropriate null and alternative hypothesis, and test for linkage in the usual way. Such a strategy could, to some degree, overcome the bias problem that we have discussed. By not allowing the information about relative-pair phenotypic similarity to help guide the assignment of allele-sharing probabilities (and vice versa), traditional mixture model–based linkage statistics suffer from biases induced by the use of expected allele-sharing values that are based on genetic information alone, which are, ironically, meant to overcome ambiguities in those allele-sharing probabilities.
Using a Denser Genetic Map
The best way to avoid, but not completely alleviate, the bias issue we discuss is to conduct a study in which minimal amounts of marker genotype uninformativity will occur. Such a study might involve aspects of the methods discussed above but perforce would involve the use of a greater density of polymorphic markers that are not prone to genotyping errors. This would, however, raise the expense of the study.
The phenomenon of random variation in marker informativity at sites around the genome for a given collection of sibling pairs also raises broader issues in genome scans, since different sets of sibling pairs will contribute different linkage information over the genome. This phenomenon is as true for parametric linkage analysis as it is for nonparametric linkage analysis, and it explains why such tremendous variation—in, for example, genomewide LOD plots—is typically observed. Unfortunately, such genomewide variation in contribution to the linkage statistic has far-reaching implications for linkage studies. If one wanted to investigate epistasis or gene-gene interaction by using, for example, allele-sharing information at two or more loci, then it might be highly unlikely that the same set of sibling pairs will be informative for allele sharing at all those loci. This occurrence would clearly confound the ability to detect epistasis—a phenomenon that is known to be difficult to detect, in the first place, because of power issues.
The issue discussed in this paper does invite some very harsh and radical conclusions. Thus, not only should future studies planning to use nonparametric linkage analyses take stock of potential biases resulting from the use of relative-pair allele-sharing probability assignments rooted in expected values, but also researchers who have actually conducted relevant linkage studies in the past and who ignored or were not aware of this problem should go back and revisit their analyses.
Acknowledgments
This work was motivated by experiences and research conducted within the following large-scale human genetics research programs: National Heart, Lung, and Blood Institute (NHLBI) Family Blood Pressure Program (FBPP [HL64777-01]); the NHLBI hypertension Specialized Centers of Research (SCOR) program (HL54998); the National Institutes of Health (NIH) Pharmacogenetics Network (HL69758-01); the NIH-funded Linkage Analysis of Familial Psoriasis Program (HL69758-01); the National Institute of Mental Health (NIMH) Consortium on the Genetics of Schizophrenia (COGS [1 R01 MH06557-01A1]); the NIH-funded study on Human Telomere Genetics (funding pending); and the NIMH Bipolar Consortium (2 RO1 MH059567-52A). We also acknowledge the Autism Genetic Resource Exchange. The authors would like to thank Dr. Carol Mathews for discussions about the analysis of the families with autism and Drs. Hemant Tiwari, Danielle Fallin, Aravinda Chakravarti, and the Chakravarti lab for comments and criticisms.
Electronic-Database Information
The URL for data presented herein is as follows:
- Autism Genetic Resource Exchange (AGRE), http://www.agre.org
References
- Abecasis GR, Cherny SS, Cookson WO, Cardon LR (2002) Merlin—rapid analysis of dense genetic maps using sparse gene flow trees. Nat Genet 30:97–101 10.1038/ng786 [DOI] [PubMed] [Google Scholar]
- Blangero J, Williams JT, Almasy L (2001) Variance component methods for detecting complex trait loci. Adv Genet 42:151–181 [DOI] [PubMed] [Google Scholar]
- Fulker DW, Cherny SS, Cardon LR (1995) Multipoint interval mapping of quantitative trait loci, using sib pairs. Am J Hum Genet 56:1224–1233 [PMC free article] [PubMed] [Google Scholar]
- Haseman JK, Elston RC (1972) The investigation of linkage between a quantitative trait and a marker locus. Behav Genet 2:3–19 [DOI] [PubMed] [Google Scholar]
- Hinds D, Risch N (1996) The ASPEX package: affected sib-pair mapping. ftp://lahmed.stanford.edu/pub/aspex (accessed January 8, 2004)
- Kruglyak L, Daly MJ, Reeve-Daly MP, Lander ES (1996) Parametric and nonparametric linkage analysis: a unified multipoint approach. Am J Hum Genet 58:1347–1363 [PMC free article] [PubMed] [Google Scholar]
- Kruglyak L, Lander ES (1998) Faster multipoint linkage analysis using Fourier transforms. J Comput Biol 5:1–7 [DOI] [PubMed] [Google Scholar]
- Lander ES, Green P (1987) Construction of multilocus genetic linkage maps in humans. Proc Natl Acad Sci USA 84:2363–2367 [DOI] [PMC free article] [PubMed] [Google Scholar]
- Lander ES, Schork NJ (1994) Genetic dissection of complex traits. Science 265:2037–2048 [DOI] [PubMed] [Google Scholar]
- Olson JM (1995) Robust multipoint linkage analysis: an extension of the Haseman-Elston method. Genet Epidemiol 12:177–193 [DOI] [PubMed] [Google Scholar]
- Rijsdijk FV, Sham PC (2002) Estimation of sib-pair IBD sharing and multipoint polymorphism information content by linear regression. Behav Genet 32:211–220 10.1023/A:1016073113019 [DOI] [PubMed] [Google Scholar]
- Risch N, Botstein D (1996) A manic depressive history. Nat Genet 12:351–353 [DOI] [PubMed] [Google Scholar]
- Risch N, Merikangas K (1996) The future of genetic studies of complex human diseases. Science 273:1516–1517 [DOI] [PubMed] [Google Scholar]
- Schork NJ, Chakravarti A (1996) A nonmathematical overview of modern gene mapping method techniques used in humans. In: Mockrin S (ed) Molecular genetics and gene therapy of cardiovascular diseases. Marcel Dekker, New York, pp 79–109 [Google Scholar]
- Sengul H, Weeks DE, Feingold E (2001) A survey of affected-sibship statistics for nonparametric linkage analysis. Am J Hum Genet 69:179–190 [DOI] [PMC free article] [PubMed] [Google Scholar]
- Titterington DM, Smith AFM, Makov UE (1985) Statistical analysis of finite mixture distributions. Wiley and Sons, New York [Google Scholar]
- Weeks DE, Lange K (1988) The affected-pedigree-member method of linkage analysis. Am J Hum Genet 42:315–326 [PMC free article] [PubMed] [Google Scholar]
- Whittemore AS (1996) Genome scanning for linkage: an overview. Am J Hum Genet 59:704–716 [PMC free article] [PubMed] [Google Scholar]