Abstract
Despite the theoretical evidence of the utility of single-nucleotide polymorphisms (SNPs) for linkage analysis, no whole-genome scans of a complex disease have yet been published to directly compare SNPs with microsatellites. Here, we describe a whole-genome screen of 157 families with multiple cases of rheumatoid arthritis (RA), performed using 11,245 genomewide SNPs. The results were compared with those from a 10-cM microsatellite scan in the same cohort. The SNP analysis detected HLA*DRB1, the major RA susceptibility locus (P=.00004), with a linkage interval of 31 cM, compared with a 50-cM linkage interval detected by the microsatellite scan. In addition, four loci were detected at a nominal significance level (P<.05) in the SNP linkage analysis; these were not observed in the microsatellite scan. We demonstrate that variation in information content was the main factor contributing to observed differences in the two scans, with the SNPs providing significantly higher information content than the microsatellites. Reducing the number of SNPs in the marker set to 3,300 (1-cM spacing) caused several loci to drop below nominal significance levels, suggesting that decreases in information content can have significant effects on linkage results. In contrast, differences in maps employed in the analysis, the low detectable rate of genotyping error, and the presence of moderate linkage disequilibrium between markers did not significantly affect the results. We have demonstrated the utility of a dense SNP map for performing linkage analysis in a late-age-at-onset disease, where DNA from parents is not always available. The high SNP density allows loci to be defined more precisely and provides a partial scaffold for association studies, substantially reducing the resource requirement for gene-mapping studies.
Introduction
The standard method of identifying disease genes routinely involves a whole-genome scan using a set of 300–400 microsatellite markers evenly spaced across the genome, genotyped in pedigrees with multiple affected members. This approach has led to great success in mapping Mendelian single-gene disorders, but the identification of disease susceptibility genes for complex traits has proven more challenging (Botstein and Risch 2003). One of the key factors contributing to the difficulty of detecting genes for complex phenotypes is the relatively low genetic relative risk conferred by each locus. Another practical consideration is the decrease in power due to incomplete pedigrees, especially in diseases of late age at onset, where parents are often unavailable. Genotyping more families or adding additional markers to increase the information content (IC) are useful methods of increasing the likelihood of detecting true susceptibility loci.
Since SNPs offer more rapid and highly automated genotyping than microsatellites, it has been proposed that SNP-based linkage analysis could be performed to map disease loci. A theoretical study has predicted that approximately two to three times the density of SNPs with a heterozygosity of 0.50 would be equivalent to the current microsatellite marker sets (Kruglyak 1997). Two recent publications describe dense SNP marker sets (Kennedy et al. 2003; Matise et al. 2003), and, with the availability of novel approaches for large-scale, high-throughput genotyping, there now exists the possibility of testing the utility of SNP-based whole-genome linkage studies. We describe the first application of this technology to whole-genome linkage analysis of a complex disease through use of a cohort of multicase families with rheumatoid arthritis (RA [MIM 180300]) previously analyzed in a standard microsatellite-based whole-genome scan. The recently described microarray-based genotyping technology, termed “whole-genome sampling analysis” (WGSA), uses one generic primer to amplify >10,000 SNPs in a single reaction (Kennedy et al. 2003). The genotype-calling algorithm is fully automated with >99% accuracy, providing an ideal method for performing rapid linkage analysis on large numbers of samples. The microsatellite-based whole-genome linkage analysis of these families found the strongest evidence for linkage at 6p23 (P<.00001), over the well-recognized susceptibility locus, HLA*DRB1, and several other putative loci (P<.05) (Mackay et al. 2002). Repeating this scan with SNPs allows a direct comparison of their performance with that of microsatellites, within the same cohort and using the same analytical methods.
RA is a common chronic inflammatory disease primarily affecting the joints. It shares many features with other complex genetic traits—for example, twin and family studies have shown that RA has a moderate heritable component, with λs (relative risk to siblings) values ranging from 5 to 10 (Wordsworth and Bell 1991; Seldin et al. 1999). RA is also a condition with a relatively late age at onset, making the collection of complete nuclear families difficult. This feature is also typical of many other common complex diseases. Thus, RA is a useful paradigm in which to study cohorts with incomplete inheritance information as well as to replicate an undisputed causative locus. HLA*DRB1 is estimated to account for ∼30% of the genetic component of this autoimmune disease. Modeling studies and three other whole-genome scans suggest that no other single locus will make a contribution as large as HLA (Cornelis et al. 1998; Shiozawa et al. 1998; Jawaheer et al. 2001, 2003; Mackay et al. 2002). The HLA locus, therefore, provides a useful benchmark by which to compare methods.
Methods
Patient Samples
One hundred fifty-seven multicase families with RA recruited into the Arthritis Research Campaign National Repository for families with RA (Worthington et al. 1994) were used in this study. There were two to six affected sibs per family, and 37% of the families had DNA available from one or both parents (34 families had DNA from one parent and 24 families had DNA from both parents). In addition, DNA from 143 unaffected siblings was available for families with missing parental genotype data. All of these samples had been previously genotyped at HLA*DRB1 and with the ABI linkage mapping panel version 2, comprised of 365 microsatellite markers spaced at 10-cM intervals across the genome (Mackay et al. 2002).
Genotyping
We used WGSA to genotype all samples on precommercial arrays, as described by Kennedy et al. (2003). Two-hundred and fifty nanograms of starting genomic DNA per array is required for genotyping. Later in the study, a subset of samples was also genotyped on commercial Affymetrix Mapping 10K arrays, which contained a set of SNPs that underwent further validation in product development (Matsuzaki et al. 2004). Only those SNPs shared in common between the precommercial and commercial arrays were used in this analysis.
Map Construction
SNP genetic map positions were interpolated on the deCode genetic framework map (Kong et al. 2002), through use of their physical positions. Only 10,423 of the genotyped SNPs had unique physical map positions on National Center for Biotechnology Information (NCBI) genome build 33; all initial linkage analysis, unless otherwise noted, was performed using this map. The median marker spacing of SNPs on this map is 0.118 cM (95% CI 0.1126–0.1253), and the mean heterozygosity is 0.35.
To reduce the IC of the SNPs, a 1-cM SNP map containing 3,300 SNPs was generated by dividing the genome into 1-cM bins and retaining the SNP with the maximum heterozygosity from each bin. If only one SNP mapped to a bin, it was included; if no SNP mapped to a 1-cM interval, the bin was ignored. To assess whether different map constructions affected the linkage results, we also built interpolated SNP maps based on the Marshfield microsatellite framework map, as well as through use of physical positions on an earlier genome build (NCBI build 31).
Genotype Error Detection
SNPs used in this study were validated to >99% accuracy when assessed by several different criteria (Kennedy et al. 2003). Since even low levels of genotype error can reduce power in a linkage study, we sought to identify and remove as many errors as possible prior to linkage analysis. All genotype data were initially analyzed using PEDCHECK (O’Connell and Weeks 1998); errors were eliminated by removing all genotypes from both siblings for a SNP with a Mendelian inconsistency. Since SNPs are biallelic and a significant proportion of the pedigrees lack parental genotype data, Mendelian inheritance checking will fail to detect all erroneous genotypes. Thus, to supplement PEDCHECK, we subsequently utilized the error-checking algorithm implemented in Merlin, which identifies unlikely genotypes on the basis of double recombination events (Abecasis et al. 2002). The default parameters were used in Merlin, which corresponds to the exclusion of genotypes where the likelihood ratio of an erroneous genotype is P⩽.025; therefore, only a small proportion of these unlikely genotypes were, in fact, likely to be true genotypes. To test the effect of genotyping error on the results, the data were reanalyzed in two ways. First, we retained the unlikely genotypes detected by Merlin. Second, we removed both the unlikely genotypes and 232 SNPs with a Mendelian inheritance error rate of >2%. These 232 SNPs accounted for 7% of all inheritance errors, with >10 errors per SNP (maximum of 28 errors per SNP). The majority of errors (24,900, or 76%) were due to a small number of errors per SNP (1–4).
Linkage Analysis
Nonparametric linkage analysis, as implemented in MERLIN, was used in all analyses (Abecasis et al. 2002). Allele frequencies were generated using all genotyped individuals, and scans were performed using the Whittemore and Halpern “all” statistic (Whittemore and Halpern 1994). Because of the high density of the map, scanning was performed at each marker, with no estimates between markers. Entropy, a measure of IC, was also calculated in Merlin. Files reporting the chromosomal positions, genetic map positions, Z-mean scores, and entropy values (IC) calculated for all of the microsatellites and SNPs used in the linkage analysis are given as tables A and B (online-only tab-delimited ASCII files that can be imported into spreadsheets), respectively. The microsatellite whole-genome scan was also reanalyzed with Merlin, using the same genetic map (deCode), analysis parameters, and genotype error detection method.
Investigation of Linkage Disequilibrium (LD)
The pairwise LD statistics D′ and r2 were calculated for all markers through use of HelixTree software (Golden Helix Web site). Haplotype blocks were defined as regions in which all SNP pairs had an LD correlation coefficient r2 value of ⩾0.4. To determine the effect of LD on the results of the linkage analysis, SNPs in regions of high LD under peaks of linkage were treated in two ways; first, all but the middle SNP from a region of LD was excluded from linkage analysis. Second, we used the EM algorithm implemented in SNPHAP (D. Clayton's Web site) to assign haplotypes to unrelated individuals. Haplotype assignments were then included in the linkage analysis as a multiallelic marker. Since low-probability haplotype assignments result in high rates of Mendelian errors, we included only individuals with >50% probability for a given haplotype assignment. To ensure that the EM algorithm was producing robust estimates of haplotype frequencies, random subsets of the cohort were selected and the haplotype frequencies compared. There were no statistically significant differences between haplotype frequency estimations in random subsets of the data (authors' unpublished data).
Investigation of Association
Association of SNP haplotypes in regions of high LD under the peak of linkage at chromosome 6p was investigated. One hundred fourteen unrelated affected probands were compared with 81 unrelated unaffected parents as a case-control cohort. A region spanning 40 cM, centered at the 6p peak of linkage, was delineated and found to contain 106 SNPs. Markers deviating from Hardy-Weinberg equilibrium in the case (n=114) and the control (n=81) sample groups, after correction for multiple testing, were excluded from further analysis. The HelixTree software package was used to determine LD patterns under the 6p peak of linkage in the control group. Regions of high LD, in which all pairwise r2 LD coefficient values are >0.4, were identified. Haplotypic associations of the SNPs residing in these regions were subsequently investigated in the case-control cohort through use of haplotype trend regression (Excoffier and Slatkin 1995; Zaykin et al. 2002) implemented in HelixTree software. Associated intervals were then analyzed using SNPHAP in cases and controls separately, to assign haplotypes to individuals. Frequencies of haplotypes with a probability assignment >90% were then compared through use of the χ2 test in Stata 8 (StataCorp 2003).
Results
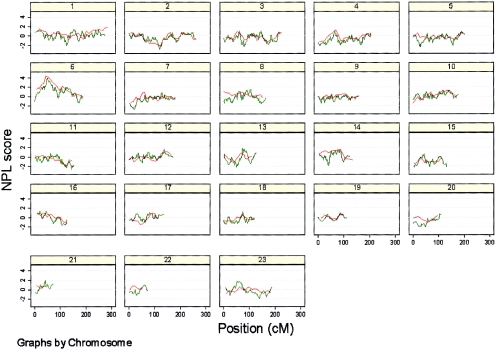
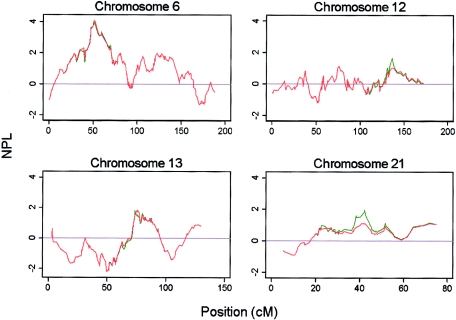
We used the recently described WGSA method to rapidly genotype a total of 550 individuals from 157 families for 11,245 SNP markers. Of the 6.2 million attempted genotypes, 5.6 million genotypes were called by the algorithm, resulting in an overall call rate of 91%. The range of call rates per chip was 84.5%–97%. Potential genotype errors were identified by PEDCHECK (14,210; 0.25%) and Merlin (18,356; 0.35%) and removed prior to analysis. We performed a nonparametric linkage analysis for all chromosomes, through use of the interpolated deCode NCBI build 33 map for the SNPs, and also reanalyzed the previous microsatellite data through use of the same parameters. Overall, there was good concordance between the SNP and microsatellite genome scans, with some minor qualitative differences (table 1; fig. A [online only]).
Table 1.
Maximun NPL Scores for All Loci with Increased Allele Sharing at P<.05 for SNP (n=10,423) and Microsatellite (n=360) Linkage Analysis[Note]
| SNP |
Microsatellite |
1-cM SNPa |
Including Unlikely Genotypesb |
Excluding SNPs with a >2%Error Ratec |
||||||
| Locus andPosition(in cM) | NPLScore | P | NPLScore | P | NPLScore | P | NPLScore | P | NPLScore | P |
| 1q: | ||||||||||
| 152 | 1.37 | .09 | 1.84d | .03 | .86 | .002 | 1.61 | .05 | 1.37 | .08 |
| 6p: | ||||||||||
| 51 | 3.97 | .00004 | 4.22 | .000 | 3.54 | .0002 | 3.75 | .00009 | 3.89 | .00005 |
| 6q: | ||||||||||
| 79 | 2.02 | .02 | 2.15 | .02 | 2.51 | .006 | 1.79 | .04 | 1.98 | .02 |
| 106 | 1.8 | .04 | 2.33 | .01 | 1.51 | .07 | 1.47 | .07 | 1.71 | .04 |
| 123 | 2.02 | .02 | 1.49 | .07 | 1.44 | .08 | 2.01 | .02 | 1.92 | .03 |
| 12q: | ||||||||||
| 136 | 1.68 | .05 | 1.21 | .11 | 1.02 | .2 | 1.52 | .06 | 1.25 | .11 |
| 13q: | ||||||||||
| 75 | 1.86 | .03 | .56 | .3 | 1.38 | .09 | 1.61 | .05 | 1.83 | .03 |
| 14q: | ||||||||||
| 77 | 1.5 | .07 | 1.55 | .06 | 1.44 | .07 | 1.66 | .04 | 1.47 | .07 |
| 21: | ||||||||||
| 42 | 1.98 | .02 | .87 | .2 | .89 | .2 | 1.47 | .07 | 2.02 | .02 |
| Xp: | ||||||||||
| 53 | 1.77 | .04 | .49 | .3 | 1.34 | .09 | 1.82e | .03 | 1.78 | .04 |
Note.— All analysis was performed using the deCode interpolated map based on NCBI build 33 of the genome.
The 1-cM SNP map contained 3,300 SNPs.
The 18,356 unlikely genotypes identified by Merlin were included in the analysis.
The 232 SNPs with an observed error rate of >2% were removed from the SNP analysis.
At position 285 cM.
At position 61 cM.
Figure A.
Multipoint NPL scores for SNPs (green) and microsatellites (orange) for all 23 chromosomes.
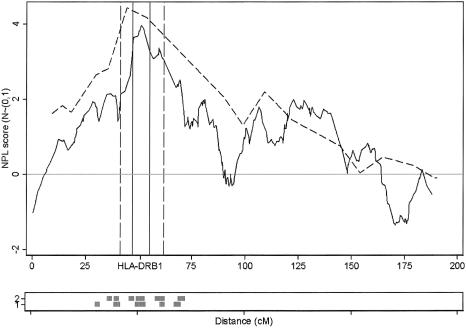
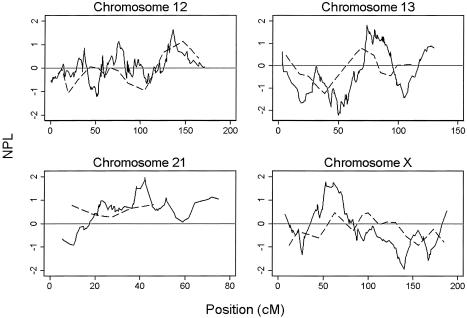
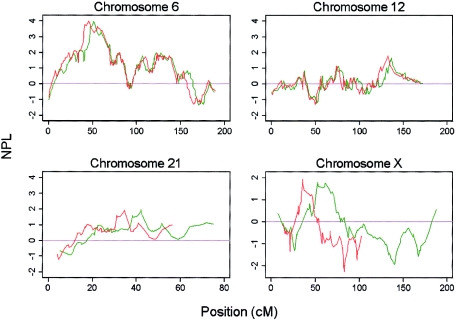
The HLA locus was detected through use of the SNPs at a genomewide significance level (P=.00004), and with a slightly lower nonparametric linkage (NPL) score than the microsatellite scan (3.97 vs. 4.22 [fig. 1]). The maximum NPL score for the SNPs mapped directly over the HLA*DRB1 locus (fig. 1). The peak was also better defined for the SNPs; this difference was most striking for the 1-LOD interval (the SNP 1-LOD interval was 8 cM, compared with a 21-cM 1-LOD interval in the microsatellite scan) but still applied when the 3-LOD interval was used (31 cM in the SNP scan, compared with 50 cM in the microsatellite scan). Eight other regions showed some evidence of increased allele sharing at a nominal significance level (P<.05) on either the SNP or microsatellite scan or both (table 1; fig. 2). There are several possible explanations for the differences in results between scans: differences in genotyping error rates, differences between maps, differences in IC, and finally, the presence of LD between closely spaced SNPs. These factors were investigated in more detail.
Figure 1.
Multipoint NPL scores on chromosome 6 for SNPs (solid line) and microsatellites (dashed line). HLA*DRB1 maps directly under the SNP maximum NPL score. Vertical lines indicate 1-LOD intervals. The lower panel indicates regions of LD defined by clusters of SNPs where all pairwise correlations were >0.4.
Figure 2.
Multipoint NPL scores for chromosomes 12, 13, 21, and X, demonstrating differences observed in allele sharing between SNPs (solid line) and microsatellites (dashed line).
Genotyping Errors
Several accuracy measurements for WGSA genotyping technology estimated the overall genotyping error rate to be <1% (Kennedy et al. 2003). To test the effect of genotyping error on the results, the data were reanalyzed in two ways. First, we retained the unlikely genotypes detected by Merlin; this resulted in the loss of significance of two regions of linkage, on chromosomes 6q and 21 (table 1). No new regions were detected at a significance level of P<.05. These data suggest that removal of unlikely genotypes, as detected by Merlin, can increase the significance of nominal loci and further confirms the detrimental effect of genotyping error on linkage results. Likewise, removal of 232 SNPs with a detected error rate of >2% resulted in a modest decrease in NPL score on chromosome 12. Interestingly, three of the removed SNPs were located in the 5-cM region spanning the 136-cM peak of linkage on chromosome 12, underscoring the importance of error analysis in interpreting linkage results. The error rate for microsatellites in the original genome scan ranged from 0% to 3% for individual markers (Mackay et al. 2002).
Interpolated Genetic SNP Maps
It is well recognized that errors in marker order or intermarker distances in maps can lead to a loss of power to detect linkage (Daw et al. 2000). We used four SNP maps in this study to assess the effect of map construction on the linkage results. All four maps were interpolated, through use of one of two genetic framework microsatellite maps (deCode and Marshfield) and one of two physical maps (NCBI builds 31 and 33). We then reanalyzed the raw SNP data through use of the four map combinations. Comparison of the NCBI build 31 and build 33 maps revealed virtually no differences in the number of linkage peaks or in their levels of significance (fig. B [online only]), consistent with the observation that SNP positions did not change significantly between the two builds (authors' unpublished data). In contrast, SNP positions did change when the two different genetic framework maps were used (mean 1.08 cM; median 0.91 cM), and, as expected, there were differences in the positions of the maximum NPL peaks (fig. C [online only]). There were no substantial differences in the number of linkage peaks or in their levels of significance.
Figure B.
Comparison of multipoint NPL scores for SNPs, using NCBI genome builds 31 (orange) and 33 (green).
Figure C.
Comparison of multipoint NPL scores for SNPs, using the deCODE (green) and Marshfield (orange) genetic maps for interpolation of SNP marker positions.
IC
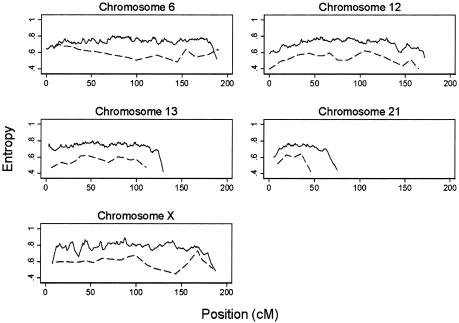
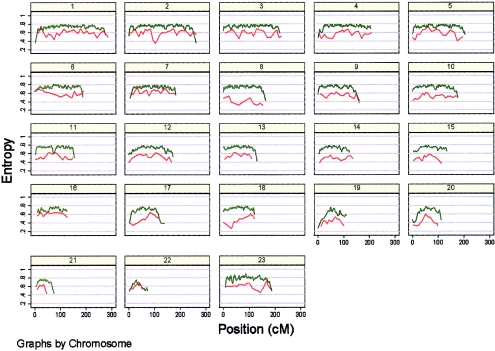
One of the predicted advantages of using a high-density SNP map is to increase the IC over that of conventional microsatellite sets; this increased IC could, in principle, explain some of the modest differences we observe between the two genome scans. Entropy, a measure of IC, was calculated using Merlin for both microsatellites and SNPs on all chromosomes. Figure 3 shows the entropy plots for chromosomes 6, 12, 13, 21, and X, where evidence for linkage differed between the SNP and microsatellite scans. IC for the SNPs is significantly and uniformly higher than for microsatellites; the mean genomewide entropy is 0.75 (95% CI 0.68–0.79; SD 0.42) for the SNPs and 0.54 (95% CI 0.55–0.57; SD 0.09) for microsatellites (also see fig. D [online only]).
Figure 3.
Entropy values calculated in Merlin for the whole cohort for SNPs (solid line) and microsatellites (dashed line) for chromosomes 6, 12, 13, 21, and X.
Figure D.
Multipoint entropy plots for SNPs (green) versus microsatellites (orange), as calculated using Merlin.
To assess the effects of reduced IC on the SNP scan, a 3,300-SNP map with a median spacing of 1.13 cM (95% CI 1.1–1.15) and a mean heterozygosity of 0.34 was generated and the cohort reanalyzed. There was a significant decrease in genomewide IC (mean 0.65; 95% CI 0.55–0.71; SD 0.05; t=100.3; 13,213 df; P<.0001). In addition, the maximum NPL scores fell substantially for all but a single locus on 6q, at 79 cM (table 1). After analysis with the 1-cM SNP map, only one 6q locus and the HLA locus remained significant at P<.05 (table 1). In fact, the results of the 1-cM SNP linkage analysis more closely resembled those of the initial microsatellite genome scan, suggesting that higher IC in the full set of 10,423 SNPs contributed to observed differences between the microsatellite and SNP genome scans.
LD
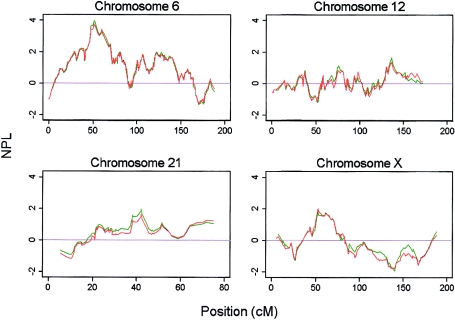
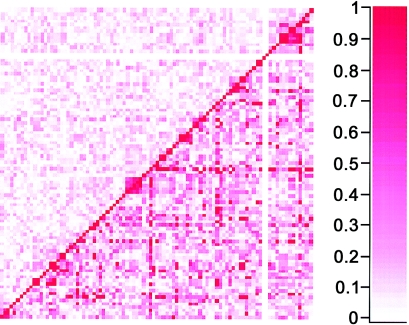
Algorithms that estimate identity-by-descent (IBD) sharing probabilities in Merlin assume linkage equilibrium between all markers; in fact, these algorithms have been shown to be unreliable when there is strong LD between markers (Schaid et al. 2002). Given the high density of this SNP marker set, we were interested in determining whether some of our linkage results might have been due to possible LD between SNPs. As a first step, we assessed the extent of LD by calculating pairwise LD statistics for SNPs on all chromosomes. There was, indeed, evidence of LD and of haplotype blocks for small clusters of SNPs on all chromosomes. Figure 4 shows LD measurements across the 40-cM region on chromosome 6 under the peak of linkage. Several clusters of two to six SNPs demonstrated LD; 45% of SNPs had an r2>0.4 for at least one pairwise comparison. The results from this chromosome were typical of the entire genome; therefore, we sought to explore the effects of LD on the results in two ways. First, all but a single SNP from groups of SNPs in LD were removed. This led to a very slight increase in NPL score for peaks on chromosomes 6 and 13 and a modest reduction in NPL score on chromosomes 12 and 21 (fig. E [online only]) and chromosome X (data not shown). However, removing SNPs in LD also resulted in a concomitant decrease in IC, due to marker loss. For example, IC at the peak on chromosome 13 dropped from 0.76 to 0.61 when markers in LD were removed, thus making it difficult to assess whether modest effects on the evidence for linkage were due to LD or to losses in IC.
Figure 4.
Pairwise LD for 106 SNPs mapping to a 40-cM (35–75 cM) region on chromosome 6 under the peak of linkage at HLA*DRB1. Measures of r2 are shown in the upper triangle, and measures of D′ are shown in the lower triangle.
Figure E.
Changes in multipoint NPL scores for all SNPs (green) and the removal of all but one SNP in LD (orange).
Second, we employed an alternative method to overcome the inability of Merlin to incorporate LD into estimating IBD sharing probabilities, this time retaining information from all of the SNPs. For the 40-cM region of linkage on chromosome 6 at HLA, we assigned haplotypes to individuals for clusters of SNPs in LD and treated them as single multiallelic markers in the linkage analysis. This also resulted in a decrease in NPL score over the HLA region (maximum NPL score 3.6). Once again, there was a concomitant reduction in IC, in part due to removal of Mendelian errors resulting from lower-probability haplotype assignments. Overall, however, we found the results to be qualitatively similar when SNPs in LD are either retained or removed (fig. E [online only]).
Discussion
This study represents a proof of principle for the use of a high-density SNP marker set in linkage analysis for a complex disease. The SNP genome scan replicated the known HLA locus at a genomewide significance interval (P<.00004) (Lander and Kruglyak 1995) and was performed in a fraction of the time required for the original microsatellite scan, taking a few weeks rather than many months to genotype this cohort. Furthermore, the 1-LOD interval of linkage for the SNPs was 13 cM less than the interval identified for the microsatellite scan. Thus, two major advantages of the high-density SNP scan over microsatellites are the speed of generating genotype data and the considerable savings in downstream fine mapping in this cohort due to better definition of the linkage peaks. A further advantage of the WGSA technology is the sample requirement; genotyping 11,245 SNPs required only 250 ng total of starting genomic DNA, a reduction of more than 10-fold compared with the amount of sample required to genotype 350 microsatellites.
The results from the two scans were similar but not identical, and, although the differences were largely qualitative and at modest significant levels, four regions of nominal linkage were detected in the SNP scan that were not observed in the microsatellite scan. Since most genetic studies of complex diseases follow up areas of nominal evidence of linkage in a second cohort, it is important to consider what might have contributed to these differences in the same family cohort.
There are several possible explanations for the observed differences: genotyping error of either the SNPs or microsatellites, errors in maps used, differences in IC, and the presence of LD leading to false IBD sharing probabilities estimated by Merlin. Each of these possibilities was investigated. SNPs used in this study were estimated to genotype at >99% accuracy (Kennedy et al. 2003). In addition, we implemented error checking, using PEDCHECK and Merlin to ensure removal of as many erroneous genotypes as possible prior to linkage analysis. Including unlikely genotypes in the analysis or removing a further 232 SNPs with a >2% error did not alter the results substantially. The increase in allele sharing observed for the SNP scan on chromosome 12q could possibly be attributed to genotyping error: when three SNPs with a >2% error rate were removed, the NPL score fell below the nominal significance threshold and closely approximated the results observed with the microsatellite scan (table 1).
Errors in map positions or marker order can lead to loss of power to detect linkage (Daw et al. 2000). It has not been possible in this study to construct a meiotic recombination map based on 10,425 SNPs; all maps were constructed using interpolation. Comparison of the data when NCBI builds 31 and 33 were used for both the Marshfield and deCode genetic maps revealed no changes in overall results, suggesting that, in this case, map construction is an unlikely explanation for the observed differences between the microsatellite and SNP scans. This suggests that the interpolated maps constructed for this analysis are adequate for linkage analysis and are unlikely to be a source of additional error.
One of the key advantages of this high-density SNP map is the expected increase in IC compared with the conventional microsatellite set. IC across the genome was uniformly higher for the SNPs than the microsatellites. An increase in IC will lead to a proportionally higher expected LOD score for a true region of linkage (Kruglyak 1997). This is consistent with the higher LOD score for seven of the nine regions detected in the SNP scan. By reducing the density of the SNP set to one SNP every cM (i.e., 3,300 markers), we generated results that more closely resembled the microsatellite scan, suggesting that the variability in IC was the main factor contributing to the observed differences in results.
Independent results also suggest that increased IC contributed to detection of several regions by the SNP scan that were undetected in the microsatellite scan. Additional microsatellite data were available for chromosomes 6 and X that increased the IC of the microsatellite linkage analysis for those regions. Fine mapping using additional microsatellite markers spaced at <1-cM intervals along a 30-cM region of HLA reveals a pattern very similar to the high-density SNP analysis reported here (authors' unpublished data).
Likewise, additional biological and fine-mapping evidence implicates the region identified on the X chromosome at ∼53 cM. This region overlaps with regions identified in other autoimmune diseases, including insulin-dependent diabetes mellitus (Cordell et al. 1995), multiple sclerosis (Ebers et al. 1996; Ban et al. 2002, 2002), and Graves disease (Imrie et al. 2001). Several clinical and genetic features are shared between RA and these other autoimmune conditions; this, combined with the 4:1 female-to-male preponderance of RA cases (Doran et al. 2002), implicates the X chromosome in RA. Although this region showed no linkage in the first microsatellite scan, subsequent fine mapping with a denser set of microsatellites at 0.9-cM spacing in the same U.K. cohort resulted in a LOD score of 1.69 at marker DXS8090 (authors' unpublished data). This marker maps close to the linkage peak detected in the SNP scan, confirming that the NPL score observed in the SNP scan reported here is due to increased IC. Thus, the initial 10,423-SNP genome scan generated results on chromosomes 6 and X that are equivalent to subsequent fine mapping using microsatellites and was accomplished in a fraction of the time.
The SNP density used in this study exceeds by approximately threefold that predicted to be necessary to achieve IC equivalent to that of standard microsatellite marker sets. Despite this predicted saturation, the maximum IC that was ever reached in our SNP analysis was 0.88. This is due to the large proportion of pedigrees lacking parental genotype data. We also applied multipoint polymorphism information content (MPIC), an algorithm that assumes full inheritance information (Rijsdijk and Sham 2002), to markers on chromosome 6. Using this algorithm, mean MPIC was substantially higher for the SNP set (94%) than for the microsatellite set (70%). The data presented here suggest that, when parental information is lacking, much higher numbers of SNPs than predicted are necessary to achieve high IC. Since many genetic studies involve diseases of late age at onset, it is not unusual to encounter incomplete pedigrees; thus, 3,300 SNPs may not achieve good IC measures in these types of cohorts, and >10,000 SNPs should not be considered excessive.
Because of the high density of SNPs used in this investigation, we did detect LD and some areas of conserved haplotypes across the genome. Since the algorithms used to estimate IBD sharing assume linkage equilibrium between markers, we were concerned that the presence of LD would confound the results. Restricting the analysis to SNPs in linkage equilibrium did modestly alter the linkage results, with some NPL scores increasing for some regions and decreasing for other regions. For the HLA region, we assigned haplotypes to groups of unrelated individuals through use of the EM algorithm for clusters of SNPs in LD. However, because the algorithm assigns haplotypes without regard to family relationships, there will be erroneous haplotype assignments, which lead to a much higher Mendelian inheritance error rate, resulting in a further loss of information. If a proportion of SNPs in the marker set are in LD, one might expect that algorithms incorporating such information into the linkage analysis would improve the accuracy of IBD sharing probabilities and result in greater power.
The ultimate aim of any whole-genome screen linkage analysis is to detect susceptibility loci for the disease under investigation. Outside of HLA, no other loci have been confirmed as RA susceptibility loci. All other regions showing evidence of increased allele sharing in this study, although significant at nominal levels, failed to reach suggestive evidence of linkage (i.e., P<.0007) (Lander and Kruglyak 1995). Although it is possible that one or more of these loci may be false positives, it should be noted that power calculations for this cohort suggest that only loci conferring genetic relative risks of >2 (e.g., HLA*DRB1) are likely to give highly significant results. Thus, we would not expect high NPL scores from true minor susceptibility loci, even at maximum IC. Independent biological and genetic evidence support some of these nominal regions as possible RA susceptibility loci. In addition to the fine-mapping data supporting the chromosome 6 and X loci described above, whole-genome microsatellite scans in other cohorts (Cornelis et al. 1998; Shiozawa et al. 1998; Jawaheer et al. 2003) also add support for the nominal loci we detected on chromosomes 6q, 12, 13, 21, and X in this study.
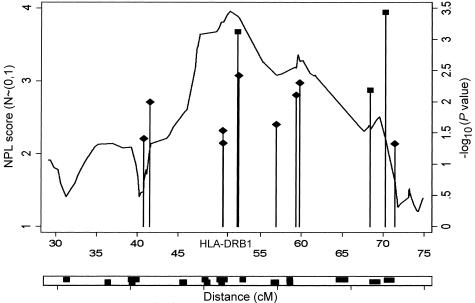
One of the attractive prospects of this type of linkage analysis is that the SNPs genotyped in a whole-genome scan can be used as a scaffold for further LD mapping studies in a region of interest. Along these lines, we selected the 106 SNPs spanning 40 cM centered around HLA to assign 15 haplotype blocks and tested these blocks for evidence of association. Two regions with significant haplotypic associations were identified by both haplotype trend regression (a three-SNP haplotype at 52.18 cM [P=.0007] and a two-SNP haplotype at 70.253 cM [P2=.0003]) and the χ2 test (P1=.003 and P2<10-3, respectively) when analyses were performed in a small case-control cohort of 81 controls and 114 unrelated cases. Although one should be cautious when interpreting data from many different tests, these results remain significant at the 5% level after applying a Bonferroni correction for the 15 LD blocks tested. It is also noteworthy that the first of these haplotypes maps directly under the peak of linkage, closest to HLA*DRB1 (fig. 5), demonstrating, at least in this cohort, the utility of using the SNPs as a fine-mapping scaffold.
Figure 5.
Linkage and association in the HLA region. ♦ = single-point association; ▪ = haplotype association in region of LD. The lower panel indicates regions of LD defined by clusters of SNPs where all pairwise correlations were >0.4.
In this study, we have demonstrated the utility of a dense SNP map for linkage analysis in a complex disease. The low genotyping error rates and map construction used here lead to reliable robust results; furthermore, the presence of LD between a proportion of markers did not significantly affect the analysis. The increased IC offered by this technology improved linkage signals that were not detected in a low-resolution microsatellite scan. Since the technology employed here is also scalable to >100,000 SNPs (Kennedy et al. 2003), it will be applicable to whole-genome association studies, when linkage analysis is not possible.
Supplementary Material
Acknowledgments
We thank Howard Lee, Julia Yeh, and Deborah Payne for expert technical assistance. This work was supported by grants from the Arthritis Research Campaign, UK and the Medical Research Council, UK. We would like to thank the two anonymous reviewers for their helpful comments.
Electronic-Database Information
The URLs for data presented herein are as follows:
- D. Clayton's Web site, http://www-gene.cimr.cam.ac.uk/clayton/software/ (for SNPHAP)
- Golden Helix, http://www.goldenhelix.com/index.jsp (for HelixTree software)
- Online Mendelian Inheritance in Man (OMIM), http://www.ncbi.nlm.nih.gov/Omim/ (for RA) [PubMed]
References
- Abecasis GR, Cherney SS, Cookson WO, Cardon LR (2002) Merlin—rapid analysis of dense genetic maps using sparse gene flow trees. Nat Genet 30:97–101 10.1038/ng786 [DOI] [PubMed] [Google Scholar]
- Ban M, Stewart GJ, Bennetts BH, Heard R, Simmons R, Maranian M, Compston A, Sawcer SJ (2002) A genome screen for linkage in Australian sibling-pairs with multiple sclerosis. Genes Immun 3:464–469 10.1038/sj.gene.6363910 [DOI] [PubMed] [Google Scholar]
- Botstein D, Risch N (2003) Discovering genotypes underlying human phenotypes: past successes for Mendelian disease, future approaches for complex disease. Nat Genet 33 Suppl:228–237 [DOI] [PubMed] [Google Scholar]
- Cordell HJ, Todd JA, Bennett ST, Kawaguchi Y, Farrall M (1995) Two-locus maximum lod score analysis of a multifactorial trait: joint consideration of IDDM2 and IDDM4 with IDDM1 in type 1 diabetes. Am J Hum Genet 57:920–934 [PMC free article] [PubMed] [Google Scholar]
- Cornelis F, Faure S, Martinez M, Prud’homme JF, Fritz P, Dib C, Alves H, et al (1998) New susceptibility locus for rheumatoid arthritis suggested by a genome-wide linkage study. Proc Natl Acad Sci USA 95:10746–10750 10.1073/pnas.95.18.10746 [DOI] [PMC free article] [PubMed] [Google Scholar]
- Daw EW, Thompson EA, Wijsman EM (2000) Bias in multipoint linkage analysis arising from map misspecification. Genet Epidemiol 19:366–380 [DOI] [PubMed] [Google Scholar]
- Doran MF, Pond GR, Crowson CS, O’Fallon WM, Gabriel SE (2002) Trends in incidence and mortality in rheumatoid arthritis in Rochester, Minnesota, over a forty-year period. Arthritis Rheum 46:625–631. 10.1002/art.509 [DOI] [PubMed] [Google Scholar]
- Ebers GC, Kukay K, Bulman DE, Sadovnick AD, Rice G, Anderson C, Armstrong H, et al (1996) A full genome search in multiple sclerosis. Nat Genet 13:472–476 [DOI] [PubMed] [Google Scholar]
- Excoffier L, Slatkin M (1995) Maximum-likelihood estimation of molecular haplotype frequencies in a diploid population. Mol Biol Evol 12:921–927 [DOI] [PubMed] [Google Scholar]
- Imrie H, Vaidya B, Perros P, Kelly WF, Toft AD, Young ET, Kendal-Taylor P, Pearce SH (2001) Evidence for a Graves’ disease susceptibility locus at chromosome Xp11 in a United Kingdom population. J Clin Endocrinol Metab 86:626–630 10.1210/jc.86.2.626 [DOI] [PubMed] [Google Scholar]
- Jawaheer D, Seldin MF, Amos CI, Chen WV, Shigeta R, Monteiro J, Kern M, Criswell LA, Albani S, Nelson JL, Clegg DO, Pope R, Schroeder HW Jr, Bridges SL Jr, Pisetsky DS, Ward R, Kastner DL, Wilder RL, Pincus T, Callahan LF, Flemming D, Wener MH, Gregersen PK (2001) A genomewide screen in multiplex rheumatoid arthritis families suggests genetic overlap with other autoimmune diseases. Am J Hum Genet 68:927–936 [DOI] [PMC free article] [PubMed] [Google Scholar]
- Jawaheer D, Seldin MF, Amos CI, When WV, Shigeta R, Etzel C, Damle A, et al (2003) Screening the genome for rheumatoid arthritis susceptibility genes: a replication study and combined analysis of 512 multicase families. Arthritis Rheum 48:906–916 10.1002/art.10989 [DOI] [PubMed] [Google Scholar]
- Kennedy GC, Matsuzaki H, Dong S, Liu WM, Huang J, Liu G, Su X, Cao M, Chen W, Zhang J, Liu W, Yang G, Di X, Ryder T, He Z, Surti U, Phillips MS, Boyce-Jacino MT, Fodor SP, Jones KW (2003) Large-scale genotyping of complex DNA. Nat Biotechnol 21:1233–1237 10.1038/nbt869 [DOI] [PubMed] [Google Scholar]
- Kong A, Gudbjartsson DF, Sainz J, Jonsdottir GM, Gudjonsson SA, Richardsson B, Sigurradrottior S, Barnard J, Hallbeck B, Masson G, Shilen A, Palsson ST, Frigge ML, Thorgeirsson TE, Gulcher JR, Stefansson K (2002) A high-resolution recombination map of the human genome. Nat Genet 31:241–247 [DOI] [PubMed] [Google Scholar]
- Kruglyak L (1997) The use of a genetic map of biallelic markers in linkage studies. Nat Genet 17:21–24 [DOI] [PubMed] [Google Scholar]
- Lander E, Kruglyak L (1995) Genetic dissection of complex traits: guidelines for interpreting and reporting linkage results. Nat Genet 11:241–247 [DOI] [PubMed] [Google Scholar]
- Mackay K, Eyre S, Mysercough A, Milicic A, Barton A, Laval S, Barrett J, Lee D, White S, John S, Brown MA, Bell J, Silman A, Ollier W, Wordsworth P, Worthington J (2002) Whole-genome linkage analysis of rheumatoid arthritis susceptibility loci in 252 affected sibling pairs in the United Kingdom. Arthritis Rheum 46:632–639 10.1002/art.10147 [DOI] [PubMed] [Google Scholar]
- Matise TC, Sachidanandam R, Clark AG, Kruglyak L, Wijsman E, Kakol J, Buyske S, et al (2003) A 3.9-centimorgan-resolution human single-nucleotide polymorphism linkage map and screening set. Am J Hum Genet 73:271–284 [DOI] [PMC free article] [PubMed] [Google Scholar]
- Matsuzaki H, Loi H, Dong S, Tsai Y-Y, Fang J, Law J, Di X, Liu WM, Yang G, Liu G, Huang J, Kennedy GC, Ryder TB, Marcus GA, Walsh PS (2004) Parallel genotyping of over 10,000 SNPs using a one primer assay on a high density oligonucleotide array. Genome Res 14:414–425 10.1101/gr.2014904 [DOI] [PMC free article] [PubMed] [Google Scholar]
- O’Connell JR, Weeks DE (1998) PedCheck: a program for identification of genotype incompatibilities in linkage analysis. Am J Hum Genet 63:259–266 [DOI] [PMC free article] [PubMed] [Google Scholar]
- Rijsdijk FV, Sham PC (2002) Estimation of sib-pair IBD sharing and multipoint polymorphism information content by linear regression. Behav Genet 32:211–220 10.1023/A:1016073113019 [DOI] [PubMed] [Google Scholar]
- Schaid DJ, McDonnell SK, Wang L, Cunningham JM, Thibodeau SN (2002) Caution on pedigree haplotype inference with software that assumes linkage equilibrium. Am J Hum Genet 71:992–995 [DOI] [PMC free article] [PubMed] [Google Scholar]
- Seldin MF, Amos CI, Ward R, Gregerson PK (1999) The genetics revolution and the assault on rheumatoid arthritis. Arthritis Rheum 42:1071–1079 [DOI] [PubMed] [Google Scholar]
- Shiozawa S, Hayashi S, Tsukamoto Y, Goko H, Kawasaki H, Wada T, Shimizu K, Yasuda N, Kamatani N, Takasugi K, Tanaka Y, Shiozawa K, Imura S (1998) Identification of the gene loci that predispose to rheumatoid arthritis. Int Immunol 10:1891–1895 10.1093/intimm/10.12.1891 [DOI] [PubMed] [Google Scholar]
- StataCorp (2003) Statistical Software: release 8.0. Stata Corporation, College Station, TX [Google Scholar]
- Whittemore AS, Halpern J (1994) A class of tests for linkage using affected pedigree members. Biometrics 50:118–127 [PubMed] [Google Scholar]
- Wordsworth P, Bell J (1991) Polygenic susceptibility in rheumatoid arthritis. Ann Rheum Dis 50:343–346 [DOI] [PMC free article] [PubMed] [Google Scholar]
- Worthington J, Ollier WE, Leach MK, Smith I, Hay EM, Thomson W, Pepper L, Carthy D, Farhan A, Martin S (1994) The Arthritis and Rheumatism Council’s National Repository of Family Material: pedigrees from the first 100 rheumatoid arthritis families containing affected sibling pairs. Br J Rheumatol 33:970–976 [DOI] [PubMed] [Google Scholar]
- Zaykin DV, Westfall PH, Young SS, Karnoub MA, Wagner MJ, Ehm MG (2002) Testing association of statistically inferred haplotypes with discrete and continuous traits in samples of unrelated individuals. Hum Hered 53:79–91 10.1159/000057986 [DOI] [PubMed] [Google Scholar]
Associated Data
This section collects any data citations, data availability statements, or supplementary materials included in this article.


