

Abstract
Late-onset familial Alzheimer disease (LOFAD) is a genetically heterogeneous and complex disease for which only one locus, APOE, has been definitively identified. Difficulties in identifying additional loci are likely to stem from inadequate linkage analysis methods. Nonparametric methods suffer from low power because of limited use of the data, and traditional parametric methods suffer from limitations in the complexity of the genetic model that can be feasibly used in analysis. Alternative methods that have recently been developed include Bayesian Markov chain–Monte Carlo methods. These methods allow multipoint linkage analysis under oligogenic trait models in pedigrees of arbitrary size; at the same time, they allow for inclusion of covariates in the analysis. We applied this approach to an analysis of LOFAD on five chromosomes with previous reports of linkage. We identified strong evidence of a second LOFAD gene on chromosome 19p13.2, which is distinct from APOE on 19q. We also obtained weak evidence of linkage to chromosome 10 at the same location as a previous report of linkage but found no evidence for linkage of LOFAD age-at-onset loci to chromosomes 9, 12, or 21.
Introduction
Alzheimer disease (AD) is genetically heterogeneous. Rare autosomal dominant mutations in the amyloid precursor protein (APP [MIM 104760]) (Goate et al. 1991), presenilin 1 (PSEN1 [MIM 104311]) (Schellenberg et al. 1992; Sherrington et al. 1995), and presenilin 2 (PSEN2 [MIM 600759]) (Levy-Lahad et al. 1995a, 1995b; Rogaev et al. 1995) cause early-onset familial AD (FAD), but late-onset FAD (LOFAD) is more complex. Apolipoprotein E (APOE [MIM 107741]) is the single definitive LOFAD gene, identified primarily with population-based studies (Corder et al. 1993), but the high-risk ɛ4 allele is neither necessary nor sufficient to cause disease (Corder et al. 1993; Strittmatter et al. 1993). Different studies also estimate that APOE accounts for only 4%–15% of the variance in age at onset (Bennett et al. 1995; Slooter et al. 1998; Daw et al. 2000b; Tunstall et al. 2000). Recent oligogenic segregation analysis of FAD age at onset as a quantitative trait suggests that there are several contributing genes that have not yet been identified (Daw et al. 2000b). Consistent with this finding, linkage analysis of families with LOFAD has produced multiple candidate regions with some support in more than one data set (Pericak-Vance et al. 1997; Kehoe et al. 1999; Curtis et al. 2001; Olson et al. 2001; Mayeux et al. 2002; Blacker et al. 2003; Scott et al. 2003). In addition to modest evidence of linkage to the APOE region on chromosome 19 (Pericak-Vance et al. 1991, 2000; Kehoe et al. 1999; Blacker et al. 2003), the most consistent evidence for linkage of AD loci has been reported for chromosomes 10 (Bertram et al. 2000; Ertekin-Taner et al. 2000; Myers et al. 2000) and 12 (Blacker et al. 1998; Scott et al. 1999; Mayeux et al. 2002). Somewhat weaker evidence for linkage to chromosome 9 has been reported across samples (Kehoe et al. 1999; Pericak-Vance et al. 2000; Myers et al. 2002), and reports of linkage of LOFAD to the APP region in the National Institute of Mental Health (NIMH) AD sample (Kehoe et al. 1999; Curtis et al. 2001; Olson et al. 2001; Bacanu et al. 2002; Myers et al. 2002) are of interest because of the known role of APP in early-onset AD. Interpretation of these results and expectation for future success in gene mapping is tempered by the difficulty of identifying APOE with traditional mapping methods; in addition, positive reports of linkage to other chromosomes vary considerably in location among studies, raising questions about the strength of the evidence. As for all complex traits, replication in independent data sets remains a key aspect of validation of a positive linkage report.
Localization of susceptibility genes for complex disorders such as AD is difficult because of heterogeneity, unknown modes of inheritance, and the potentially small effects exerted by any single gene. AD gene detection with model-free approaches is hampered by the intrinsic low power of these methods (Durner et al. 1999). Traditional single-locus model-based approaches lose power because of poor specification of single-locus model parameters and because of restrictions in the number of trait loci that can be explicitly incorporated into the analysis. Heterogeneity LOD score methods (Smith 1961; Hodge et al. 1983) fail to adequately incorporate the complexity of a trait affected by more than simple genetic heterogeneity. Computationally demanding two-trait-locus methods have occasionally been attempted (Schork et al. 1993; Tienari et al. 1994; Goldstein et al. 1996) but have limited practical utility, even with current fast computers. The extension of model-based methods to more trait loci, particularly in the context of multipoint marker analysis, remains computationally infeasible (Wijsman 2003). However, because results both from genome screens (Pericak-Vance et al. 1997; Blacker et al. 1998; Kehoe et al. 1999; Scott et al. 1999, 2003; Bertram et al. 2000; Ertekin-Taner et al. 2000; Myers et al. 2000, 2002) and from oligogenic segregation analysis (Daw et al. 2000b) suggest that several loci are involved in LOFAD, it is reasonable to expect that models that incorporate more of this trait-locus complexity might improve the power and accuracy of AD gene localization (Wijsman and Amos 1997; Daw et al. 1999).
Bayesian Markov chain–Monte Carlo (MCMC) linkage analysis methods provide a computationally tractable approach for complex-trait analysis. These methods are particularly suitable for multilocus trait models and easily accommodate the substantial missing genotype data that is typical of AD data sets. These methods use the available data more efficiently than either trait-model–free analysis or parametric analysis using an inadequate single-locus model. Current implementations of QTL methods (Heath 1997) have been extended to censored data (Daw et al. 1999), allowing application to the mapping of FAD age-at-onset QTLs. These methods make efficient use of available data, because multipoint analysis with many markers is possible with pedigrees of any size and with any amount of missing data and because the analysis can include covariates (Wijsman and Amos 1997). The MCMC multipoint computations are accurate and produce results that are superior to approximation-based methods (Wijsman 2003), resulting in increased power to detect linkage (Göring et al. 2003). Bayesian MCMC linkage analysis methods have performed well with both real (Daw et al. 1999; Yuan et al. 2000; Gagnon et al. 2003; Chapman et al., in press) and simulated (Heath et al. 1997; Shmulewitz and Heath 2001) data. These methods do not require knowledge of a prespecified trait-locus model, since estimation of the model is part of the analysis. Alternative approaches, such as variance-components methods (Amos 1994; Almasy and Blangero 1998), lead to computational difficulties resulting from the extensive missing genotype data that is typical of AD; these methods also can suffer from loss of power (Forrest and Feingold 2000) or false-positive evidence of linkage (Williams et al. 1997) because of the violation of distributional assumptions when pedigrees are not randomly ascertained, as is typical of pedigrees with AD.
Here we present results of an MCMC analysis of pedigrees with LOFAD for five chromosomes with evidence of linkage from previous studies. Chromosomes 9, 10, 12, 19, and 21 were chosen for investigation because of prior positive reports of linkage to AD in more than one data set. With the exception of chromosome 21, the previous positive linkage results all included more than one sample of pedigrees with LOFAD. For chromosome 21, the known role of APP in early-onset AD complements the evidence for linkage in the late-onset NIMH AD data set. Our analyses provide evidence for linkage to APOE, implicate a novel AD age-at-onset gene on chromosome 19p13.2, and provide support for an AD gene on chromosome 10 near a location previously implicated on this chromosome. In contrast to the results for chromosomes 19 and 10, there was little evidence in our data set for linkage of age at onset of LOFAD to chromosomes 9, 12, or 21 in regions with previously reported evidence for linkage.
Methods
Families with LOFAD
A total of 86 multiplex kindreds with LOFAD were used. Families were identified and characterized primarily by the University of Washington AD genetics group. Families were also identified at the Oregon Health Sciences University and the University of Minnesota. Samples from an additional eight families were from the National Cell Repository for Alzheimer's Disease. The study was approved by the University of Washington institutional review board. Families were considered to have LOFAD if the family mean age at onset was ⩾60 years. Families were not included in the analysis if they contained subjects with identified mutations in APP, PSEN1, PSEN2, microtubule-associated protein tau (MAPT [MIM 157140]), or prion-related protein (PRP [MIM 176640]). Families consisted of 940 individuals (range 4–53 subjects per family; median 9; mean 10.9; SD 7.3), including 340 affected subjects with known age at onset and 419 unaffected individuals with known censoring age. DNA was obtained from 527 of these subjects, including 274 affected subjects (10 of whom were missing age-at-onset information) and 253 unaffected individuals (9 of whom were missing censoring age information). The average number of affected subjects per family in the portions of the families used in the linkage analysis was 4.5 (range 2–12), and the average number of subjects with AD sampled per family was 3.3 (range 1–7). The observed mean age at onset for the complete sample used in the analysis was 70.7 years (range 40–89 years).
A clinical diagnosis of AD for living subjects was based on published criteria (McKhann et al. 1984). For deceased subjects, if no autopsy was available, the diagnosis of probable AD was based on detailed medical records that included consultations by neurologists, neuropsychological testing, magnetic resonance imaging of the brain, and laboratory tests to exclude other forms of dementia. Autopsies were obtained for 147 subjects, with 74 families having at least one autopsied subject. Autopsy criteria for AD were from the Consortium to Establish a Registry for Alzheimer’s Disease (Mirra et al. 1991) and the Ronald and Nancy Reagan Research Institute of the Alzheimer's Association/National Institute on Aging Working Group (1998). The ages at onset of affected individuals were determined as described elsewhere (Bird et al. 1989), and censoring age of unaffected individuals (if cognitively intact) was based on age at death or most recent age for which there was evidence of normal cognitive function.
Genotyping Methods
Genotypes were determined by use of fluorescence-tagged primers to PCR-amplify STRPs. Fragments were resolved by use of Perkin Elmer Biosystems 377 or 310 instruments and analyzed by use of GeneScan and Genotyper software. APOE genotypes were obtained as described elsewhere (Hixson and Vernier 1990; Levy-Lahad et al. 1995b).
Marker Panels and Maps
Chromosome scans were based on markers spaced at ∼10-cM intervals for each chromosome (scanning marker sets), by use of the ABI Prism 10-cM marker set (version 2.5). Nine additional markers were subsequently added in the region on chromosome 19p for which evidence for linkage was obtained, providing a 2- to 3-cM spacing in the 19p region with evidence for linkage (complete set of chromosome 19 markers). Marker maps used for analysis were taken from the Marshfield Center for Medical Genetics Web site and converted to a Haldane map for analysis. A sex-averaged map was used for most analyses, and all genetic distances and locations given here correspond to the Haldane map. Because of concerns that a positive linkage signal could be erroneous under the use of sex-averaged maps (Daw et al. 2000a), a few analyses also were repeated with sex-specific maps. However, because results were unaffected by the use of sex-specific maps, they are not presented. For all analyses, marker allele frequencies were estimated from the families, which tends to give conservative results (Ott 1992).
Candidate-Gene Covariate Loci
Because of previous results, three loci were included as major-gene covariates in some analyses. The use of such loci as candidate-gene covariates is important for two reasons. First, if inclusion of a gene as a covariate eliminates a linkage signal, this provides evidence supporting a contribution of the locus to the trait. Second, adjustment for the effects of covariates reduces the residual variance. This, in turn, increases the proportion of the remaining variance explained by any given QTL, which increases the power to detect such QTLs. APOE was included as a candidate-gene covariate in most analyses because of the strong and consistent evidence that it is involved in LOFAD. The only exception to the inclusion of APOE as a major-gene covariate was in initial analyses of chromosome 19, which were based only on the scanning marker set as a test to see if the MCMC methods could detect evidence for linkage to APOE with a standard 10-cM panel of markers. On chromosome 12, two linked candidate loci were investigated: α-2-macroglobulin (A2M [MIM 103950]) and low-density lipoprotein receptor-related protein (LRP [MIM 107770]). These were investigated as genes potentially responsible for the chromosome 12 LOFAD locus for three reasons: (1) previous linkage analysis reports by other researchers (Blacker et al. 1998; Scott et al. 1999; Mayeux et al. 2002); (2) the genes are APOE receptors with some evidence for association with AD (Lendon et al. 1997; Wavrant-DeVrièze et al. 1997; Blacker et al. 1998); and (3) corroboratory experimental evidence in mice (Zerbinatti et al. 2004). We examined the age-at-onset distributions for different genotypes for these two loci so that we could address two questions. First, we could determine whether age-at-onset distributions differ among genotypes. Second, we could determine the form of the distributions: unimodal distributions with genotype-specific means are all consistent with a model of a shift in age at onset (Breitner et al. 1998), whereas bimodal distributions are consistent with a shift in genotype-specific risk without, necessarily, a shift in age at onset within modes. In our analysis, these two loci were analyzed jointly as two independent major-gene covariate loci.
Statistical Analysis
Age at onset was modeled as a censored quantitative trait in a Bayesian MCMC joint linkage and oligogenic segregation analysis. Age at onset was used as the phenotype for four reasons. First, it is a measure of severity that is also a surrogate for AD. Second, there is evidence for a genetic basis for age at onset (Meyer and Breitner 1998; Daw et al. 2000b; Pedersen et al. 2001). Third, the use of continuous traits can be advantageous in linkage analysis (Wijsman and Amos 1997). Finally, the method of analysis used, which allows for an oligogenic mode of inheritance, has been implemented only for continuous traits. The theory and methods are described more extensively elsewhere (Heath 1997; Daw et al. 1999; Wijsman 2002; Wijsman and Yu, in press). The program Loki, version 2.4.5, was used for analysis. The analysis model included an unknown but estimated number of underlying diallelic QTLs that contribute additively to age at onset. Each locus is modeled as a diallelic locus, according to standard QTL methods, with genotype effects for QTL i parameterized as ±ai and di for the two homozygous and the heterozygous genotypes, respectively (Falconer 1995). The overall model is a standard linear model that combines QTL effects, covariate effects, and environmental effects, with no interactions, as described elsewhere (Heath 1997). The analysis was a survival analysis, under the assumption that within each multilocus genotype, defined by all QTLs in the model plus the covariate candidate-gene genotypes (when included), the failure curves are cumulative normal distributions with equal variance (Daw et al. 1999). A sex-averaged meiotic map was used for most analyses, under the assumption of a complete genome length of 3,000 cM. Results were unaffected by the use of sex-specific maps and are not shown. Sensitivity of results to errors in map distances was evaluated by performing analyses for individual markers in the 20- to 40-cM interval containing the strong signal on chromosome 19p, since such single-marker analyses do not incorporate assumptions about the genetic map. All linkage analyses were based on 500,000 MCMC iterations, with every 5th iteration used for computation of posterior distributions. This run length was chosen on the basis of extensive prior experience showing that long runs are needed for analysis of censored traits and that runs of this length give highly reproducible results.
The Bayesian aspect of the analysis combines prior distributions with Metropolis-Hastings steps (Metropolis et al. 1953; Hastings 1970). The prior distributions are used to propose new values for parameters in the model. The Metropolis-Hastings steps compare the probability of the observed data under the proposed and current set of model parameters and use the ratio of the two probabilities to determine whether or not to accept the changes in the parameter values. Over many iterations, the parameter values accepted can be regarded as being drawn from the marginal posterior parameter distribution, which, in turn, can be used to draw inferences about parameters of interest (Tierney 1994). For our analyses, we used default values for the prior distribution on QTL locations (uniform over the genome) and for QTL allele frequencies (uniform on 0–1). The prior distribution on the number of QTLs was assumed to be Poisson with mean 2. The final prior distribution was that of the QTL genotype effects ai and di, which were sampled from a normal distribution with mean 0 and variance τβ. The value used for τβ was 100, except where noted; early analyses in the absence of markers showed that, when τβ=100, the acceptance of models with new QTLs in the oligogenic trait model was maximized, and thus a value of 100 was reasonable to use in analysis (Wijsman and Yu, in press). A few additional analyses were done with different values for τβ, to explore the sensitivity of results to assumptions about this parameter value. Most runs were performed only once, but a set of runs performed to evaluate the strength of the linkage signal, described below, provides information pertaining to interrun variability, which was low.
Because this is a Bayesian approach and does not produce conventional LOD scores or P values, two measures of the strength of the signal were used to evaluate the linkage signals. The first is the maximum intensity ratio (IR) over all map intervals considered. The IR reflects the ratio of observed to expected acceptance rates of QTLs with a location in a particular interval, and, in interval i, IRi=Nir/Ni0 (Wijsman and Yu, in press). Given the observed marker and trait data, Nir is the observed number of times in an analysis run that a model contained a QTL with a location in interval i-δ to i+δ, for small δ. Ni0 is the equivalent number expected under a uniform distribution over the genome of all of the average number of QTLs in the model. For computing IRs, we used δ=1 cM (giving 2-cM bins). The IR based on the estimated number of QTLs is a conservative estimate of the Bayes factor (Wijsman and Yu, in press), so that an IR >150 can be interpreted as very strong evidence against the null hypothesis of no linkage, 20<IR<100 provides strong evidence, and 3<IR<20 provides positive evidence against the null hypothesis (Kass and Raftery 1995). The IR is computed for small chromosome intervals. Although in multipoint analysis the linkage signal is typically concentrated in a small region, in single-marker analysis the linkage signal is necessarily more diffuse, resulting in lower IRs. Thus, to compare single-marker and multipoint analyses, we also computed the posterior probability of linkage (PPL) to the chromosome, to capture the global support for linkage provided by each analysis. The second measure of the strength of evidence for linkage was obtained by the maximum log of the PPL (LOP score) (Daw et al. 2003), which has an interpretation similar to that of a LOD score when parameters of the linked trait locus are estimated in the context of the linkage analysis. A LOP score is a comparison of the observed signal to one expected in the absence of linkage, as estimated by simulation, and is expected to be 0 in the absence of linkage:
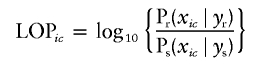 |
where i represents position on the chromosome, yr and ys represent the realized and simulated marker data on the pedigree, and xic represents a location proposal accepted, during the MCMC process, in interval i-δ to i+δ for location of a QTL with variance contribution between c-ɛ and c+ɛ, for small values of δ and ɛ. We used δ=1 cM and ɛ=0.5 years. The probability (P) is estimated from the real data (Pr) and the simulated data (Ps), respectively. The simulated marker data were generated by gene dropping on pedigrees of identical structure and identical missing data patterns as the real pedigrees, by use of the same markers, maps, and allele frequencies as were observed in the real data. The estimated marker map was used in conjunction with Haldane’s mapping function to govern the multilocus marker inheritance patterns. Trait phenotypes were ignored during this step, thus producing a realization of marker genotypes that would be expected in the absence of linkage. LOP scores were computed by use of all markers on chromosome 19, as well as APOE, which was included as both a marker and a major-gene covariate. The final LOP score was based on 5,000,000 total MCMC iterations, accumulated across 10 runs, each of which was based on the real data plus one simulated chromosome 19. Details for estimating the LOP score are described elsewhere (Daw et al. 2003). Analysis conditions were identical to those used for the analysis of the complete set of markers on chromosome 19, with τβ=200, except that every 2nd iteration was saved for analysis, providing 2,500,000 iterations from which the LOP score was estimated.
Results
Chromosome 19
Since the MCMC analysis methods are relatively novel, we first attempted to detect linkage to APOE, the single known LOFAD gene (fig. 1). As in all the analyses presented here, age at onset was used as a quantitative trait to identify AD susceptibility loci. When chromosome 19 markers from the 10-cM scanning marker set were initially used in an MCMC oligogenic multipoint linkage analysis without including APOE as either a marker or covariate, a weak signal (maximum IR=2.3, ∼80 cM) near APOE on 19q was observed but was shifted slightly telomeric to APOE. The signal near APOE increased considerably in strength when APOE was included as a marker, and the peak IR (IR=9.97, ∼75 cM) provided positive evidence of linkage and was much closer to the correct APOE location. Finally, the IR dropped again when APOE was included both as a covariate and as a marker (IR=2.7, ∼83 cM). These results are all consistent with APOE as the cause of the 19q signal.
Figure 1.

MCMC multipoint linkage analysis of chromosome 19, expressed as the IR, with a prior variance on QTL genotype effects of τβ=100. The solid line indicates results obtained with the 12 markers in the marker screening panel. The dashed line denotes results obtained when APOE was added as a 13th marker. The heavy dotted line shows results when APOE was added as both a 13th marker and a covariate. The vertical light dotted line marks the location of APOE, and the horizontal light dotted line represents IR=1. Marker locations are indicated by tick marks on the top horizontal axis. Markers, from left (19p) to right (19q), are D19S209, D19S216, D19S884, D19S221, D19S226, D19S414, D19S220, D19S420, D19S902, D19S571, D19S418, and D19S210.
We also identified evidence for a second linkage peak on 19p. In the initial analysis, which was based on the 10-cM scanning marker set, we observed a peak on 19p at ∼30 cM on the Haldane map (fig. 1). The magnitude of this initial peak was small (IR=1.47, ∼29 cM), but it rose slightly when APOE was included as a marker but not as a covariate in the analysis (IR=2, ∼31 cM). When APOE also was included as a covariate, the signal at 19p increased considerably (IR=10, ∼29 cM). To further characterize the 19p signal, genotypes from markers selected at 2- to 3-cM intervals surrounding the 19p peak were then included (figs. 2 and 3) to provide the complete marker set—in all cases, with APOE used as both a marker and a major-gene covariate. This strongly increased the 19p signal (IR=117.5, ∼35 cM). The median location of all models accepted by the MCMC analysis was 34.9 cM, with the lower and upper 25th percentiles falling at 34.04 cM and 35.69 cM, respectively, and the lower and upper 10th percentiles at 31.3 cM and 38.1 cM, respectively. The markers flanking these lower and upper 10th percentiles are D19S391 (30.64 cM) and D19S914 (38.22 cM).
Figure 2.

MCMC multipoint linkage analysis, with 21 markers plus APOE, which was used as both a marker and a major-gene covariate. The solid line indicates τβ=100, and the dashed line represents τβ=200. The vertical light dotted line shows the location of APOE. APOE genotypes were inferred probabilistically for all individuals with missing genotypes, and age at onset was estimated for all six APOE genotypes. Tick marks on the top horizontal axis indicate marker locations, with long ticks corresponding to the same markers as in figure 1 and short ticks corresponding to an additional nine markers. From left to right, the markers are D19S209, D19S894, D19S216, D19S869, D19S395, D19S884, D19S391, D19S916, D19S394, D19S221, D19S914, D19S564, D19S226, D19S915, D19S414, D19S220, D19S420, D19S902, D19S571, D19S418, and D19S210. (Markers D19S221 and D19S914 are so close together that the ticks are indistinguishable.)
Figure 3.

Results from run with τβ=100 in figure 2, showing position and genetic effect of the 19p linkage signal relative to the background signal. The vertical axis is proportional to the posterior probability of a gene at a particular location (the intensity) and with the indicated QTL size (square root of the genetic variance).
The results were not strongly affected by assumptions of the analysis. The sensitivity of the 19p signal to choice of τβ was evaluated. An increase of τβ from 100 to 200 further increased the IR to 229 (fig. 2). Increases of τβ to larger values, as well as decreases of τβ to <100, resulted in a decrease of the IR: for τβ=50, the IR was 61, whereas for τβ=400, the IR was 170. This is consistent with the hypothesis that values of τβ in the range of 100–200 provide models with the best fit to the data. Multiple runs, when performed, gave consistent results: the 10 separate runs used to estimate the LOP score were consistent with the initial run (τβ=100), giving a mean IR of 254, an SD of 23.2, and a coefficient of variation of 9%. Finally, the possibility of map error leading to inflation of the linkage signal for these closely spaced markers (Daw et al. 2000a) was explored by MCMC analysis of individual markers; markers at 26–38 cM on the map all gave maximum IRs >2, eliminating map misspecification as the sole source of the positive signal (results not shown). The highest individual marker IRs were at the flanking markers D19S884 (IR=10) and D19S391 (IR=12.5). For these two analyses, the PPLs were 0.11 and 0.13, respectively. In comparison, for the analysis based on all the markers, the PPL was 0.24. Since the total number of QTL locations accepted on all of chromosome 19 in the analysis with all the markers was only 1.8 times the number accepted in the analysis with D19S391, the lower maximum IRs for the single-marker analyses are partly explained by the more diffuse QTL localizations in these single-marker analyses. For example, for D19S391, the upper and lower 25th and 10th percentiles of QTL locations spanned 21.3 cM and 50.62 cM, respectively, compared with only 1.65 cM and 6.8 cM, respectively, for the analysis that included all the markers. The presence of a linkage signal observed individually with two flanking markers, coupled with the resulting large increase in the multipoint linkage signal in the presence of adjustment for APOE genotype effects—from an IR of ∼10 to one of ∼230—supports the existence of a LOFAD age-at-onset QTL on 19p. In addition, a maximum LOP score of 4.1 for an analysis with the full set of markers provides strong evidence of linkage of an age-at-onset QTL to 19p at 34–36 cM on the Haldane map (fig. 4). In contrast, for the same set of runs, the maximum LOP score in the vicinity of APOE was only 1.3 at ∼76 cM.
Figure 4.

LOP score distribution for chromosome 19 (τβ=100; 2,500,000 scored iterations), showing position and genetic effect of the 19p linkage signal relative to the background signal. The vertical axis is on a log10 scale.
The size for this new QTL on 19p was substantial. The mean size of 8.4 years ± 1.6 years for QTLs mapping to the interval between 30–38 cM was clearly higher than that of the small QTLs along the chromosome that are routinely included in the model (fig. 3). This size of the QTL at 19p, after adjustment for APOE effects, appears to be somewhat larger than that estimated for APOE (5.4 years ± 0.7 years in the current analysis and 4.5 years in a previous analysis [Daw et al. 2000b]). The trait-model parameters for the 19p QTL are also similar to those estimated in the absence of markers (Daw et al. 2000b) for the largest QTL segregating for age at onset: the gene frequency for the major allele in the current analysis is 0.58 (0.07 SD), compared with 0.6; the heterozygote effect relative to the common homozygote effect in the present study was −9.3 years (2.3 SD), compared with a previous effect of −7.8 years; and the rarer homozygote effect in the present study was 15.05 years (6.06 SD), compared with 28.8 years. As reported by Daw et al. (2000b), the model estimated in the current analysis is overdominant.
Chromosome 9
There was evidence against linkage of an age-of-onset QTL on chromosome 9 to the region with previous reports of linkage (fig. 5A). The IRs were <1 in this region, providing strong evidence against linkage. The maximum IR on the chromosome was ∼1.7 at ∼80 cM (fig. 5A), obtained only with a low value of 25 for τβ. The IR at this location decreased with higher values of τβ. With the exception of the IR >1 in the middle of the map, IRs elsewhere on the chromosome were all <1, as would be expected in the absence of linkage.
Figure 5.

MCMC multipoint linkage analysis results for chromosomes 9, 10, 12, and 21. Tick marks on the top horizontal axis represent marker locations. Chromosome 9 markers: D9S288, D9S286, D9S285, D9S157, D9S171, D9S161, D9S1817, D9S273, D9S175, D9S167, D9S23, D9S287, D9S1690, D9S1677, D9S1776, D9S1682, D9S290, D9S164, D9S1826, D9S158. Markers on chromosome 10: D10S249, D10S591, D10S189, D10S547, D10S1653, D10S548, D10S197, D10S208, D10S196, D10S1652, D10S537, D10S1686, D10S185, D10S192, D10S597, D10S1693, D10S587, D10S217, D10S1651, and D10S212. Chromosome 12 markers: D12S352, D12S99, D12S336, D12S364, D12S310, D12S1617, D12S1042, D12S345, D12S1090, D12S85, D12S368, D12S390, D12S83, D12S326, D12S351, D12S346, D12S78, D12S79, D12S86, D12S324, D12S1659, and D12S1723. Chromosome 21 markers: D21S1911 (0 cM), D21S1904, D21S1899, D21S1884, D21S1922, D21S214, D21S1914, D21S269, D21S263, D21S1252, D21S1255, and D21S266. Vertical lines indicate the locations of previously reported linkage signals.
Chromosome 10
There was weak evidence supporting the existence of a QTL near a previously reported region on chromosome 10 (fig. 5B). The IR is <1 for most of the chromosome, but it increases to ∼2 at the location of one of the reports of a chromosome 10 AD locus (Ertekin-Taner et al. 2000; Myers et al. 2000, 2002). This signal was relatively insensitive to choice of τβ, giving approximately the same results for τβ=25 and for τβ=100. There was also a second, very weak signal near the location of the second region reported on chromosome 10 at ∼145 cM, but this signal was sensitive to the value for τβ, decreasing for both increasing as well as decreasing values of τβ.
Chromosome 12
We obtained evidence against linkage of a QTL to the chromosome 12 location with previous reports of linkage (fig. 5C). The IR was <1 for most of the chromosome, slightly exceeding 1 only near 100 cM, with a peak IR of ∼1.5 for τβ=25–100. The IR at the A2M location was ∼0.7, providing no evidence for a contribution of this locus to age at onset. In addition, we found no evidence for genotype-specific effects on age at onset for either LRP or A2M when these genes were additionally included as major-gene covariates. Both of these genes were investigated as candidate loci because they are APOE receptors and are located near regions with previous reports of linkage, as well as because of previous reports of association with AD (Lendon et al. 1997; Wavrant-DeVrièze et al. 1997; Blacker et al. 1998). For LRP, the possible genotypes all had virtually identical onset distributions, with shifts relative to the most common homozygous genotype of −0.06 years ± 1.91 years and −0.88 years ± 4.46 years for the heterozygote and rarer homozygote, respectively. For A2M, there is weak evidence that the 2/2 genotype may have a later onset than the 1/1 and 1/2 genotypes, with mean onsets of −0.12 years ± 1.71 years and 4.44 years ± 5.02 years for the 1/2 heterozygote and 2/2 homozygote, relative to the 1/1 homozygote, respectively. However, the direction of the effect and the apparent mode of inheritance, if there is an effect, differ from the original report of an A2M AD association (Blacker and Tanzi 1998). Also, the posterior distributions include 0 within 1 SE of the estimated effects, consistent with an interpretation that the results are statistically insignificant.
Chromosome 21
For chromosome 21, the IR was <1 for the entire chromosome (fig. 5D). The IR near APP was ∼0.25, providing strong evidence against linkage of an age-at-onset QTL to this region. Varying the value for τβ did not change these results (not shown).
Additional QTLs
Although the purpose of the present analysis was an investigation of linkage to several key chromosomes, the results obtained provide information pertinent to future linkage analyses. The 19p locus explains ∼52% of the genetic variance in this sample, after adjustment for APOE effects, leaving ∼48% of the genetic variance unexplained. The posterior distribution of the QTLs had a mean of 3.54 (1.14 SD). Among the QTLs not explained by the 19p locus was one additional large unlinked QTL with an essentially dominant mode of inheritance, a common allele frequency of 0.82 (0.07 SD), a genotypic effect for the heterozygote relative to the common homozygote of 2.3 years (5.45 SD), and a genotypic effect for the rare homozygote relative to the common homozygote of −19.71 years (4.63 SD). The size of this locus was 4.1 years (1.01 SD), and it explained ∼13% of the genetic variance in age at onset in the current sample, after APOE was accounted for. We did not attempt to extract models for smaller QTLs.
Discussion
By use of novel Bayesian MCMC joint linkage and oligogenic segregation analysis, we have presented here strong evidence for a new LOFAD locus on chromosome 19p that affects AD age at onset. We also showed that these methods provide support for linkage of LOFAD to APOE, when APOE is also included as a marker; this evidence for linkage probably would have been missed in an ordinary genome scan, which would not have included APOE as a marker. The large increase in linkage signal on 19p resulting from the use of a method of analysis that allows for efficient adjustment for a known genetic covariate demonstrates the importance of incorporating such information into the genetic model in the search for further LOFAD loci. We have also presented modest corroboratory evidence for a locus on chromosome 10 to a location that coincides with one reported elsewhere. There is no evidence for linkage of age at onset of LOFAD in our data set to locations previously reported as harboring AD risk loci on chromosomes 9, 12, or 21. In addition, the analysis of A2M and LRP as candidate genes on chromosome 12 does not support genotype-specific age-at-onset effects.
Three lines of evidence indicate that the 19p signal is not APOE. First, the location of the peak signal is almost 40 cM away from that of APOE. Some variability in location among studies is expected, but this distance between the 19p signal and APOE is too great to be consistent with a single gene at APOE. Second, the analysis of chromosome 19 identified evidence for two signals on chromosome 19. One of these signals is due to APOE (1) because of its location, (2) because the signal on 19q increases when APOE is added as a marker, and it localizes more accurately to the APOE location, and (3) because the signal disappears when APOE genotypes are used as covariates in the linkage analysis. In contrast to this, the third line of evidence is that the 19p signal is insensitive to the use of APOE as a marker and increases, rather than decreases, in strength when APOE is used as a covariate. This is inconsistent with this signal representing an artifact of the APOE locus and supports the conclusion that the 19p locus is distinct from APOE. The localization of the 19q signal near APOE when APOE was included as a marker was much better, suggesting that the initial localization of APOE may have been imprecise. The imprecision might be a result of the assumption in this analysis of a diallelic trait-locus model, whereas APOE is a three-allele system with each allele contributing differently to age at onset. Other linkage analyses of the APOE region in different data sets obtain similarly displaced locations for the position of the strongest linkage evidence near APOE (Myers et al. 2002), possibly for the same reason.
On the basis of the size of the QTL and the similarity of the trait model to that estimated elsewhere, the QTL responsible for the linkage signal on 19p is compatible with being the largest QTL suggested by a previous oligogenic segregation analysis (Daw et al. 2000b). The use of these MCMC methods to predict the number of QTLs segregating in a set of families has not yet been extensively tested. However, preliminary results based on simulated (Wijsman and Yu, in press) and real data analyses (Gagnon et al. 2003; F. Gagnon, personal communication) suggest that oligogenic segregation analyses in the absence of marker data produce results that are consistent either with the simulated truth or with the number of linkage signals found in subsequent genome scans of real data. If this holds up for these families with LOFAD, we can expect to be able to find one or two more QTLs of reasonable size in this data set, on the basis of the size of the 19p QTL and the estimated sizes of additional QTLs from the current and a previous oligogenic segregation analysis of these data (Daw et al. 2000b).
An early linkage analysis of chromosome 19 also gave modest support for the existence of a LOFAD gene to approximately the same location as that reported here (Pericak-Vance et al. 1991). This observation was not pursued when evidence that APOE was involved in LOFAD surfaced in the same sample. However, our results suggest that reanalysis of these data with methods such as those used here could be useful, since the oligogenic model may be more appropriate for detecting evidence for linkage in the presence of common variation than were the analysis methods previously used.
Certain assumptions are implicit or explicit in the MCMC analysis method used here, but most are unlikely to have major effects on the conclusions pertaining to gene linkage. Violation of the within-genotype normality assumption is unlikely to result in a false linkage signal, although it may result in overestimation of the total number of contributing QTLs (but not the number of larger QTLs) (Wijsman and Yu, in press). Similarly, any residual family effect is also likely to manifest only as additional QTLs with small contribution to the variance in the model. This would include small biases in estimated age at onset introduced by awareness of AD in family members. One assumption is that all individuals will eventually develop AD; however, the late onset of this disease means that it is only important that the model approximates the lower tail of the onset distribution for unaffected individuals. Again, this is unlikely to be critical in affecting the linkage signal. The additivity assumption across contributing loci may affect estimates of QTL model parameters but is unlikely to cause a false-positive linkage signal. Finally, the assumption of diallelic QTLs may affect the accuracy of gene localization, as appears to be occurring for APOE. Relaxation of these assumptions is not currently a realistic option, although it may be possible in the future, with further development of the MCMC methods used here.
Although we obtained only weak evidence of linkage to one previously reported region on chromosome 10 among the four other chromosomes that we investigated, there are numerous explanations for discrepancies in mapping results among studies. In addition to the standard explanations involving statistical error and sample sizes, there are differences in ascertainment criteria. The NIMH AD data set, on which a number of published reports of linkage are based, consists of a large number of small families. In contrast, our data set includes a number of very large pedigrees. Differences in the ascertainment criteria involving pedigree sizes and structures can change the proportion of the sample carrying particular risk alleles for a complex trait (McCarthy et al. 1998; Goddard 1999), which can, in turn, affect the power to detect linkage in different studies. Thus, it is possible that some differences are a function of the different pedigree ascertainment. Another difference among studies is the phenotype of the analysis. Here we have performed analysis on age at onset of AD with adjustment of age at onset for the APOE genotype; in other studies, the phenotype has been AD, possibly stratified on some measure of APOE genotypes in the family members. The two phenotypes are clearly related, but the underlying genetic basis need not be identical.
There are a number of known genes in the vicinity of the linkage signal on chromosome 19p. Most do not have any obvious connection with AD. The low-density lipoprotein receptor (LDLR [MIM 606945]) is 2–3 cM away from the location of the peak IR on 19p13.3 and falls below the 90th percentile in the posterior distribution of QTL locations on this chromosome. This is suggestive because of the APOE effect on AD and because of the role of APOE in cardiovascular biology. PIN1 (peptidyl-prolyl cis/trans isomerase, NIMA-interacting, 1 [MIM 601052]) is also nearby. It has been suggested that PIN1 can restore phosphorylated tau and can prevent helical filament formation in AD (Lu et al. 1999). Finally, ELAV1 and ELAV3 (embryonic lethal, abnormal vision, Drosophila, homolog-like 1 [MIM 603466] and 3 [MIM 603458]) are close to LDLR. The ELAV family appears to act in neurons, and human homologues have been implicated in a variety of posttranscriptional processes (Perrone-Bizzozero and Bolognani 2002; Loria et al. 2003). Future identification of the 19p gene will aid in understanding factors influencing age at onset of AD.
Acknowledgments
This study was supported by the National Institutes of Health (grants AG 05136, AG 11762, AG 21544, GM 46255, and AG 08017), the Veterans Affairs Administration, the Metropolitan Life Foundation, and the Alzheimer's Association (grant RGI-96-042). We thank LeoJean Anderson, Paul Ridell, Darin Bisset, Leslie Leong, Xuesong Yu, Dongmei Yu, and Hiep Nguyen, for excellent technical help, and Adele Sadovnick, Leonard Heston, and P. Michael Conneally (National Cell Repository for Alzheimer's Disease), for family material.
Electronic-Database Information
The URLs for data presented herein are as follows:
- Loki, http://www.stat.washington.edu/thompson/Genepi/Loki.shtml
- Marshfield Center for Medical Genetics, http://research.marshfieldclinic.org/genetics/ (for genetic maps)
- Online Mendelian Inheritance in Man (OMIM), http://www.ncbi.nlm.nih.gov/Omim/ (for APP, PSEN1, PSEN2, APOE, MAPT, PRP, A2M, LRP, LDLR, PIN1, ELAV1, and ELAV3)
References
- Almasy L, Blangero J (1998) Multipoint quantitative-trait linkage analysis in general pedigrees. Am J Hum Genet 62:1198–1211 [DOI] [PMC free article] [PubMed] [Google Scholar]
- Amos CI (1994) Robust variance-components approach for assessing genetic linkage in pedigrees. Am J Hum Genet 54:535–543 [PMC free article] [PubMed] [Google Scholar]
- Bacanu SA, Devlin B, Chowdari KV, DeKosky ST, Nimgaonkar VL, Sweet RA (2002) Linkage analysis of Alzheimer disease with psychosis. Neurology 59:118–120 [DOI] [PubMed] [Google Scholar]
- Bennett C, Crawford F, Osborne A, Diaz P, Hoyne J, Lopez R, Roques P, Duara R, Rossor M, Mullan M (1995) Evidence that the APOE locus influences rate of disease progression in late-onset familial Alzheimer’s disease but is not causative. Am J Med Genet 60:1–6 [DOI] [PubMed] [Google Scholar]
- Bertram L, Blacker D, Mullin K, Keeney D, Jones J, Basu S, Yhu S, McInnis M, Go R, Vekrellis K, Selkoe D, Saunders A, Tanzi R (2000) Evidence for genetic linkage of Alzheimer’s disease to chromosome 10q. Science 290:2302 10.1126/science.290.5500.2302 [DOI] [PubMed] [Google Scholar]
- Bird TD, Sumi SM, Nemens EJ, Nochlin D, Schellenberg G, Lampe TH, Sadovnick A, Chui H, Miner GW, Tinklenberg J (1989) Phenotypic heterogeneity in familial Alzheimer’s disease: a study of 24 kindreds. Ann Neurol 25:12–25 [DOI] [PubMed] [Google Scholar]
- Blacker D, Bertram L, Sauders A, Moscarillo T, Albert M, Wiener H, Perry R, Collins J, Harrell L, Go R, Mahoney A, Beaty T, Fallin M, Avramopoulow D, Chase G, Folstein M, McInnis M, Bassett S, Doheny K, Pugh E, Tanzi R (2003) Results of a high-resolution genome screen of 437 Alzheimer’s disease families. Hum Mol Genet 12:23–32 10.1093/hmg/ddg007 [DOI] [PubMed] [Google Scholar]
- Blacker D, Tanzi RE (1998) The genetics of Alzheimer disease: Current status and future prospects. Arch Neurol 55:294–296 10.1001/archneur.55.3.294 [DOI] [PubMed] [Google Scholar]
- Blacker D, Wilcox MA, Laird NM, Rodes L, Horvath S, Go RCP, Perry R, Watson Jr B, Bassett SS, McInnis MG, Albert MS, Hyman BT, Tanzi RE (1998) Alpha-2 macroglobulin is genetically associated with Alzheimer disease. Nat Genet 19:357–360 10.1038/1243 [DOI] [PubMed] [Google Scholar]
- Breitner JCS, Jarvik GP, Plassman BL, Saunders AM, Welsh KA (1998) Risk of Alzheimer disease with the epsilon 4 allele for apolipoprotein E in a population-based study of men aged 62–73 years. Alzheimer Dis Assoc Disord 12:40–44 [DOI] [PubMed] [Google Scholar]
- Chapman N, Igo R, Thomson J, Matsushita M, Brkanac Z, Holzman T, Berninger V, Wijsman E, Raskind W. Linkage analyses of four regions previously implicated in dyslexia: confirmation of a locus on chromosome 15q. Am J Med Genet (in press) [DOI] [PubMed] [Google Scholar]
- Corder EH, Saunders AM, Strittmatter WJ, Schmechel DE, Gaskell PC, Small GW, Roses AD, Haines JL, Pericak-Vance MA (1993) Gene dose of apolipoprotein-E type-4 allele and the risk of Alzheimer’s disease in late onset families. Science 261:921–923 [DOI] [PubMed] [Google Scholar]
- Curtis D, North B, Sham P (2001) A novel method of two-locus linkage analysis applied to a genome scan for late onset Alzheimer’s disease. Ann Hum Genet 65:473–482 10.1046/j.1469-1809.2001.6550473.x [DOI] [PubMed] [Google Scholar]
- Daw E, Thompson E, Wijsman E (2000a) Bias in multipoint linkage analysis arising from map misspecification. Genet Epidemiol 19:366–380 [DOI] [PubMed] [Google Scholar]
- Daw E, Wijsman E, Thompson E (2003) A score for Bayesian genome screening. Genet Epidemiol 24:181–190 10.1002/gepi.10230 [DOI] [PubMed] [Google Scholar]
- Daw EW, Heath SC, Wijsman EM (1999) Multipoint oligogenic analysis of age-at-onset data with applications to Alzheimer disease pedigrees. Am J Hum Genet 64:839–851 [DOI] [PMC free article] [PubMed] [Google Scholar]
- Daw EW, Payami H, Nemens EJ, Nochlin D, Bird TD, Schellenberg GD, Wijsman EM (2000b) The number of trait loci in late-onset Alzheimer disease. Am J Hum Genet 66:196–204 [DOI] [PMC free article] [PubMed] [Google Scholar]
- Durner M, Vieland V, Greenberg D (1999) Further evidence for the increased power of LOD scores compared with nonparametric methods. Am J Hum Genet 64:281–289 [DOI] [PMC free article] [PubMed] [Google Scholar]
- Ertekin-Taner N, Graff-Radford N, Younkin L, Eckman C, Baker M, Adamson J, Ronald J, Blangero J, Hutton M, Younkin S (2000) Linkage of plasma Aβ42 to a quantitative locus on chromosome 10 in late-onset Alzheimer’s disease pedigrees. Science 290:2303 10.1126/science.290.5500.2303 [DOI] [PubMed] [Google Scholar]
- Falconer DS (1995) Introduction to quantitative genetics. Longman, Harlow, England [Google Scholar]
- Forrest W, Feingold E (2000) Composite statistics for QTL mapping with moderately discordant sibling pairs. Am J Hum Genet 66:1642–1660 [DOI] [PMC free article] [PubMed] [Google Scholar]
- Gagnon F, Jarvik G, Motulsky A, Deeb S, Brunzell J, Wijsman E (2003) Evidence of linkage of HDL level variation to APOC3 in two samples with different ascertainment. Hum Genet 113:522–533 10.1007/s00439-003-1006-5 [DOI] [PubMed] [Google Scholar]
- Goate A, Chartier-Harlin MC, Mullan M, Brown J, Crawford F, Fidani L, Giuffra L, Haynes A, Irving N, James L, Mant R, Newton P, Rooke K, Roques P, Talbot C, Pericak-Vance M, Roses A, Williamson R, Rossor M, Owen M, Hardy J (1991) Segregation of a missense mutation in the amyloid precursor protein gene with familial Alzheimer’s disease. Nature 349:704–706 10.1038/349704a0 [DOI] [PubMed] [Google Scholar]
- Goddard K (1999) Study design issues in the analysis of complex genetic traits. PhD thesis, University of Washington, Seattle [Google Scholar]
- Goldstein A, Goldin L, Dracopoli N, Clark W, Tucker M (1996) Two-locus linkage analysis of cutaneous malignant melanoma/dysplastic nevi. Am J Hum Genet 58:1050–1056 [PMC free article] [PubMed] [Google Scholar]
- Göring HH, Williams JT, Dyer TD, Blangero J (2003) On different approximations to multilocus identity-by-descent calculations and the resulting power of variance component-based linkage analysis. BMC Genet Suppl 4:S72 [DOI] [PMC free article] [PubMed] [Google Scholar]
- Hastings WK (1970) Monte Carlo sampling methods using Markov chains and their applications. Biometrika 57:97–109 [Google Scholar]
- Heath SC (1997) Markov Chain Monte Carlo Segregation and linkage analysis for oligogenic models. Am J Hum Genet 61:748–760 [DOI] [PMC free article] [PubMed] [Google Scholar]
- Heath SC, Snow GL, Thompson EA, Tseng C, Wijsman EM (1997) MCMC Segregation and linkage analysis. Genet Epidemiol 14:1011–1016 [DOI] [PubMed] [Google Scholar]
- Hixson JE, Vernier DT (1990) Restriction isotyping of human apolipoprotein E by gene amplification and cleavage with HhaI. J Lipid Res 31:545–548 [PubMed] [Google Scholar]
- Hodge SE, Anderson CE, Neiswanger K, Sparkes RS, Rimoin DL (1983) The search for heterogeneity in insulin-dependent diabetes mellitus. Am J Hum Genet 35:1139–1155 [PMC free article] [PubMed] [Google Scholar]
- Kass R, Raftery A (1995) Bayes factors. J Am Stat Assoc 90:773–795 [Google Scholar]
- Kehoe P, Wavrant-De Vrieze F, Crook R, Wu WS, Holmans P, Fenton I, Spurlock G, Norton N, Williams H, Williams N, Lovestone S, Pérez-Tur P, Hutton M, Chartier-Harlin M, Shears S, Roehl K, Booth J, Van Voorst W, Ramic D, Williams J, Goate A, Hardy J, Owen MJ (1999) A full genome scan for late onset Alzheimer’s disease. Hum Mol Genet 8:237–245 10.1093/hmg/8.2.237 [DOI] [PubMed] [Google Scholar]
- Lendon C, Talbot C, Craddock N, Han S, Wragg M, Morris J, Goate A (1997) Genetic association studies between dementia of the Alzheimer’s type and three receptors for apolipoprotein E in a Caucasan population. Neurosci Lett 222:187–190 10.1016/S0304-3940(97)13381-X [DOI] [PubMed] [Google Scholar]
- Levy-Lahad E, Wasco W, Poorkaj P, Romano DM, Oshima J, Pettingell WH, Yu CE, Jondro PD, Schmidt SD, Wang K, Crowley AC, Fu YH, Guenette SY, Galas D, Nemens E, Wijsman EM, Bird TD, Schellenberg GD, Tanzi RE (1995a) Candidate gene for the chromosome 1 familial Alzheimer’s disease locus. Science 269:973–977 [DOI] [PubMed] [Google Scholar]
- Levy-Lahad E, Wijsman EM, Nemens E, Anderson L, Goddard KA, Weber JL, Bird TD, Schellenberg GD (1995b) A familial Alzheimer’s disease locus on chromosome 1. Science 269:970–973 [DOI] [PubMed] [Google Scholar]
- Loria P, Duke A, Rand J, Hobert O (2003) Two neuronal, nuclear-localized RNA binding proteins involved in synaptic transmission. Curr Biol 13:1317–1323 10.1016/S0960-9822(03)00532-3 [DOI] [PubMed] [Google Scholar]
- Lu P, Wulf G, Zhou X, Davies P, Lu K (1999) The prolyl isomerase Pin1 restores the function of Alzheimer-associated phosphorylated tau protein. Nature 399:784–788 10.1038/21650 [DOI] [PubMed] [Google Scholar]
- Mayeux R, Lee J, Romas S, Mayo D, Santana V, Williamson J, Ciappa A, Rondon H, Estevez P, Lantigua R, Medrano M, Torres M, Stern Y, Tycko B, Knowles J (2002) Chromosome-12 mapping of late-onset Alzheimer disease among Caribbean Hispanics. Am J Hum Genet 70:237–243 [DOI] [PMC free article] [PubMed] [Google Scholar]
- McCarthy M, Kruglyak L, Lander E (1998) Sib-pair collection strategies for complex diseases. Genet Epidemiol 15:317–340 [DOI] [PubMed] [Google Scholar]
- McKhann G, Drachman D, Folstein M, Katzman R, Price D, Stadlan EM (1984) Clinical diagnosis of Alzheimer’s disease: report of the NINCDS-ADRDA Work Group under the auspices of Department of Health and Human Services Task Force on Alzheimer’s Disease. Neurology 34:939–944 [DOI] [PubMed] [Google Scholar]
- Metropolis N, Rosenbluth AW, Rosenbluth MN, Teller AH, Teller E (1953) Equations of state calculations by fast computing machines. J Chem Physiol 21:1087–1091 [Google Scholar]
- Meyer J, Breitner JCS (1998) Multiple threshold model for the onset of Alzheimer’s disease in the NAS-NRC twin panel. Am J Med Genet 81:92–97 [DOI] [PubMed] [Google Scholar]
- Mirra SS, Heyman A, McKeel D, Sumi SM, Crain BJ, Brownlee LM, Vogel FS, Hughes JP, VanBelle G, Berg L (1991) The Consortium to Establish a Registry for Alzheimer’s Disease (CERAD), part II: standardization of the neuropathologic assessment of Alzheimer’s disease. Neurology 41:479–486 [DOI] [PubMed] [Google Scholar]
- Myers A, De-Vrieze F, Holmans P, Hamshere M, Crook R, Compton D, Marshall H, et al (2002) Full genome screen for Alzheimer disease: stage II analysis. Am J Med Genet 114:235–244 10.1002/ajmg.10183 [DOI] [PubMed] [Google Scholar]
- Myers A, Holmans P, Marshall H, Kwon J, Meyer D, Ramic D, Shears S, Booth J, DeVrieze FW, Crook R, Hamshere M, Abraham R, Tunstall N, Rice F, Carty S, Lillystone S, Kehoe P, Rudrasingham V, Jones L, Lovestone S, Pérez-Tur J, Williams J, Owen M, Hardy J, Goate AM (2000) Susceptibility locus for Alzheimer’s disease on chromosome 10. Science 290:2304 10.1126/science.290.5500.2304 [DOI] [PubMed] [Google Scholar]
- Olson J, Goddard K, Dudek D (2001) The amyloid precursor protein locus and very-late-onset Alzheimer disease. Am J Hum Genet 69:895–889 [DOI] [PMC free article] [PubMed] [Google Scholar]
- Ott J (1992) Strategies for characterizing highly polymorphic markers in human gene mapping. Am J Hum Genet 51:283–290 [PMC free article] [PubMed] [Google Scholar]
- Pedersen NL, Posner SF, Gatz M (2001) Multiple-threshold models for genetic influences on age of onset for Alzheimer disease: findings in Swedish twins. Am J Med Genet 105:724–728 10.1002/ajmg.1608 [DOI] [PubMed] [Google Scholar]
- Pericak-Vance M, Grubber J, Bailey L, Hedges D, West S, Santoro L, Kemmerer B, Hall J, Saunders A, Roses A, Small G, Scott WK, Conneally P, Vance J, Haines J (2000) Identification of novel genes in late-onset Alzheimer’s disease. Exp Gerontol 35:1343–1352 10.1016/S0531-5565(00)00196-0 [DOI] [PubMed] [Google Scholar]
- Pericak-Vance MA, Bass MP, Yamaoka LH, Gaskell PC, Scott WK, Tevwedaw HA, Menold MM, Conneally PM, Small GW, Vance JM, Saunders AM, Roses AD, Haines J (1997) complete genomic screen in late-onset familial Alzheimer’s disease. Evidence for a new locus on chromosome 12. JAMA 278:1237–1241 [PubMed] [Google Scholar]
- Pericak-Vance MA, Bebout JL, Gaskell Jr PC, Yamaoka LH, Hung W-Y, Alberts MJ, Walker AP, Bartlett RJ, Haynes CA, Welsh KA, Earl NL, Heyman A, Clark CM, Roses AD (1991) Linkage studies in familial Alzheimer disease: Evidence for chromosome 19 linkage. Am J Hum Genet 48:1034–1050 [PMC free article] [PubMed] [Google Scholar]
- Perrone-Bizzozero N, Bolognani F (2002) Role of HuD and other RNA-binding proteins in neural development and plasticity. J Neurosci Res 68:121–126 10.1002/jnr.10175 [DOI] [PubMed] [Google Scholar]
- Rogaev EI, Sherrington R, Rogaeva EA, Levesque G, Ikeda M, Liang Y, Chi H, Lin C, Holman K, Tsuda T, Mar L, Sorbi S, Nacmias B, Piacentini S, Amaducci L, Chumakov I, Cohen D, Lannfelt L, Fraser PE, Rommens JM, St George-Hyslop PH (1995) Familial Alzheimer’s disease in kindreds with missense mutations in a gene on chromosome 1 related to the Alzheimer’s disease type 3 gene. Nature 376:775–778 10.1038/376775a0 [DOI] [PubMed] [Google Scholar]
- The Ronald and Nancy Reagan Research Institute of the Alzheimer’s Association and the National Institute on Aging Working Group (1998) Consensus report of the working group on molecular and biochemical markers of Alzheimer’s disease. Neurobiol Aging 19:109–116 10.1016/S0197-4580(98)00022-0 [DOI] [PubMed] [Google Scholar]
- Schellenberg GD, Bird TD, Wijsman EM, Orr HT, Anderson LL, Nemens E, White JA, Bonnycastle L, Weber JL, Alonso ME, Potter H, Heston LL, Martin GM (1992) Genetic linkage evidence for a familial Alzheimer’s disease locus on chromosome 14. Science 258:668–671 [DOI] [PubMed] [Google Scholar]
- Schork NJ, Boehnke M, Terwilliger JD, Ott J (1993) Two-trait-locus linkage analysis: a powerful strategy for mapping complex genetic traits. Am J Hum Genet 53:1127–1136 [PMC free article] [PubMed] [Google Scholar]
- Scott W, Hauser E, Schmechel D, Welsh-Bohmer K, Small G, Roses A, Saunders A, Gilbert J, Vance J, Haines J, Pericak-Vance M (2003) Ordered-subsets linkage analysis detects novel Alzheimer disease loci on chromosomes 2q34 and 15q22. Am J Hum Genet 73:1041–1051 [DOI] [PMC free article] [PubMed] [Google Scholar]
- Scott WK, Grubber JM, Aboudonia SM, Church TD, Saunders AM, Roses AD, Pericak-Vance MA, Conneally PM, Small GW, Haines JL (1999) Further evidence linking late-onset Alzheimer disease with chromosome 12. JAMA 281:513–514 [DOI] [PubMed] [Google Scholar]
- Sherrington R, Rogaev EI, Liang Y, Rogaeva EA, Levesque G, Ikeda M, Chi H, et al (1995) Cloning of a gene bearing missense mutations in early-onset familial Alzheimer’s disease. Nature 375:754–760 10.1038/375754a0 [DOI] [PubMed] [Google Scholar]
- Shmulewitz D, Heath SC (2001) Genome scans for Q1 and Q2 on general population replicates using Loki. Genet Epidemiol Suppl 21:S686–S691 [DOI] [PubMed] [Google Scholar]
- Slooter A, Cruts M, Kalmijn S, Hofman A, Breteler M, Van Broeckhoven C, Van Duijn C (1998) Risk estimates of dementia by apolipoprotein E genotypes from a population-based incidence study: the Rotterdam study. Arch Neurol 55:964–968 10.1001/archneur.55.7.964 [DOI] [PubMed] [Google Scholar]
- Smith C (1961) Homogeneity test for linkage data. Proc Sec Int Congr Hum Genet 1:212–213 [Google Scholar]
- Strittmatter WJ, Saunders AM, Schmechel D, Pericak-Vance M, Enghild J, Salvesen GS, Roses AD (1993) Apolipoprotein-E: high-avidity binding to β-amyloid and increased frequency of type 4 allele in late-onset familial Alzheimer disease. Proc Natl Acad Sci USA 90:1977–1981 [DOI] [PMC free article] [PubMed] [Google Scholar]
- Tienari PJ, Terwilliger JD, Ott J, Palo J, Peltonen L (1994) Two-locus linkage analysis in multiple sclerosis (MS). Genomics 19:320–325 10.1006/geno.1994.1064 [DOI] [PubMed] [Google Scholar]
- Tierney L (1994) Markov chains for exploring posterior distributions. Ann Stat 22:1701–1762 [Google Scholar]
- Tunstall N, Owen MJ, Williams J, Rice F, Carty S, Lillystone S, Fraser L, Kehoe P, Neill D, Rudrasingham V, Sham P, Lovestone S (2000) Familial influence on variation in age of onset and behavioural phenotype in Alzheimer’s disease. Br J Psychiatry 176:156–159 10.1192/bjp.176.2.156 [DOI] [PubMed] [Google Scholar]
- Wavrant-DeVrièze F, Pérez-Tur J, Lambert JC, Frigard B, Pasquier F, Delacourte A, Amouyel P, Hardy J, Chartier-Harlin MC (1997) Association between the low density lipoprotein receptor-related protein (LRP) and Alzheimer’s disease. Neurosci Lett 227:68–70 10.1016/S0304-3940(97)00304-2 [DOI] [PubMed] [Google Scholar]
- Wijsman E (2003) Summary of group 8: development and extension of linkage methods. Genet Epidemiol Suppl 25:S64–S71 10.1002/gepi.10286 [DOI] [PubMed] [Google Scholar]
- Wijsman E, Yu D. Joint oligogenic segregation and linkage analysis using Bayesian Markov chain Monte Carlo methods. Mol Biotechnol (in press) [DOI] [PubMed] [Google Scholar]
- Wijsman EM (2002) Joint linkage and segregation analysis using Markov chain Monte Carlo methods. In: Camp N, Cox A (eds) Quantitative trait loci: methods and protocols. Vol 1125. Humana Press, Totowa, NJ, pp 139–161 [DOI] [PubMed] [Google Scholar]
- Wijsman EM, Amos C (1997) Genetic analysis of simulated oligogenic traits in nuclear and extended pedigrees: summary of GAW10 contributions. Genet Epidemiol 14:719–735 [DOI] [PubMed] [Google Scholar]
- Williams J, Duggirala R, Blangero J (1997) Statistical properties of a variance components method for quantitatitve trait linkage analysis in nuclear families and extended pedigrees. Genet Epidemiol 14:1065–1070 [DOI] [PubMed] [Google Scholar]
- Yuan B, Neuman R, Duan S, Weber J, Kwok P, Saccone N, Wu J, Liu K, Schonfeld G (2000) Linkage of a gene for familial hypobetalipoproteinemia to chromosome 3p21.1–22. Am J Hum Genet 66:1699–1704 [DOI] [PMC free article] [PubMed] [Google Scholar]
- Zerbinatti C, Wozniak D, Cirrito J, Cam J, Osaka H, Bales K, Zhuo M, Paul S, Holtzman D, Bu G (2004) Increased soluble amyloid-β peptide and memory deficits in amyloid model mice overexpressing the low-density lipoprotein receptor-related protein. Proc Natl Acad Sci USA 101:1075–1080 10.1073/pnas.0305803101 [DOI] [PMC free article] [PubMed] [Google Scholar]