

Abstract
Na+/H+ antiporters are pH-dependent membrane transport proteins that maintain the homeostasis of H+ and Na+ in living cells. MjNhaP1 from Methanococcus jannaschii, a hyperthermophilic archaeon that grows optimally at 85°C, was cloned and expressed in Escherichia coli. Two-dimensional crystals were obtained from purified protein at pH 4. Electron cryomicroscopy yielded an 8 Å projection map. Like the related E. coli antiporter NhaA, MjNhaP1 is a dimer, but otherwise the structures of the two antiporters differ significantly. The map of MjNhaP1 shows elongated densities in the centre of the dimer and a cluster of density peaks on either side of the dimer core, indicative of a bundle of 4–6 membrane-spanning helices. The effect of pH on the structure of MjNhaP1 was studied in situ. A major change in density distribution within the helix bundle, and a ∼2 Å shift in the position of the helix bundle relative to the dimer core occurred at pH 6 and above. The two conformations at low and high pH most likely represent the closed and open states of the antiporter.
Keywords: electron cryomicroscopy, Na+/H+ antiporter, pH effect
Introduction
Secondary transporters comprise a large and diverse group of membrane proteins that mediate the passage of a wide range of substrates through the cell membrane, using the energy supplied by transmembrane ion gradients. The structures of six different secondary transporters have recently been determined by X-ray crystallography (Dutzler et al, 2002; Murakami et al, 2002; Abramson et al, 2003; Huang et al, 2003; Pebay-Peyroula et al, 2003; Ma and Chang, 2004; Yernool et al, 2004), enabling us to understand the architecture of a small selection of these dynamic membrane proteins. Along with the high-resolution structures, the 3D maps of different secondary transporters in a lipid environment have been determined by electron cryomicroscopy (cryoEM) at 6–7 Å resolution (Williams, 2000; Hirai et al, 2002; Ubarretxena-Belandia et al, 2003). While the three structures of secondary transporters from the major facilitator subfamily (Hirai et al, 2002; Abramson et al, 2003; Huang et al, 2003) are largely similar, those that represent other families or subfamilies all differ significantly from the major facilitators and from one another.
A detailed understanding of transport mechanisms requires high-resolution structures of transporters in different functional states. However, obtaining well-diffracting 3D crystals even of one state is difficult. cryoEM of two-dimensional (2D) crystals provides a viable alternative and yields maps at intermediate resolution in a comparatively short period. By this approach, it is also possible to study conformational changes in situ, with the protein residing in a lipid bilayer (Subramaniam et al, 1993; Unwin, 1995; Tate et al, 2003).
Na+/H+ antiporters are ubiquitous membrane proteins that counter-transport sodium ions and protons. They play a central role in pH homeostasis and in the extrusion of Na+, which is toxic at elevated concentrations (Padan et al, 2001). They are thus crucial for maintaining the electrochemical gradient across the membrane, which provides the driving force for many other transport systems that use either Na+ or H+ as the counter ion. A fascinating property of these antiporters is their response to pH. It has been postulated that a change in pH, acting on a small set of amino-acid side chains, triggers a conformational change that results in activation or inactivation of the transporter (Hayashi et al, 2002; Padan et al, 2004).
We focused on one of three homologues of Na+/H+ antiporters that have been identified in the genome of Methanococcus jannaschii, referred to as MjNhaP1 (Hellmer et al, 2002) and encoded by open reading frame MJ0057. Sequence comparison places MjNhaP1 in the NhaP family of Na+/H+ antiporters, which shows greater homology to eukaryotic proteins such as the human sodium–proton exchanger NHE1 rather than to NhaA from Escherichia coli, the best-characterized Na+/H+ antiporter (Padan et al, 2001). Based on the sequence, the protein is predicted to span the membrane 13 times, which would make it unusual but not unique (Jung et al, 1998) for a secondary transporter. Functional studies on everted membrane vesicles (Hellmer et al, 2003) have shown that MjNhaP1, like its human homologue NHE1, is active at pH 6–6.5, whereas NhaA is active at a pH above 7, and inactive below (Padan et al, 2001).
Although Na+/H+ antiporters have been predicted to undergo a conformational change in response to pH, there has been no structural evidence to support this. We used cryoEM of 2D crystals to study the structure of MjNhaP1 and to map the pH-induced conformational change associated with activation and inactivation of Na+/H+ antiporters.
Results
Expression and oligomeric state
Expression of MjNhaP1 in E. coli yielded typically 0.5–0.7 mg of pure protein per liter of culture. Of several detergents tried, β-D-dodecyl maltoside (DDM) solubilized the protein most efficiently. MjNhaP1 was >85% pure after nickel affinity chromatography, as judged by SDS gel electrophoresis and Coomassie staining (Figure 1A), which indicated a single band at ∼36 kDa. The apparent deviation from the calculated molecular weight (∼47 kDa) is common with membrane proteins. The protein was stable at acidic pH.
Figure 1.

(A) SDS–PAGE (12%) gel stained with Coomassie brilliant blue. Lane 1, membrane fraction (15 μg); lane 2, insoluble fraction after detergent extraction (15 μg); lane 3, soluble fraction after detergent extraction (15 μg); lane 4, protein after affinity purification on nickel column (3 μg); lane 5, Sigma wide-range marker. (B) Blue-Native PAGE (6–20%) showing that the protein is a dimer in detergent solution. Lane 1, purified protein (6 μg); lane 2, purified protein +2% SDS added before loading (6 μg); lane 3, markers in kDa (from top to bottom: ferritin, catalase, BSA dimer and monomer). (C) Activity of purified MjNhaP1 as measured by ΔpH-induced ACMA fluorescence (arbitrary units) at pH 6 and 7.5. The solid line refers to proteoliposomes containing MjNhaP1, the dashed line to control liposomes without protein and the dotted line to proteoliposomes diluted with MTCM buffer containing 0.3 M NaCl (no sodium gradient). The single arrow indicates the addition of liposomes and the double arrow the addition of NH4Cl to dissipate the pH gradient.
Analysis of MjNhaP1 by blue native gel electrophoresis (Schägger and von Jagow, 1991; Heuberger et al, 2002) showed a single protein band migrating at ∼134 kDa (Figure 1B). No higher molecular weight forms were found even upon concentrating the protein. Treatment with the ionic detergent, SDS, resulted in a single band at ∼65 kDa in the same gel system (Figure 1B). We conclude that the 134 kDa band is the MjNhaP1 dimer, and that this dissociates into monomers in SDS. The apparent molecular weight of membrane proteins on blue native gels is known to be up to 80% higher than their calculated mass, due to the partial displacement of detergent by stain (Heuberger et al, 2002). In the case of MjNhaP1, the calculated and apparent molecular masses differed by 40%.
The purified protein was active when reconstituted into liposomes, as judged by the generation of ΔpH in response to a Na+ gradient (Figure 1C). Proton transport caused a fluorescence recovery of the ΔpH-sensing dye 9-amino-6-chloro-2-methoxyacridine (ACMA). This activity was dependent on the external pH. MjNhaP1 was active in H+ transport at pH 6–7, but inactive at pH above 7. Control experiments with the same Na+ concentration on both sides of the membrane indicated that the Na+ gradient was necessary to bring about the pH-induced fluorescence change. Other control experiments with liposomes not containing the transporter did not show fluorescence recovery, indicating that the liposomes were not leaky.
Structure of MjNhaP1
MjNhaP1 formed 2D crystals readily. Tubular crystals measuring 0.3–0.6 μm in width and 0.5–1 μm or more in length were obtained at a lipid-to-protein ratio (LPR) of 0.4–0.55 (w/w). At increasing LPR, round crystalline vesicles were observed, but only the tubular crystals contained well-ordered lattices. Membrane crystals were found in the pH range from 4 to 7. The best lattices were obtained at pH 4 (Figure 2A and B), while crystals grown at higher pH diffracted poorly and were not suitable for image processing. Images of crystals in glucose or trehalose were indistinguishable, as were the two planar lattices that formed as the tubular crystals flattened on the carbon film, which were processed separately. Individual, CTF corrected images indicate that the crystals are ordered to ∼6 Å (Figures 3 and 4A).
Figure 2.

(A) Crystalline tubes of MjNhaP1 negatively stained with 1.5% uranyl acetate (scale bar, 2 μm). (B) Image of a single tube showing the crystal lattice (scale bar, 100 nm).
Figure 3.

Calculated Fourier transform of a single image of MjNhaP1 at pH 4. Each square on the reciprocal lattice describes a Fourier component with the size of the square and number reflecting its signal-to-noise ratio (Henderson et al, 1986). The largest boxes and the smallest numbers describe the most significant reflections. Concentric rings indicate the zero crossings of the contrast transfer function.
Figure 4.
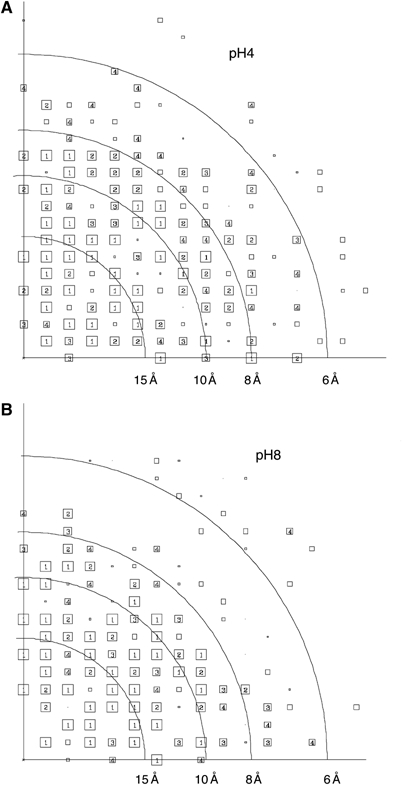
(A, B) Combined phase error to 5 Å after merging of five lattices from separate images at pH 4 and 8, respectively. The size of the boxes corresponds to the phase error after averaging and rounding to 0 or 180° associated with each measurement (1, <8°; 2, <14°; 3, <20°; 4, <30°; 5, <40°; 6, <50°; 7, <70°; 8, <90°, where 90° is random). Values from 1 to 4 are shown as numbers inside boxes, whereas those from 5 to 8 are indicated by decreasing box size.
The crystals had P22121 symmetry, as shown by phase comparison of symmetry-related reflections (Valpuesta et al, 1994). A projection map of MjNhaP1 at pH 4 was calculated, with data truncated to 8 Å resolution (Figure 5A). The unit cell contains four molecules of MjNhaP1 arranged in two dimers, related by a two-fold axis perpendicular to the membrane. The two-fold screw axes parallel to a and b give rise to the alternating up and down orientations of adjacent dimers.
Figure 5.

Projection density map of MjNhaP1 at 8 Å resolution at pH 4 (A) and pH 8 (B), calculated from merged amplitudes and phases of five independent lattices with P22121 symmetry applied. The two-fold axes perpendicular to the membrane plane and the screw axes parallel to a and b are indicated. A unit cell is displayed with the a-axis vertical and the b-axis horizontal. One unit cell contains four molecules of MjNhaP1. Solid lines indicate density above the mean, while negative contours are shown as dotted lines. An isotropic temperature factor (B=−200) was applied to compensate for the resolution-dependent degradation of image amplitudes. The map was scaled to a maximum peak density of 250 and contoured in steps of 21.
The dimer of MjNhaP1 has overall dimensions of ∼51 × 84 Å. Within the projected density of the protein, two regions can be distinguished. The central region, which consists predominantly of elongated peaks, forms the dimer interface. The shape of the density peaks suggests that this region represents a number of highly tilted membrane-spanning helices. On either side of this central core lies a cluster of 4–6 strong density peaks, characteristic of a bundle of helices oriented roughly perpendicular to the membrane.
pH-induced changes
The effect of pH on the structure of MjNhaP1 was examined in situ by incubating the tubular crystals in pH 8 buffer on the EM grid, and trapping any change by rapid freezing. This led to a slight change of the unit cell from a=80 Å, b=108 Å at pH 4 to a=82 Å, b=104 Å at pH 8 (Table I), while the P22121 symmetry and the overall arrangement of MjNhaP1 dimers on the lattice remained the same. An 8 Å projection map of the pH 8 structure was calculated from five different lattices (Figure 5B).
Table 1.
Electron crystallographic data
| pH 4.0 | pH 8.0 | |||
|---|---|---|---|---|
| Plane group symmetry | P22121 | P22121 | ||
| Unit cell dimensions | A=80±0.5 Å | A=82±1 Å | ||
| B=108±1 Å | B=103.6±1 Å | |||
| γ=90° | γ=90° | |||
| No. of images | 5 | 5 | ||
| Range of defocus | 3000–7000 | 2500–8500 | ||
| No. of unique reflectionsa | 125 (7 Å) | 103 (7 Å) | ||
| Overall phase residualb (random=45°) | 14.6 | 15.0 | ||
| Resolution range (Å) |
No. of unique reflections |
Phase residual (random=45°) |
No. of unique reflections |
Phase residual (random=45°) |
| ∞–16.0 | 26 | 10 | 24 | 12.6 |
| 15.9–11.3 | 25 | 14.6 | 23 | 8.1 |
| 11.2–9.2 | 24 | 17.9 | 25 | 12.3 |
| 9.1–8.0 | 24 | 13.4 | 15 | 22.3 |
| 7.9–7.1 | 23 | 16.7 | 15 | 25.8 |
| 7.0–6.5 | 13 | 26.5 | ||
| 6.4–6.0 |
10 |
28.8 |
|
|
| aReflections included to IQ⩽4–7 Å. | ||||
| bAmplitude-weighted, vectorially averaged phase residual, which shows the phase deviation from theoretical 0°/180° (45° is random). | ||||
Significant differences in the projection structures at pH 4 and 8 were evident by visual comparison (Figure 6B and C). The most noticeable effect was a change in the distribution of densities within the helix bundle. In particular, a peak between two of the helix densities (asterisk in Figure 6B) disappears at high pH, and the density peaks within the bundle change shape, suggesting a tilting or rotating movement of individual helices. The helix bundle was displaced by ∼2 Å in a direction roughly parallel to the presumed dimer interface, as estimated from the position of the most prominent helix peaks at low and high pH. The structure of the central core at the dimer interface did not change visibly in response to pH. The difference map (Figure 7A and B) confirms that the pH-induced structural changes are localized at the membrane-spanning helix bundles at either side of the dimer core. As a control, difference maps were calculated from data obtained at the same pH, randomly divided into two sets. These maps provide an estimate of background noise of about one standard deviation (Figure 7C).
Figure 6.

Comparison of Na+/H+ antiporters. (A) Dimer of NhaA from E. coli at pH 4. (B) Dimer of MjNhaP1 at pH 4. (C) Dimer of MjNhaP1 at pH 8. The map resolution is 8 Å, with only positive contours shown. The putative monomer is outlined. The asterisk marks a density in MjNhaP1 that is not present at pH 8. The projection map of NhaA was calculated from the data in Williams et al (1999).
Figure 7.

Difference map of MjNhaP1 projections at pH 4 and 8 (A); difference map generated from pH 4 data divided randomly into two halves (C). The dashed red line indicates the dimer boundary. Overlay of the pH 4 projection map (black) and the difference map, with positive contours in red and negative contours in blue (B). All maps are contoured in steps of 0.5 standard deviations.
The fact that the main difference peaks are localized at a particular region of the MjNhaP1 monomer, and not spread out over the protein, makes it unlikely that the differences we observe are due to the nonisomorphism of the unit cells. To exclude this remote possibility, we generated difference maps in two alternative ways, either using data calculated from the pH 4 projection map positioned in the pH 8 unit cell by molecular replacement, or in real space. All the three difference maps looked essentially the same. The position of the difference peaks in Figure 7A indicates clearly that these changes do not occur at the dimer interface but within the monomer, either in the helix bundle or at the bundle–core interface.
The pH 4 conformation was not observed at pH 8, nor was the pH 8 conformation seen at low pH. However, when tubular crystals of MjNhaP1 were incubated at pH 6.2, lattices with the pH 4 and 8 conformations were occasionally found in the same membrane. Under these intermediate conditions, the unit cell dimensions for the high-pH conformation (a=81 Å, b=104 Å) were in between those observed at pH 4 and 8.
Discussion
Comparison of MjNhaP1 and NhaA
MjNhaP1 has been identified as a Na+/H+ antiporter by sequence comparison, but it is clear from the projection maps (Figure 6) that its structure differs considerably from that of its E. coli homologue, NhaA (Williams et al, 1999), as reflected already in the overall dimensions of the dimer, 51 × 84 Å for MjNhaP1 as compared to 38 × 96 Å for NhaA.
Like E. coli NhaA, the MjNhaP1 dimer can be divided into two distinct regions with a central core and a helix bundle at either side. The structure of the dimer core looks quite different in the two proteins, reflecting differences in the orientation of the membrane-spanning helices, and the interactions between them. The helix bundles on either side of this core show some similarity, but in the case of MjNhaP1 they suggest a more or less perpendicular orientation of the membrane-spanning helices, whereas the helices in E. coli NhaA are predominantly tilted (Williams, 2000). The different activity profiles of the two antiporters are likely to be related to these structural differences.
pH-induced conformational change
MjNhap1 is active at pH 6–7, but inactive at alkaline pH. NhaA on the other hand is active at pH 7 and above, but inactive at acidic pH (Padan et al, 2001). The inactive state of NhaA was thought to be more rigid and therefore to yield better crystals than the active state (Williams et al, 1999). MjNhaP1 crystallizes at low pH under conditions very similar to E. coli NhaA. The quality of the crystals was strongly pH-dependent. Attempts to crystallize MjNhaP1 at higher pH resulted in poorly ordered tubes or small crystalline patches, which were difficult to reproduce.
We therefore investigated the effect of pH on MjNhaP1 by incubating tubular crystals grown at pH 4 in pH 8 buffer on the EM grid. The loss of detail in the 6–8 Å resolution range implied that the crystals or the protein became disordered at pH 8 (Figure 4B), but at 8 Å the quality of data obtained at both pH values was similar (Table I). The pH 8 projection map indicated a significant rearrangement of densities in the helix bundle, and a moderate displacement of the helix bundle relative to the central dimer core.
Open and closed states
It is generally assumed that secondary transporters undergo a change of conformation during the transport cycle. The ion translocation pathways of the Na+/H+ antiporters are thought to open and close in response to pH-induced conformational changes. Such changes have been postulated for E. coli NhaA (Padan et al, 2004) and human NHE3 (Hayashi et al, 2002), but they have not been observed. The conformational change we see in MjNhaP1 is most likely related to its activity.
At pH 4, only one conformation of MjNhaP1 is found (Figure 5A). At pH 6.2, a new conformation appears, which is different from the pH 4 conformation but, at a resolution of 8 Å, looks the same as the pH 8 form (Figure 5B). Our own measurements on MjNhaP1 reconstituted into liposomes (Figure 1C) as well as those of Hellmer et al (2003) on everted membrane vesicles show that the protein is active at pH 6–7. We conclude that the conformation appearing at pH 6.2 is the open, active form of the antiporter, and that another change occurs in MjNhaP1 above pH 7 that prevents ion translocation, but is not visible at 8 Å resolution. NhaA is inactive at low pH, apparently due to the protonation of a set of negatively charged residues (Padan et al, 2001). The same is likely to be true of MjNhaP1, and we therefore believe that the pH 4 projection map of MjNhaP1 shown in Figure 5A represents the inactive, closed conformation. The observation of both conformations in the same tubular crystal at pH 6.2 indicates that the activation occurs near this pH and is brought about by a conformational switch rather than a gradual change with increasing pH. Presumably, a similar switch occurs in NhaA at a pH above 7.
The two monomers in the dimer appear to be active independently of one another, as both undergo the same pH-induced conformational change in the 2D crystals. Studies with the human Na+/H+ antiporter have shown that cations and protons compete for the same binding site on the exocytoplasmic side, implying a single translocation pathway for both ions (Aronson 1985). The extent and location of peaks in the difference map is consistent with one translocation pathway per monomer.
Implications for the mechanism and regulation of ion transport
Secondary transporters of the major facilitator superfamily, such as LacY and GlpT, are thought to function by a rocking motion of two-helix-bundle domains relative to one another in the membrane (Abramson et al, 2003; Huang et al, 2003). However, ion transporters have a very much higher transport rate than these transporters, of the order of 105 translocation events per second (Accardi and Miller, 2004), requiring dynamics on the timescale of a few microseconds. Rather than rigid-body movements of whole domains, such rapid dynamics are apt to involve the rearrangement of individual helices or sets of residues, consistent with the scale of the confined conformational changes we observe.
In contrast to ion channels, transporters need two gates for regulating the translocation of substrates. In the Na+/H+ antiporters, these two gates are likely to be two distinct sets of residues that are protonated or deprotonated in response to pH, thereby closing or opening the ion translocation pathway. The conformational change closing the translocation path at low pH may be brought about by the protonation of acidic side chains, a number of which have been shown to be functionally important in Na+/H+ antiporters. In MjNhaP1, Asp 132 and 161 are essential for transport (Hellmer et al, 2003). Asp132 is a key residue in the TDP sequence motif that is characteristic of Na+/H+ antiporters and conserved in bacteria, archaea and mammals. Conversely, the deprotonation of these residues at ∼pH 6 and above may activate ion translocation.
At a pH above 7, MjNhaP1 again becomes inactive. This step might involve the deprotonation of Arg320, the equivalent of Lys300 in NhaA, which are both directly involved in ion translocation (Hellmer et al, 2003; Padan et al, 2004). The observation that Arg320 can be replaced by a histidine without affecting activity or pH response (Hellmer et al, 2003) suggests that a positive charge is required in this position. The drawing in Figure 8 summarizes our conclusions on the ion translocation mechanism of MjNhaP1 and its regulation.
Figure 8.

Schematic diagram of the Methanococcus Na+/H+ antiporter (MjNhaP1) monomer, showing the proposed response to cytoplasmic pH. At normal internal pH (centre), the antiporter is open and active, balancing the Na+ and pH gradients to maintain the intracellular pH at an optimal level. Closure at low pH (left) is associated with a conformational change that may be caused by the protonation of acidic side chains A and is visible in the projection maps of Figure 4. At pH 7 and above (right), the channel is blocked, presumably due to the deprotonation of basic residues B in the translocation pathway. This change is not visible in the 8 Å map.
Physiological role of MjNhaP1
The interrelationship between Na+ and H+ cycles is well documented in many organisms (Skulachev, 1991) and methanogenic archaea maintain both a proton and a sodium gradient (Deppenmeier et al, 1999). The natural marine habitat of M. jannaschii has a salinity of ∼10–15 mg/l and a pH of 4–6 (KO Stetter, personal communication). A detailed appraisal of the exact physiological role of the antiporter would require additional information on the internal pH and Na+ concentration, and in particular the transport stoichiometry of MjNhaP1, or whether it is electrogenic (like NhaA) or electroneutral (like NHE1). Without this information, we can only attempt to explain the pH response of MjNhaP1 in broad terms.
Assuming that the activity profiles of the Na+/H+ antiporters are adapted to their particular environment and tuned to ensure pH homeostasis in the cell (as is the case for NhaA and E. coli), the internal pH of M. jannaschii is likely to be around 6.5. MjNhaP1 is evidently designed to correct minor changes of the intracellular pH that arise due to metabolic activity. If the internal pH drops slightly, protons are pumped out by using the Na+ gradient. If the internal pH rises by a small amount, the antiporter responds by letting protons in, using the increasing pH gradient to extrude Na+. However, in the event of more extreme pH differences, the antiporter must be switched off to prevent an uncontrolled influx of Na+ that would result from a large outward proton gradient, either at high external or low intracellular pH.
Conversely, a large inward proton gradient, associated with either a high internal or a low external pH, might cause an almost complete loss of Na+ from the cell, which may be undesirable as several of the unique enzymes of M. jannaschii are Na+-dependent, among them the M. jannaschii methyl transferase, a primary Na+ pump. This enzyme has a central role in the Methanococcus metabolism, and extrudes Na+ from the cell as it produces methane from formaldehyde and hydrogen (Gottschalk and Thauer, 2001). These considerations might partly explain why MjNhaP1 shuts down at a pH below 6, and above pH 7.
Conclusion
We have determined the 8 Å projection structure of MjNhaP1, an archaeal homologue of the bacterial Na+/H+ antiporter NhaA and the human Na+/H+ antiporter NHE. Compared to the structure of NhaA (Williams et al, 1999; Williams, 2000), the map of MjNhaP1 looks significantly different at a low pH where both antiporters are thought to be locked in a closed, inactive conformation. This unexpected finding emphasizes the need to investigate more transporters, which might be similar in terms of sequence and function and yet have different molecular architectures.
A conformational switch at pH 6.2 correlates with the activation of MjNhaP1, which is functional at pH 6–7. This switch is most probably related to the protonation or deprotonation of key residues that are known to be involved in ion translocation in the Na+/H+ antiporter family. As there is no further conformational change at increasing pH, the projection map at pH 8 shows the open state of the transporter. The projection maps of MjNhaP1 in two different states call for a high-resolution 3D structure, which will be essential for understanding the exact mechanisms of ion translocation and pH sensing.
MjNhaP1 makes use of the natural salinity of its environment to maintain an optimal intracellular pH, while the mammalian NHE Na+/H+ antiporters use the Na+ gradient generated by the Na+/K+ ATPase for the same purpose. The ways in which the two homologous membrane proteins achieve this are likely to be similar, and thus the pH-induced conformational change we describe provides a first glimpse of the associated molecular mechanism.
Materials and methods
Cloning, expression and purification
Initially, forward and reverse primers (5′-ata aaa tat tta tat gat ttt tag-3′ and 5′-caa gct tcg aaa cta ctt ctc cc-3′) were used to amplify the flanking regions of MJ0057 from the M. jannaschii genomic DNA. The purified PCR product was then amplified with a second set of forward and reverse primers (5′-tta ttg tga tca tat gga act tat g-3′ and 5′-ata att tta ctc gag gga gga ttc ttc-3′) to introduce the restriction sites (NdeI and XhoI) for cloning into an expression vector pET26b (Novagen) with a C-terminal hexa-histidine tag. All PCR reactions were performed with Pfu DNA polymerase (Stratagene) and clones were verified by sequencing. The protein was expressed in BL21 pLysS at 37°C in 2YT media. Cells were induced with 1 mM isopropyl thiogalactoside (IPTG) at an OD of 0.6–0.8 and grown further for 4 h. Cells were harvested and broken with a cell disrupter (Constant Systems). Unbroken cells were removed by low-speed centrifugation. The membrane fraction was collected by centrifugation at 100 000 g at 4°C for 1 h, resuspended in 25 mM Tris, pH 8, and stored at a final protein concentration of 25 mg/ml at −80°C.
Membranes were solubilized in 1.5% DDM (Glycon) for 45 min at room temperature. The insoluble fraction was collected by centrifugation at 100 000 g for 30 min. NaCl and imidazole were added to the soluble fraction at final concentrations of 0.3 M and 10 mM, respectively. The soluble fraction was applied to an Ni-NTA column (Qiagen) pre-equilibrated with TSG buffer (Tris–HCl, pH 8.0, 300 mM NaCl, 10% glycerol) containing 0.05% DDM. Two washing steps with 10 and 30 mM imidazole removed nonspecifically bound proteins. MjNhaP1 was eluted from the column with 25 mM K+ acetate, pH 4.0, 300 mM NaCl, 10% glycerol and 0.05% DDM, or with TSG buffer containing 0.2 M imidazole with 0.05% DDM. Blue native gel electrophoresis was carried out essentially as described by Schägger and von Jagow (1991) and Heuberger et al (2002).
Activity measurements
E. coli polar lipids were dried and resuspended in MTCB (10 mM Mes–Tris, 140 mM choline chloride pH8) buffer with 0.3 M NaCl. MjNhaP1 was added at an LPR of 50:1 (weight by weight) and incubated for 10 min at room temperature. Detergent was removed by overnight incubation with biobeads at 4°C. Proteoliposomes were collected by centrifugation (100 000 g for 20 min) and resuspended in 100 μl of MTCB+0.3 M NaCl.
For activity measurements, 4 μl of proteoliposomes or control liposomes not containing the transporter was diluted in 1 ml MTCB without sodium at pH 6 or 7.5, with 1 μM of the fluorescence dye ACMA. The excitation wavelength was 409 nm and the emission wavelength 474 nm, with a slit width of 5 nm. Finally, the pH gradient was dissipated with 25 mM NH4Cl. All measurements were carried out at 23°C in a Hitachi fluorimeter.
2D crystallization
Protein in DDM at a final concentration of 1 mg/ml and E. coli polar lipids (Avanti Polar Lipids) solubilized in 1% β-D-decyl maltoside (DM) were mixed at a wide range of lipid to protein ratio (LPR) of 0.3–0.75 (w/w) and incubated at room temperature for 1 h before being transferred to dialysis bags with a 14 kDa cutoff. All crystallizations were carried out at 37°C, in 25 mM acetate, pH 4, 0.2 M NaCl, 5% glycerol and 5% 2–4-methylpentanediol. The crystals grew in 5–7 days and were stable for several months.
Electron microscopy
Negatively stained specimens were screened in a Philips CM12 microscope and images were recorded at a magnification of × 45 000. Batches of well-ordered crystals were analyzed by cryoEM. Samples were prepared by the back injection method (Wang and Kühlbrandt, 1991). In all, 2 μl of crystal suspension was applied to a carbon-coated copper grid, to which a small volume of 4%, pH 4.9 glucose or trehalose solution had been applied. Grids were blotted and rapidly frozen in liquid nitrogen. Images were recorded using a JEOL 3000 SFF electron microscope equipped with a field emission gun and liquid-helium-cooled top entry stage, with an accelerating voltage of 300 kV at a specimen temperature of 4 K and a magnification of × 53 000, using a spot scan procedure with an exposure time of 35 ms per spot. Images recorded on Kodak SO-163 electron emulsion film were developed for 12 min in full-strength Kodak D19 developer. The quality of negatives was evaluated by optical diffraction and those exhibiting strong reflections to 10 Å were selected for further processing.
pH-induced conformational change
Samples were prepared by back injection as described, but the embedding medium (4% trehalose) was buffered with 25 mM Tris, pH 8, or 25 mM MES pH 6.2. In all, 2 μl of the sample was applied to the carbon film, mixed thoroughly and excess liquid was blotted off. Then, 2 μl of 25 mM Tris, pH 8 or 25 mM MES, pH 6.2 was applied and mixed thoroughly, allowed to stand for a minute and blotted. The grids were rapidly frozen in liquid nitrogen. Images were collected as described above. Three different experiments gave identical results.
Image processing
Selected image areas of 4000 × 4000 pixels were digitized with a pixel size of 7 μm on a Zeiss SCAI scanner. Images were processed using the MRC image-processing programs to correct lattice distortions and contrast transfer function (Henderson et al, 1986; Crowther et al, 1996). Typically, 3–4 cycles of unbending were carried out for each lattice. The program ALLSPACE was used to determine the phase residuals (Valpuesta et al, 1994). The five best lattices at each pH were merged at 5 Å to generate data sets from which projection maps were calculated.
Difference maps
Difference maps were calculated using phases and scaled amplitudes of structure factors obtained at both pH values. Alternatively, a dimer from the pH 4 projection map was masked out and placed into the pH 8 unit cell by molecular replacement, using the program MOLREP (Vagin and Teplyakov, 1997). Projection amplitudes and phases were calculated, scaled and subtracted from the pH 8 data as above. In addition, the dimer from each pH was cut out and subtracted in real space using the program SPIDER (Frank et al, 1996).
Acknowledgments
We thank Deryck Mills for help with the electron microscopy and Daniel Rhinow for his input in the initial stages of project. We would like to acknowledge help and advice from Janet Vonck, David Parcej and Inga Schmidt-Krey on image processing, Anke Terwisscha van Scheltinga on molecular replacement and Paolo Lastrico with the figures. This work has been funded in part by the International Max-Planck Research School ‘Structure and function of biological membranes' and SFB 628.
References
- Abramson J, Smirnova I, Kasho V, Verner G, Kaback HR, Iwata S (2003) Structure and mechanism of the lactose permease of E. coli. Science 301: 610–615 [DOI] [PubMed] [Google Scholar]
- Accardi A, Miller C (2004) Secondary active transport mediated by a prokaryotic homologue of ClC Cl− channels. Nature 427: 803–807 [DOI] [PubMed] [Google Scholar]
- Aronson PS (1985) Kinetic properties of the plasma membrane Na+/H+ exchanger. Ann Rev Physiol 47: 545–560 [DOI] [PubMed] [Google Scholar]
- Crowther RA, Henderson R, Smith JM (1996) MRC image processing programs. J Struct Biol 116: 9–16 [DOI] [PubMed] [Google Scholar]
- Deppenmeier U, Lienard T, Gottschalk G (1999) Novel reactions involved in energy conservation by methanogenic archaea. FEBS Lett 457: 291–297 [DOI] [PubMed] [Google Scholar]
- Dutzler R, Campbell EB, Cadene M, Chait BT, MacKinnon R (2002) X-ray structure of ClC chloride channel at 3.0 Å reveals the molecular basis of anion selectivity. Nature 415: 287–294 [DOI] [PubMed] [Google Scholar]
- Frank J, Radermacher M, Penczek P, Zhu J, Li Y, Ladjadj M, Leith A (1996) SPIDER and WEB: processing and visualization of images in 3D electron microscopy and related fields. J Struct Biol 116: 190–199 [DOI] [PubMed] [Google Scholar]
- Gottschalk G, Thauer RK (2001) The Na+-translocating methyltransferase complex from methanogenic archaea. Biochim Biophys Acta 1505: 28–36 [DOI] [PubMed] [Google Scholar]
- Hayashi H, Szaszi K, Coady-Osberg N, Orlowski J, Kinsella JL, Grinstein S (2002) A slow pH-dependent conformational transition underlies a novel mode of activation of the epithelial Na+/H+ exchanger-3 isoform. J Biol Chem 277: 11090–11096 [DOI] [PubMed] [Google Scholar]
- Hellmer J, Patzold R, Zeilinger C (2002) Identification of a pH regulated Na+/H+ antiporter of Methanococcus jannaschii. FEBS Lett 527: 245–249 [DOI] [PubMed] [Google Scholar]
- Hellmer J, Teubner A, Zeilinger C (2003) Conserved arginine and aspartate residues are critical for function of MjNhaP1, a Na+/H+ antiporter of M. jannaschii. FEBS Lett 542: 32–36 [DOI] [PubMed] [Google Scholar]
- Henderson R, Baldwin JM, Downing KH, Lepault J, Zemlin F (1986) Structure of purple membrane from Halobacterium halobium: recording, measurement and evaluation of electron micrographs at 3.5 Å resolution. Ultramicroscopy 19: 147–178 [Google Scholar]
- Heuberger EH, Veenhoff LM, Duurkens RH, Friesen RH, Poolman B (2002) Oligomeric state of membrane transport proteins analyzed with blue native electrophoresis and analytical ultracentrifugation. J Mol Biol 317: 591–600 [DOI] [PubMed] [Google Scholar]
- Hirai T, Heymann JA, Shi D, Sarker R, Maloney PC, Subramaniam S (2002) Three-dimensional structure of a bacterial oxalate transporter. Nat Struct Biol 9: 597–600 [DOI] [PubMed] [Google Scholar]
- Huang Y, Lemieux MJ, Song J, Auer M, Wang DN (2003) Structure and mechanism of the glycerol-3-phosphate transporter from E. coli. Science 301: 616–621 [DOI] [PubMed] [Google Scholar]
- Jung H, Rubenhagen R, Tebbe S, Leifker K, Tholema N, Quick M, Schmid R (1998) Topology of the Na+/proline transporter of Escherichia coli. J Biol Chem 273: 26400–26407 [DOI] [PubMed] [Google Scholar]
- Ma C, Chang G (2004) Structure of multidrug resistance efflux transporter EmrE from Escherichia coli. Proc Natl Acad Sci USA 101: 2852–2857 [DOI] [PMC free article] [PubMed] [Google Scholar] [Retracted]
- Murakami S, Nakashima R, Yamashita E, Yamaguchi A (2002) Crystal structure of bacterial multidrug efflux transporter AcrB. Nature 419: 587–593 [DOI] [PubMed] [Google Scholar]
- Padan E, Tzubery T, Herz K, Kozachkov L, Rimon A, Galili L (2004) NhaA of Escherichia coli, as a model of a pH-regulated Na+/H+ antiporter. Biochim Biophys Acta 1658: 2–13 [DOI] [PubMed] [Google Scholar]
- Padan E, Venturi M, Gerchman Y, Dover N (2001) Na+/H+ antiporters. Biochim Biophys Acta 1505: 144–157 [DOI] [PubMed] [Google Scholar]
- Pebay-Peyroula E, Dahout-Gonzalez C, Kahn R, Trezeguet V, Lauquin GJ, Brandolin G (2003) Structure of mitochondrial ADP/ATP carrier in complex with carboxyatractyloside. Nature 426: 39–44 [DOI] [PubMed] [Google Scholar]
- Schägger H, Von Jagow G (1991) Blue native electrophoresis for isolation of membrane protein complexes in enzymatically active form. Anal Biochem 199: 223–231 [DOI] [PubMed] [Google Scholar]
- Skulachev VP (1991) Chemiosmotic systems in bioenergetics: H+ cycles and Na+ cycles. Biosci Rep 11: 387–441 [DOI] [PubMed] [Google Scholar]
- Subramaniam S, Gerstein M, Oesterhelt D, Henderson R (1993) Electron diffraction analysis of structural changes in the photocycle of bacteriorhodopsin. EMBO J 8: 1–12 [DOI] [PMC free article] [PubMed] [Google Scholar]
- Tate CG, Ubarretxena-Belandia I, Baldwin JM (2003) Conformational changes in the multidrug transporter EmrE associated with substrate binding. J Mol Biol 332: 229–242 [DOI] [PubMed] [Google Scholar]
- Ubarretxena-Belandia I, Baldwin JM, Schuldiner S, Tate CG (2003) Three-dimensional structure of the bacterial multidrug transporter EmrE shows it is an asymmetric homodimer. EMBO J 22: 6175–6181 [DOI] [PMC free article] [PubMed] [Google Scholar]
- Unwin N (1995) Acetylcholine receptor channel imaged in the open state. Nature 373: 37–43 [DOI] [PubMed] [Google Scholar]
- Vagin A, Teplyakov A (1997) MOLREP: an automated program for molecular replacement. J Appl Crystallogr 30: 1022–1025 [Google Scholar]
- Valpuesta JM, Carrascosa JL, Henderson R (1994) Analysis of electron microscope images and electron diffraction patterns of thin crystals of φ29 connectors in ice. J Mol Biol 240: 281–287 [DOI] [PubMed] [Google Scholar]
- Wang DN, Kühlbrandt W (1991) High-resolution electron crystallography of light-harvesting chlorophyll a/b-protein complex in three different media. J Mol Biol 217: 691–699 [DOI] [PubMed] [Google Scholar]
- Williams KA (2000) Three-dimensional structure of the ion-coupled transport protein NhaA. Nature 403: 112–115 [DOI] [PubMed] [Google Scholar]
- Williams KA, Geldmacher-Kaufer U, Padan E, Schuldiner S, Kühlbrandt W (1999) Projection structure of NhaA, a secondary transporter from Escherichia coli, at 4.0 Å resolution. EMBO J 18: 3558–3563 [DOI] [PMC free article] [PubMed] [Google Scholar]
- Yernool D, Boudker O, Jin Y, Gouaux E (2004) Structure of a glutamate transporter homologue from Pyrococcus horikoshii. Nature 431: 811–818 [DOI] [PubMed] [Google Scholar]