

Abstract
We show here that the cell cycle-dependent DNA-binding and transcriptional activity of p53 correlates with E2F expression in human primary fibroblasts. E2F1 binds and stimulates DNA-binding, transactivation and apoptotic functions of p53 but not p63 and p73. E2F1 binds residues 347–370 of p53 and enhances nuclear retention of Ser315 phosphorylated p53. This regulation of p53 by E2F1 is cell cycle dependent, as the cellular distribution of Ser315 phosphorylated p53 is associated with the periodic expression of E2F and cyclin A throughout the cell cycle. This is the first demonstration that the activities of p53 are regulated during the cell cycle by E2F/p53 interactions and that phosphorylation of p53 at Ser315 is required for this regulation.
Keywords: cell cycle, E2F1, nuclear export, p53, Ser315
Introduction
Tumours expressing wild-type p53 tend to respond better to cancer treatments than tumours expressing mutant p53. This emphasises the importance of understanding how to stimulate the tumour suppression function of wild-type p53 in human tumours. To achieve this, we need to know how the activities of wild-type p53 are regulated in normal cells. Despite extensive studies of p53 over the past two decades, very little is known about its regulation in normal cells during the cell cycle. A previous study showed that the cyclin A-binding domain of E2F1, located at its N-terminus, is required and sufficient to bind and stimulate the apoptotic function of p53. This activity exists only in the three E2F members able to bind cyclin A, that is, E2F1–3. Moreover, cyclin A competes with p53 to bind E2F1 (Hsieh et al, 2002). In normal cells, the expression levels of E2F1–3 and cyclin A are precisely regulated during the cell cycle. The expression levels of E2F are high at the G1/S transition, whereas cyclin A is high at mid-S to the G2/M phases of the cell cycle (Sherr, 1996). The expression levels of p21WAF1/CIP1, a cyclin-dependent kinase inhibitor and a p53 target gene, were the highest at the G1/S transition and the lowest at the S phase of the cell cycle (Li et al, 1994). In various untransformed cells, nuclear p53 was detected only in cells at the G1/S transition, while cytoplasmic p53 was associated with S-phase cells and cells expressing high levels of cyclin A (Shaulsky et al, 1990; David-Pfeuty et al, 1996). The striking similarity of the timing between p21WAF1/CIP1 expression and the periodic expression of E2F during the cell cycle led us to hypothesise that the E2F/p53 interactions might play a role in regulating the transcriptional activity of p53 throughout the cell cycle.
Factors that influence the DNA binding and cellular localisation of p53 are likely to influence its transactivation and apoptotic functions, as p53 constantly shuttles between the cytoplasm and nucleus. Would E2F1 use this mechanism to regulate the activity of p53? We tested this possibility and demonstrated here how E2F1/p53 interaction regulates the transcriptional activity of p53 throughout the cell cycle.
Results
Cell cycle-dependent DNA-binding and transcriptional activity of p53 correlates with E2F expression
To investigate the relationship between the activity of p53 and the coordinated expression of E2F and cyclin A during the cell cycle, human primary fibroblasts were starved for 72 h and then stimulated with 20% serum for 8, 16, 24 and 36 h. The cell cycle distributions of the fibroblasts before or after the serum stimulation were measured by their DNA content using FACS analysis (Figure 1A). A significant increase in the expression level of cyclin A and a decrease in E2F expression was detected in fibroblasts stimulated with serum for 24 h compared to 8 or 16 h (Figure 1B). At this time point, 30.5% of the cells were in S phase. In fibroblasts activated with serum for 8 and 16 h, a small increase in cyclin A expression coincided with an increase in the expression levels of E2F1–3, suggesting that cells entered the G1/S transition between 8 and 16 h after serum stimulation. Expression levels of p53 remained constant in all cell populations. There was a good correlation between the expression levels of E2F1–3 and the mRNA level of p21WAF1/CIP1 as well as the amount of p21WAF1/CIP1 promoter bound to p53, which were the highest in cells stimulated with serum for 8 h and the lowest after 24 h (Figure 1C). The DNA-binding activity of p53 in vivo analysed by chromatin immunoprecipitation (ChIP) assay correlated well with the expression levels of p21WAF1/CIP1 mRNA (Figure 1D). These results suggested that while the DNA-binding and transcriptional activities of p53 are uncoupled from its protein level, they are closely associated with the expression levels of E2F1–3 during the cell cycle.
Figure 1.
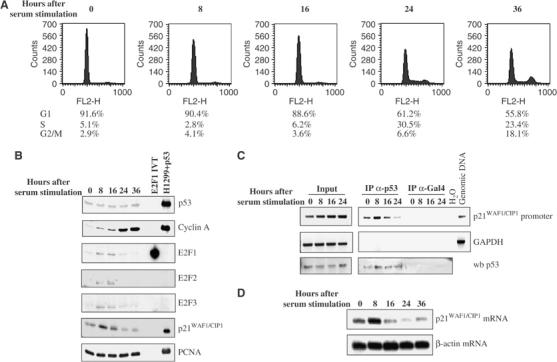
Cell cycle-dependent DNA-binding and transcriptional activities of p53 associate with E2F expression in human primary fibroblasts. (A) FACS analysis to measure the percentage of human primary fibroblasts in G1, S and G2/M phase of the cell cycle after serum starvation or stimulation for the indicated hours. (B) Western blot analysis to detect the expression of indicated proteins in human primary fibroblasts shown in panel A. Lysates derived from H1299 cells expressing p53 (H1299+p53) or an in vitro translation of E2F1 (E2F1 IVT) were used as controls for the mobility of p53, E2F1, p21WAF1/CIP1 and cyclin A. PCNA was used as loading control. (C) ChIP assay in human primary fibroblasts, starved and stimulated with serum as in panel A, using DO-13 antibody to immunoprecipitate p53. Gal4 antibody was used as negative control. p53 (wb p53) was detected in total cell lysates prior to immunoprecipitation (Input) and in immunoprecipitates (IP) (lower panels). Equivalent aliquots of input DNA and p53-immunoprecipitated DNA were PCR amplified using primers for the 5′ p53 response element of p21WAF1/CIP1 promoter or for an unrelated GAPDH genomic sequence (upper panels). H2O and genomic DNA were used as negative and positive controls for the PCR, respectively. (D) Total RNA was prepared from human fibroblasts at the indicated time points after serum stimulation. Full-length human p21WAF1/CIP1 cDNA was used as a probe to hybridise with p21WAF1/CIP1 mRNA in the Northern blot. The Northern blot was subsequently stripped and rehybridised with a β-actin cDNA fragment to confirm the amounts of RNA loaded on the blot.
A p53-binding fragment of E2F1 increases the transcriptional activity of p53 in vivo
To test whether the cell cycle-dependent transcriptional activity of p53 may be regulated by E2F1/p53 interaction, we used the Tet-on system to construct a p53 null human lung carcinoma cell line H1299 inducible for the expression of p53. Subsequently, a p53-binding E2F1 mutant, E2F1(1–108), was introduced into the wild-type p53-inducible cell line. Since E2F1(1–108) lacks the functional domains for binding DNA and E2F's partner protein DP-1, its effect on p53 will be transcriptionally independent and most likely through its ability to interact with p53. Immunofluorescence staining revealed that almost all cells expressed p53 and over 80% of the cells expressed p53 and E2F1(1–108) (data not shown). The resulting H1299 cell lines were grown in medium containing 0.1 or 20% serum to represent arrested and cycling cells, as confirmed by their cyclin A expression levels. Two p53 target genes, p21WAF1/CIP1 and PIG3, were expressed at much lower levels in H1299 cells grown in 0.1% serum than those grown in 20% serum, even though the amounts of p53 induced in those cells were similar (Figure 2, lanes 2 and 6). In the absence of p53, p21WAF1/CIP1 and PIG3 expression was undetectable in both arresting and cycling cells, suggesting that the induced p21WAF1/CIP1 and PIG3 expression was p53 dependent. The expression of E2F1(1–108) significantly enhanced the ability of p53 to induce the expression of p21WAF1/CIP and PIG3 without altering the expression level of p53. The extent of stimulation of p53 transcriptional activity by E2F1(1–108) was greater in arrested than in cycling H1299 cells (Figure 2, compare lanes 2 and 4 with 6 and 8). Hence, the binding of E2F1(1–108) to p53 may have a bigger impact on p53 activity when cyclin A expression level is low.
Figure 2.
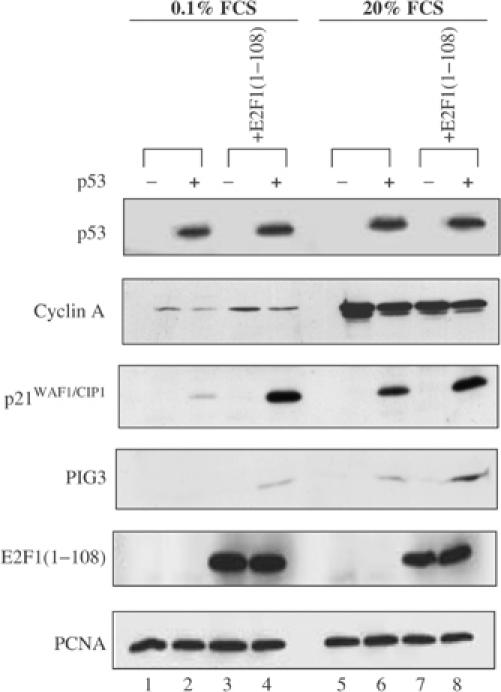
A p53-binding fragment of E2F1, E2F1(1–108), stimulates the transcriptional activity of p53. H1299 cell lines expressing inducible p53 (+) in the presence or absence of E2F1(1–108) were cultured for 48 h in DMEM containing 0.1 or 20% FCS as indicated. The expression levels of p53 and E2F1(1–108) were detected by DO-1 and 9E10 antibodies, respectively. The expression levels of cyclin A, p21WAF1/CIP1 and PIG3 are also indicated.
Binding of E2F1 to p53 enhances the DNA-binding and transcriptional activities of p53 in vivo
To demonstrate that binding of E2F1 to p53 was indeed responsible for the increased transcriptional activity of p53, we constructed an additional H1299 cell line inducible for the expression of p53 and stably expressing E2F1(120Δ85–91), an E2F1 mutant that is defective in binding to p53 (Hsieh et al, 2002) (Figure 3A). The ability of p53 to bind DNA was measured by ChIP assay in the presence or absence of E2F1(1–108) or E2F1(120Δ85–91). Comparable amounts of high-molecular-weight p53/DNA complexes were immunoprecipitated with an anti-p53 antibody, DO-1, from the three different cell lysates (Figure 3B, left panel). Expression of E2F1(1–108), but not E2F1(1–120Δ85–91), stimulated the DNA-binding activity of p53 on the p21WAF1/CIP1 promoter (Figure 3B, right panel, compare lane 2 with lanes 4 and 6). Similar results were also obtained with another anti-p53 antibody, 1801, that recognises a different epitope of p53 (data not shown).
Figure 3.
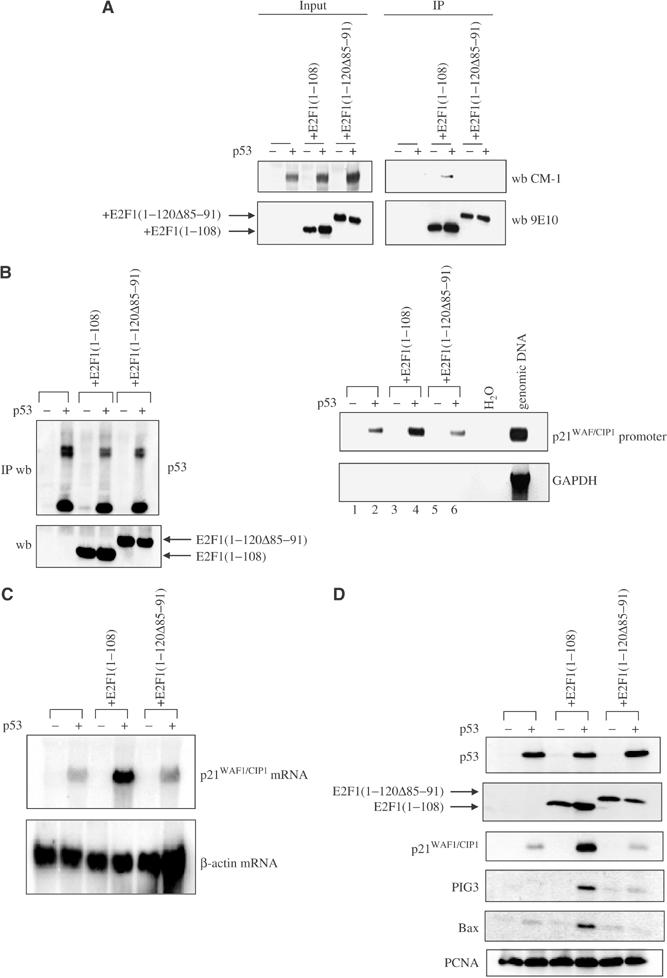
Binding of E2F1 to p53 stimulates the DNA-binding and transactivation functions of p53 in vivo. (A) The expression of p53 was induced (+) by doxycycline in H1299 cells in the presence or absence of E2F1(1–108) or E2F1(1–120Δ85–91). The 9E10 antibody was used to immunoprecipitate 9E10-tagged E2F1(1–108) and E2F1(1–120Δ85–91).The presence of p53 and E2F1 mutants in the total lysates (input) and in the immunoprecipitates (IP) was detected with antibodies CM-1 and 9E10, respectively. (B) A ChIP assay was performed in the above cell lines. DNA/p53 complexes were immunoprecipitated with DO-1. The presence of p53 in the immunoprecipitates (IP wb) and the expression of E2F1(1–108) and E2F1(1–120Δ85–91) in the total lysates (wb) were detected by antibodies CM-1 and 9E10 (left panel). Equal amounts of genomic DNA co-immunoprecipitated with p53 were used as templates to carry out PCR amplification to detect the presence of p21WAF1/CIP1 promoter sequence as shown in Figure 1. Primers for the unrelated GAPDH genomic sequence were used as negative control (right panels). Northern (C) and Western (D) blot analysis of p21WAF1/CIP1, Bax and PIG3 expression in H1299 cells expressing inducible p53 in the presence or absence of E2F1(1–108) or E2F1(1–120Δ85–91).
The expression of E2F1(1–108) but not E2F1(1–120Δ85–91) significantly enhanced the mRNA level of p21WAF1/CIP1 (Figure 3C). The highest protein expression levels of p21WAF1/CIP1, PIG3 and Bax were only detected in the cells expressing E2F1(1–108) together with p53 (Figure 3D). The failure of E2F1(1–120Δ85–91) to enhance the expression of p53 target genes was not due to the lack of protein expression of this E2F1 mutant nor to a reduced expression of p53 (Figure 3D). All these results demonstrated that the binding of E2F1 to p53 is required and sufficient for E2F1 to stimulate the DNA-binding and transactivation functions of p53 in vivo.
Phosphorylation of p53 at Ser315 is required for E2F1 to enhance the activities of p53
To test whether the phosphorylation of p53 at Ser315 by cyclin A/Cdk2 might influence the stimulatory effect of E2F1 on p53, an H1299 cell line inducible for the expression of a Ser315 nonphosphorylatable p53 and p53Ala315 and a derivative cell line stably expressing E2F1(1–108) were constructed. Cells expressing p53 or p53Ala315 were treated with roscovitine, a cyclin-dependent kinase inhibitor (Rudolph et al, 1996). Roscovitine prevented E2F1(1–108) from enhancing p53-induced expression of p21WAF1/CIP1, Bax and PIG3. Under the same conditions, roscovitine did not alter the expression levels of p21WAF1/CIP1, Bax and PIG3 in the cells expressing p53Ala315 (Figure 4A). Hence, phosphorylation of p53 at Ser315 by cyclin A/Cdk2 kinase is required for E2F1 to enhance the transcriptional activity of p53. The influence of E2F1(1–108) on the DNA-binding activity of p53 and p53Ala315 was measured by ChIP assay as described above. Similar amounts of p53 bound to p21WAF1/CIP1 promoter sequences were detected in cell lines expressing p53Ala315+E2F1(1–108) or p53Ala315 (Figure 4B). This was in contrast to the result in cells expressing wild-type p53, where the presence of E2F1(1–108) caused a clear increase in the amount of p21WAF1/CIP1 promoter sequence bound to p53. The DNA-binding activity of p53Ala315 was higher than that of wild-type p53 in this assay, but it correlated with a higher protein expression level (Figure 4B, left and middle panels). The failure of E2F1(1–108) to stimulate the DNA-binding activity of p53Ala315 was not due to the saturation of PCR products, since the intensities of PCR products detected here were still within the linear range of detection (data not shown). The histogram in Figure 4B shows that while E2F1(1–108) was able to enhance the DNA-binding activity of wild-type p53 by three-fold, it failed to have any effect on the DNA-binding activity of p53Ala315. Similarly, E2F1(1–108) enhanced only wild-type p53 but not p53Ala315-induced expression of p21WAF1/CIP1, PIG3 and Bax at both mRNA and protein levels (Figure 4C and D).
Figure 4abcd.
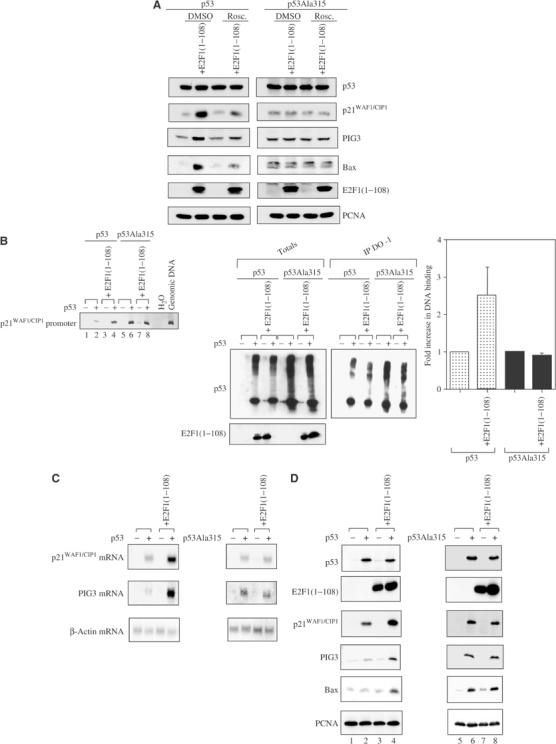
Phosphorylation of p53 at Ser315 is required for E2F1 to stimulate the activities of p53. (A) H1299 cells expressing inducible p53 or p53Ala315 and stable E2F1(1–108) were treated with dimethyl sulfoxide (DMSO) or roscovitine (Rosc) (10 μM) for 14 h. The expression levels of p53 target genes p21WAF1/CIP1, PIG3 and Bax were detected. (B) A ChIP assay as described in Figure 3B was performed in the H1299 cell lines expressing p53 or p53Ala315, in the presence or absence of E2F1(1–108). A Western blot of DO-1 immunoprecipitates (IP DO-1) and of total lysates (Totals) was performed (middle panels). Wild-type p53 and p53Ala315 were detected by the polyclonal antibody CM-1, while 9E10 antibody was used to detect 9E10-tagged E2F1(1–108). DNA co-immunoprecipitated with either p53 or p53Ala315 was used as template for PCR amplification using conditions as that shown in Figure 3B. The amounts of p21WAF1/CIP1 promoter sequences associated with p53 or p53Ala315 were used to set the value as 1. The bar graph shows the fold increase in the amount of p21WAF1/CIP1 promoter sequences associated with wild-type p53 or p53Ala315 when E2F1(1–108) was present. The mean values were derived from at least three independent ChIP experiments. (C) Northern and Western (D) blot analysis as described in Figure 3C and D in the H1299 cell lines as indicated. FACS analysis of Saos-2 cells transfected with p53 or p53Ala315 is shown in the presence or absence of E2F1
To test the effect of E2F1 on the apoptotic function of p53, the expression of p53, p53Ala315 or E2F1 was titrated to induce detectable but low levels of apoptosis. While coexpression of E2F1 or E2F1(1–108) stimulated the apoptotic function of p53, they failed to do so with p53Ala315 (Figure 4E and F). The failure to stimulate the apoptotic function of p53Ala315 was not due to a lack of expression of E2F1 or E2F1(1–108), nor to a failure to form a p53/E2F1 complex, since E2F1 bound to wild-type p53 and p53Ala315 with similar efficiency (Figure 4G). All these results indicated that the phosphorylation of p53 at Ser315 is required for E2F1 to stimulate the DNA-binding, transactivation and apoptotic functions of p53 through direct binding.
Figure 4efg.
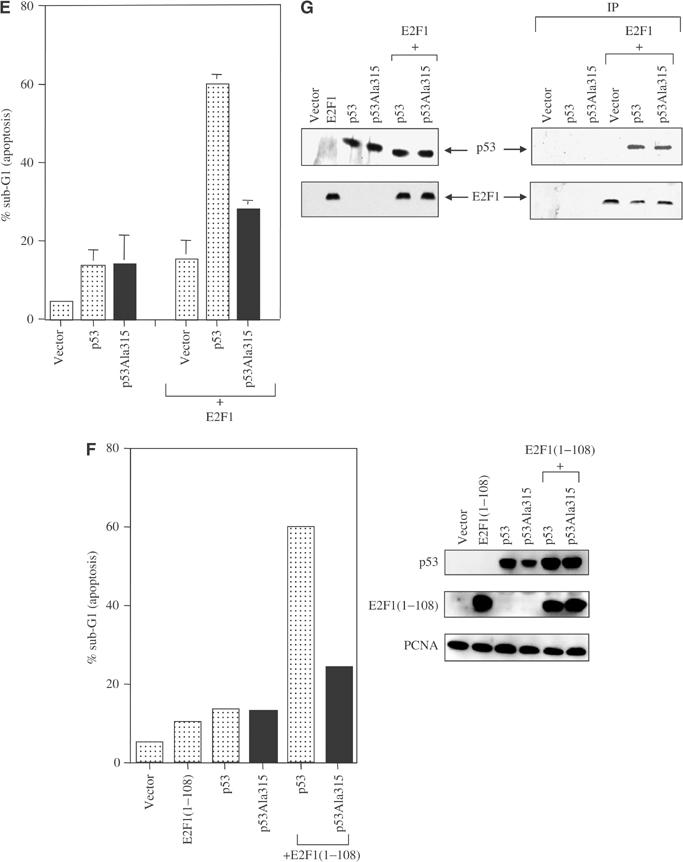
(E) or E2F1(1–108) (F). The bar graphs show the mean percentage of apoptosis derived from two independent experiments. The percentage of apoptotic cells was measured by the accumulation of cells with sub-G1 DNA content. (G) The top panel on the right shows that when 9E10 antibody was used to immunoprecipitate 9E10-tagged E2F1, both p53 and p53Ala315 co-immunoprecipitated. Rabbit polyclonal antibody CM-1 was used to detect p53. The bottom panel on the right shows that comparable amounts of E2F1 were immunoprecipitated.
E2F1 binds and stimulates the activities of p53 but not p63 and p73
To understand how the binding of E2F1 can stimulate the activity of p53, we mapped the region of p53 involved in E2F1 interaction using various truncation mutants of p53 in an in vitro binding assay. As shown in Figure 5A, E2F1 bound wild-type p53 and p53(1–370), but failed to complex with p53(1–347) and p53(1–291). Hence, E2F1 binds residues 347–370 of p53, which are located in a region overlapping with the C-terminal nuclear export signal (NES) and the oligomerisation domain of p53. Interestingly, E2F1 and E2F1(1–108) interacted with both wild-type and monomeric p53, p53KEEK (Sturzbecher et al, 1992) (Figure 5B).
Figure 5.
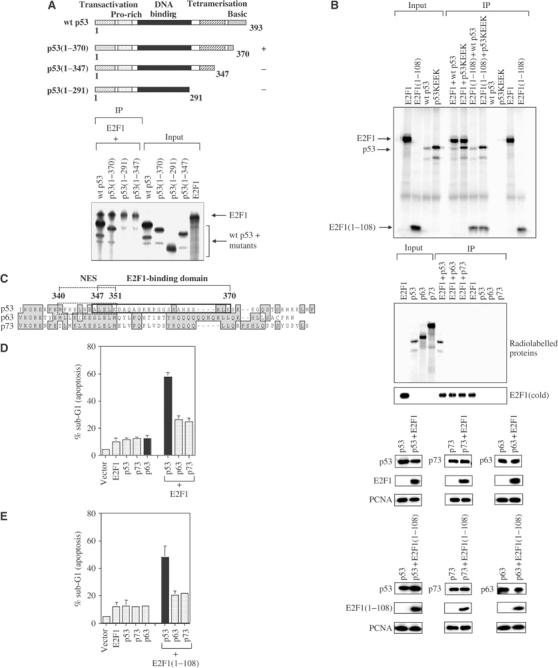
E2F1 specifically binds and stimulates the activities of p53 but not p63 and p73. (A) A diagram of p53 mutants used to identify sequences of p53 required for E2F1 binding. The numbers refer to the residues the p53 mutant contains. The E2F1-binding or nonbinding p53 mutants are denoted as (+) or (−). Both in vitro-translated 35S-methionine-labelled E2F1 and p53 were used. The presence of E2F1 and p53 mutants was detected by autoradiography (lower panel). (B) An in vitro-translated monomeric p53 mutant, p53KEEK, was used in the immunoprecipitation to test its ability to co-immunoprecipitate with E2F1. Wild-type p53 was used as positive control for the binding to E2F1. 9E10 antibody was used to pull down 9E10-tagged wild-type E2F1 or E2F1(1–108) (A, B). (C) Sequence homology analysis of the p53 family members. The E2F1 interaction domain of p53 is boxed in black line and aligned with homologous sequences of p53 family members p63 and p73. The C-terminal p53 NES is boxed in dash line. The numbers refer to the amino acids within the two indicated regions of p53 (left panel). An in vitro co-immunoprecipitation was performed using 35S-methionine-labelled p53, p63 and p73 and cold in vitro-translated E2F1. KH95 monoclonal antibody was used to immunoprecipitate E2F1 and any radiolabelled protein in complex with it. The presence of p53, p63 and p73 was detected by autoradiography, while cold E2F1 was visualised by Western blot using the anti-E2F1 antibody C-20. (D, E) FACS analysis to measure the ability of E2F1 to stimulate the apoptotic function of p53, p63 or p73. p53, p63 and p73 were transfected either alone or in combination with wild-type E2F1 (D) or E2F1(1–108) (E). The bar graphs show the mean percentage of apoptosis derived from at least three independent experiments. Immunoblots of a representative experiment show the expression levels of the transfected genes as indicated.
Although there is a sequence homology among p53 family members (Yang et al, 1998), the region where E2F1 binds on p53 is less homologous between p53 and p63 or p73. Using in vitro-translated and 35S-methionine-labelled p53, p63, p73 and E2F1, we observed that E2F1 bound only p53 but not p63 or p73 (Figure 5C). The expression of E2F1 or E2F1(1–108) also had very little effect on the apoptotic function of p63 and p73 compared to that on p53. The failure to stimulate the apoptotic function of p63 and p73 was not caused by a lack of expression of E2F1, E2F1(1–108), p63 or p73 (Figure 5D and E). These results indicated that E2F1 specifically binds and stimulates the apoptotic function of p53 but not its family members, p63 and p73.
E2F1 binding enhances nuclear retention of Ser315 phosphorylated p53
E2F1 binds to a region that overlaps with the C-terminal NES of p53, suggesting that the E2F1/p53 interaction may influence the nuclear export property of p53. The ability of p53 to carry out nuclear-cytoplasmic shuttling between mouse and human nuclei within a fused heterokaryon in the presence or absence of E2F1 expression was examined. Human p53 was induced in H1299 cells before their fusion to the mouse NIH 3T3 cells. Detection of human p53 expression in a mouse nucleus (human Ku−, p53+) was scored as a positive heterokaryon in which the nuclear-cytoplasmic shuttling of p53 occurred (Figure 6A). A total of 100 heterokaryons were counted for each set of fusions in three independent experiments. The presence of E2F1(1–108) reduced the ability of p53 to shuttle between cytoplasm and nucleus by half. The nuclear-cytoplasmic shuttling property of p53Ala315 was not affected by the expression of E2F1(1–108) (Figure 6B).
Figure 6.
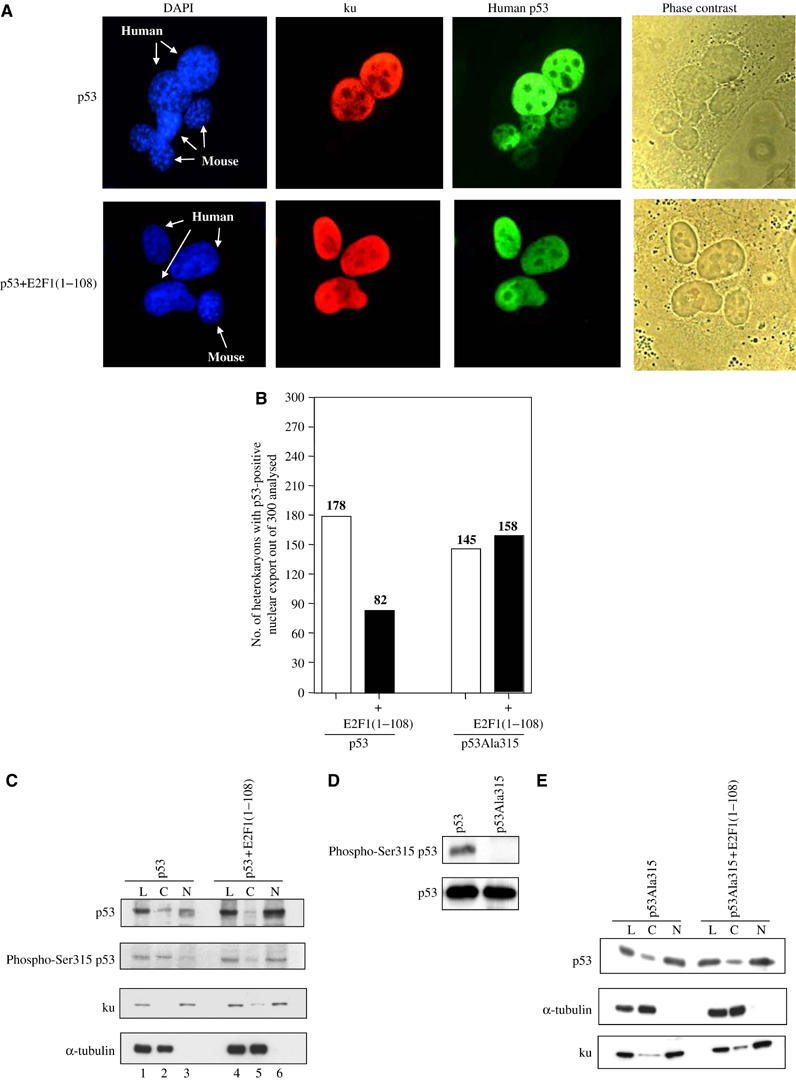
E2F1 binding enhances nuclear retention of Ser315 phosphorylated p53. (A) Heterokaryon assay performed in H1299 cells expressing inducible p53, in the presence or absence of E2F1(1–108), and NIH 3T3 murine cell line. Antibodies DO-1 and ku (p80) Ab-2 were used to detect the expression of human p53 and ku, respectively (FITC for p53 and TRITC for ku). Human and mouse nuclei were also stained with DAPI (blue colour) and indicated with arrows. Phase-contrast images were used to confirm the fusion of cells. (B) Heterokaryons where human p53 was present in mouse (ku−) nuclei were scored as positive for nucleo-cytoplasmic shuttling of p53. The bar graph indicates the total number of heterokaryons scored as positive for p53 nuclear export out of a total of 300 heterokaryons counted for each set of fusions derived from three independent experiments. (C, E) Effect of E2F1 on the cellular distribution of p53 and p53Ala315 in H1299 cells grown in 0.1% serum. The expression levels of p53, Ser315 phosphorylated p53 (phospho-Ser315 p53) (C) and p53Ala315 (E) were detected in the cytoplasmic (C), nuclear (N) and unfractionated cell lysates (L). p53 and p53Ala315 were detected with DO-1 antibody, while Ser315 phosphorylated p53 was detected by a phospho-Ser315 p53 antibody. The specificity of the phospho-Ser315 antibody was confirmed in (D) using lysates derived from H1299 cells expressing either p53 or p53Ala315 (upper panel). The blot was subsequently stripped and reprobed with DO-1 antibody to confirm that the expression levels of p53 and p53Ala315 were similar (lower panel). ku and α-tubulin were used as markers to check the extent of nuclear and cytoplasmic separation.
The ability of E2F1(1–108) to influence the cellular localisation of phosphorylated Ser315 p53 was also tested in vivo by a cytoplasmic and nuclear fractionation analysis. H1299 cells expressing inducible p53 or p53Ala315, in the presence or absence of E2F1(1–108), were grown in 0.1% FCS to reduce the levels of cyclin A. In these conditions, the amounts of cytoplasmic and nuclear p53 detected were similar in H1299 cells expressing only p53. In E2F1(1–108)-expressing H1299 cells, however, the induced p53 was more nuclear (Figure 6C, top panel, compare lanes 2 and 3 with 5 and 6). A change was also observed in the cellular distribution of Ser315 phosphorylated p53, using a previously published and characterised Ser315 phospho-specific antibody to p53 (Saito et al, 2002). In H1299 cells, Ser315 phosphorylated p53 was predominantly cytoplasmic, whereas in E2F1(1–108)-expressing H1299 cells, the induced Ser315 p53 was mainly nuclear (Figure 6C, compare lanes 2 and 5, phospho-Ser315 panel). The specificity of the antibody was further confirmed, as the anti-phospho-Ser315 antibody recognised only Ser315 phosphorylated p53 but not p53Ala315 (Figure 6D). The expression of E2F1(1–108) did not alter the amount of nuclear p53Ala315 (Figure 6E). These observations demonstrated that binding of E2F1 to p53 enhances DNA-binding, transcriptional and apoptotic functions of p53 through the nuclear retention of Ser315 phosphorylated p53.
E2F–p53 interaction influences the localisation of endogenous p53
To demonstrate that E2F–p53 interaction influences the localisation of endogenous p53, mouse embryonic fibroblasts (MEF) derived from E2F1–2 null and conditional for E2F3 (E2F1−/− E2F2−/− E2F3f/f) were used to examine the localisation of endogenous p53. The number of cells expressing cytoplasmic p53, cytoplasmic and nuclear p53 or mainly nuclear p53 was counted in the MEFs before or after the removal of E2F3 expression. In agreement with previous findings, the removal of E2F3 expression resulted in a clear increase in the number of cells expressing cytoplasmic p53. This was also accompanied with a decrease in the number of cells expressing nuclear p53 (Figure 7A). Under the same conditions, very little change was observed on the expression level of p53 although there was a clear decrease in Bax expression. As described previously, a decrease in the expression level of cyclin A was associated with an increase in the expression level of p21WAF1/CIP1 (Figure 7B; Wu et al, 2001). The effect of p53-binding E2F peptide, a peptide derived from the cyclin A-binding region of E2F1 that is homologous among E2F1–3, on the cellular distribution of p53 was also examined. Control and p53-binding peptide of E2F1 were tagged with a peptide sequence from the TAT protein of HIV to allow the cellular entry of the peptides. FITC-conjugated control and p53-binding peptide of E2F1 entered the cells with high efficiency and distributed throughout the cells (Figure 7C). The unlabelled peptides were then used to investigate the effect of E2F binding on the cellular localisation of endogenous p53 (Figure 7D and E). Again the complete lack of E2F expression caused a detectable decrease in the number of cells expressing nuclear p53 in E2F1–3 null MEFs. Similarly, the number of cells expressing cytoplasmic p53 increased. When the E2F1–2 null MEFs were treated with the p53-binding peptide of E2F1, the number of nuclear p53-expressing cells increased dramatically. This increase also occurred in E2F1–3 null MEFs. Under the same conditions, the control peptide had no effect on the cellular distribution of p53. Taken together, the results shown here suggested that E2F/p53 interaction induces nuclear retention of endogenous p53.
Figure 7abcdef.
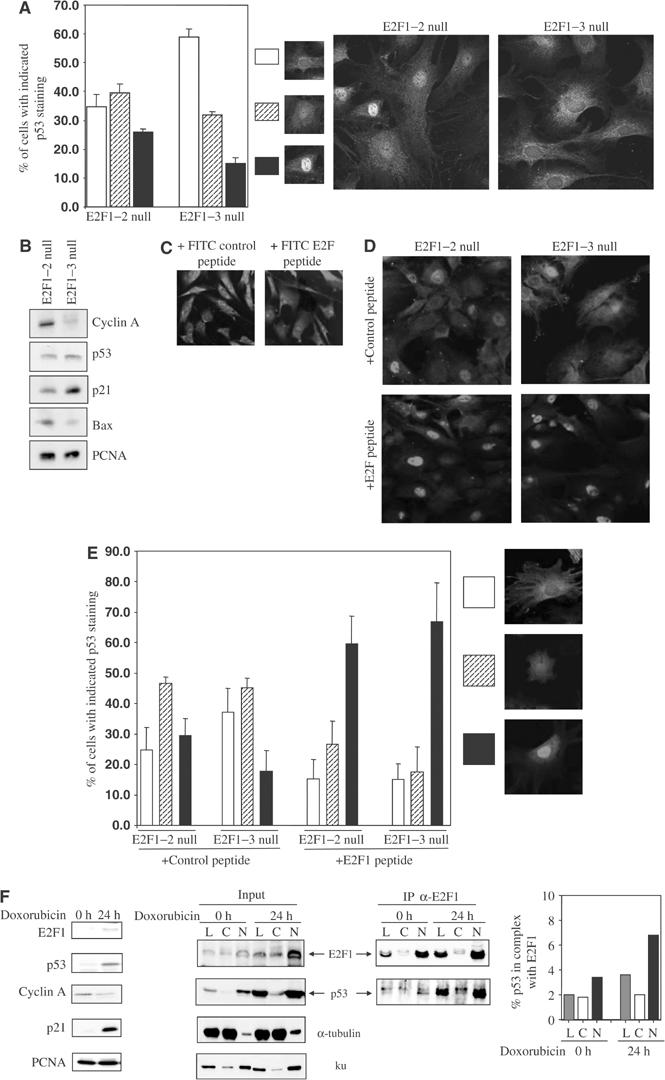
Cell cycle-dependent transcriptional activity of p53 correlates with the amount of nuclear p53 phosphorylated at Ser315. (A) p53 localisation was analysed in MEFs null for E2F1–2 or E2F1–3. (B) Western blots of control (E2F1–2 null) or Cre-retrovirus-infected (+Cre) E2F1−/− E2F2−/− E2F3f/f MEFs (E2F1–3 null) to show the expression levels of the indicated proteins. The cellular distribution of FITC-conjugated control or p53-binding peptide of E2F1 is shown in (C). (D) MEFs null for E2F1–2 or E2F1–3 were treated for 2 h with either the control or p53-binding peptide of E2F1. For (A) and (E), over 300 cells were analysed for p53 cellular distribution in each treated group. The bar graph indicates the mean percentage of cells with cytoplasmic, nuclear and cytoplasmic or strong nuclear staining of p53 obtained from three independent experiments. The expression of p53 was detected by CM-5 antibody. (F) Control and doxorubicin-treated (0.5 μM for 24 h) U2OS cells were fractionated into cytoplasmic and nuclear fractions. The expression levels of E2F1, p53, cyclin A and p21WAF1/CIP1 in all cell lysates were checked by Western blot (left panels). PCNA served as loading control. Equal amounts of proteins from cytoplasmic (C) and nuclear (N) extracts or unfractionated lysates (L) were immunoprecipitated with chemically crosslinked antibodies KH95 or Gal4 (negative control, data not shown). The presence of endogenous E2F1 and p53 in the immunoprecipitates (IP α-E2F1) and in the lysates prior to immunoprecipitation (input) was detected using the rabbit antibodies anti-E2F1 C-20 and CM-1, respectively. The bar graph shows the percentage of p53 co-immunoprecipitated with E2F1 (calculated as described in Materials and methods) in each cellular fraction.
To provide further evidence that endogenous E2F1/p53 interaction retains p53 in the nucleus, U2OS cells were treated with a DNA-damaging agent, doxorubicin, to induce the expression of E2F1 and p53. Lysates derived from cytoplasmic or nuclear fractions of untreated or treated U2OS cells were then used to measure the amount of p53/E2F1 complex. The percentage of endogenous p53 bound to E2F1 in the nuclear fraction was slightly higher than that in the cytosol fraction. In response to the treatment of doxorubicin, there was a significant increase in the amount of nuclear but not cytosolic p53/E2F1 complex (Figure 7F). These results demonstrated that E2F1/p53 interaction retains p53 in the nucleus under a physiological condition.
Cell cycle-dependent transcriptional activity of p53 correlates with the amount of Ser315 phosphorylated nuclear p53
The cellular distribution of endogenous p53 was also examined in human primary fibroblasts before and after serum stimulation using confocal microscopy and cellular fractionation. The amount of nuclear p53 was lower in the cells stimulated with serum for 24 h compared to before (0 h) or after 8 h of stimulation (Figures 7G). In unfractionated lysate, similar amounts of p53 were detected in serum-starved or stimulated human fibroblasts (Figure 7H, total p53 panel, lanes 1, 4 and 7). There was a small but detectable increase in the cytoplasmic p53 and a decrease in the nuclear p53 in the human primary fibroblasts stimulated with serum for 24 h (Figure 7H, total p53 panel, lanes 2, 5 and 8 for cytoplasmic p53 and lanes 3, 6 and 9 for nuclear p53). As the cells progressed through the cell cycle, the amount and cellular distribution of Ser315 phosphorylated p53 changed dramatically. In cells stimulated with serum for 8 and 24 h, there was a large increase in Ser315 phosphorylated p53 (Figure 7H, phospho-Ser315 p53 panel, compare lanes 1, 4 and 7). Most of the Ser315 phosphorylated p53 was nuclear in cells stimulated with serum for 8 h, while 24 h after serum stimulation it was distributed both in the cytoplasm and nucleus (Figure 7H, phospho-Ser315 p53 panel, compare lanes 5 and 6 with 8 and 9). As most S-phase cells were detected in human primary fibroblasts stimulated with serum for 24 h (Figure 1), the cytoplasmic accumulation of Ser315 phosphorylated p53 in this cell population suggested that the transcriptional activity of p53 may be negatively regulated by the nuclear exclusion of Ser315 phosphorylated p53 at S phase of the cell cycle. The data suggested that cyclin A/Cdk2 precisely regulates p53 activities in vivo during the cell cycle through the phosphorylation of p53 at Ser315 and the cellular distribution of Ser315 phosphorylated p53 by E2F interaction.
Figure 7ghi.
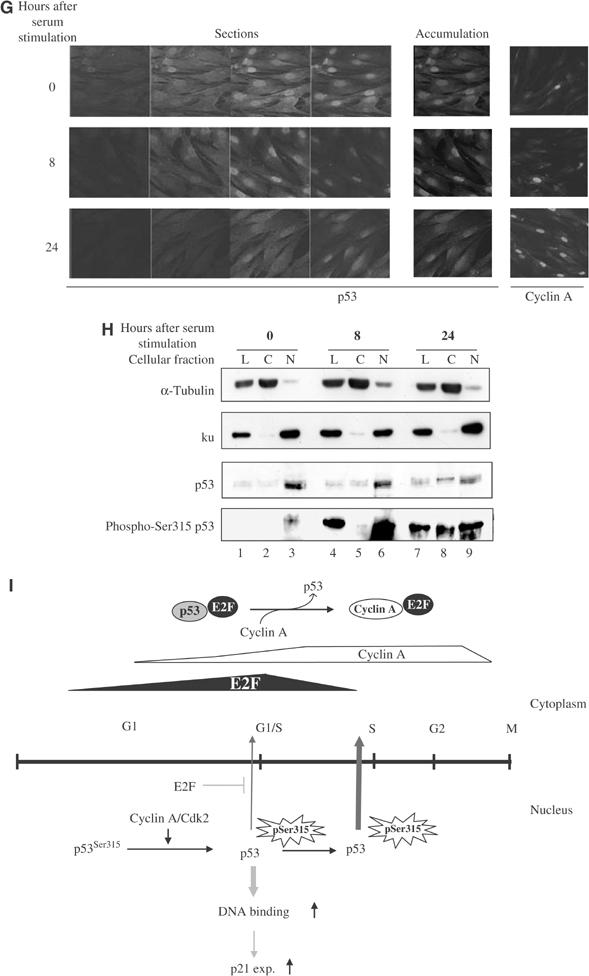
(G) Immunofluorescence staining of p53 in human primary fibroblasts starved (0 h) or stimulated with serum for the indicated hours and examined by confocal microscopy. DO-1 and anti-cyclin A H432 antibodies were used to detect the expression of p53 and cyclin A, respectively. For each time point, four out of 10 sections acquired by laser scanning (sections) are shown in the left panels. The middle panels show the accumulative expression of p53 derived from all 10 sections (accumulation). The accumulative expression level of cyclin A is shown in the right panels. (H) Cytoplasmic (C) and nuclear (N) extracts and unfractionated lysates (L) were prepared from normal human primary fibroblasts starved or stimulated with serum for the indicated length of time. Equal amounts of proteins derived from each fraction were analysed by Western blot. ku and α-tubulin served as markers for the purity of the nuclear and cytoplasmic fractions. Chemically crosslinked DO-13 antibody was used to immunoprecipitate endogenous p53 from equal amounts of total lysates and cellular fractions for each time point. Precipitates were analysed by Western blot using the phospho-Ser315 p53-specific antibody and subsequently DO-1 antibody to detect phosphorylated and total p53 in each fraction at each time point after serum stimulation. (I) A model to explain how coordinated expression of E2F and cyclin A may regulate the activity of p53 throughout the cell cycle and the involvement of p53 phosphorylation at Ser315.
Discussion
Nuclear retention of Ser315 phosphorylated p53 by E2F1/p53 interaction
It is remarkable that the ability of E2F1 to stimulate the activities of p53 is completely dependent on the phosphorylation of p53 at a single site, Ser315. Interestingly, Ser315 is one of the very few phosphorylation sites that are conserved throughout evolution (Soussi et al, 1989) and is mutated in human tumours (see The p53 mutation data base at http://p53.curie.fr). The steady-state level of p53 phosphorylation at this site is the highest in vivo, measured in an NMR study (Abraham et al, 2000; Merrick et al, 2001). More than 10 phosphorylation sites have been identified in p53 and the majority of them are phosphorylated by stress kinases (Appella and Anderson, 2001). However, Ser315 is the only site in p53 that is phosphorylated by kinases involved in cell cycle control such as cyclin A/Cdk2 and cyclin B/cdc2 in vitro (Bischoff et al, 1990; Wang and Prives, 1995). Phosphorylation of p53 at Ser315 results in reduced tetramer stability in vitro (Sakaguchi et al, 1997). In an in vivo situation, this might lead to the exposure of the C-terminal NES allowing Ser315 phosphorylated p53 to be more readily exported into the cytoplasm since the C-terminal NES is masked by oligomerisation of p53. Consistent with this, Ser315 phosphorylated p53 is predominantly cytoplasmic, even though the amounts of total p53 detected in both cytoplasmic and nuclear fractions were similar (Figure 6C). E2F binding at the oligomerisation domain of p53 may mimic the effect of p53 tetramerisation and mask the exposed C-terminal NES of phospho-Ser315 destabilised tetramer, inhibiting its nuclear export. Hence, Ser315 phosphorylated p53 became more nuclear upon expression of E2F1(1–108) or the p53-binding peptide of E2F1.
Moreover, the expression of E2F1 has been shown to induce the phosphorylation of p53 at Ser15 (Rogoff et al, 2002; Russell et al, 2002). Ser15 is part of the N-terminal NES of p53, and Ser15 phosphorylated p53 is defective in binding to Mdm2 (Shieh et al, 1997) and export from the nucleus (Zhang and Xiong, 2001). Hence, E2F1 could stimulate the activities of p53 by enhancing its nuclear retention through inhibiting the nuclear export function of both the N- and C-terminal NES of p53.
Cell cycle-dependent regulation of p53 by interaction with E2F
As quiescent cells are stimulated to re-enter the cell cycle, expression of E2F1–3 is rapidly induced at early G1 and reaches a transient peak at the G1/S transition (Chellappan et al, 1991; Figure 1). Being a transcriptional target of E2F, cyclin A starts to accumulate at the G1/S transition, leading to the phosphorylation of p53 at Ser315 and an increase in the DNA-binding activity of p53. As an autoregulatory loop, Ser315 phosphorylation could inactivate p53 by promoting p53 nuclear export. As the cyclin A expression level at the G1/S transition is still low, the E2F1–3/p53 interactions would occur and retain Ser315 phosphorylated p53 in the nucleus. As a result, the DNA-binding and transactivation functions of p53 are at their highest at the G1/S transition, as seen in human fibroblasts stimulated with serum for 8 h (Figure 1). With a significant increase in cyclin A level, cells enter the S phase. This is accompanied by a decrease in E2F1–3 expression and an increase in Ser315 phosphorylated p53. Thus, the E2F/cyclin A interaction is favoured against E2F/p53 interaction. Ser315 phosphorylated p53 is no longer retained in the nucleus and therefore translocates into the cytoplasm (Figure 7H). Hence, p53 is inactive in S phase of the cell cycle. Therefore, the phosphorylation status of p53 at Ser315, together with the coordinated expression of E2F and cyclin A, provides an efficient mechanism to control the activity of p53 throughout the cell cycle (Figure 7I). The proposed regulation of p53 by E2F binding also functions in stressed conditions. After genotoxic insult, a reduction in cyclin A level associates with an increase in E2F1/p53 complex formation (Hsieh et al, 2002). Importantly, Ser315 phosphorylation of p53 increases in response to DNA damage (Blaydes et al, 2001). Hence, increased amount of E2F/p53 complex after DNA damage would promote nuclear retention of Ser315 phosphorylated p53 and an enhancement of the transcriptional activity of p53.
Based on the data presented here, it remains unclear whether p53Ala315 is more active than wild-type p53. Phosphorylation of p53 at Ser315 by cyclin A/Cdk2 increased the DNA-binding activity of p53 in vitro although in vivo it may destabilise p53 oligomerisation and cause nuclear export of p53. Moreover, the protein half-life of p53Ala315 is slightly longer than that of wild-type p53 (Katayama et al, 2004) (data not shown). Hence, the elevated DNA-binding and transactivation function of p53Ala315 in comparison to wild-type p53 observed in Figure 4 can be interpreted as a result of increased expression of p53Ala315. However, it does not rule out the possibility that p53Ala315 could be more active than wild-type p53.
The finding that the phosphorylation of p53 at Ser315 is required for E2F1 to stimulate the activities of p53 suggested that in some tumour cells, there may be a selective advantage to dephosphorylate p53 at Ser315. Thus, dephosphorylation of p53 at Ser315 may be achieved by increased expression of hCdc14, a human phosphatase that specifically dephosphorylates p53 at Ser315 (Li et al, 2000), in tumour cells expressing wild-type p53. In addition, a point mutation of p53 at serine 315 to proline 315 was found in human lung cancer (Ohno et al, 1997). In E2F1 knockout mice, the highest incidence of solid tumour was also found in the lung (Yamasaki et al, 1996). All these suggested that phosphorylation of p53 at Ser315 may play an important role during the development of human lung cancer.
Materials and methods
Cell culture, antibodies and plasmids
Saos-2, H1299, U2OS, murine NIH 3T3 cells and normal foreskin human primary fibroblasts were grown in DMEM+10% FCS. Immortalised E2F1−/− E2F2−/− E2F3f/f MEFs were kindly provided by Dr Gustavo Leone. Human primary fibroblasts, grown to 40–50% confluence, were serum starved (0.05% FCS+DMEM) for 72 h and then stimulated with DMEM+20% FCS for the indicated hours. Roscovitine and doxorubicin were obtained from Calbiochem and Pharmacia & Upjohn, respectively. DO-13, DO-1 and 1801 are mouse monoclonal while CM-1 and CM-5 are rabbit polyclonal anti-p53 antibodies. 9E10-tagged E2F1 and its mutants E2F1(1–108) and E2F1 (1–120Δ85–91) were recognised by the mouse monoclonal antibody 9E10. Rabbit polyclonal antibody against Ser315 phosphorylated p53 was kindly provided by Dr Appella. Rabbit polyclonal antibodies to E2F1 (C-20), E2F2 (C-20), E2F3 (N-20), cyclin A (H432) and Bax (N-20) and mouse monoclonal anti-E2F1 antibody KH95 were purchased from Santa Cruz Biotechnology. The mouse monoclonal anti-PIG3 antibody (Ab-2) was purchased from Oncogene Research Products. PC-10 and SX118 are mouse monoclonal antibodies specific for PCNA and p21WAF1/CIP1, respectively. The mouse monoclonal anti-HA antibody (Covance) was used to detect HA-tagged p63γ and p73α provided by Dr Gerry Melino. CD20Leu is an FITC-conjugated monoclonal antibody specific for the cell surface marker CD20 (Becton Dickinson). Anti-human Ku nuclear antigen, ku (p80) Ab-2 (clone 111), is a monoclonal antibody provided by NeoMarkers. The mouse monoclonal anti-α-tubulin (clone B-5-1-2) is from Sigma. All the expression plasmids used in this study were driven by the CMV immediate early promoter. The p53 Ala315 and p53KEEK (mutated at residues 341, 344, 348 and 355) have been described previously (Sturzbecher et al, 1992; Crook et al, 1994).
Construction of H1299 cell lines expressing inducible p53 and p53Ala315 and stable E2F1 mutants
The p53 null H1299 cell line was transfected with the pTET-on plasmid (Clonetech Laboratories, CA, USA). The Tet-responsive plasmid (pTRE) containing wild-type p53 or p53Ala315 was then cotransfected with pBabe puro (as selectable marker) into the H1299 cell line containing pTET-on plasmid. Induction of p53 and p53Ala315 by 2 μg/ml of doxycycline was tested by Western blotting and cell staining. Plasmids expressing E2F1(1–108) or E2F1(1–120Δ85–91) were introduced together with the selection plasmid pTK-Hyg into the H1299 cell lines expressing inducible p53 or p53Ala315 to generate the subsequent two cell lines stably expressing the E2F1 mutants.
Flow cytometry
DNA was transfected into p53 null Saos-2 cells using calcium phosphate precipitation, as described previously (O'Connor et al, 1995). For all the transfection experiments, control vector (CMV or pcDNA3 vector) was used to compensate total DNA input and a plasmid expressing CD20 was used as transfection marker. For FACS analysis, 106 cells in a 10 cm dish were transfected with 3 μg of p53, p53Ala315, p73α or p63γ plasmid and 5 μg of plasmid expressing E2F1 or E2F1(1–108). At 30–36 h after the transfection, both attached and floating cells were harvested and analysed by flow cytometry (FACS) as described elsewhere (Hsieh et al, 1997).
In vitro and in vivo immunoprecipitation
E2F1, p53 (and its mutants), p63 and p73 were in vitro translated and labelled with [35S]methionine using the TNT T7 Quick coupled Transcription/Translation System (Promega). Samples (10 μl) of the lysates containing the appropriate in vitro-translated protein products were mixed in PBS in a volume of 200 μl at 30°C for 1 h and then at 4°C for a further hour on a rotating wheel. The appropriate antibody (anti-9E10) immobilised on protein G-Sepharose beads was added to the binding reactions and incubated at 4°C for 1 h to immunoprecipitate 9E10-tagged E2F1. The beads were then washed with PBS. The bound proteins were released in SDS gel sample buffer and analysed by 10% SDS–polyacrylamide gel electrophoresis (PAGE). In vivo immunoprecipitation of p53 with E2F1 was performed as described previously (Hsieh et al, 2002).
Chromatin immunoprecipitation assay
After PBS washing, cells were crosslinked with a 1% formaldehyde (Fisher Scientific) solution in PBS for 10 min at room temperature. The crosslinking reaction was stopped by adding glycine to a final concentration of 0.125 M, and the incubation was continued for 5 min. Crosslinked cells were washed with PBS and lysed in 500 μl of RIPA buffer (Szak et al, 2001) containing a cocktail of protease (Complete Mini, Roche) and phosphatase inhibitors (50 mM NaF, 1 mM Na3VO4 and 10 mM β-glycerophosphate). Samples were sonicated with a Heat Systems sonicator (six bursts of 15 s each) on ice, before centrifugation at 20 000 g for 10 min. Then, 2–4 mg samples of protein extracts were precleared with 10 μl of protein G-Sepharose beads and immunoprecipitated overnight at 4°C with 30 μl bed volume of protein G beads chemically crosslinked to antibodies DO-1, 1801 or DO-13. Crosslinked TA Gal4 antibody was used as negative control for the immunoprecipitation. Immunoprecipitates were washed with RIPA and IP washing buffers as described (Szak et al, 2001). As total input of chromatin, 20% of the supernatant from the Gal4 immunoprecipitation was saved and was processed with the eluted immunoprecipitates beginning at the crosslink reversal step. Immunocomplexes were eluted for 10 min at 85°C in 125 μl of 1% SDS/100 mM NaHCO3. Salmon sperm DNA (0.1 μg/μl) and RNAse A (10 μg) were added to the pooled eluates and crosslinks were reverted by incubation for 6 h at 65°C. Samples were diluted with 125 μl of water containing 0.16 μg/μl proteinase K, and incubated for 1 h at 50°C. DNA was purified with phenol/chloroform and a fraction was used as PCR template to detect the presence of promoter sequences of p21WAF1/CIP1 or GAPDH (25–30 cycles of 30 s melting at 95°C, 30 s annealing at 63°C, 1 min extension at 72°C) using the primers listed below:
- GAPDH:
forward 5′-AACGGATTTGGTCGTATTGGG-3′ reverse 5′-AGTGGGTGTCGCTGTTGAAGTC-3′
forward 5′-GCTGGTGGCTATTTTGTCCTTGGGC-3′ reverse 5′-CAGAATCTGACTCCCAGCACACACTCA-3′
- p21WAF1/CIP1:
forward 5′-GCTGGTGGCTATTTTGTCCTTGGGC-3′ reverse 5′-CAGAATCTGACTCCCAGCACACACTCA-3′
The PCR products were resolved in 2% agarose gels and visualised by ethidium bromide staining. The intensity of PCR products was determined using the GeneTools software from Syngene.
Northern blot hybridisation
Total RNA was isolated from cells grown in 15 cm culture dishes using the Rneasy Kit (Qiagen). A 10 μg portion of RNA from each cell line was loaded onto a 1% agarose gel and resolved by electrophoresis before transfer to a nitrocellulose membrane (Amersham Pharmacia Biotech). p21WAF1/CIP1 and β-actin cDNAs were labelled with [α-32P]dCTP using a Random Prime Labelling System (RNP 1633, Amersham Bioscience) and served as probes to hybridise with RNA on the membrane. Levels of mRNA were quantified using the ImageQuant software from Molecular Dynamics. For reprobing with different labelled cDNAs, membranes were stripped with a boiling solution of 0.1% SDS.
Heterokaryon assay to measure the nuclear-cytoplasmic shuttling of p53
H1299 cells (3 × 10⁵) expressing p53, p53+E2F1(1–108), p53 Ala315 or p53Ala315+E2F1(1–108) were seeded together with NIH 3T3 cells (3 × 10⁵) onto 25 mm glass coverslips in six-well tissue culture plates. The expression of p53 or p53Ala315 was induced with doxycycline (2 μg/ml) for 20–24 h. After the removal of doxycycline by washing with PBS, cells were treated with 50 μg/ml of cycloheximide for 20 min to inhibit de novo protein synthesis. The cells were fused by 2 min incubation with 50% PEG 3350 (Sigma)/DMEM. After fusion, cells were incubated with DMEM/10% FCS containing cycloheximide (50 μg/μl) for 1 h. The cells were then fixed with 4% paraformaldehyde in PBS, permeabilised with 0.2% Triton X-100 for 5 min and incubated in a blocking solution of 1% BSA in PBS for 30 min. The cells were incubated at room temperature with antibodies to human p53 and ku, DO-1 (mouse monoclonal IgG2a) and ku (p80) Ab-2 (mouse monoclonal IgG1), respectively, for 1 h and visualised with FITC- or TRICT-conjugated goat anti-mouse IgG2a and/or IgG1, respectively (Southern Biotechnology). Cells were washed and finally stained with 4′,6-diamidino-2-phenylindole (DAPI) (5 μg/ml) in PBS for 5 min.
Cytosol and nuclear fractionation
Serum-starved and stimulated human fibroblasts grown in 10 dishes (15 cm) were used for each time point. Cells were rinsed and harvested with cold PBS. One-third of the collected cells was pelleted and lysed in NP-40 lysis buffer containing 20 mM HEPES (pH 8.4), 150 mM NaCl, 0.5% NP-40, 1 mM EDTA, 1 mM dithiothreitol (DTT), 10% glycerol and a cocktail of protease and phosphatase inhibitors. Lysates were incubated for 15 min on ice and centrifuged for 15 min at 20 000 g. The supernatants were used as unfractionated lysates (L). The remaining two-thirds of the collected cells were pelleted at 1000 g for 5 min at 4°C, resuspended in four volumes of buffer A (20 mM HEPES (pH 7.6), 20% glycerol, 10 mM NaCl, 1.5 mM MgCl2, 0.1% NP-40, 5 mM DTT and a cocktail of protease and phosphatase inhibitors) and incubated on ice for 20 min with gentle vortexing. After centrifugation for 5 min at 1000 g at 4°C, the supernatant was collected and referred to as cytoplasmic extract (C). The nuclear pellet was resuspended in two volumes of buffer B (20 mM HEPES (pH 7.6), 20% glycerol, 10 mM NaCl, 1.5 mM MgCl2, 0.1% NP-40, 5 mM DTT, 500 mM NaCl and a cocktail of protease and phosphatase inhibitors) and incubated for 30 min on ice before centrifugation for 15 min at 20 000 g at 4°C. The supernatant was collected and referred to as nuclear extract (N). The equal amounts of proteins were analysed by SDS–PAGE or used for immunoprecipitation. When the fractions were used for immunoprecipitation, NaCl and NP-40 were adjusted to a final concentration of 150 mM and 1%, respectively.
To quantify the percentage of endogenous p53 in complex with E2F1 in vivo in U2OS cells, Western blot signals were quantified using the GeneTools software from Syngene. The percentage of p53 in complex with E2F1 was obtained as follows: (intensity of p53 in complex with E2F1 detected in 2 mg of cell lysates from each fraction/intensity of p53 detected in 100 μg of cell lysates from each fraction) × 20.
Retroviral infections
Puromycin-resistant retroviral vector (pBpuro) expressing Cre recombinase was transfected with lipofectamine 2000 (Invitrogen) into the Phoenix-Eco packaging cell line to produce high-titre retroviruses. Immortalised E2F1−/− E2F2−/− E2F3f/f MEFs, seeded at 1.5 × 10⁵ cells per 60 mm dishes, were infected with the retrovirus using standards methods. At 48 h after infection, infected cells were selected for a total of 5 days in the presence of puromycin (2.5 μg/ml), and then analysed by Western blot and immunostaining.
E2F peptide and control peptide
The E2F1/p53-biding peptide contains residues 86–93 of the cyclin A-binding domain of E2F1 (PVKRRLDL). The control peptide contains an unrelated sequence (ETDHQYLAESS). Both peptides are N-terminally linked to a sequence derived from human immunodeficiency virus Tat (YGRKKRRQRRRG), which directs the efficient uptake of heterologous peptides across the membranes.
Acknowledgments
We are grateful to Drs Appella and Saito for providing us the phospho-Ser315 p53 antibody and to Drs Gustavo Leone and Lizhao Wu for kindly providing the immortalised E2F1−/− E2F2−/− E2F3f/f MEFs. We thank Drs Farrell and Watson for the critical reading of the manuscript. This work was supported by Ludwig Institute for Cancer Research.
References
- Abraham J, Kelly J, Thibault P, Benchimol S (2000) Post-translational modification of p53 protein in response to ionizing radiation analyzed by mass spectrometry. J Mol Biol 295: 853–864 [DOI] [PubMed] [Google Scholar]
- Appella E, Anderson CW (2001) Post-translational modifications and activation of p53 by genotoxic stresses. Eur J Biochem 268: 2764–2772 [DOI] [PubMed] [Google Scholar]
- Bischoff JR, Friedman PN, Marshak DR, Prives C, Beach D (1990) Human p53 is phosphorylated by p60–cdc2 and cyclin B–cdc2. Proc Natl Acad Sci USA 87: 4766–4770 [DOI] [PMC free article] [PubMed] [Google Scholar]
- Blaydes JP, Luciani MG, Pospisilova S, Ball HM, Vojtesek B, Hupp TR (2001) Stoichiometric phosphorylation of human p53 at Ser315 stimulates p53-dependent transcription. J Biol Chem 276: 4699–4708, 4699–4708 [DOI] [PubMed] [Google Scholar]
- Chellappan SP, Hiebert S, Mudryj M, Horowitz JM, Nevins JR (1991) The E2F transcription factor is a cellular target for the RB protein. Cell 65: 1053–1061 [DOI] [PubMed] [Google Scholar]
- Crook T, Marston NJ, Sara EA, Vousden KH (1994) Transcription activation by p53 correlates with suppression of growth but not transformation. Cell 79: 817–827 [DOI] [PubMed] [Google Scholar]
- David-Pfeuty T, Chakrani F, Ory K, Nouvian-Dooghe Y (1996) Cell cycle-dependent regulation of nuclear p53 traffic occurs in one subclass of human tumor cells and in untransformed cells. Cell Growth Differ 7: 1211–1225 [PubMed] [Google Scholar]
- Hsieh J-K, Fredersdorf S, Kauzarides T, Martin K, Lu X (1997) E2F1 induced apoptosis requires DNA binding but not transcriptional activity and is inhibited by the retinoblastoma protein through direct interaction. Genes Dev 11: 1840–1852 [DOI] [PubMed] [Google Scholar]
- Hsieh JK, Yap D, O'Connor DJ, Fogal V, Fallis L, Chan F, Zhong S, Lu X (2002) Novel function of the cyclin A binding site of E2F in regulating p53-induced apoptosis in response to DNA damage. Mol Cell Biol 22: 78–93 [DOI] [PMC free article] [PubMed] [Google Scholar]
- Katayama H, Sasai K, Kawai H, Yuan ZM, Bondaruk J, Suzuki F, Fujii S, Arlinghaus RB, Czerniak BA, Sen S (2004) Phosphorylation by aurora kinase A induces Mdm2-mediated destabilization and inhibition of p53. Nat Genet 36: 55–62 [DOI] [PubMed] [Google Scholar]
- Li L, Ljungman M, Dixon JE (2000) The human Cdc14 phosphatases interact with and dephosphorylate the tumour suppressor protein p53. J Biol Chem 275: 2410–2414 [DOI] [PubMed] [Google Scholar]
- Li Y, Jenkins CW, Nichols MA, Xiong Y (1994) Cell cycle expression and p53 regulation of the cyclin-dependent kinase inhibitor p53. Oncogene 9: 2261–2268 [PubMed] [Google Scholar]
- Merrick BA, Zhou W, Martin KJ, Jeyarajah S, Parker CE, Selkirk JK, Tomer KB, Borchers CH (2001) Site-specific phosphorylation of human p53 protein determined by mass spectrometry. Biochemistry 40: 4053–4066 [DOI] [PubMed] [Google Scholar]
- O'Connor DJ, Lam EW-F, Griffin S, Zhong S, Leighton LC, Burbidge SA, Lu X (1995) Physical and functional interactions between p53 and cell cycle co-operating transcription factors, E2F1 and DP1. EMBO 14: 6184–6192 [DOI] [PMC free article] [PubMed] [Google Scholar]
- Ohno A, Hirashima T, Kubo A, Masuda N, Takada M, Fujiwara H, Yasumitsu T, Kiku M, Fukuoka M, Nakagawa K (1997) p53 status and prognosis in stage I–IIIa non-small cell lung cancer. Int J Oncol 10: 521–528 [DOI] [PubMed] [Google Scholar]
- Rogoff HA, Pickering MT, Debatis ME, Jones S, Kowalik TF (2002) E2F1 induces phosphorylation of p53 that is coincident with p53 accumulation and apoptosis. Mol Cell Biol 22: 5308–5318 [DOI] [PMC free article] [PubMed] [Google Scholar]
- Rudolph B, Saffrich R, Zwicker J, Henglein B, Muller R, Ansorge W, Eilers M (1996) Activation of cyclin-dependent kinases by Myc mediates induction of cyclin A, but not apoptosis. EMBO J 15: 3065–3076 [PMC free article] [PubMed] [Google Scholar]
- Russell JL, Powers JT, Rounbehler RJ, Rogers PM, Conti CJ, Johnson DG (2002) ARF differentially modulates apoptosis induced by E2F1 and Myc. Mol Cell Biol 22: 1360–1368 [DOI] [PMC free article] [PubMed] [Google Scholar]
- Saito S, Goodarzi AA, Higashimoto Y, Noda Y, Lees-Miller SP, Appella E, Anderson CW (2002) ATM mediates phosphorylation at multiple p53 sites, including Ser(46), in response to ionizing radiation. J Biol Chem 277: 12491–12494 [DOI] [PubMed] [Google Scholar]
- Sakaguchi K, Sakamoto H, Lewis MS, Anderson CW, Erickson JW, Appella E, Xie D (1997) Phosphorylation of serine 392 stabilizes the tetramer formation of tumor suppressor protein p53. Biochemistry 36: 10117–10124 [DOI] [PubMed] [Google Scholar]
- Shaulsky G, Ben-Se'ev A, Rotter V (1990) Subcellular distribution of the p53 protein during the cell cycle of Balb/c 3T3 cells. Oncogene 5: 1707–1711 [PubMed] [Google Scholar]
- Sherr CJ (1996) Cancer cell cycle. Science 274: 1672–1677 [DOI] [PubMed] [Google Scholar]
- Shieh SY, Ikeda M, Taya Y, Prives C (1997) DNA damage-induced phosphorylation of p53 alleviates inhibition by MDM2. Cell 91: 325–334 [DOI] [PubMed] [Google Scholar]
- Soussi T, Caron DFC, Sturzbecher HW, Ullrich S, Jenkins J, May P (1989) Evolutionary conservation of the biochemical properties of p53: specific interaction of Xenopus laevis p53 with simian virus 40 large T antigen and mammalian heat shock proteins 70. J Virol 63: 3894–3901 [DOI] [PMC free article] [PubMed] [Google Scholar]
- Sturzbecher HW, Brain R, Addison C, Rudge K, Remm M, Grimaldi M, Keenan E, Jenkins JR (1992) A C-terminal alpha-helix plus basic region motif is the major structural determinant of p53 tetramerization. Oncogene 7: 1513–1523 [PubMed] [Google Scholar]
- Szak ST, Mays D, Pietenpol JA (2001) Kinetics of p53 binding to promoter sites in vivo. Mol Cell Biol 21: 3375–3386 [DOI] [PMC free article] [PubMed] [Google Scholar]
- Wang Y, Prives C (1995) Increased and altered DNA binding of human p53 by S and G2/M but not G1 cyclin-dependent kinases. Nature 376: 88–91 [DOI] [PubMed] [Google Scholar]
- Wu L, Timmers C, Maiti B, Saavedra HI, Sang L, Chong GT, Nuckolls F, Giangrande P, Wright FA, Field SJ, Greenberg ME, Orkin S, Nevins JR, Robinson ML, Leone G (2001) The E2F1–3 transcription factors are essential for cellular proliferation. Nature 414: 457–462 [DOI] [PubMed] [Google Scholar]
- Yamasaki L, Jacks T, Bronson R, Goillot E, Harlow E, Dyson NJ (1996) Tumour induction and tissue atrophy in mice lacking E2F-1. Cell 85: 537–548 [DOI] [PubMed] [Google Scholar]
- Yang A, Kaghad M, Wang Y, Gillet E, Fleming M, Dotsch V, Andrews N, Caput D, McKeon F (1998) p63, a p53 homolog at 3q27–29, encodes multiple products with transactivating, death-inducing, and dominant-negative activities. Mol Cell 2: 305–316 [DOI] [PubMed] [Google Scholar]
- Zhang Y, Xiong Y (2001) A p53 amino-terminal nuclear export signal inhibited by DNA damage-induced phosphorylation. Science 292: 1910–1915 [DOI] [PubMed] [Google Scholar]