

Abstract
To fine map genes, investigators often test for disease-marker association in chromosomal regions with evidence for linkage. Given a marker allele tentatively associated with disease, one would ask if this allele, or one in linkage disequilibrium (LD) with it, could account in part for the observed linkage signal. This question can be addressed by determining if families selected on the basis of the presence of the tentatively associated allele show stronger evidence of linkage as measured by increased allele sharing identical by descent (IBD) by affected family members. However, common selection strategies can be biased for or against linkage in the marker region, even given no disease-marker association. We define unbiased selection schemes and extend the definition to allow weighted selection on the basis of all genotyped family members. For affected-sibship data, we describe three genotype-based weight variables, corresponding to dominant, recessive, and additive models. We then introduce a test for association of a family weight variable with excess IBD sharing. This test allows us to determine if the linkage signal in a region can be attributed in part to the presence of a marker allele, either because of direct involvement in disease etiology or because of LD with a predisposing genetic variant. For samples of 500 affected sib pairs, the tests are powerful in detection of genotype-IBD sharing association, even for disease models with sib relative risk as low as λS=1.1, or when evidence for linkage is absent because of sampling variation. This makes our method a new tool for detecting linkage as well as association, especially in regions harboring a candidate gene. We have implemented these methods in the software package GIST (Genotype-IBD Sharing Test).
Introduction
In a gene-mapping study, we seek to map and identify genetic variants that predispose to a human disease. There have been many successes in identifying genes for Mendelian diseases such as Huntington disease (Huntington’s Disease Collaborative Research Group 1993), or special Mendelian forms of complex diseases such as mature-onset diabetes of the young (e.g., Yamagata et al. 1996). However, it is much more challenging to identify genetic variants that predispose to complex diseases that are multifactorial and heterogeneous.
For complex diseases, investigators often map the disease of interest first by linkage analysis, followed by association analysis in regions with evidence for linkage. In this setting, genotypes will be available for most family members for the genetic markers used in linkage analysis and will be available for some or all family members for markers used for association analysis. When an allele is found to be statistically associated with disease in our sample, we call it an “associated” allele, with an understanding that the association is tentative and may not be functional. Given an allele that is associated with disease, we wish to ask if this allele, or one in linkage disequilibrium (LD) with it, could account in part for the observed linkage signal.
One way to address this question is to determine if subsets of families selected on the basis of presence of an associated allele show stronger evidence of linkage as measured by increased allele sharing identical by descent (IBD). One possible subset is the set of families in which any genotyped affected member carries the associated allele; a second is the set of families in which the genotypes of included affected members are all homozygous for the allele (Horikawa et al. 2000). Unfortunately, if multiple affected family members are genotyped, even if the marker is not associated with disease, standard linkage analysis on the first subset is biased against linkage in the region of the marker, reducing or even eliminating possible linkage signals, whereas linkage analysis on the second subset is biased for linkage in the region of the marker, artificially generating or amplifying linkage signals. Horikawa et al. (2000) proposed a simulation-based correction for this bias under the assumption of no association.
Alternatively, one may select families in which the index case carries (or is homozygous for) the associated allele (Horikawa et al. 2000). This avoids bias (see the “Methods” section). However, if multiple affected family members are genotyped, this approach ignores families in which the index case happens not to carry (or to be homozygous for) the associated allele, while one or more of his or her affected relatives do. Moreover, inclusion of families solely on the basis of the index case seems quite arbitrary, unless the index cases represent a particular set of individuals different from their affected relatives. If multiple affected family members are genotyped, one might first randomly choose an affected member from each family and then select families on the basis of the genotype of the chosen individual. This also avoids bias; however, it usually results in different subsets of families and different numbers of families, introducing additional variability. This variation can be substantial, particularly if the associated allele is relatively infrequent. We wish to have a valid subset linkage analysis that both reflects the effect of the associated allele and does not depend on the choice of affected member in families with >1 genotyped member.
In this paper, we investigate selection schemes for affected sibships with genotype data available on ⩾1 sib. To reduce variation and make full use of the sibship genotype information, we consider all possible subsets that result on the basis of the genotype of one random sib. Each sibship is selected into a proportion of the subsets, with the proportion being determined by the genotypes of all affected sibs. We then use this proportion as a weight variable for the sibship, resulting in a weighted selection scheme. For affected sibships, we define three weight variables, corresponding to dominant, recessive, and additive models.
To determine if a marker allele can account in part for the linkage signal in a region, either due to direct predisposition or LD between the marker and a predisposing variant nearby, we introduce procedures to test for association of a genotype-based family weight variable with excess allele sharing IBD. Since for variants that predispose to complex diseases, the genetic model generally is unknown, we also consider a test based on >1 weight variables. Using simulations we show that for samples of 500 affected sib pairs (ASPs), our tests are powerful to detect genotype-IBD sharing association, even for disease models with sib relative risk as low as λS=1.1, or even when there is no evidence for linkage due to sampling variation. In the latter situation, an association between genotype and IBD-sharing will suggest underlying linkage. This makes our method a new tool for detecting linkage as well as association. We have implemented our methods in the software package GIST (Genotype-IBD Sharing Test).
Methods
Outline
In what follows, we first discuss the concept of IBD-sharing configuration and introduce some notation. Second, we define unbiased selection of families so that linkage analysis on the resulting subset is valid. Third, we extend our definition to allow weighted selection, in order both to reduce variation and to make full use of available genotype information when multiple affected family members are genotyped. For affected sibship data, we give three examples of unbiased weighted selection schemes, corresponding to dominant, recessive, and additive models. Fourth, to determine if the linkage signal in a chromosomal region can be attributed in part to the presence of a marker allele, we describe tests for association between a genotype-based family weight variable with excess allele sharing IBD at the marker. Finally, given a weighted selection scheme, we define the NPL (Kruglyak et al. 1996) and LOD scores (Kong and Cox 1997) for the corresponding associated families.
IBD-Sharing Configurations and Notation
An IBD-sharing configuration for a pedigree represents a pattern of allele sharing IBD among pedigree members (Thompson 1974; Whittemore and Halpern 1994). Let S be the set of all possible configurations for a pedigree. For an ASP, S may be represented as {0, 1, 2}, where each element denotes the number of alleles the ASP shares IBD.
Among affected members of a pedigree, the distributions of IBD-sharing configurations at a locus under linkage and under no linkage are different; this serves as the basis of allele sharing-based tests for linkage (Whittemore and Halpern 1994; Kruglyak et al. 1996; Kong and Cox 1997). Different pedigree structures generally have different sets of possible IBD-sharing configurations. To combine signals from different pedigree structures, a scoring function is required to assign a numerical value to each IBD-sharing configuration s∈S. Examples of scoring functions include Spairs and Sall (Whittemore and Halpern 1994); a broader set of scoring functions is described by Sengul et al. (2001). For each pedigree structure, a scoring function is standardized to have mean zero and variance one under no linkage, resulting in a family NPL score Z=Z(s) (Kruglyak et al. 1996). In real applications, we may not have complete IBD information for a locus. In this situation, we calculate the expected family NPL score  conditioned on family genotype data g and assuming no linkage (Kruglyak et al. 1996). In all the simulations in this paper, we define NPL scores based on Spairs.
Suppose there are n families. We consider an autosomal marker in Hardy-Weinberg equilibrium with two or more alleles. Let p be the frequency of allele A. Let a denote the aggregate of all the other alleles, with frequency q=1-p. Let zi (i=0, 1, 2) be the probability that an ASP shares i alleles IBD at the marker. If the marker is unlinked to disease, z0=.25, z1=.5, and z2=.25. For an ASP, if we order the sibs’ genotypes by listing the genotype of the index case before that of the other sib, an ASP has nine possible ordered genotypes at a biallelic marker; table 1 lists the joint distribution of ordered genotype and IBD sharing at the marker, allowing for linkage but assuming no disease-marker association.
Table 1.
Joint Distribution of Ordered Genotype and IBD-Sharing Configuration for ASPs at a Biallelic Marker Under No Association[Note]
|
Weight |
Pr(go, IBD=i) |
|||||
| Ordered Genotypesgo of IndexCase and Sib | φdom | φrec | φadd | i=0 | i=1 | i=2 |
| AA: | ||||||
| AA | 1 | 1 | 1 | z0p4 | z1p3 | z2p2 |
| Aa | 1 | 1/2 | 3/4 | z02p3q | z1p2q | 0 |
| aa | 1/2 | 1/2 | 1/2 | z0p2q2 | 0 | 0 |
| Aa: | ||||||
| AA | 1 | 1/2 | 3/4 | z02p3q | z1p2q | 0 |
| Aa | 1 | 0 | 1/2 | z04p2q2 | z1pq | z22pq |
| aa | 1/2 | 0 | 1/4 | z02pq3 | z1pq2 | 0 |
| aa: | ||||||
| AA | 1/2 | 1/2 | 1/2 | z0p2q2 | 0 | 0 |
| Aa | 1/2 | 0 | 1/4 | z02pq3 | z1pq2 | 0 |
| aa | 0 | 0 | 0 | z0q4 | z1q3 | z2q2 |
| Total | z0 | z1 | z2 | |||
Note.— We assume a marker at Hardy-Weinberg equilibrium with two alleles, A and a, with frequencies p and q=1-p. zi is the probability that an ASP shares i alleles IBD at the marker locus. φdom is the proportion of sibs carrying allele A, φrec the proportion of sibs homozygous for allele A, and φadd the proportion of allele A among all four alleles in the ASP.
Unbiased Selection Schemes
When there is evidence for both linkage and association in a region, we wish to ask if the associated marker allele, or one in LD with it, could account in part for the linkage signal. One way to address this question is to determine if a subset of families selected based on presence of the allele show stronger evidence of linkage as measured by increased allele sharing IBD. In order for linkage analysis on the subset to be valid for this purpose, families similarly selected on the basis of a nonassociated allele should on average neither increase nor decrease allele sharing IBD compared to the whole data set; we say such a selection scheme is unbiased. In other words, a selection scheme is unbiased for a chromosomal locus if for any pedigree structure of affected members, the distribution of IBD-sharing configuration at the locus conditioned on being selected is the same as the unconditional distribution. Equivalently, a selection scheme is unbiased if inclusion of a family is independent of the IBD-sharing configuration among affected family members at the locus. We define several genotype-based selection schemes that are unbiased when there is no disease-marker association.
Given no disease-marker association, a single affected individual’s genotype is independent of the IBD-sharing configuration among affected members in his/her family. Hence selection of families based on the genotype of one affected member is unbiased. For example, the selection of ASPs in which the index case carries allele A (rows 1–6 in table 1) results in a conditional distribution of IBD sharing with ratio z0:z1:z2 for sharing 0, 1, or 2 alleles IBD (see appendix A), the same as that for the unconditional distribution. Analogously, the selection of ASPs in which the index case is homozygous for allele A (rows 1–3 in table 1) also is unbiased. Similar unbiasedness arguments hold for sibships of size >2.
If multiple affected family members are genotyped, one may first randomly choose an individual from each family and then select families in which the chosen individual carries (or is homozygous for) allele A. It can be shown that under no disease-marker association, this selection scheme also is unbiased, although different random choices usually will result in different subsets and numbers of families, introducing additional variability. To take into account all available genotype information, one might select families based on the genotypes of >1 members. One example is to select families in which any affected member carries allele A; a second is to select families in which all affected members are homozygous for allele A. In Appendix B, we show such schemes often are biased, even under no disease-marker association.
Weighted Selection Schemes
We noted previously that under no disease-marker association, the selection of affected sibships on the basis of whether a randomly chosen sib carries allele A is unbiased but generally results in different subsets and numbers of families, introducing additional variability. This variation can be substantial, particularly if the associated allele is relatively infrequent (see the “Results” section). To reduce variation and make full use of all sibship genotype information available, we consider all possible subsets that result from this selection scheme. Each sibship is selected into a proportion of the subsets, with the proportion being determined on the basis of the genotypes of all affected sibs. This proportion then can be used as a weight variable for each sibship. For affected sibships, if the selection scheme is based on whether a randomly chosen sib carries allele A, the proportion of subsets containing a sibship equals the proportion of sibs in the sibship carrying allele A; for ASPs, the resulting weight variable is listed as column φdom in table 1.
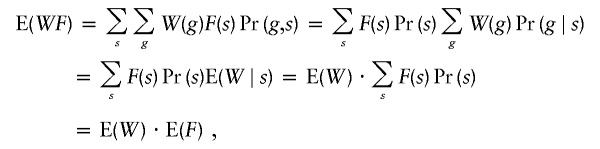
This is an example of a weighted selection scheme for affected sibships in which φdom is the weight variable. For a class of pedigree structures, we say that a weighted selection scheme with weight variable W is unbiased for a chromosomal locus if the conditional expectation of W given an IBD-sharing configuration s, E(W|s), is a constant for all s ∈ S at the locus, and the constant is the same across all pedigree structures in the class. This constant is E(W|s)=E[E(W|s)]=E(W), the expectation of W. The unbiasedness of φdom for affected sibships, under the assumption of no disease-marker association, is shown in appendix A. If the weight variable W only takes values 0 and 1, so that a family is either in a subset or not, a weighted selection scheme reduces to a yes/no (unweighted) selection scheme. In this situation, the unbiasedness of a weighted selection scheme is equivalent to independence between W and IBD-sharing configuration (see appendix C), and therefore the definitions of unbiasedness in this and the last subsections are consistent.
If a weighted selection scheme based on W is unbiased for a locus, W is uncorrelated with any scoring function F defined on IBD-sharing configurations at the locus; however, W may not be independent of F (see appendix C). In particular, the correlation coefficient ρW,Z between W and the family NPL score Z is zero, while W and Z are not independent (see appendix C).
For affected sibships, we can define other weighted selection schemes. For selecting affected sibships in which the index case is homozygous for allele A, the corresponding weight variable φrec is the proportion of genotyped affected sibs homozygous for allele A. A third weight variable φadd is the proportion of allele A among the alleles carried by the affected sibs. Note that φadd=(φdom+φrec)/2 does not have a corresponding (unweighted) selection scheme. As indicated by the subscript, the weight variables φdom, φrec, and φadd should be well suited for disease variants that act in a dominant, recessive, or additive manner, respectively (see the “Results” section). These weights for ASPs are listed in table 1. It can be shown easily that given no disease-marker association, φrec and φadd also result in unbiased weighted selection schemes.
We have focused so far on markers for which genotypes for more than one affected family member are available. When fine mapping genes, one may choose to genotype only one individual per family. In this situation, the weight variables can be defined on the basis of the single available genotype; φdom and φrec only take values 0 and 1, thus reducing to (unweighted) selection schemes, whereas φadd can take values 0, .5, and 1, still resulting in a weighted selection scheme. Given no disease-marker association—since the genotype of a single individual is independent of the IBD-sharing configuration among affected members in his/her family—a weight variable W defined on the basis of the genotype of one individual is not only uncorrelated with the family NPL score Z but also independent of Z.
Testing for Genotype-IBD Sharing Association
For affected sibship data, we provide test procedures to determine if the linkage signal in a region can be attributed in part to the presence of a marker allele. We first consider the situation in which we have complete IBD information and then extend to the situation with incomplete IBD information.
Given a weight variable W, 1−W also can be viewed as a weight variable. Hence, for a weighted selection scheme with weight variable W, there are two weighted subsets: family i contributes to the first subset with proportion Wi and to the second, complementary subset with proportion 1-Wi. For the two subsets, the total contributed weights are  and
and  , where
  and the average per-family NPL contributions are
  and
and  , respectively. We wish to assess whether a1 and a2 differ. Note that
  . Since var(Zi)=1, if Wi were constants, var(a1-a2) would be
  , and
, and  would be
 |
where  and
and
 |
is the sample correlation coefficient between family weight variable W and NPL score Z. This motivates us to use rW,Z as the basis for our test statistic.
For affected sibships, we may choose W to be any one of the weight variables φdom, φrec, and φadd, defined on the basis of an allele A. Let ρW,Z be the correlation coefficient between W and Z. We showed that, given no disease-marker association, ρW,Z=0. If allele A is a disease-predisposing variant or is associated with one, we expect that ρW,Z>0. In fact, for ASPs and affected sib trios, this is true for nearly all disease models that are relevant to complex diseases (see the “Results” section). Hence, we test the null hypothesis H0i:ρφi,Z=0 (i=dom, rec, add) against the alternative H1i:ρφi,Z>0 to determine if the linkage signal in the region can be attributed in part to the presence of allele A.
Fisher (1921) demonstrated that if (W, Z) is distributed as bivariate normal, when the number of families n is large,  is approximately distributed as standard normal, where tanh-1(x)=0.5ln[(1+x)/(1-x)]. For a general bivariate distribution of (W, Z) with finite moments, if W and Z are independent, this result still holds; if they are not independent, large-sample theory dictates that rW,Z is asymptotically normal, and so is tanh-1(rW,Z) (Ferguson 1996).
For each of our weighting schemes i (i=dom, rec, add), let  and let
  . Since μi is an increasing function of ρW,Z, the hypotheses now are H0i:μi=0 against H1i:μi>0. At significance level α, we reject H0i and accept H1i if Xi⩾z1-α, where z1-α is the 100(1-α) percentile of the standard normal distribution.
The power of these tests can be estimated easily. At significance level α, for each weight variable φi and a disease model with correlation coefficient ρφi,Z, the power of the corresponding test is approximately 1-Φ(z1-α-μi), where Φ is the cumulative distribution function of the standard normal distribution. The resulting power estimates agree well with the corresponding simulation-based estimates (see the “Results” subsection).
For complex diseases, we usually do not know the underlying disease model. Carrying out all three tests requires adjustment for multiple comparisons, with a likely reduction in power. As an alternative, let Xmax=max(Xdom,Xrec,Xadd), and the P value for an observed maximum t is Pr(Xmax⩾t) under no disease-marker association.
We now estimate the distribution of Xmax under no disease-marker association. Let ρij=corr(Xi,Xj) be the correlation coefficient of Xi and Xj (i, j=dom, rec, add). These correlations depend on several factors: the frequency p of allele A, the distribution of IBD-sharing configurations at the locus, the sample size n, and the composition of pedigree structures in the sample. Simulations suggest that for complex diseases, when n⩾100, the three correlation coefficients vary little with respect to changes in these factors except the allele frequency p (data not shown). Hence, for various values of p, we estimate ρij by simulating a large number of ASPs under no linkage. Assuming the vector (Xdom, Xrec, Xadd) is approximately distributed as trivariate normal, we generate a large number of random vectors from this distribution and derive an empirical estimate of the distribution of Xmax.
We have outlined our tests assuming complete IBD information. Given incomplete IBD information, we calculate the sample correlation coefficient  between W and the expected NPL score
  conditioned on family genotype data, and carry out the above tests using
  . Because of the additional variation due to incomplete IBD information, the correlation between W and
  tends to be weaker than that between W and Z, the magnitude of E(Xi) tends to be smaller, and the power of the tests may be reduced. However, for a flanking marker density of ⩽2 cM, the reduction in power is not substantial (see the “Results” section).
Weighted-Subset NPL and LOD Scores
Given a weighted selection scheme, we define the NPL (Kruglyak et al. 1996) and LOD scores (Kong and Cox 1997) for the corresponding associated families. Again, we first consider the situation in which we have complete IBD information, and then we extend the methods to handle incomplete IBD information and to incorporate further weighting based on family size.
At a locus and for family i, let Zi be the NPL score, which has been standardized to have mean zero and variance one under no linkage (Kruglyak et al. 1996). The NPL score for the complete sample is  , where the sum ranges over all n families. For a weighted selection scheme with weight variable W={Wi}ni=1, we define WiZi as the weighted NPL contribution from family i. If the scheme is unbiased for the locus, Wi and Zi are uncorrelated, and the mean of WiZi under no linkage is E(WiZi)=E(Wi)E(Zi)=0. We might define a weighted-subset NPL score for the sample to be
  divided by its standard deviation
  under no linkage. However, the formula for var(WiZi) varies for different pedigree structures and can be very complicated; it also depends on the unknown frequency p of allele A. Instead, we choose to estimate var(WiZi) empirically. Since var(Zi)=1, if Wi were a constant, var(WiZi) would be W2i. This motivates us to define a weighted-subset NPL score at the locus as
  . Note that if W only takes values 0 and 1, so that a family is either in a subset or not, NPLW is the same as the NPL score calculated on the basis of the subset.
For affected sibship data, we noted previously that the selection of sibships based on whether a randomly chosen sib carries allele A usually results in different subsets, depending on the choices made. By considering all possible subsets resulting from this scheme, we defined the weight variable φdom for each sibship. We may expect that the NPL scores for all the subsets can be summarized by the weighted-subset NPL score NPLφdom defined above. Indeed, simulations show that for ASPs and affected sib trios, NPLφdom is approximately the average of NPL scores over all the subsets (see the “Results” section). Similar conclusion also holds for the weight variable φrec.
As an alternative to the NPL score, Kong and Cox (1997) introduced a one-parameter allele-sharing model (ASM) with parameter δ⩾0, in which δ=0 for no linkage and δ>0 for linkage. Under their model, the log-likelihood for all families is  (Kong and Cox 1997). For a weighted selection scheme with weight variable W={Wi}ni=1, we substitute WiZi for Zi and call the resulting LOD score a weighted-subset LOD score.
In the more general situation of incomplete IBD information, we can replace Zi with the expected NPL score  . In standard linkage analysis, to leverage strength of signals from families of different sizes, a weighting factor γi may be assigned to each family i (Kruglyak et al. 1996). When calculating weighted-subset NPL and LOD scores, we can incorporate this information by using weighted family contribution
  in place of Zi. Note that, because of the way we define weighted contribution for a family, the effects of Wi and γi are multiplicative, and they act as if there is a single weight variable, Wiγi. Calculation of the weighted-subset NPL and LOD scores can easily be implemented in existing software such as GENEHUNTER (Kruglyak et al. 1996) and Allegro (Gudbjartsson et al. 2000).
We caution that the LOD scores defined in this subsection are not comparable across different loci because their magnitude depends on the effective sample size in the weighted subset, which is determined by the allele frequency. As a result, such a LOD score cannot be interpreted in the same way as scores defined over the whole sample.
Results
Variation of NPL Scores for Subsets of ASPs Selected on the Basis of the Genotype of a Random Sib
To ask whether an associated allele can account in part for a linkage signal, the simplest strategy is to perform linkage analysis on the subsets of families selected on the basis of the genotype of a single affected family member. We use the term “subset NPL score” for the NPL score that is calculated over a subset of families. We noted previously that selection of affected sibships in which a randomly chosen sib carries allele A generally results in different subsets of families and therefore different subset NPL scores in the region of the marker (see the “Methods” section). We evaluated the extent of this variation using simulation. We simulated a biallelic marker independent of disease status, either unlinked (θ=.5) or completely linked (θ=0) to disease, and further assumed that we had complete IBD information at the marker. We considered two frequencies p for marker allele A (p=.1, .5), in combination with two scenarios of IBD sharing at the marker: no linkage with (z0,z1,z2)=(.25,.50,.25) (λS=1) and linkage with (z0,z1,z2)=(.23,.50,.27) (λS=1.1). For each combination, we simulated 100 replicate data sets of 500 ASPs. For each data set, we generated 200 random subsets of families selected on the basis of whether a randomly chosen sib carries allele A and calculated the mean E(subset NPL) and standard deviation sd(subset NPL) of the corresponding 200 subset NPL scores. Figure 1 plots sd(subset NPL) versus E(subset NPL) for a total of 100 replicate data sets.
Figure 1.

Plots of sd(subset NPL) vs. E(subset NPL) for 100 replicate data sets of 500 ASPs. For each data set, the horizontal coordinate is the mean of NPL scores for 200 random subsets selected on the basis of whether a randomly chosen sib carries allele A, and the vertical coordinate is the standard deviation of the 200 subset NPL scores. The marker is not associated with disease variant. p is the frequency of allele A. λS is the sib relative risk.
Figure 1 suggests that the magnitude of variation in subset NPL scores does not depend strongly on whether the whole data set yields evidence for linkage. With the same allele frequency, the variation of subset NPL score is slightly smaller for a linked marker than for an unlinked marker, presumably because IBD sharing at a linked locus is less variable than that at an unlinked locus.
From figure 1, we also see that particularly if allele A is relatively rare, but even if it is not, the variation of NPL score for a random subset of families can be substantial. For example, when p=.1, sd(subset NPL) for most replicate data sets is ∼0.45. Thus, if a data set of 500 ASPs has average subset NPL score 2.5, the NPL scores for different subsets easily can vary from 1.6 to 3.4 (2.5±2×0.45), with the corresponding LOD scores, calculated as LOD=NPL2/(2ln10), varying from 0.56 to 2.51. Even with p=.5, sd(subset NPL) for most replicate data sets is ∼0.25, and the NPL scores for different subsets can often vary from 2.0 to 3.0, with the corresponding LOD scores varying from 0.87 to 1.95. If we had selected families on the basis of whether a randomly chosen sib is homozygous for allele A, the variation is even greater (data not shown). These results suggest that when genotype data on ⩾1 sibs are available, we should not do subset linkage analysis solely on the basis of the genotype of a single sib.
Since the weight variable φdom for a sibship represents the proportion of random subsets of the sample containing this sibship, we would expect that the weighted-subset NPL score NPLφdom defined in this paper would summarize well the NPL scores for all possible subsets. For the replicate data sets previously generated, we calculated the corresponding NPLφdom and found that it is quite comparable with E(subset NPL) (data not shown). A similar conclusion holds for affected sib trios and for the weight variable φrec (data not shown).
Correlation between φdom, φrec, φadd and Z under Disease Models
We showed that for affected sibships, if W is one of the three weight variables φi (i=dom, rec, add) defined on the basis of allele A, and given no disease-marker association, the correlation coefficient ρW,Z=0. If allele A is a disease-predisposing variant or is associated with one, we would expect that ρW,Z>0, and we have used this assumption as the basis for using a one-sided test.
To verify this assumption, we considered the general one-locus, two-allele disease model (pD,f0,f1,f2), where pD is the frequency of disease-predisposing allele D in the population, and fi (i=0, 1, 2) is the penetrance for the genotype with i copies of allele D. We assumed that 0<f0⩽f1⩽f2 and that the values of fi are not all equal. Let γi=fi/f0 (i=1, 2) be the genotypic risk ratio (GRR) of the genotype with i copies of allele D versus that with 0 copies. Then, 1⩽γ1⩽γ2, and 1<γ2. For ASPs and affected sib trios, we calculated ρW,Z, where W is one of the three weight variables φdom, φrec, φadd defined on the basis of allele D. We considered a total of 1,701 disease models specified by (a) disease allele frequencies pD=.1, .2,…, .9, and (b) GRRs 1⩽γ1⩽γ2⩽10 and 1<γ2, in increments of 0.5. For ASPs, the correlation coefficients were >0 except for seven (0.4%) dominant models. For affected sib trios, ρφdom,Z>0 for all the models considered, ρφrec,Z>0 except for 121 (7.1%) dominant models, and ρφadd,Z>0 except for 4 (0.2%) models. Not only were nearly all correlation coefficients positive, but the magnitude of the negative ones all were very small. If we restricted attention to models with GRR γ1⩽4, a likely situation for complex diseases, all correlation coefficients were >0, ranging from 0.002 to 0.44.
Type I Error Rates of the Tests
We carried out simulations to assess the properties of our tests. Under no disease-marker association, we simulated 100,000 replicate data sets of 200 ASPs for allele frequencies p=.1, .2,…, .9. We used an additive model (with pD=.5 and λS=1.1) to generate the background distribution of IBD sharing at the locus; simulations showed that small changes in the background distribution of IBD sharing have little effect on the results (details not shown). Let Ti (i=dom, rec, add, max) denote the test based on Xi. Table 2 lists the estimated type I error rates at nominal significance level α=.01 using genotypes of one or both sibs and given complete IBD information.
Table 2.
Estimated Type I Error Rates for the Four Tests, at Nominal Significance Level α=1%, Using Genotypes of One or Both Sibs[Note]
|
Estimated Type I Error Rate (%) for |
||||||||
| One Sib |
Both Sibs |
|||||||
| p | Tdom | Trec | Tadd | Tmax | Tdom | Trec | Tadd | Tmax |
| .1 | 1.0 | .3 | 1.0 | .6 | .8 | .2 | .8 | .5 |
| .2 | 1.0 | .8 | 1.0 | .9 | 1.0 | .7 | .9 | .8 |
| .3 | 1.0 | .9 | 1.0 | 1.0 | 1.1 | .9 | .9 | 1.0 |
| .4 | 1.0 | 1.0 | 1.0 | 1.0 | 1.2 | .9 | .9 | 1.1 |
| .5 | 1.0 | 1.0 | .9 | 1.0 | 1.3 | 1.0 | 1.0 | 1.2 |
| .6 | 1.0 | 1.0 | 1.0 | 1.1 | 1.5 | 1.0 | 1.0 | 1.3 |
| .7 | 1.0 | 1.0 | 1.0 | 1.1 | 1.7 | 1.1 | 1.0 | 1.5 |
| .8 | 1.0 | 1.0 | 1.0 | 1.0 | 2.2 | 1.1 | 1.0 | 1.8 |
| .9 | .4 | 1.1 | 1.0 | .7 | 1.3 | 1.1 | 1.2 | 1.2 |
Note.— Based on 100,000 replicates of 200 ASPs. p is the frequency of marker allele A. Ti is the test based on Xi (i=dom, rec, add, max).
When the tests are based on genotypes of both sibs, the type I error rates increase as p increases. All the tests are conservative when p=.1, and Tdom and hence Tmax are somewhat anticonservative when p>.5, whereas Trec and Tadd are consistent with nominal values for p>.1. At significance level α=.05, the patterns are similar and the type I error rates range from 4.2% to 8.8% (data not shown).
We noted previously that under no disease-marker association, a weight variable W defined on the genotype of a single individual is independent of family NPL score Z, and the statistics are asymptotically distributed as standard normal. Hence, we expect that for tests based on genotypes of one sib, the type I error rates converge to corresponding nominal significance levels when the number of families is large. Results in table 2 support this conclusion.
For the more realistic situation of incomplete IBD information, we generated flanking markers with four equally frequent alleles (heterozygosity .75) and various intermarker distance d. When d⩽2 cM, the estimated type I error rates were very similar to those given complete IBD information (data not shown).
Power of the Tests
We next carried out simulations of ASPs to compare the power to detect genotype-IBD sharing association among the four tests Tdom, Trec, Tadd, Tmax, and between tests in which the weight variables are based on the genotypes of one or both sibs. We considered two population disease allele frequencies (pD=.2, .5) and three disease models: dominant, recessive, and additive. All models had disease prevalence 10% and single-locus relative risk λS=1.1 for sibs of an affected individual (table 3). For each disease model, we generated 10,000 replicate data sets of 500 ASPs. Table 3 lists the estimated power for the tests at significance level α=.01.
Table 3.
Disease Models and Estimated Power (%) for the Four Tests, at Significance Level α=1%, Using Weight Variables Defined on the Basis of Genotypes of One or Both Sibs[Note]
|
Estimated Power(%) |
|||||||
| Complete IBDInformation |
Incomplete IBDInformation, Tmax |
||||||
| pD, f0/f1/f2, andNo. of Sibs | Tdom | Trec | Tadd | Tmax | d=2 | d=5 | d=10 |
| .2: | |||||||
| .065/.162/.162: | |||||||
| 1 | 85 | 3 | 72 | 79 | 71 | 62 | 49 |
| 2 | 95 | 4 | 86 | 92 | 86 | 78 | 65 |
| .089/.089/.368: | |||||||
| 1 | 72 | 100 | 98 | 100 | 99 | 98 | 95 |
| 2 | 83 | 100 | 100 | 100 | 100 | 100 | 98 |
| .068/.148/.228: | |||||||
| 1 | 80 | 32 | 83 | 81 | 74 | 64 | 51 |
| 2 | 92 | 45 | 93 | 91 | 86 | 78 | 66 |
| .5: | |||||||
| .015/.128/.128: | |||||||
| 1 | 27 | 1 | 4 | 19 | 15 | 11 | 9 |
| 2 | 55 | 1 | 5 | 45 | 40 | 32 | 24 |
| .072/.072/.185: | |||||||
| 1 | 28 | 92 | 86 | 88 | 84 | 76 | 63 |
| 2 | 40 | 98 | 94 | 96 | 93 | 89 | 78 |
| .036/.100/.164: | |||||||
| 1 | 44 | 51 | 68 | 64 | 55 | 46 | 36 |
| 2 | 66 | 68 | 83 | 83 | 76 | 67 | 54 |
Note.— Results are based on 10,000 replicates of 500 ASPs. pD is the frequency of disease allele D in the population. fi(i=0, 1, 2) is the penetrance for the genotype with i copies of allele D. Given incomplete IBD information, d (in cM) is the flanking marker density. All models have disease prevalence 10% and single-locus sib relative risk λS=1.1.
We noted previously that the definitions of weight variables φdom, φrec, and φadd reflect dominant, recessive, and additive effects of an allele, respectively. As expected, among the first three tests, Tdom is the most powerful to detect genotype-IBD sharing association for dominant models, as are Trec for recessive models and Tadd for additive models, although the degree of advantage varies by model and allele frequency. For all the models we simulated, the power of Tmax is nearly as good as the highest power that can be obtained using Tdom, Trec, or Tadd.
With the same prevalence and single-locus relative risk λS, it was relatively easier to detect a disease gene with the smaller disease allele frequency pD=.2 than that with pD=.5. When we have genotypes for only one sib per ASP, we experienced some loss of power compared to using both sibs. However, for most of the models we considered, the power is still sufficient to make our tests useful tool for screening markers in a candidate region by genotyping one sib per sibship. Models with the same values of λS and pD but different disease prevalences yielded similar estimates of power (results not shown).
To assess the more realistic situation of incomplete IBD information, we generated flanking markers with four equally frequent alleles (heterozygosity .75) and at marker densities d=2, 5, and 10 cM (table 3). To simulate the scenario with the least information content, we placed the disease locus midway between the two nearest flanking markers and did not include the genotype at the disease locus in the estimation of IBD sharing. Because of the additional variability due to incomplete IBD information, the power to detect genotype-IBD sharing association is reduced, but the reduction is not substantial when the marker density is ⩽2 cM. Even when the marker density is 10 cM, which is often the situation for initial genome scans, the power to detect genotype-IBD sharing at a candidate gene is still good for some disease models.
Testing Without Prior Evidence of Linkage
Although we described our method in the context of fine mapping genes in regions with evidence of linkage, the method also may be used for regions where we do not have linkage signals. Complex diseases are likely heterogeneous. If only a small proportion of families carry a predisposing variant at a locus, a linkage signal may be small and masked by random fluctuation. Furthermore, even if a disease-predisposing variant is common, because of sampling variation, traditional linkage approaches may by chance not detect evidence of linkage in the region of the variant. This is especially true for genes with modest effect. For example, if the disease model is additive with λS=1.1, even with 500 ASPs, the median NPL score for the whole data set is 1.44, corresponding to a LOD score of 0.45. When no linkage is detected because of sampling variation, we want to know if our tests still have type I error rate under control and good power to detect genotype-IBD sharing association.
Simulation results comparing samples with LOD ⩽0 and those with LOD >0 showed no systematic difference in type I error rate and power of our tests between the two samples (data not shown). In other words, the overall linkage signal for the total sample has little effect on sample correlation between a family weight variable and IBD sharing at the locus. In fact, it can be shown that under the null hypothesis of no association, these two statistics are asymptotically independent. Hence, in regions for which the data fail to show evidence for underlying linkage, our method can still be used to detect the association between a tentative disease variant and excess allele sharing IBD at the locus. Such an association will suggest underlying linkage. This property makes our method a new tool for detecting linkage as well as association.
Discussion
Mapping genetic variants for complex diseases is a challenging endeavor. One common strategy is to map the disease of interest first by linkage analysis, followed by disease-marker association analysis to fine map genes in regions with evidence of linkage. In this setting, genotypes will be available for most family members for the genetic markers used in the linkage analysis, and will be available for some or all family members for markers used for LD mapping. Given an observed disease-marker association, we often ask if the tentative disease-risk allele can account for a significant portion of the linkage signal, by either direct involvement in disease etiology or LD between the marker and a predisposing variant. We addressed this question by first building a framework for unbiased family selection and extending it to allow weighted selection and then deriving a test for association of a genotype-based family weight variable with excess allele sharing IBD.
For affected sibship data, we described three genotype-based weight variables, corresponding to dominant, recessive, and additive models for a marker allele. If the allele is not associated with disease, each weight variable W is uncorrelated with the family NPL score Z. We showed that, if the allele is itself a disease-predisposing variant or is associated with one, W is almost always positively correlated with Z for a very broad class of genetic models relevant to complex diseases. Hence, a positive association between W and Z will indicate that the linkage signal in the region of the marker can be attributed in part to the presence of the marker allele.
Under the null hypothesis of no disease-marker association, although the weight variable and family NPL score are uncorrelated, they are not independent. This makes existing nonparametric tests for correlation, for example, Kendall’s τ, Spearman’s rank test, and the permutation test (Hollander and Wolfe 1999), invalid because they require independence as part of the null hypothesis, and ignoring non-independence may result in inflation in the type I error rate (Keller-McNulty and McNulty 1987). Based on large sample theory for the sample correlation coefficient, we introduced three tests for genotype-IBD sharing association, each test being powerful for dominant, recessive, and additive models, respectively. To avoid multiple comparisons, we introduced a fourth test that is based on the maximum of all three correlation coefficients and has good overall power. With sample sizes typical for complex disease gene mapping studies, even for disease models with sib relative risk as low as λS=1.1, the tests are powerful to detect genotype-IBD sharing association. When the tests are based on genotypes of >1 sib, the type I error rates for Tmax and Tdom are slightly higher than the nominal rate, presumably due to less accurate large-sample approximation for these two tests than for Trec and Tadd. When the tests are based on only one sib, the approximation works well for all four tests, and the type I error rates are similar to the corresponding nominal rate.
Our method also can be used for candidate genes in regions for which IBD-sharing information is available from an initial genome scan. In the situations we considered, the overall linkage signal had little effect on the power of our test. As a result, in regions with underlying linkage but for which the data do not yield evidence of linkage due to sampling variation, the test is as powerful as in the situation of having observed linkage. Such an association between genotype and IBD-sharing will suggest underlying linkage. Thus, our method can complement existing linkage analysis methods by detecting linkage, especially when the effect of a disease variant is modest. This property makes our method a new tool for detecting linkage as well as association. The marker density in the initial scan determines the IBD-sharing information content in the region, which has a direct effect on the power of our test. However, as is shown in the simulations, the power of GIST at a candidate gene is still good for some disease models, even when the marker density is 10 cM.
Horikawa et al. (2000) proposed a different approach to address a similar question. For a marker of interest, they started with a target genotype and focused on the subset of ASPs in which the two affected sibs both had the target genotype. As we have shown here, this may result in bias in linkage signals even under the null, and, thus, correction may be needed. Horikawa et al. (2000) proposed a simulation-based bias correction by generating an empirical distribution of subset LOD scores under the null hypothesis and comparing it with the subset LOD score from the real data. In our approach, we try instead to stay unbiased under the null hypothesis and derive an appropriate weight variable. We then use this weight variable in our test for association. Given an allele that is associated with disease, their approach focuses on a genotype formed by the allele, while our approach focuses on the allele itself. We plan a more detailed comparison of these methods in a separate paper.
Both our method and the transmission/disequilibrium test (TDT) (Spielman et al. 1993) are joint tests for linkage and association. However, they work in quite different situations. For a marker of interest, TDT requires genotypes for parents or unaffected sibs, in addition to affected offspring; our method requires genotypes only for affected family member(s), while taking advantage of existing IBD-sharing information estimated from genome scans.
Our method also can be used to screen typed markers in a large region or on the whole genome for genotype-IBD sharing association as long as the IBD-sharing information is available from an initial linkage scan. The test should be carried out for each marker allele. In this situation, one needs to adjust for multiple comparisons, a challenging problem that also confronts genomewide case-control association analysis. To scan the maximum number of markers in a fine mapping project, we may choose to type only one sib per family. The power of GIST is lower with one genotyped sib than with two, but the power may still be sufficient to make our test a useful tool for screening markers in a candidate region. When information on IBD sharing is already available from genome scans, only the cases need to be genotyped to test for genotype-IBD sharing association by means of GIST. In contrast, to test for disease-marker association using the traditional case-control design, an additional set of controls need to be genotyped, significantly increasing the genotyping cost. Thus, our method will potentially reduce genotyping effort compared to the case-control approach. We are currently working on comparing per-genotype efficiency between these two approaches and on combining results from these two approaches.
A limitation of our method, as for some other association analysis methods, is that it does not distinguish a disease predisposing variant from an allele that is in LD with it. As a result, if an allele is found to be significantly associated with excess allele sharing IBD at the marker, the allele still may not have a direct effect on disease pathogenesis.
Other researchers previously have used the idea of doing linkage analysis on families stratified on the basis of an associated allele, either to determine whether the allele can account for a portion of the linkage signal (Horikawa et al. 2000) or to determine whether there are additional linked disease-predisposing variants (Hugot et al. 2001). Hugot et al. (2001) reported that linkage of Crohn disease to chromosome 16 could not be entirely explained by the detected associated alleles, because the subset of families without those associated alleles had a LOD score of 1.6. In this subset, analogous to what we demonstrated in appendix B, the uniformly high degree of allele sharing identical by state at the locus would result in an upward bias for linkage. Hence, the LOD score of 1.6 may be inflated compared to the true effect of other unknown disease variants in the region.
The idea in Hugot et al. (2001) of calculating “residual” linkage signals and using them as a signpost for additional disease variants is very tempting. Unfortunately, even if one did a weighted-subset linkage analysis for families without the associated alleles, the resulting LOD score would not be sufficient to indicate if there are additional disease-predisposing variants in the region. Our simulation results showed that, even if there is no extra disease-predisposing gene or variant in the region, the weighted-subset NPL score representing the “residual” linkage signal is no longer approximately distributed as normal and behaves differently for different disease models (data not shown). Sun et al. (2002) proposed a method to test for the presence of additional causal loci in the region, given that the current marker is causative for the disease. An extension of their method to multiple causative variants may help answer this question.
The difficulty in mapping genes for complex diseases calls for new techniques in data analysis. In this paper, we provided a general framework for unbiased selection of families stratified based on a marker allele, and for affected sibship data, we introduced test procedures to determine if the linkage signal in a chromosomal region can be attributed in part to the presence of a marker allele. We believe that these procedures will prove to be a valuable addition to the geneticist's toolbox for mapping genes for complex diseases. The methods developed in this paper have been implemented in our software GIST, available at the Web site of the Vanderbilt Program in Human Genetics.
Acknowledgments
We gratefully acknowledge support from a startup fund and a Pilot and Feasibility grant from the Vanderbilt Diabetes Center (to C.L.), as well as National Institutes of Health grants HG00376 and DK62370 and contract N01-HG-15465 (to M.B.). We also thank two anonymous reviewers for their valuable comments.
Appendix A
In the “Methods” section, we introduced two selection schemes for affected sibships: (A1) selecting sibships in which the index case carries allele A, and (A2) selecting sibships in which the index case is homozygous for allele A. For ASPs, we show that under the assumption of no disease-marker association, (A1) is unbiased. The unbiasedness of (A2) can be similarly shown.
For ASPs and for a biallelic marker with alleles A and a, table 1 lists the joint distribution of ordered genotype and IBD sharing at the marker locus under the assumption of no disease-marker association. Under that assumption, the probability that the index case carries allele A (rows 1–6 in table 1) is 1-Pr(aa)=1-q2=p(1+q), and
 |
Thus, the conditional distribution of IBD sharing, given that the index case carries allele A, has a ratio z0:z1:z2 for sharing 0, 1, 2 alleles IBD, and hence the selection scheme (A1) is unbiased.
In the “Methods” section, we also introduced three weighted selection schemes for affected sibships, with weight variables φdom, φrec, and φadd, respectively. It can be shown that, given no disease-marker association, all three weight variables result in unbiased weighted selection schemes. For example, for ASPs and scheme φdom, by table 1,
 |
The conditional expectations all equal E(φdom)=Pr(asibcarriesallele A)=p(1+q). Similarly, it can be easily shown that E(φrec∣IBD)=E(φrec)=Pr(asibishomozygousforallele A)=p2 and E(φadd∣IBD)=E(φadd)=E[(φdom+φrec)/2]=p. These equations also hold for affected sibships of size >2.
Appendix B
When multiple affected family members are genotyped, with a desire to take into account all genotype information, one might select families in which any affected member carries allele A. We show that this is biased against linkage at and around the marker locus.
Consider the complement subset of families—that is, the families in which all affected members have genotype aa. These families have a uniformly high degree of allele sharing identical by state at the marker. Therefore, linkage analysis on this complement subset is biased for linkage in the region, and, consequently, linkage analysis on the original subset is biased against linkage. Breaking up allele a into several different alleles yields the same conclusion.
It is easy to quantify this bias for ASPs. Given no disease-marker association, the selection of ASPs in which any sib carries allele A (rows 1–8 in table 1) results in a conditional distribution of IBD sharing at the marker with ratio z0(1-q4):z1(1-q3):z2(1-q2), which is different from z0:z1:z2 for 0<q<1. Since (1-q4)/(1-q3)>1 and (1-q3)/(1-q2)>1, the conditional distribution of IBD sharing is stochastically smaller than the unconditional distribution. Therefore, this selection scheme results in a downward bias in IBD sharing at the marker locus and consequently in the region of the marker, and hence reduces evidence for linkage. For example, suppose we have n=500 ASPs, the disease model is additive with λS=1.1, and the frequency of allele A at a completely linked marker (recombination fraction θ=0) is p=.5. Given complete IBD information and no disease-marker association, on average, the NPL score for the complete sample is 1.44, corresponding to a LOD score of 0.45. For the subset of ASPs in which one or more sibs carries allele A (86% of families), on average, there will be fewer ASPs sharing two alleles IBD than those sharing zero alleles IBD, with corresponding LOD scores of <0.
Another possible selection scheme might be to select families in which all affected members are homozygous for allele A (Horikawa et al. 2000). A similar argument shows that this scheme results in an upward bias in IBD sharing in the region of the marker and hence amplifies evidence for linkage. In the above example, even with no disease-marker association, for the subset of ASPs in which both sibs are homozygous for allele A (14% of families), on average, the NPL score for the subset is 4.48, corresponding to a LOD score of 4.37. Horikawa et al. (2000) proposed to correct this bias by simulations under the assumption of no association.
It can be shown analogously that selecting families in which all affected members carry allele A is biased for linkage and that selecting families in which any affected member is homozygous for allele A is biased against linkage.
Appendix C
In the “Methods” section, we defined unbiased weighted selection schemes. For a class of pedigree structures, a weighted selection scheme based on weight variable W is unbiased for a chromosomal locus if E(W∣s)=E(W) for all IBD-sharing configurations s∈S at the locus, and the constant is the same across all pedigree structures in the class. Here, we prove some properties for such a scheme.
If W only takes values 0 and 1, then for any s∈S, Pr(W=1,s)=Pr(W=1∣s)·Pr(s)=E(W∣s)·Pr(s)=E(W)·Pr(s)=Pr(W=1)·Pr(s), and, similarly, Pr(W=0,s)=Pr(W=0)·Pr(s). In this situation, the unbiasedness of a weighted selection scheme implies independence between the weight variable W and IBD-sharing configuration; it can easily be shown that the reverse also is true. Thus, the two definitions of unbiasedness are consistent.
Let F be a scoring function defined on IBD-sharing configurations. If a weighted selection scheme with weight variable W is unbiased for a locus, then, for a single pedigree structure,
 |
and W is uncorrelated with F at the locus. This property also holds when we have a mixture of pedigree structures. For example, suppose we have two types of pedigrees, and a family has pedigree type 1 with probability β and pedigree type 2 with probability 1−β. Let Wi and Fi denote the weight variable and score, respectively, for a family with pedigree type i. By the definition of unbiasedness, E(W1)=E(W2)=E(W). Then,
 |
Given complete IBD information, the family NPL score Z (Kruglyak et al. 1996) itself can be viewed as a scoring function, and so W is uncorrelated with Z. However, even with complete IBD information, W may not be independent of a scoring function F at the locus. For example, for ASPs, IBD sharing can be viewed as a function of the scoring function Spairs. The nonindependence between the weight variables in table 1 and IBD sharing is easily shown by the fact that when an ASP shares two alleles IBD, φdom, and φrec can take only values 0 and 1, and φadd can take only values 0, 0.5, and 1.
Electronic-Database Information
Accession numbers and URLs for data presented herein are as follows:
- Vanderbilt University Center for Human Genetics Research, http://phg.mc.vanderbilt.edu/GIST.shtml or http://chgr.mc.vanderbilt.edu (for GIST software)
References
- Ferguson TS (1996) A course in large sample theory. Chapman and Hall, London [Google Scholar]
- Fisher RA (1921) On the “probable error” of a coefficient of correlation deduced from a small sample. Metron 1:3–32 [Google Scholar]
- Gudbjartsson DF, Jonasson K, Frigge ML, Kong A (2000) Allegro, a new computer program for multipoint linkage analysis. Nat Genet 25:12–13 10.1038/75514 [DOI] [PubMed] [Google Scholar]
- Hollander M, Wolfe DA (1999) Nonparametric statistical methods, 2nd ed. John Wiley, New York [Google Scholar]
- Horikawa Y, Oda N, Cox NJ, Li X, Orho-Melander M, Hara M, Hinokio Y, et al (2000) Genetic variation in the gene encoding calpain-10 is associated with type 2 diabetes mellitus. Nat Genet 26:163–175 10.1038/79876 [DOI] [PubMed] [Google Scholar]
- Hugot J-P, Chamaillard M, Zouali H, Lesage S, Cézard J-P, Belaiche J, Almer S, Tysk C, O’Morain CA, Gassull M, Binder V, Finkel Y, Cortot A, Modigliani R, Laurent-Puig P, Gower-Rousseau C, Macry J, Colombel J-F, Sahbatou M, Thomas G (2001) Association of NOD2 leucine-rich repeat variants with susceptibility to Crohn’s disease. Nature 411:599–603 10.1038/35079107 [DOI] [PubMed] [Google Scholar]
- Huntington’s Disease Collaborative Research Group (1993) A novel gene containing a trinucleotide repeat that is expanded and unstable on Huntington’s disease chromosomes. Cell 72:971–983 [DOI] [PubMed] [Google Scholar]
- Keller-McNulty S, McNulty M (1987) The independent pairs assumption in hypothesis tests based on rank correlation coefficients. Am Statistician 41:40–41 [Google Scholar]
- Kong A, Cox NJ (1997) Allele-sharing models: LOD scores and accurate linkage tests. Am J Hum Genet 61:1179–1188 [DOI] [PMC free article] [PubMed] [Google Scholar]
- Kruglyak L, Daly MJ, Reeve-Daly MP, Lander ES (1996) Parametric and nonparametric linkage analysis: a unified multipoint approach. Am J Hum Genet 58:1347–1363 [PMC free article] [PubMed] [Google Scholar]
- Sengul H, Weeks DE, Feingold E (2001) A survey of affected-sibship statistics for nonparametric linkage analysis. Am J Hum Genet 69:179–190 [DOI] [PMC free article] [PubMed] [Google Scholar]
- Spielman RS, McGinnis RE, Ewens WJ (1993) Transmission test for linkage disequilibrium: the insulin gene region and insulin-dependent diabetes mellitus (IDDM). Am J Hum Genet 52:506–516 [PMC free article] [PubMed] [Google Scholar]
- Sun L, Cox NJ, McPeek MS (2002) A statistical method for identification of polymorphisms that explain a linkage result. Am J Hum Genet 70:399–411 [DOI] [PMC free article] [PubMed] [Google Scholar]
- Thompson EA (1974) Gene identities and multiple relationships. Biometrics 30:667–680 [PubMed] [Google Scholar]
- Whittemore AS, Halpern J (1994) A class of tests for linkage using affected pedigree members. Biometrics 50:118–127 [PubMed] [Google Scholar]
- Yamagata K, Furuta H, Oda O, Kaisaki PJ, Menzel S, Cox NJ, Fajans SS, Signorini S, Stoffel M, Bell GI (1996) Mutations in the hepatocyte nuclear factor 4 alpha gene in maturity-onset diabetes of the young (MODY1). Nature 384:458–460 10.1038/384458a0 [DOI] [PubMed] [Google Scholar]