Abstract
Electron transfer (ET) within proteins occurs by means of chains of redox intermediates that favor directional and efficient electron delivery to an acceptor. Individual ET steps are energetically characterized by the electronic coupling V, driving force ΔG, and reorganization energy λ. λ reflects the nuclear rearrangement of the redox partners and their environment associated with the reactions; λ ≈ 700–1,100 meV (1 eV = 1.602 × 10⁻¹⁹ J) has been considered as a typical value for intraprotein ET. In nonphotosynthetic systems, functional ET is difficult to assess directly. However, using femtosecond flash photolysis of the CO-poised membrane protein cytochrome c oxidase, the intrinsic rate constant of the low-ΔG electron injection from heme a into the heme a3-CuB active site was recently established at (1.4 ns)-1. Here, we determine the temperature dependence of both the rate constant and ΔG of this reaction and establish that this reaction is activationless. Using a quantum mechanical form of nonadiabatic ET theory and common assumptions for the coupled vibrational modes, we deduce that λ is <200 meV. It is demonstrated that the previously accepted value of 760 meV actually originates from the temperature dependence of CuB–CO bond breaking. We discuss that low-ΔG, low-λ reactions are common for efficiently channeling electrons through chains that are buried inside membrane proteins.
Keywords: reorganization energy, ultrafast spectroscopy, CuB–CO bond, electron transfer
Biochemical redox reactions often involve intraprotein delivery of electrons from an electron donor to an acceptor through a series of well defined intermediates. Each intermediate state is characterized by a hypersurface that relates the potential energy of the electronic state to the nuclear coordinates of the protein system. The transition between two states is energetically characterized by the electronic coupling V (which is related to the transition probability once nuclear motions have brought the system near the crossing of the corresponding states), the difference in the energy minima or driving force ΔG, and the reorganization energy λ (1, 2). λ reflects the energy associated with the nuclear rearrangement of the protein system that is necessary to adopt the optimal configuration of the product state. Its value, required for an adequate description of the mechanism of electron transfer (ET), can in principle be estimated by combining measurements of the ET rate constant with a variational approach (ΔG and temperature) but is often not directly accessible, especially for chains of low-driving-force reactions. In the classical picture (1), for λ = -ΔG, the crossing occurs at the minimum of the donor state potential energy, when the reaction activation energy is zero and the constant equals the “optimal” rate constant, determined only by the electronic coupling V.
Experimentally, the most straightforward systems to study ET through proteins are (type II) photosynthetic reaction center chains (3). Here, an initial photochemical charge separation process with a net low driving force [≈-100 meV (1 eV = 1.602 × 10⁻¹⁹ J)] occurs within a few picoseconds and is followed by ET from a photoreduced (bacterio)pheophytin to the quinones QA (≈100 ps) and QB (≈100 μs). These latter ET stabilization reactions take place at the cost of substantial loss of free energy (total ≈ 800 meV). The reorganization energies associated with both stabilization steps are on the order of 700–1,300 meV (4). Values of λ ≈ 800 meV are observed in high-driving-force reactions in metalloproteins surface-labeled with photoactivatable compounds (2). Thus, λ = 700–1,100 meV has been considered a typical value for intraprotein ET (5). However, for a few specific reactions occurring in a strongly apolar environment, much lower values have been suggested (6–8), but conclusive experimental evidence has proven difficult to obtain, and one clear counterexample has been documented (see below).
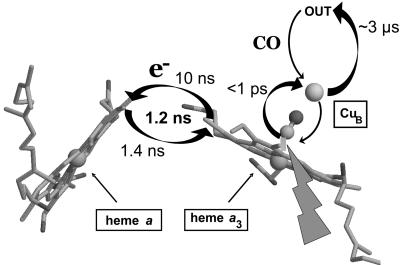
In nonphotoactive systems, the intrinsic kinetics of intraprotein ET are often very difficult to resolve directly, because diffusion of the external electron donor and/or conformational gating events are rate-limiting. Moreover, the ET requirements can be quite different. For instance, in the membranous enzyme cytochrome c oxidase, the three-step chain connecting the electron donor cytochrome c with the active site operates at very low driving forces, in the range of tens of meV (9), implying that at room temperature (kbT ≈ 25 meV) in the partially reduced enzyme, and in the absence of its substrate oxygen and inhibitory molecules, the electrons are distributed over the four redox-active cofactors: hemes a and a3 and copper centers CuA and CuB. This property, together with the possibility of selectively reducing the binuclear site by the inhibitor CO (10), has allowed the measurement of the rate constants of the individual reactions by backflow of electrons upon photoinduced transfer of CO from heme a3 to CuB in the mixed-valence CO complex (11) (Fig. 1). Using this method, the a3→a [≈7 Å edge-to-edge (12)] ET rate constant at room temperature had been estimated at (3 μs)-1 (11). Based on the substantial temperature dependence, its reorganization energy was determined at 760 meV for the mitochondrial enzyme (13); even higher values were reported for bacterial enzymes (13, 14). This reaction between cofactors that are both buried in the membranous moiety of the complex could therefore be considered an example of an intraprotein ET with a reorganization energy as high as those of reactions involving surface-exposed reactants. Therefore, λ = 760 meV was also considered a typical value for ET within the protein (15).
Fig. 1.
Arrangement of the relevant cofactors [from the structure of carboxylated mammalian cytochrome c oxidase, Protein Data Bank ID code 1OCO (12)] and glossary of electron and CO transfer processes monitored in the experiments starting from the mixed-valence (a3+a32+–CO) enzyme. The ET arrows are tentatively drawn along a recently suggested through-space path (19). The figure was prepared by using rasmol (40).
Following controversies regarding the actual rate constant of this reaction (15–19), we recently determined the intrinsic rate constant of a3→a ET to be very high [(1.4 ns)-1], suggesting that the 3-orders-of-magnitude slower 3-μs phase corresponds to migration of CO from CuB out of the protein associated with further ET because of a slight modification of the a/a3 redox equilibrium (20). This finding is in good agreement with recent estimations for the optimal rate constant based on a molecular dynamics/ET pathway analysis (19) but is ≈2 orders slower than the optimal rate constant based on distance only (21). Here, we investigate the activation energy and the reorganization energy of this very low-driving-force [≈-50 meV (20)] reaction. Making use of the fact that both the driving force and the intrinsic rate constant can now be accurately determined as a function of temperature, we establish a value for λ that is an order of magnitude lower than that previously accepted.
Materials and Methods
Carboxylated cytochrome c oxidase from beef heart mitochondria was prepared in 0.1% β-dodecyl-maltoside/50 mM Tris, pH 7.4 in the two-electron reduced mixed-valence (a3+a32+–CO,CuB+) and fully reduced (a2+a32+–CO,CuB+) forms as described in ref. 20. For all experiments, sealed, gas-tight optical cells with an optical path length of 1 mm were used. The enzyme concentrations were 30–50 and 1.5 μM for ultrafast and microsecond experiments, respectively. After each experiment, it was verified that the redox state of the sample was unchanged.
The nanosecond ET process was monitored by using femtosecond absorption pump-probe spectroscopy at a repetition rate of 30 Hz and was performed as described in ref. 20 by using a thermostated translating sample cell holder. Microsecond experiments were performed by using a setup as described in ref. 22 employing 590-nm, 7-ns pump pulses and a thermostated sample holder. Basic data matrix manipulations and presentation were done with matlab (Mathworks, Natick, MA). The absorbance changes were treated by using the splymod algorithm (23) with a matlab interface detailed in ref. 24.
Results and Discussion
Nanosecond ET. The rate constant of a3+a32+ ↔ a2+a33+ equilibration was measured by using the mixed-valence enzyme (a3+a32+–CO,CuB+) through the “backflow” method (9–11, 20), as illustrated in Fig. 1. Briefly, CO can bind only to reduced heme; therefore, CO traps an electron on heme a3. Upon flash photolysis from heme a3, CO is transferred in <1 ps (25) in a ballistic way (26) to CuB. Electrons can now redistribute between the two hemes. The measured equilibration rate constant is the sum of the rate constants for forward (a→a3) and backward ET. The ratio of the two rate constants (and therewith ΔG) is determined from the extent of the redistribution phase (20).
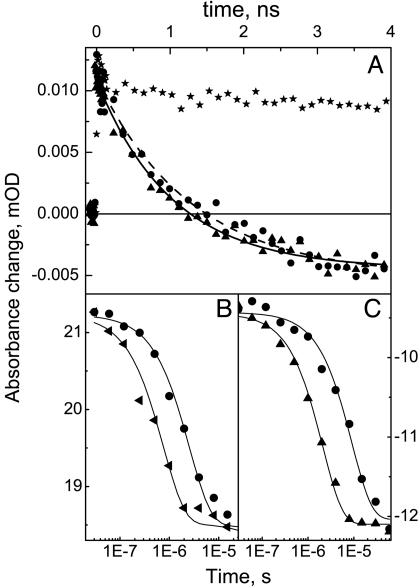
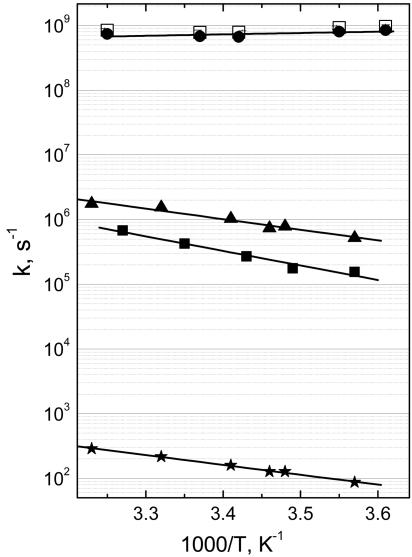
We have measured the equilibration rate constant in the temperature range 4–35°C. This range was essentially limited by the redox stability (at the high end) and by the rate constant of bimolecular CO rebinding (at the low end) of the two-electron reduced mixed-valence form of the enzyme. Figs. 2A and 3 show that in this temperature range, the apparent time constant of electron equilibration between the hemes is almost constant within the experimental error, at 1.17 ± 0.11 ns. Hence, a ↔ a3 ET seems to be activationless, implying that the observed rate constant is close to the optimal rate constant. Therefore, the ensemble of our data is consistent with the most recently predicted (3 ns)-1 optimal rate constant from theoretical work (19).
Fig. 2.
Transient absorption kinetics upon photodissociation of CO from cytochrome c oxidase at various temperatures. (A) Nanosecond kinetics after CO photolysis from the fully reduced (stars, control with no ET) and mixed-valence (triangles, 4°C; circles, 25°C) states of cytochrome c oxidase, monitoring electron equilibration between hemes a and a3. The wavelength of 437 nm that was used is close to both the isosbestic point for CO dissociation and the maximal amplitude of the ET phase (20) at room temperature; the shapes of the transient spectra were nearly temperature-independent. Best fits to the data yield time constants of 1,030 ± 60 ps (4°C) and 1,270 ± 110 ps (25°C). (B) Microsecond kinetics of CO release from CuB in the fully reduced form of the enzyme, monitored at 447 nm [maximum of the corresponding small shift in the optical absorption spectrum of the hemes (30)]. (C) Microsecond phase in the mixed-valence state attributed to CO release from CuB and its gating of a second wave of (intrinsically nanosecond) a3→a ET (20) at its 430-nm minimum (9). Note that the time scale is linear in A and logarithmic in B and C.
Fig. 3.
Temperature dependence of the ET and CO migration phases in cytochrome c oxidase. The observed rate constant of nanosecond ET in the mixed-valence state is shown as open squares, and the calculated forward heme a→a3 rate constant is shown as circles. Observed rate constants of CO migration from CuB in the fully reduced (triangles) and mixed-valence (filled squares) states of the enzyme and CO rebinding to heme a3 in the fully reduced state (stars) were fitted to the Arrhenius expression k = Ae-Ea/kBT, yielding activation energies Ea of 330 ± 30, 450 ± 40, and 306 ± 10 meV and preexponential factors A of 1011.5 ± 0.5, 1013.1 ± 0.8, and 107.4 ± 0.2 s-1, respectively.
For nonadiabatic ET, the rate constant k can be factorized into electronic (≈V 2) and nuclear (Franck–Condon, FC) factors (1):
 |
[1] |
Because V seems to be temperature-insensitive for this reaction (19), our results imply that FC is robust against temperature.
The ≈109 s-1 rate constant is low enough for a regime of nonadiabatic ET and thermalized nuclear motions to apply. In the classical Marcus treatment of nonadiabatic ET (1), FC is expressed as
 |
[2] |
in which kB is the Boltzmann factor and T is temperature. Our data would thus suggest a very low value of the reorganization energy λ as in this treatment for activationless ET, λ + ΔG = 0. As ΔG ≈ -50 meV (20), a straight application would yield λ ≈ 50 meV. However, a more detailed analysis is warranted because (i) ΔG can also be temperature-dependent (2) and (ii) the classical (high-temperature) limit is not well fulfilled around physiological temperatures. Taking these points into account, with our present data, we can establish an upper limit for λ as will be explained in the following analysis.
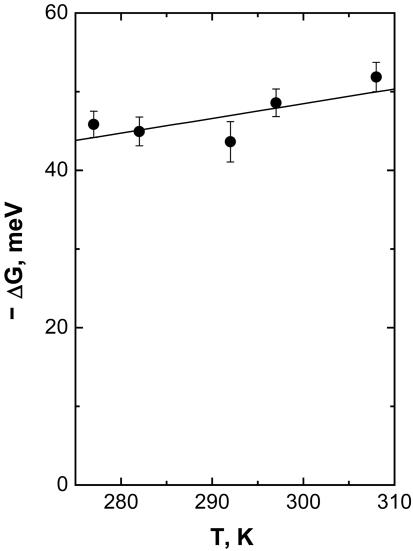
ΔG is such that the extent of a3+a32+ ↔ a2+a33+ electron equilibration after CO photolysis corresponds to reduction of only a small fraction of heme a (see Fig. 1). Using analysis of the Soret band spectral changes as outlined in ref. 20, we found that the extent of heme a reduction remains constant at 13.4 ± 1.0% over the examined temperature range. The assessment of this value at different temperatures allows a direct determination of ΔG(T) associated with the reaction (Fig. 4). A small but significant increase of ΔG with temperature (0.20 ± 0.10 meV/K) is observed. We emphasize that such information is not available from steady-state redox titrations of the relevant and only transiently populatable states for this, and many other, intraprotein reactions. The lack of such information often prevents use of k(T) to determine λ (2).
Fig. 4.
Temperature dependence of ΔG associated with the nanosecond ET reaction determined from the amplitude of the 1.2-ns kinetic phase in the Soret region as described in ref. 20. The best linear fit indicates a small entropic contribution to ΔG (0.20 ± 0.10 meV/K). We note that there is a small systematic error in ΔG due to uncertainties in the spectral deconvolution (20) (≈10 meV), but this error does not significantly influence the temperature dependence.
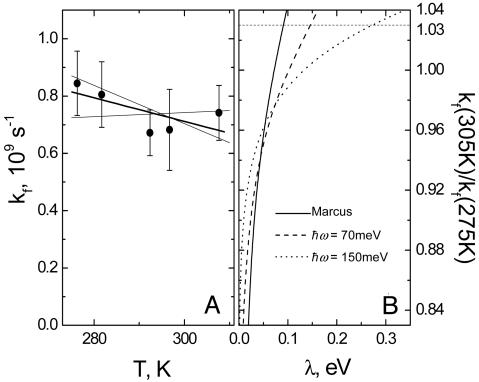
We can now obtain the forward heme a→heme a3 rate constant kf. This rate constant is somewhat lower than the experimentally observed equilibration rate constant k as k = kf + kb, where kb is the intrinsic backward heme a3→heme a rate constant and kf/kb is determined by the Boltzmann thermal equilibrium factor exp(-ΔG/kBT). kf seems to actually slightly decrease with temperature over the investigated range, and as a conservative result, we determine that 0.76 < kf(305 K)/kf(275 K) < 1.03 (Fig. 5A).
Fig. 5.
Determination of the range of reorganization energies for a→a3 ET. (A) temperature dependence of the forward heme a→a3 rate constant (circles) fitted with a straight line (solid line). Thin lines represent extreme values tolerated. The range within these values corresponds to 0.76 < kf(305 K)/kf(275 K) < 1.03. (B) Calculated kf(305 K)/kf(275 K) as a function of λ and  as described in the text. The experimentally allowed upper value of 1.03 as determined in A is shown as a dotted line.
In the approximation where the nuclear dynamics coupled to the reaction are collected in a single effective mode of energy  , a quantum expression for the Franck–Condon factor of nonadiabatic thermalized ET can be written as (21, 27, 28)
 |
[3] |
where  is the
  -normalized reorganization energy,
  is the
  -normalized free energy,
  is the average vibrational level populated, and IP is the modified Bessel function of the first kind of order P. For
  , this expression reduces to the classical Eq. 2. Using Eq. 3, we have calculated the ratio kf(305 K)/kf(275 K) as a function of λ and
  (Fig. 5B), using the best fit for ΔG(T) of Fig. 4. Using a value of
  meV for the energy corresponding to the effective oscillators (21) at face value, the conservative upper limit for the ratio of 1.03 obtained from kf(T) (Fig. 5A) yields λ < 150 meV. Allowing for ΔG(T) to vary with the lowest limit of the slope (0.10 meV/K) up-shifts this limit to λ < 200 meV. We conclude that λ must be <200 meV. We note that for values higher than
  meV, a value considered adequate for a wide range of intraprotein ET reactions (5), the range allowed for λ is extended. However, for a value of –hω = 150 meV, we still find λ < 300 meV (Fig. 5B). It would be of high interest to calculate the distribution of modes by using molecular dynamics simulations such as those in ref. 19 to estimate ω specifically for this reaction; a more refined way of analysis could then also be obtained by incorporating this distribution into a multimode quantum mechanical model (29).
Fig. 5B also shows that with the widely used classical formula (corresponding to the high temperature limit  , which is not well fulfilled here), this analysis would narrow down to λ < 90 meV. In sum, the determined range λ < 200 meV yields much lower values than the earlier (13) proposed value of λ = 760 meV, which was based on the hereunder-discussed substantial temperature dependence of the 3-μs phase (we also note that it was calculated by using the classical formalism; the quantum expression would have given a higher value).
Microsecond CO Migration. CO transiently ligated to CuB can either migrate out of the protein or rebind to heme a32+. Near room temperature, the vast majority of CO leaves the protein by means of thermal dissociation from CuB in a few microseconds (30). This process is likely to be associated with a small increase in ΔG for the a→a3 ET reaction and, hence, for the mixed-valence state, may gate an additional wave of heme a reduction (16, 20). Rebinding of CO to (reduced) heme a3 occurs on the millisecond timescale under 1 atm CO and also involves binding to CuB.
In contrast to the activationless nanosecond ET phase, the rate constant of the microsecond phase in the mixed-valence state of the enzyme is strongly temperature-dependent (ref. 13 and Figs. 2 and 3). As explained above, this phase may follow the kinetics of migration of CO from CuB out of the enzyme in the mixed-valence complex. We therefore determined the hitherto uninvestigated temperature dependence of the corresponding phase in the fully reduced CO complex, where ET cannot occur. The rate constant of this phase is found to accelerate by a factor of ≈4 between 5°C and 33°C (Fig. 2B), and an activation energy of Ea = 330 ± 30 meV was determined (Fig. 3). Interestingly, this phase has the same energetic barrier as that (Ea = 306 ± 10 meV; Fig. 3) of the bimolecular rebinding of CO to heme a3, occurring in a few tens of milliseconds at 1 atm of CO in the investigated temperature range. Because both processes involve thermal dissociation of CO from CuB (Fig. 1), Ea likely represents the dissociation enthalpy of the CuB–CO bond.
The temperature dependence of the corresponding microsecond phase in the mixed-valence state of the enzyme is of the same order as that of the fully reduced form. The activation barrier is found to be somewhat higher (Ea = 450 ± 40 meV) than for fully reduced CO, but the preexponential factors (activationless rates) are very close (1011.5 ± 0.5 s-1 for the fully reduced form and 1013.1 ± 0.8 s-1 for the mixed-valence form; Fig. 3). Together, this analysis indicates a small effect of the redox state of hemes on the CuB–CO dissociation barrier. The CuB–CO dissociation enthalpies found in both systems are remarkably similar to that of Cu–CO in the gas phase [370 ± 80 meV (31), obtained from transiently formed monoligand CuCO vapor], suggesting only a minor influence of the three histidines interacting with CuB on the Cu–CO bond. In general terms, this result is consistent with a very recently reported indication from a photothermal study on a bacterial oxidase that the active site dynamics involving CuB are influenced by the redox state of the equivalent of heme a (32). We note, however, that the intrinsic microsecond ET assumed in the analysis of that study is not supported by our previous (20) and present work.
The barrier for CuB–CO dissociation is much lower than that for heme–CO dissociation [≈950 meV (33)], which is in agreement with the steady-state binding of CO to heme rather than to CuB in most heme-copper oxidases. In sum, the temperature dependence of the previously determined microsecond ET phase in the mixed-valence enzyme can be fully ascribed to the thermodynamics of the now-identified CO transfer process gating it and is much stronger than that of the nanosecond, intrinsic ET process.
General Implications for Low Reorganization Energy Reactions. The reorganization energy associated with an ET reaction contains contributions from the reactants (here, the two hemes) and from the surrounding medium (protein and/or solvent). Our finding of a low overall λ is thus generally consistent with the calculated low contributions for λ for iron-porphyrins (34) and with the reaction taking place in the hydrophobic core of a membrane protein. More particularly, it seems to be in agreement with the theoretical pathway analysis that indicates that the environment of the heme–heme electron-hopping route in the reaction under study is particularly devoid of charged residues (19).
Our results help to substantiate a general picture of ET between protein-buried redox partners. The reorganization energies of at least two other ET reactions in membrane proteins have been discussed. For the microsecond long-range (19.5 Å, metal to metal) ET from the primary electron acceptor CuA of cytochrome c oxidase to heme a (ΔG ≈ -80 meV), λ has been suggested to be <100 meV, based on the variation of its rate constant with the driving force (7) and on analysis of the weak temperature dependence of the rate constant in the framework of classical Marcus theory (35). However, higher values of 150–500 meV based on theoretical arguments were used by the same researchers in later work (36, 37). Along a different line, the low-driving-force primary charge separation in photosynthesis of purple bacteria was proposed to be associated with a sub-100 meV reorganization energy based on molecular dynamics simulations (6). The regime of the latter, ultrafast (≈3 ps) photochemical reaction, however, can probably not be treated in the framework of nonadiabatic thermalized ET, because it involves three near-adiabatically coupled electronic states and light-induced, coherent, nonthermal nuclear dynamics (38, 39).
In light of these observations, the present assessment of λ ≈ 100 meV for the a→a3 ET, rather than ≈800 meV (13), indicates that low-ΔG, low-λ reactions are common for efficiently channeling electrons through chains that are buried inside proteins at low cost of free energy. As discussed in ref. 20, at least for the biochemical reaction investigated in this work, the high speed allowed for a low-driving-force reaction into an active site can be highly relevant to assure efficient trapping of substrate. Here, we have shown that the reaction is robust against temperature and that the high speed is related to the low reorganization energy. The membrane complex of cytochrome c oxidase provides a unique nonphotochemical system through which such ET reactions can be directly investigated.
Acknowledgments
A.J. is the recipient of a long-term fellowship from the European Molecular Biology Organization.
Author contributions: A.J., F.R., E.P., U.L., and M.H.V. designed research; A.J., F.R., and E.P. performed research; A.J., F.R., and M.H.V. analyzed data; and A.J., U.L., and M.H.V. wrote the paper.
This paper was submitted directly (Track II) to the PNAS office.
Abbreviation: ET, electron transfer.
References
- 1.Marcus, R. A. & Sutin, N. (1985) Biochim. Biophys. Acta 811, 265-322. [Google Scholar]
- 2.Gray, H. B. & Winkler, J. R. (2003) Q. Rev. Biophys. 36, 341-372. [DOI] [PubMed] [Google Scholar]
- 3.Hoff, A. J. & Deisenhofer, J. (1997) Phys. Rep. 287, 2-247. [Google Scholar]
- 4.Li, J., Gilroy, D., Tiede, D. M. & Gunner, M. R. (1998) Biochemistry 37, 2818-2829. [DOI] [PubMed] [Google Scholar]
- 5.Page, C. C., Moser, C. C., Chen, X. & Dutton, P. L. (1999) Nature 402, 47-52. [DOI] [PubMed] [Google Scholar]
- 6.Parson, W. W., Chu, Z. T. & Warshel, A. (1998) Biophys. J. 74, 182-191. [DOI] [PMC free article] [PubMed] [Google Scholar]
- 7.Winkler, J. R., Malmström, B. G. & Gray, H. B. (1995) Biophys. Chem. 54, 199-209. [DOI] [PubMed] [Google Scholar]
- 8.Brzezinski, P. & Malmström, B. G. (1985) FEBS Lett. 187, 111-114. [DOI] [PubMed] [Google Scholar]
- 9.Verkhovsky, M. I., Morgan, J. E. & Wikström, M. (1992) Biochemistry 31, 11860-11863. [DOI] [PubMed] [Google Scholar]
- 10.Boelens, R. & Wever, R. (1979) Biochim. Biophys. Acta 547, 296-310. [DOI] [PubMed] [Google Scholar]
- 11.Oliveberg, M. & Malmström, B. G. (1991) Biochemistry 30, 7053-7057. [DOI] [PubMed] [Google Scholar]
- 12.Yoshikawa, S., Shinzawa-Itoh, K., Nakashima, R., Yaono, R., Inoue, N., Yao, M., Fei, M. J., Libeu, C. P., Mizushima, T., Yamaguchi, H., et al. (1998) Science 280, 1723-1729. [DOI] [PubMed] [Google Scholar]
- 13.Adelroth, P., Brzezinski, P. & Malmström, B. G. (1995) Biochemistry 34, 2844-2849. [DOI] [PubMed] [Google Scholar]
- 14.Ching, E., Gennis, R. B. & Larsen, R. W. (2003) Biophys. J. 84, 2728-2733. [DOI] [PMC free article] [PubMed] [Google Scholar]
- 15.Regan, J. J., Ramirez, B. E., Winkler, J. R., Gray, H. B. & Malmström, B. G. (1998) J. Bioenerg. Biomembr. 30, 35-48. [DOI] [PubMed] [Google Scholar]
- 16.Verkhovsky, M. I., Jasaitis, A. & Wikström, M. (2001) Biochim. Biophys. Acta 1506, 143-146. [DOI] [PubMed] [Google Scholar]
- 17.Namslauer, A., Branden, M. & Brzezinski, P. (2002) Biochemistry 41, 10369-10374. [DOI] [PubMed] [Google Scholar]
- 18.Medvedev, D. M., Daizadeh, I. & Stuchebrukhov, A. A. (2000) J. Am. Chem. Soc. 122, 6571-6582. [Google Scholar]
- 19.Tan, M.-L., Balabin, I. & Onuchic, J. N. (2004) Biophys. J. 86, 1813-1819. [DOI] [PMC free article] [PubMed] [Google Scholar]
- 20.Pilet, E., Jasaitis, A., Liebl, U. & Vos, M. H. (2004) Proc. Natl. Acad. Sci. USA 101, 16198-16203. [DOI] [PMC free article] [PubMed] [Google Scholar]
- 21.Moser, C. C., Keske, J. M., Warncke, K., Farid, R. S. & Dutton, P. L. (1992) Nature 355, 796-802. [DOI] [PubMed] [Google Scholar]
- 22.Beal, D., Rappaport, F. & Joliot, P. (1999) Rev. Sci. Instrum. 70, 202-207. [Google Scholar]
- 23.Provencher, S. W. & Vogel, R. H. (1983) in Numerical Treatment of Inverse Problems in Differential and Integral Equations, eds. Deuflhard, P. and Hairer, E. (Birkhauser, Boston), Vol. 2, pp. 304-319. [Google Scholar]
- 24.Morgan, J. E., Verkhovsky, M. I., Puustinen, A. & Wikström, M. (1995) Biochemistry 34, 15633-15637. [DOI] [PubMed] [Google Scholar]
- 25.Dyer, R. B., Peterson, K. A., Stoutland, P. O. & Woodruff, W. H. (1994) Biochemistry 33, 500-507. [DOI] [PubMed] [Google Scholar]
- 26.Liebl, U., Lipowski, G., Négrerie, M., Lambry, J.-C., Martin, J.-L. & Vos, M. H. (1999) Nature 401, 181-184. [DOI] [PubMed] [Google Scholar]
- 27.Levich, V. G. & Dogonadze, R. R. (1959) Dokl. Akad. Nauk SSSR 124, 123-126. [Google Scholar]
- 28.Jortner, J. (1976) J. Chem. Phys. 64, 4860-4867. [Google Scholar]
- 29.Parson, W. W. & Warshel, A. (2004) Chem. Phys. 296, 201-216. [Google Scholar]
- 30.Georgiadis, K. E., Jhon, N.-I. & Einarsdóttir, O. (1994) Biochemistry 33, 9245-9256. [DOI] [PubMed] [Google Scholar]
- 31.Blitz, S. A., Mitchell, S. A. & Hacket, P. A. (1991) J. Phys. Chem. 95, 8719-8726. [Google Scholar]
- 32.Mikšovská, J., Gennis, R. B. & Larsen, R. W. (2005) FEBS Lett. 579, 3014-3018. [DOI] [PubMed] [Google Scholar]
- 33.Keyes, M. H., Falley, M. & Lumrey, R. J. (1971) J. Am. Chem. Soc. 93, 2035-2040. [DOI] [PubMed] [Google Scholar]
- 34.Sigfridsson, E., Olsson, M. H. M. & Ryde, U. (2001) J. Phys. Chem. B 105, 5546-5552. [Google Scholar]
- 35.Brzezinski, P. & Malmström, B. G. (1987) Biochim. Biophys. Acta 894, 29-38. [DOI] [PubMed] [Google Scholar]
- 36.Brzezinski, P. (1996) Biochemistry 35, 5611-5615. [DOI] [PubMed] [Google Scholar]
- 37.Ramirez, B. E., Malmstrom, B. G., Winkler, J. R. & Gray, H. B. (1995) Proc. Natl. Acad. Sci. USA 92, 11949-11951. [DOI] [PMC free article] [PubMed] [Google Scholar]
- 38.Vos, M. H., Rischel, C., Jones, M. R. & Martin, J.-L. (2000) Biochemistry 39, 8353-8361. [DOI] [PubMed] [Google Scholar]
- 39.Shuvalov, V. A. & Yakovlev, A. G. (2003) FEBS Lett. 540, 26-34. [DOI] [PubMed] [Google Scholar]
- 40.Sayle, R. A. & Milner-White, E. J. (1995) Trends Biochem. Sci. 20, 374-376. [DOI] [PubMed] [Google Scholar]


