

Abstract
Aim
The aim of this study was to define TAC1 and TACR1 methylation profiles for head and neck squamous cell carcinoma (HNSCC) tumors at diagnosis and follow-up and to evaluate their prognostic significance and value as a biomarker of recurrence.
Materials and methods
TAC1 and TACR1 expression was measured in a panel of cell lines by quantitative RT-PCR. The TAC1 and TACR1 promoter methylation status was determined by quantitative methylation-specific PCR.
Results
Methylation was associated with TAC1 and TACR1 transcription inhibition. TAC1 methylation in 49/100 (49 %) of HNSCC tumor specimens significantly correlated with p16 methylation (P = 0.010), E-cadherin methylation (P = 0.041), galanin methylation (P = 0.037), and disease-free survival (P = 0.002). Stage III and IV patients manifesting TAC1 hypermethylation had significantly shorter survivals than did patients without TAC1 methylation (P = 0.022). TACR1 methylation in 34/100 (34 %) cases was significantly correlated with galanin methylation (P = 0.014) and GALR1 methylation (P = 0.004). TAC1 promoter hypermethylation was statistically correlated with reduced disease-free survival (log-rank test, P = 0.002). In multivariate logistic-regression analysis, methylation of TAC1 and of the gene pair TAC1 and TACR1 was associated with an odds ratio for recurrence of 3.35 (95 % CI, 1.37–8.19; P = 0.008) and 5.09 (95 % CI, 1.44–18.02; P = 0.011), respectively.
Conclusion
CpG hypermethylation is a likely mechanism of TAC1 and TACR1 gene inactivation, supporting the hypothesis that TAC1 and TACR1 play a role in the tumorigenesis of HNSCC and that this hypermethylation may serve as an important biomarker.
Keywords: TAC1, TACR1, Galanin, DNA methylation, Head and neck cancer
Introduction
Squamous cell carcinoma of the head and neck (HNSCC) is the sixth most frequent type of cancer, affecting more than 500,000 patients per year worldwide (Vokes et al. 1993). Despite advances in therapy, the prognosis for HNSCC has not appreciably improved over the last 20 years, essentially because of late diagnosis and frequent locoregional recurrences without successful salvage therapy if the tumor is large (Kumar et al. 2008). To establish novel diagnostic and therapeutic strategies against this deadly disease, it is essential to understand its molecular biology. Approximately 30 % of all pharmaceuticals on the market exert their therapeutic effect by interacting with a G-protein coupled receptor (GPCR) (Lappano and Maggiolini 2011; Forastiere et al. 2001). Several recent studies have suggested that neuropeptides function as tumor suppressor genes and possess potent antitumor activity via the autocrine and/or paracrine systems (Bolden et al. 2006; Esteller 2008). Our findings suggest simultaneous methylation of galanin and galanin receptor type 1 (GALR1) genes occurs in a subset of HNSCC and may be used as a prognostic marker (Misawa et al. 2008).
As galanin and ligands of TACR1 have associated function and are often simultaneously investigated in neurological studies (Holmes et al. 2003; Xu et al. 2005; Barreto et al. 2010), they are expected to be closely related in HNSCC. The tachykinin-1 (TAC1) gene encodes the neuropeptides—substance P, neurokinin A, and neurokinin B—which act through three types of transmembrane G-protein-coupled receptors named tachykinin receptors 1–3 (TACR1, TACR2, and TACR3) (Pennefather et al. 2004). Substance P and neurokinin A are alternately spliced products of the preprotachykinin gene and are found in the central and peripheral nervous systems (Pinto et al. 2004). Substance P, neurokinin A, and neurokinin B exhibit binding preferences for TACR1, TACR2, and TACR3, respectively (Pennefather et al. 2004; Jaafari et al. 2008). These molecules affect the secretion, motility, and inflammatory reactions of the gastrointestinal tract via the activation of neurokinin-1 and neurokinin-2 receptors (Severini et al. 2002). Substance P has proliferative and antiapoptotic effects via the mitogen-activated protein kinase cascade and nuclear factor-κB (Lieb et al. 1997; Koon et al. 2004). Another TAC1 gene product, neurokinin A, has antiproliferative properties (Rameshwar and Gascon 1996). TACR1 is expressed in the central and peripheral nervous systems and is integral to the maintenance of a favorable tumor microenvironment (Rosso et al. 2012). Hypermethylation of TAC1 has been described in esophageal cancer (Jin et al. 2007), gastric cancer (David et al. 2009), colon cancer (Mori et al. 2006), and breast cancer (Jeschke et al. 2012). Overall patient survival is correlated with TAC1 methylation status in esophageal squamous cell carcinoma, but not in esophageal adenocarcinoma (Jin et al. 2007). Despite our understanding of gastrointestinal tract cancer, hypermethylation in HNSCCs remains to be explored. To our knowledge, promoter hypermethylation of TACR1 in human cancer has not been reported in the literature. The purpose of this study was to define TAC1 and TACR1 methylation profiles in HNSCC tumors at diagnosis and follow-up and to evaluate its prognostic significance and value as a biomarker of recurrence.
We evaluated TAC1 and TACR1 methylation in large panels of primary HNSCC (typical SCC specimens). Moreover, tumor specimen analysis confirmed that hypermethylation is common and is associated with recurrence and reduced disease-free survival (DFS). This study suggests hypermethylation of TAC1 and TACR1 in the primary tumor might be a predictor of survival in head and neck cancer.
Materials and methods
Tumor samples and cell lines
Tumor specimens were obtained from 100 primary HNSCC samples. All patients were treated at the Department of Otolaryngology, Hamamatsu University School of Medicine, Japan, between 1977 and 1995. All patients provided written informed consent under a protocol approved by the Institutional Review Boards at the Hamamatsu University School of Medicine. Clinical information including age, sex, tumor site, smoking status, alcohol exposure, tumor size, lymph-node status, and stage grouping were obtained through records review. The average age was 63.9 years (range 39–90), and the male:female ratio was 78:22. Primary tumors were located in the oral cavity (n = 34), hypopharynx (n = 24), larynx (n = 20), oropharynx (n = 11), and paranasal cavity (n = 11). Matched pairs of head and neck tumor tissues and adjacent normal mucosal tissues were obtained from the surgical specimens of 36 patients for initial methylation screening between 2008 and 2011. DNA and cDNA were derived from 12 UM-SCC cell lines established from patients at the University of Michigan (Brenner et al. 2010).
Bisulfite modification and quantitative methylation-specific PCR (Q-MSP)
Genomic DNA was extracted with the Wizard Genomic DNA Purification Kit (Promega, Madison, WI). Bisulfite modification of genomic DNA was performed as reported in a previous study (Misawa et al. 2008). Promoter methylation of TAC1 and TACR1 was measured by quantitative methylation-specific PCR (Q-MSP) with the TaKaRa Thermal Cycler Dice TM Real-Time System TP800 (TaKaRa, Tokyo, Japan). Q-MSP primers for methylated DNA were Q-MSP-TAC1-F (5′-GGC GGT TAA TTA AAT ATT GAG TAG AAA GTC GC-3′) and Q-MSP-TAC1-R (5′-AAA TCC GAA CGC GCT CTT TCG-3′), Q-MSP-TACR1-F (5′-TTG GCG TAG TTG TCG CGT TG-3′) and Q-MSP-TACR1-R (5′-CGC GAA TTA ACT ACG CAC GA-3′), and Q-MSP-ACTB-F (5′-TGG TGA TGG AGG AGG TTT AGT AAG T-3′) and Q-MSP-ACTB-R (5′-AAC CAA TAA AAC CTA CTC CTC CCT TAA-3′). Q-MSP was performed with a 20-ng DNA solution containing SYBR® Premix Dimer Eraser® (Perfect Real Time) (TaKaRa, Tokyo, Japan), and 10 μM of each primer in a total volume of 20 μL. A standard curve was generated from serial dilutions of EpiScope™ Methylated HeLa gDNA (TaKaRa, Tokyo, Japan). The normalized methylation value (NMV) was defined as NMV = (T-S/T-FM)/(ACTB-S/ACTB-FM), where T-S and T-FM represent target gene methylation (TAC1 and TACR1) in the sample and universal methylated DNAs, while ACTB-S and ACTB-FM correspond to β-actin in the sample and universal methylated DNAs. Methylation status of GALR1 (Misawa et al. 2008), p16 (Ovchinnikov et al. 2012), MGMT (Park et al. 2012), DAPK (Ovchinnikov et al. 2012), E-cadherin (Ovchinnikov et al. 2012), H-cadherin (Jin et al. 2008), DCC (Park et al. 2008), RASSF1A (Kuroki et al. 2003), and COL1A2 (Misawa et al. 2011) was assessed as previously described.
Quantitative RT-PCR of TAC1 and TACR1
Total RNA was isolated with the RNeasy Mini Kit (QIAGEN, Hilden, Germany) and treated with RNase-Free DNase (QIAGEN). cDNA was generated from DNase-treated total RNA by using random primers (Invitrogen, Carlsbad, CA) with Superscript II reverse transcriptase (Invitrogen). The primer sequences were as follows: TAC1 forward, 5′-TGG TCC GAC TGG TAC GAC AG-3′; TAC1 reverse (5′-CTG CAG AAG ATG CTC AAA GGG-3′) (Mori et al. 2006); TACR1 forward, (5′-GTC GTG TGC ATG ATC GAA TGG-3′); TACR1 reverse, (5′-TTG CTC GTG GTA GCG GTC AG-3′); GAPDH forward, (5′-GCA CCG TCA AGG CTG AGA AC-3′); and GAPDH reverse, (5′-TGG TGA AGA CGC CAG TGG A-3′). Quantitative RT-PCR was performed on the TaKaRa TP800 system. Quantitative RT-PCR was carried out as described previously (Misawa et al. 2008). For each PCR evaluation, 2 μL of diluted cDNA, 12.5 μL of SYBR® Premix Ex Taq ™ Perfect Real Time (TaKaRa), and 0.5 μL of the primers were added to obtain a final volume of 25 μL. The thermal cycler conditions were as follows: 1 cycle of denaturation at 95 °C for 10 s, followed by 45 cycles of denaturation at 95 °C for 5 s and annealing/extension at 60 °C for 30 s. Analysis was performed with Thermal Cycler Dice™ Real-Time System TP800 Software Ver. 1.03A (TaKaRa) following the manufacturer’s instructions. For comparison of samples, gene expression of the target was normalized to that of GAPDH.
Statistical analysis
Receiver-operator characteristic (ROC) curves were generated with StatMate IV (ATMS Co. Ltd., Tokyo, Japan) by using the NMVs for the 36 HNSCC and 36 adjacent normal mucosal tissues. The area under the ROC curve identified optimal sensitivity and specificity levels for distinguishing normal from HNSCC tissues, and the corresponding NMV thresholds were calculated for TAC1 and TACR1. The cutoff value determined from this ROC curve was applied to determine the frequency of TAC1 and TACR1 methylation.
For frequency analysis in contingency tables, associations between variables were analyzed by Fisher’s exact test. Comparisons and tests for statistical significance in the colony formation assay were made with the Student’s t test. The disease-free interval was measured from the date of treatment to the date when locoregional recurrence or distant metastasis was diagnosed. DFS probabilities were estimated by the Kaplan–Meier method, and the log-rank test was applied to assess the significance of differences between actuarial survival curves. Multivariate logistic-regression analysis, which involved age, sex, smoking status, alcohol intake, stage grouping, and methylated genes, was used to identify the predictive value of the prognostic factors (Van Dyke et al. 1994; Katz 2011). All P values are two-tailed and significance was determined as P < 0.05. All statistical analyses were performed with StatMate IV (ATMS Co. Ltd., Tokyo, Japan).
Results
UM-SCC cell lines
Quantitative RT-PCR of TAC1 and TACR1 transcripts from 12 UM-SCC cell lines revealed lower expression in cancer cell lines than in normal cell lines (P < 0.01, Fig. 1a, b). Q-MSP technology indicated a significantly increased NMV of TAC1 promoter methylation in cancer cell lines versus normal cell lines (P < 0.001, Fig. 1c). In cancer cell lines, TACR1 expression was significantly lower than in normal cell lines, but there was no significant difference in the NMV of TACR1 s (Fig. 1d).
Fig. 1.
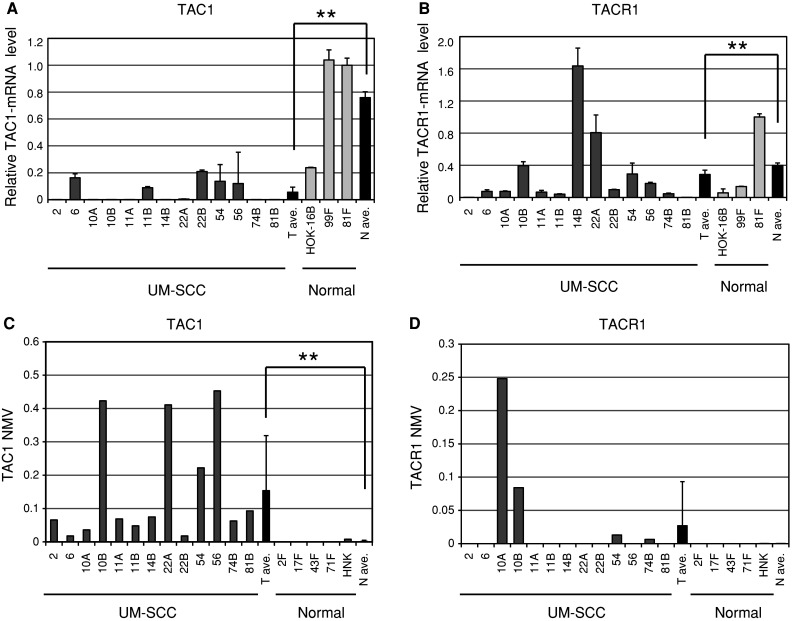
Diagrammatic representation of TAC1 and TACR1 methylation analysis by quantitative-MSP, expression analysis by quantitative RT-PCR, and bisulfite sequencing analysis in UM-SCC cell lines. a Relative mRNA expression of TAC1 revealed lower expression in cancer cell lines than in normal cell lines. The housekeeping gene GAPDH was run as a control for RNA integrity. b Relative mRNA expression of TACR1 revealed lower expression in cancer cell lines than in normal cell lines. c Mean TAC1 NMV was significantly higher in cancer cell lines than in normal cell lines. d Representative examples of quantitative-MSP of TACR1 in cancer cell lines and normal cell lines; there was no significant difference in NMV. **P < 0.01
Matched pairs of head and neck tumors and adjacent normal mucosal tissues
TAC1 and TACR1 promoter methylation status was analyzed by Q-MSP in 36 cancerous and paired noncancerous mucosa. Promoter methylation was represented by normalized methylation values (NMVs), that is, the ratio of methylated DNA at the target sequence in each specimen to a fully methylated control DNA. TAC1 and TACR1 methylation levels were significantly higher in primary HNSCCs than in noncancerous mucosal tissues (median NMV = 0.238 versus 0.025, P < 0.001, and median NMV = 0.071 versus 0.001, P = 0.041, Wilcoxon matched-pair test and paired Student’s t test; Fig. 2a, b).
Fig. 2.

Hypermethylation patterns in matched pairs of head and neck tumors and adjacent normal mucosal tissues. a TAC1 NMVs of head and neck tumors were significantly higher than those of paired adjacent normal mucosal tissues. b A higher frequency and quantity of TACR1 methylation was noted in head and neck tumors than in matched normal mucosal tissues. c The area under the ROC curve (AUROC) value for the TAC1 gene was 0.9217. At the cutoff value of 0.108, sensitivity was 72.2 % and specificity was 97.2 %. d The area under the ROC curve (AUROC) value for the TACR1 gene was 0.6277. At the cutoff value of 0.008, sensitivity was 38.9 % and specificity was 97.2 %
TAC1 promoter hypermethylation showed highly discriminative ROC curve profiles, which clearly distinguished HNSCC from normal mucosal tissues (AUROC = 0.9217). ROC curves with corresponding areas under the ROC curve for target genes in HNSCC versus normal mucosal tissues are shown in Fig. 2c, d. The cutoff NMVs for TAC1 (0.108) and TACR1 (0.008) were chosen from the ROC curves for high sensitivity and >95 % specificity (Fig. 2c, d).
Clinicopathologic characteristics of 100 primary HNSCC samples
One hundred DNA samples from previously untreated primary tumors were tested with the same primers. We classified a specimen as methylated when the NMV exceeded the cutoff value. The TAC1 promoter was methylated in 49 of 100 (49.0 %) cases (Fig. 3a). The TACR1 promoter was methylated in 34 of 100 (34.0 %) cases (Fig. 3b). Methylation of TAC1 significantly correlated with recurrence event (P = 0.009), p16 methylation (P = 0.010), E-cadherin methylation (P = 0.041), and galanin methylation (P = 0.037). The presence of TAC1 promoter methylation was not associated with any difference in the age at onset, gender, smoking status, alcohol exposure, tumor size, lymph-node status, stage, and RASSF1A, H-cadherin, MGMT, DAPK, DCC, COL1A2, and GALR1 methylation. TACR1 methylation was significantly correlated with galanin (P = 0.014) and GALR1 methylation (P = 0.004), but was not associated with differences in the age at onset, gender, smoking status, alcohol exposure, tumor size, lymph-node status, stage, recurrence events, and p16, RASSF1A, E-cadherin, H-cadherin, MGMT, DAPK, DCC, and COL1A2 methylation (Table 1).
Fig. 3.
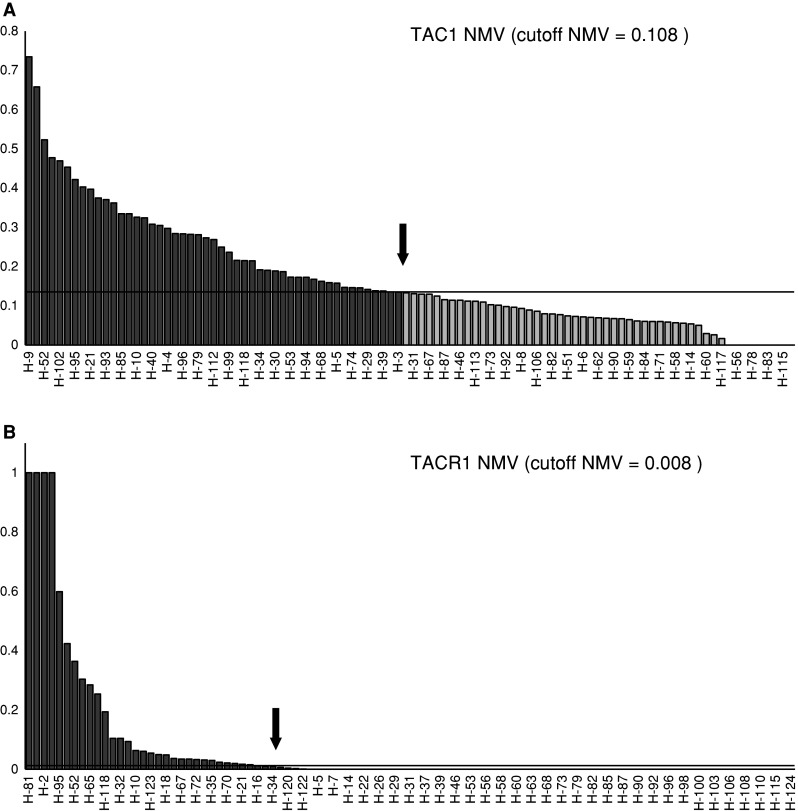
TAC1 and TACR1 methylation analysis by quantitative-MSP in 100 primary HNSCC samples. a One hundred DNA samples from untreated primary tumors were tested with the same primers. The cutoff NMVs for TAC1 (0.108), which were used for data analysis, are indicated by straight arrows and basis underlining. b The cutoff NMV for TACR1 (0.008) is indicated by a straight arrow and basis underlining
Table 1.
TAC1 and TACR1 genes methylation status in HNSCC primary samples
| Characteristics (n = 100) | TAC1 | TACR1 | ||||
|---|---|---|---|---|---|---|
| Present (49) | Absent (51) | P value† | Present (34) | Absent (66) | P value† | |
| Age | ||||||
| 70 and older (29) | 17 | 12 | 8 | 21 | ||
| Under 70 (71) | 32 | 39 | 0.272 | 26 | 45 | 0.487 |
| Gender | ||||||
| Male (78) | 40 | 38 | 26 | 52 | ||
| Female (22) | 9 | 13 | 0.472 | 8 | 14 | 1 |
| Smoking status | ||||||
| Smoker (66) | 35 | 31 | 25 | 41 | ||
| Nonsmoker (34) | 14 | 20 | 0.296 | 9 | 25 | 0.275 |
| Alcohol exposure | ||||||
| Ever (60) | 32 | 28 | 16 | 44 | ||
| Never (38) | 17 | 23 | 0.314 | 18 | 22 | 0.084 |
| Tumor size | ||||||
| T1-2 (52) | 23 | 29 | 18 | 34 | ||
| T3-4 (48) | 26 | 22 | 0.423 | 16 | 32 | 1 |
| Lympho-node status | ||||||
| N0 (46) | 20 | 26 | 13 | 33 | ||
| N+ (54) | 29 | 25 | 0.324 | 21 | 33 | 0.295 |
| Stage | ||||||
| I–II (31) | 13 | 18 | 11 | 20 | ||
| III–IV (69) | 36 | 33 | 0.392 | 23 | 46 | 1 |
| Recurrence events | ||||||
| Positive (47) | 30 | 17 | 17 | 30 | ||
| Negative (53) | 19 | 34 | 0.009* | 17 | 36 | 1 |
| TAC1 methylation | ||||||
| Yes (49) | – | – | 19 | 30 | ||
| No (51) | – | – | – | 15 | 36 | 0.4 |
| Galanin methylation | ||||||
| Yes (25) | 17 | 8 | 14 | 11 | ||
| No (75) | 32 | 43 | 0.037* | 20 | 55 | 0.014* |
| GALR1 methylation | ||||||
| Yes (38) | 20 | 18 | 20 | 18 | ||
| No (62) | 29 | 33 | 0.681 | 14 | 48 | 0.004* |
| GALR2 methylation | ||||||
| Yes (33) | 19 | 14 | 15 | 18 | ||
| No (67) | 30 | 37 | 0.289 | 19 | 48 | 1 |
| DCC methylation | ||||||
| Yes (33) | 17 | 16 | 13 | 20 | ||
| No (67) | 32 | 35 | 0.832 | 21 | 46 | 1 |
| COL1A2 methylation | ||||||
| Yes (48) | 26 | 22 | 19 | 29 | ||
| No (52) | 23 | 29 | 0.423 | 15 | 37 | 0.295 |
| p16 methylation | ||||||
| Yes (52) | 32 | 20 | 19 | 33 | ||
| No (48) | 17 | 31 | 0.010* | 15 | 33 | 0.674 |
| RASSF1A methylation | ||||||
| Yes (20) | 10 | 11 | 6 | 15 | ||
| No (80) | 39 | 40 | 1 | 28 | 51 | 0.614 |
| E-cadherin methylation | ||||||
| Yes (40) | 25 | 15 | 15 | 25 | ||
| No (60) | 24 | 36 | 0.041* | 19 | 41 | 1 |
| H-cadherin methylation | ||||||
| Yes (43) | 26 | 17 | 16 | 27 | ||
| No (57) | 23 | 34 | 0.069 | 18 | 39 | 1 |
| MGMT methylation | ||||||
| Yes (24) | 12 | 12 | 10 | 14 | ||
| No (76) | 37 | 39 | 1 | 24 | 52 | 1 |
| DAPK methylation | ||||||
| Yes (32) | 19 | 13 | 14 | 18 | ||
| No (68) | 30 | 38 | 0.199 | 20 | 48 | 1 |
* P < 0.05
†Fisher’s exact probability test
Prognostic value of promoter methylation in head and neck primary tumors
Kaplan–Meier plots indicated that methylation of TAC1, TACR1, and other genes in patient tumors were related to the duration of DFS. Disease-free survival correlated with TAC1 methylation (log-rank test, P = 0.002), but not TACR1 methylation (log-rank test, P = 0.464) (Fig. 4a, b). Among patients with stage III and IV HNSCC, the 5-year disease-free survival rate in the group of patients with TAC1 methylation was 31.4 %, as compared with 56.9 % in the group with TAC1 unmethylation (log-rank test, P = 0.022) (Fig. 4c). Methylation of both TAC1 and TACR1 was associated with a DFS rate of 9.8 versus 54.9 % in the absence of methylation (log-rank test, P = 0.0013) (Fig. 4d). Methylation of both TAC1 and galanin was associated with a DFS rate of 0 versus 65.9 % in the absence of methylation (log-rank test, P = 3.33E − 07) (Fig. 4e). No significant difference was observed in the disease-free survival of patients with respect to the methylation patterns of the TACR1 and GALR1 genes (Fig. 4f). In the validation cohort, TAC1 methylation in tumors was associated with reduced DFS (log-rank test, P = 0.044) (Fig. 4f). Multivariate logistic-regression analysis showed the estimated odds of recurrence associated with methylation of TAC1, TACR1, and other genes. When TAC1 was methylated in the primary tumor, the adjusted odds ratio for recurrence was 3.35 (95 % confidence interval, 1.37–8.19; P = 0.008). Patients with TAC1 and TACR1 methylation had a significantly higher odds ratio for recurrence (OR = 5.09, 95 % CI, 1.44–18.02; P = 0.011). Patients with methylation of both TAC1 and galanin had a significantly higher odds ratio for recurrence of 17.89 (95 % CI, 2.21–144.72; P = 0.007) (Fig. 5).
Fig. 4.
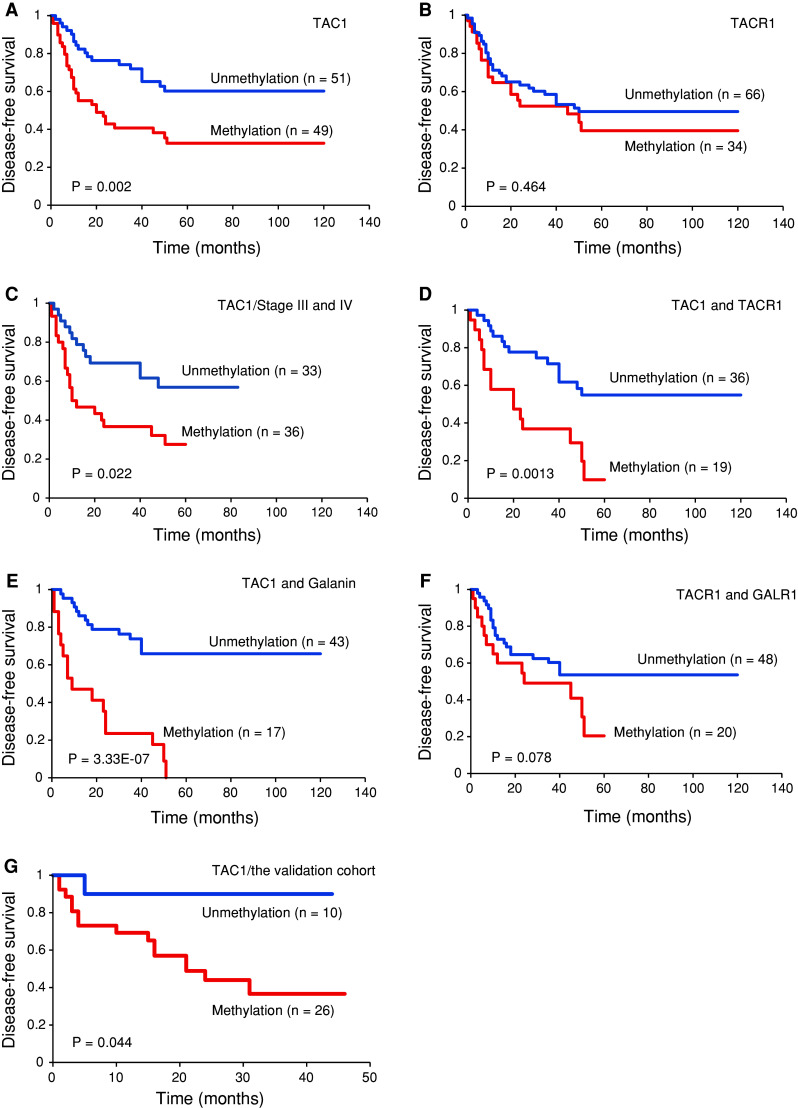
Kaplan–Meier survival curves for patients with HNSCC. Disease-free survival in the Original cohort by a TAC1 methylation status, b TACR1 methylation status, c TAC1 methylation status in 69 Stage III and IV cases, d TAC1 and TACR1 methylation status, e TAC1 and galanin methylation status, and f TACR1 and GALR1 methylation status. g Disease-free survival in the Validation cohort by TAC1 methylation status. Disease-free survival was more brief in patients with simultaneous methylation of TAC1 and TACR1 than in those with no simultaneous methylation (P = 0.0013, Log-rank test). Blue line, patients without methylation; red line, patients with methylation
Fig. 5.

Odds ratios for recurrence based on multivariate logistic-regression adjusted for stage (I, II, III vs. IV), age (65 years and older vs. <65 years), sex, alcohol intake, and smoking status. Multivariate logistic-regression analysis revealed the estimated odds of recurrence associated with methylation of TAC1, TACR1, and 10 other genes. Methylation of TAC1 and galanin in the primary tumor was associated with the most significant odds ratios of recurrence. *P < 0.05
Discussion
Recent advances in molecular biology have made it possible to apply new strategies, such as gene therapy and molecular targeted therapy for cancer treatment. However, in comparison with lesions such as breast, renal, and colorectal carcinoma, HNSCC treatments have lagged (Kanazawa et al. 2010). GPCRs belong to a superfamily of cell surface signaling proteins with a pivotal role in many physiological functions and multiple diseases, including cancer development and metastasis (Lappano and Maggiolini 2011). Several studies have suggested that neuropeptides functions are tumor suppressors and possess potent antitumor activity in human cancers. We recently defined the methylation profiles of galanin, GALR1, and GALR2 in HNSCC tumors at diagnosis and follow-up and evaluated the significance of methylation for prognosis and as biomarkers for risk of recurrence (Misawa et al. 2008; Kanazawa et al. 2009). Another study showed that somatostatin promoter hypermethylation is common in human esophageal adenocarcinoma and colon cancer (Jin et al. 2007; Mori et al. 2006). Hypermethylation of TAC1 is associated with poor prognosis in esophageal squamous cell carcinoma and breast cancer (Jin et al. 2007; Jeschke et al. 2012). These findings provide a foundation for further studies on the role of neuropeptide genes and their receptors in carcinogenesis and their potential utility as biomarkers for many types of tumors.
TAC1 expression was restored in HNSCC cell lines treated with 5-azacytidine and TSA (data not shown). These epigenetic drugs will likely become a crucial part of the therapeutic arsenal against cancer in the near future (Rodriguez-Paredes and Esteller 2011). Epigenetic therapy might be a novel strategy for HNSCC. The establishment of DNA methylation and histone-modification profiles of the primary tumor specimen might be valuable for determining prognosis and predicting therapeutic response.
We systematically investigated TAC1 and TACR1 promoter hypermethylation in primary HNSCC. To our knowledge, neither expression nor promoter hypermethylation of TAC1 and TACR1 in HNSCC has been reported previously. Our results show that TAC1 promoter hypermethylation occurs frequently in UM-SCC cell lines and primary tumors. The frequency of TAC1 hypermethylation was extremely low in normal cell lines and mucosal tissues. In a survey of 100 head and neck tumor tissue samples using Q-MSP, the hypermethylation of the TAC1 promoter occurred at a high frequency (49 %), consistent with previous results from other investigators who reported frequencies of 45–61 % for TAC1 methylation in other primary tumors (Jin et al. 2007) (David et al. 2009; Jeschke et al. 2012). The frequency of TACR1 promoter hypermethylation (34 %) is consistent with moderate frequency. A concurrent analysis showed that TAC1 and TACR1 were completely methylated in 19 (19.0 %) cases; methylation at either TAC1 or TACR1 was observed in another 45 (45.0 %) cases, and methylation at one or both TAC1 and TACR1 promoters was observed in 36 (36.0 %) cases. Hypermethylation of either TAC1 or TACR1 was also documented in a higher proportion (74.0 %) of cases than other tumor suppressor genes. Patients who had hypermethylation of both genes had a significantly shorter DFS than did patients without methylation of both genes. In multivariate logistic-regression analyses, methylation of the TAC1 gene was associated with significant odds ratios of recurrence. When TAC1 and TACR1 were methylated in the primary tumors, the adjusted odds ratio for recurrence was significantly higher than in tumors with no methylation of this pair of genes. A significant correlation has been observed between TAC1 promoter methylation and recurrence events in primary samples. Furthermore, TAC1 hypermethylation was significantly associated with shortened survival in Stage III and IV patients. Our findings suggest that methylation of TAC1 occurs in a subset of HNSCC and may be used as a prognostic marker.
Previously, we investigated the function and signal transduction of galanin receptors, which are representative GPCRs in HNSCC. These findings indicate that galanin and its receptors are likely to act as tumor suppressors in HNSCC (Misawa et al. 2008; Kanazawa et al. 2007) and also demonstrate that GALR signaling may be an independent prognostic factor in HNSCC (Kanazawa et al. 2009). As galanin and ligands of TACR1 have associated functions and are often simultaneously studied in neurological studies (Holmes et al. 2003; Xu et al. 2005; Barreto et al. 2010), they are expected to be closely related in HNSCC. Thus, we examined the differences in disease-free survival every TAC1 methylation status, TACR1 methylation status, TAC1 and TACR1 methylation status, TAC1 and galanin methylation status, and TACR1 and GALR1 methylation status. In particular, the combination of TAC1 and galanin appears promising, since simultaneous methylation of these genes is associated with a 17-fold increased risk of poor patient outcome. The significant association between aberrant TAC1 methylation and promoter hypermethylation of galanin supports the utility of TAC1 and galanin methylation as a molecular marker for early recurrence of head and neck cancers. The feasibility of clinically useful epigenetic markers in HNSCC is becoming clearer, not only through this study, but also a recently published study by Carvalho et al. (2011). Our findings support the translation of such methylation markers into clinical practice, although additional prospective studies are required to validate these genes in larger populations of HNSCC patients.
In conclusion, the TAC1 and TACR1 promoter methylation profile appears to be an important marker of the clinical outcome of HNSCC. This information can be used to identify patients who have high-risk HNSCC and may benefit from adjuvant therapy and cautious observation after primary tumor resection. Further analyses of the neuropeptide genes TAC1 and galanin will help define their biologic roles in head and neck carcinogenesis and their utility as biomarkers of early detection and prognostication.
Acknowledgments
The authors would like to thank Ms. Yuko Mohri for her excellent technical support. Authors received a Grant-in-Aid for Scientific Research (No. 23592524) from the Ministry of Education, Culture, Sports, Science, and Technology of Japan.
Conflict of interest
None.
References
- Barreto SG, Carati CJ, Schloithe AC, Toouli J, Saccone GT (2010) The combination of neurokinin-1 and galanin receptor antagonists ameliorates caerulein-induced acute pancreatitis in mice. Peptides 31(2):315–321. doi:10.1016/j.peptides.2009.11.014 [DOI] [PubMed] [Google Scholar]
- Bolden JE, Peart MJ, Johnstone RW (2006) Anticancer activities of histone deacetylase inhibitors. Nat Rev Drug Discov 5(9):769–784. doi:10.1038/nrd2133 [DOI] [PubMed] [Google Scholar]
- Brenner JC, Graham MP, Kumar B, Saunders LM, Kupfer R, Lyons RH, Bradford CR, Carey TE (2010) Genotyping of 73 UM-SCC head and neck squamous cell carcinoma cell lines. Head Neck 32(4):417–426. doi:10.1002/hed.21198 [DOI] [PMC free article] [PubMed] [Google Scholar]
- Carvalho AL, Henrique R, Jeronimo C, Nayak CS, Reddy AN, Hoque MO, Chang S, Brait M, Jiang WW, Kim MM, Claybourne Q, Goldenberg D, Khan Z, Khan T, Westra WH, Sidransky D, Koch W, Califano JA (2011) Detection of promoter hypermethylation in salivary rinses as a biomarker for head and neck squamous cell carcinoma surveillance. Clin Cancer Res 17(14):4782–4789. doi:10.1158/1078-0432.CCR-11-0324 [DOI] [PMC free article] [PubMed] [Google Scholar]
- David S, Kan T, Cheng Y, Agarwal R, Jin Z, Mori Y (2009) Aberrant silencing of the endocrine peptide gene tachykinin-1 in gastric cancer. Biochem Biophys Res Commun 378(3):605–609. doi:10.1016/j.bbrc.2008.11.078 [DOI] [PubMed] [Google Scholar]
- Esteller M (2008) Epigenetics in cancer. N Engl J Med 358(11):1148–1159. doi:10.1056/NEJMra072067 [DOI] [PubMed] [Google Scholar]
- Forastiere A, Koch W, Trotti A, Sidransky D (2001) Head and neck cancer. N Engl J Med 345(26):1890–1900. doi:10.1056/NEJMra001375 [DOI] [PubMed] [Google Scholar]
- Holmes A, Heilig M, Rupniak NM, Steckler T, Griebel G (2003) Neuropeptide systems as novel therapeutic targets for depression and anxiety disorders. Trends Pharmacol Sci 24(11):580–588. doi:10.1016/j.tips.2003.09.011 [DOI] [PubMed] [Google Scholar]
- Jaafari N, Hua G, Adelaide J, Jule Y, Imbert J (2008) Expression of the tachykinin receptor mRNAs in healthy human colon. Eur J Pharmacol 599(1–3):121–125. doi:10.1016/j.ejphar.2008.09.024 [DOI] [PubMed] [Google Scholar]
- Jeschke J, Van Neste L, Glockner SC, Dhir M, Calmon MF, Deregowski V, Van Criekinge W, Vlassenbroeck I, Koch A, Chan TA, Cope L, Hooker CM, Schuebel KE, Gabrielson E, Winterpacht A, Baylin SB, Herman JG, Ahuja N (2012) Biomarkers for detection and prognosis of breast cancer identified by a functional hypermethylome screen. Epigenetics 7(7):701–709. doi:10.4161/epi.20445 [DOI] [PubMed] [Google Scholar]
- Jin Z, Olaru A, Yang J, Sato F, Cheng Y, Kan T, Mori Y, Mantzur C, Paun B, Hamilton JP, Ito T, Wang S, David S, Agarwal R, Beer DG, Abraham JM, Meltzer SJ (2007) Hypermethylation of tachykinin-1 is a potential biomarker in human esophageal cancer. Clin Cancer Res 13(21):6293–6300. doi:10.1158/1078-0432.CCR-07-0818 [DOI] [PubMed] [Google Scholar]
- Jin Z, Cheng Y, Olaru A, Kan T, Yang J, Paun B, Ito T, Hamilton JP, David S, Agarwal R, Selaru FM, Sato F, Abraham JM, Beer DG, Mori Y, Shimada Y, Meltzer SJ (2008) Promoter hypermethylation of CDH13 is a common, early event in human esophageal adenocarcinogenesis and correlates with clinical risk factors. Int J Cancer 123(10):2331–2336. doi:10.1002/ijc.23804 [DOI] [PubMed] [Google Scholar]
- Kanazawa T, Iwashita T, Kommareddi P, Nair T, Misawa K, Misawa Y, Ueda Y, Tono T, Carey TE (2007) Galanin and galanin receptor type 1 suppress proliferation in squamous carcinoma cells: activation of the extracellular signal regulated kinase pathway and induction of cyclin-dependent kinase inhibitors. Oncogene 26(39):5762–5771. doi:10.1038/sj.onc.1210384 [DOI] [PubMed] [Google Scholar]
- Kanazawa T, Kommareddi PK, Iwashita T, Kumar B, Misawa K, Misawa Y, Jang I, Nair TS, Iino Y, Carey TE (2009) Galanin receptor subtype 2 suppresses cell proliferation and induces apoptosis in p53 mutant head and neck cancer cells. Clin Cancer Res 15(7):2222–2230. doi:10.1158/1078-0432.CCR-08-2443 [DOI] [PMC free article] [PubMed] [Google Scholar]
- Kanazawa T, Misawa K, Carey TE (2010) Galanin receptor subtypes 1 and 2 as therapeutic targets in head and neck squamous cell carcinoma. Expert Opin Ther Targets 14(3):289–302. doi:10.1517/14728221003598922 [DOI] [PubMed] [Google Scholar]
- Katz MH (2011) Multivariable analysis: a practical guide for clinicians and public health researchers. Setting up a multivariable analysis. Cambridge University Press, Cambridge [Google Scholar]
- Koon HW, Zhao D, Na X, Moyer MP, Pothoulakis C (2004) Metalloproteinases and transforming growth factor-alpha mediate substance P-induced mitogen-activated protein kinase activation and proliferation in human colonocytes. J Biol Chem 279(44):45519–45527. doi:10.1074/jbc.M408523200 [DOI] [PubMed] [Google Scholar]
- Kumar B, Cordell KG, Lee JS, Worden FP, Prince ME, Tran HH, Wolf GT, Urba SG, Chepeha DB, Teknos TN, Eisbruch A, Tsien CI, Taylor JM, D’Silva NJ, Yang K, Kurnit DM, Bauer JA, Bradford CR, Carey TE (2008) EGFR, p16, HPV Titer, Bcl-xL and p53, sex, and smoking as indicators of response to therapy and survival in oropharyngeal cancer. J Clin Oncol 26(19):3128–3137. doi:10.1200/JCO.2007.12.7662 [DOI] [PMC free article] [PubMed] [Google Scholar]
- Kuroki T, Trapasso F, Yendamuri S, Matsuyama A, Alder H, Mori M, Croce CM (2003) Allele loss and promoter hypermethylation of VHL, RAR-beta, RASSF1A, and FHIT tumor suppressor genes on chromosome 3p in esophageal squamous cell carcinoma. Cancer Res 63(13):3724–3728 [PubMed] [Google Scholar]
- Lappano R, Maggiolini M (2011) G protein-coupled receptors: novel targets for drug discovery in cancer. Nat Rev Drug Discov 10(1):47–60. doi:10.1038/nrd3320 [DOI] [PubMed] [Google Scholar]
- Lieb K, Fiebich BL, Berger M, Bauer J, Schulze-Osthoff K (1997) The neuropeptide substance P activates transcription factor NF-kappa B and kappa B-dependent gene expression in human astrocytoma cells. J Immunol 159(10):4952–4958 [PubMed] [Google Scholar]
- Misawa K, Ueda Y, Kanazawa T, Misawa Y, Jang I, Brenner JC, Ogawa T, Takebayashi S, Grenman RA, Herman JG, Mineta H, Carey TE (2008) Epigenetic inactivation of galanin receptor 1 in head and neck cancer. Clin Cancer Res 14(23):7604–7613. doi:10.1158/1078-0432.CCR-07-4673 [DOI] [PMC free article] [PubMed] [Google Scholar]
- Misawa K, Kanazawa T, Misawa Y, Imai A, Endo S, Hakamada K, Mineta H (2011) Hypermethylation of collagen alpha2 (I) gene (COL1A2) is an independent predictor of survival in head and neck cancer. Cancer Biomarkers Sect A Disease Markers 10(3–4):135–144. doi:10.3233/CBM-2012-0242 [DOI] [PubMed] [Google Scholar]
- Mori Y, Cai K, Cheng Y, Wang S, Paun B, Hamilton JP, Jin Z, Sato F, Berki AT, Kan T, Ito T, Mantzur C, Abraham JM, Meltzer SJ (2006) A genome-wide search identifies epigenetic silencing of somatostatin, tachykinin-1, and 5 other genes in colon cancer. Gastroenterology 131(3):797–808. doi:10.1053/j.gastro.2006.06.006 [DOI] [PubMed] [Google Scholar]
- Ovchinnikov DA, Cooper MA, Pandit P, Coman WB, Cooper-White JJ, Keith P, Wolvetang EJ, Slowey PD, Punyadeera C (2012) Tumor-suppressor gene promoter hypermethylation in Saliva of head and neck cancer patients. Transl Oncol 5(5):321–326 [DOI] [PMC free article] [PubMed] [Google Scholar]
- Park HL, Kim MS, Yamashita K, Westra W, Carvalho AL, Lee J, Jiang WW, Baek JH, Liu J, Osada M, Moon CS, Califano JA, Mori M, Sidransky D (2008) DCC promoter hypermethylation in esophageal squamous cell carcinoma. Int J Cancer 122(11):2498–2502. doi:10.1002/ijc.23434 [DOI] [PubMed] [Google Scholar]
- Park CK, Kim JE, Kim JY, Song SW, Kim JW, Choi SH, Kim TM, Lee SH, Kim IH, Park SH (2012) The changes in MGMT promoter methylation status in initial and recurrent glioblastomas. Transl Oncol 5(5):393–397 [DOI] [PMC free article] [PubMed] [Google Scholar]
- Pennefather JN, Lecci A, Candenas ML, Patak E, Pinto FM, Maggi CA (2004) Tachykinins and tachykinin receptors: a growing family. Life Sci 74(12):1445–1463 [DOI] [PubMed] [Google Scholar]
- Pinto FM, Almeida TA, Hernandez M, Devillier P, Advenier C, Candenas ML (2004) mRNA expression of tachykinins and tachykinin receptors in different human tissues. Eur J Pharmacol 494(2–3):233–239. doi:10.1016/j.ejphar.2004.05.016 [DOI] [PubMed] [Google Scholar]
- Rameshwar P, Gascon P (1996) Induction of negative hematopoietic regulators by neurokinin-A in bone marrow stroma. Blood 88(1):98–106 [PubMed] [Google Scholar]
- Rodriguez-Paredes M, Esteller M (2011) Cancer epigenetics reaches mainstream oncology. Nat Med 17(3):330–339. doi:10.1038/nm.2305 [DOI] [PubMed] [Google Scholar]
- Rosso M, Munoz M, Berger M (2012) The role of neurokinin-1 receptor in the microenvironment of inflammation and cancer. Sci World J 2012:381434. doi:10.1100/2012/381434 [DOI] [PMC free article] [PubMed] [Google Scholar]
- Severini C, Improta G, Falconieri-Erspamer G, Salvadori S, Erspamer V (2002) The tachykinin peptide family. Pharmacol Rev 54(2):285–322 [DOI] [PubMed] [Google Scholar]
- Van Dyke DL, Worsham MJ, Benninger MS, Krause CJ, Baker SR, Wolf GT, Drumheller T, Tilley BC, Carey TE (1994) Recurrent cytogenetic abnormalities in squamous cell carcinomas of the head and neck region. Genes Chromosom Cancer 9(3):192–206 [DOI] [PubMed] [Google Scholar]
- Vokes EE, Weichselbaum RR, Lippman SM, Hong WK (1993) Head and neck cancer. N Engl J Med 328(3):184–194. doi:10.1056/NEJM199301213280306 [DOI] [PubMed] [Google Scholar]
- Xu C, Yaici ED, Conrath M, Blanchard P, Leclerc P, Benoit G, Verge D, Giuliano F (2005) Galanin and neurokinin-1 receptor immunoreactive [corrected] spinal neurons controlling the prostate and the bulbospongiosus muscle identified by transsynaptic labeling in the rat. Neuroscience 134(4):1325–1341. doi:10.1016/j.neuroscience.2005.06.002 [DOI] [PubMed] [Google Scholar]