

Summary
Natural killer cells are innate immune effectors that kill virally infected or malignant cells. Natural killer cell deficiency (NKD) occurs when NK cell development or function are impaired and variants in MCM4, GINS1, MCM10 and GINS4 result in NKD. While NK cells are strongly impacted by mutational deficiencies in helicase proteins, the mechanisms underlying this specific susceptibility are poorly understood. Here, we induced replication stress in activated NK cells or T cells by chemical and genetic methods. We found that the CD56bright subset of NK cells accumulates more DNA damage and replication stress during activation than CD56dim NK cells or T cells. Aphidicolin treatment increases apoptosis of CD56bright NK cells through increased pan-caspase expression and decreases perforin expression in surviving cells. These findings show that sensitivity to replication stress affects NK cell survival and function and contributes to NKD.
Keywords: replication stress, NK cells, cytotoxicity, DNA damage, CMG helicase
Introduction
Human peripheral blood NK cells are present in two subsets; mature CD56dim NK cells, which make up the majority of circulating NK cells and have greater baseline cytotoxic function, and the less mature CD56bright subset (1, 2). Despite their lack of germline-encoded antigen specific receptors, NK cells can also have features of immune memory (3–6). Adaptive NK cells can be modeled in vitro using cytokines to generate cytokine induced memory-like (CIML) NK cells following stimulation with IL-15, IL-18, and IL-12 (7–9). CIML NK cells proliferate and upregulate cytotoxic responses upon stimulation (7, 10, 11). In vivo, these activated NK cells exhibit heightened responses against infections and cancerous target cells and can serve as a useful model of primary NK cell activation during viral infection (8, 10, 12). Thus, while there are many ways by which NK cells can be activated, here we chose to study CIML activation of NK cells due to its clinical relevance and well-defined role in promoting NK cell proliferation.
The absence of NK cells or dysregulation of NK cell maturation leads to natural killer cell deficiency (NKD) (13, 14). Though rare, partial loss-of-function variants in MCM4, GINS1, MCM10, and GINS4 lead to immunodeficiency marked by severe and recurrent viral infections and impaired NK cell maturation and function (15–19). These genes encode components of the CDC45-MCM-GINS (CMG) helicase complex, which is required for DNA replication in S phase by unwinding DNA and recruiting polymerases. The helicase plays an important role in maintaining genomic stability, thus it is important to note that loss of CMG helicase protein function leads to replication stress (20–26). Replication stress occurs when a replication fork is stalled or traveling too slow for proper function, which can occur due to various endogenous sources (27). Replication stress can lead to DNA double strand breaks and fork collapse, triggering downstream DNA damage signaling, including the generation of γH2AX foci (28). Cell fate decisions after replication stress often include signaling through p53 to result in cell cycle arrest, DNA damage repair, or caspase-activated apoptosis (29).
Individuals with NKD due to partial loss-of-function of helicase proteins have increased replication stress and DNA damage in multiple cell types, with the downstream cellular responses of apoptosis and cell cycle arrest (15, 16, 18, 30). However, the mechanism behind the accumulating evidence that NK cells are more sensitive than other proliferating lymphocytes, including T cells, is poorly understood (15–18, 30, 31). While helicase deficiencies affect NK cell development, the ubiquitous expression of helicase proteins and the presence of mature NK cells, albeit at reduced numbers, in NKD patients led us to predict that partial loss-of-function variants can also affect mature NK cell function (15, 17, 18, 30). Here, we demonstrate that mature NK cell subsets are more sensitive to replication stress than T cells during activation and that the CD56bright NK cell subset is more sensitive to replication stress than CD56dim NK cells. CD56bright cells undergo caspase-mediated apoptosis in response to replication stress induced by knockdown of MCM10 or treatment with a low dose of the replication inhibitor aphidicolin. The survival of T cells in response to activation and replication stress remains relatively unaffected despite undergoing similar changes in replication fork speeds in response to aphidicolin treatment. We additionally found that cytotoxic protein expression decreases with increasing replication stress, which provides a link between replicative stress and NK cell function. Together, these results reveal insight into the mechanisms of NK cell deficiency produced by helicase deficiencies and replication stress and uncover novel aspects of NK cell biology and function.
Methods
Cell isolation and cell lines
Blood from healthy donors was collected under the guidance of the IRB at Columbia University in accordance with Declaration of Helsinki guidelines. PBMCs were isolated by density gradient centrifugation and frozen then thawed for each experiment and maintained in complete medium with human serum (GeminiBio, Cat# 100-512). YTS cell lines were maintained with the same media as PBMCs, except with 10% FBS (Atlanta Biologicals, Cat# S11150) instead of human serum. K562 cells were maintained in complete medium.
NK cell and T cell stimulation
To generate activated NK cells, cytokines were added to the media (IL-15 100 ng/mL [Peprotech, Cat# 200-15], IL-18 50 ng/mL [R&D Systems, Cat# 9124-IL-010/CF], IL-12 10 ng/mL [Miltenyi Bio, Cat# 130-096-705F]) for overnight stimulation. PBMCs were then washed three times and resuspended with fresh media and low dose IL-2 (20 U/mL [Thermo, Cat# 200-02]) for expansion phase in a round-bottom plate. Aphidicolin (0.25 μM, 0.5 μM, 1 μM, or 5 μM) (Sigma, Cat# A4487-1mL) or Etoposide (10 μM, 50 μM, or 100 μM) (Sigma, Cat# E1383-25MG) was also added at this time. To generate activated T cells from PBMCs, fresh media was supplemented with 30 U/mL of IL-2 and a 1:1 ratio of anti-CD3 and -CD28 Dynabeads (Thermo Fisher, Cat# 11131D). Cells were harvested one or three days after aphidicolin and used for flow cytometry with surface markers to identify NK and T subsets or enriched using negative isolation kits (EasySep Human NK Cell Isolation Kit [StemCell,Cat# 17955] and EasySep Human T Cell Isolation Kit [StemCell, Cat# 17951]) following manufacturer’s instructions. Briefly, an antibody cocktail binds unwanted cells and is complexed with magnetic beads. After a short incubation period, a magnet separates the magnetically-labeled cells and the cells of interest remain untouched in the supernatant. Cells were then counted and resuspended in an appropriate volume of fresh media.
Flow cytometry
Cells were washed in PBS then surface stained with fluorochrome-conjugated antibodies and viability dye. Cells were washed again then fixed and permeabilized for intracellular staining using the FoxP3 nuclear staining kit (Thermo, Cat# 00-5523-00). Fluorescence minus one and unstained controls were included for all experiments. To measure IFN-γ, 10 μg/mL Brefeldin A (Biolegend, Cat# 420601) was added during stimulation to inhibit protein transport. Data were acquired on a BD Fortessa and analyzed with FlowJo v.10.9.0 (BD Biosciences). Cell cycle analyses were conducted with the BrdU assay kit from BD Biosciences according to manufacturer’s instructions.
Confocal microscopy
Cells were adhered to #1.5 imaging chambers followed by fixation and permeabilization using Cytofix/Cytoperm (BD Biosciences, Cat# 554714). Immunostaining with phospho-RPA (Thermo Cat# MA5-17166) was followed by goat anti-rabbit Alexa Fluor 488 (Thermo, Cat# 32731), then γH2AX Alexa Fluor 647 (BD Biosciences, Cat# 560447), and DAPI. Images were acquired with a 100X 1.46 NA objective on a Zeiss AxioObserver Z1 microscope stand equipped with a Yokogawa W1 spinning disk by imaging cell volumes with a 0.17 um Z step size. Illumination was by 405nm, 488nm, and 647nm solid state lasers and detection was by a Prime 95B sCMOS camera. Data were acquired in SlideBook software (Version 6, Intelligent Imaging Innovations) and exported as OME-TIFF files for further analysis. Images were analyzed as Z projections in Fiji (32) using the “Analyze Particles” plug-in with a minimum size of 0.05 μm2. Data were exported to Prism 9 (GraphPad Software).
shRNA lentiviral transduction
YTS cells were washed with sterile PBS and resuspended in 400 μL fresh complete media with 100 μL TransDux MAX Lentivirus Transduction Reagent (SystemBio, Cat# LV860A-1). Viral supernatant for non-targeting (Horizon Discovery, Cat# S02-005000-01) and MCM10 (Horizon Discovery, Cat# V3SH7669) were added and the plate was spun at 1500g for 90 minutes at 35°C. Antibiotic resistance selection with puromycin began 72 hours after transduction starting at 0.5 μg/mL and gradually increasing to 2 μg/mL over two weeks. Cells were GFP+ sorted after 2 μg/mL puromycin (Thermo, Cat# A1113803) selection.
DNA fiber analysis
DNA fiber analysis was carried out as previously described (33). Briefly, cells were incubated with 25 μM IdU for 30min, washed three times with warm PBS and incubated with 25 μM CIdU for another 30min. Fibers were stretched on slides and stained with CldU (Biorad, Cat# OBT0030), and IdU (BD Biosciences, Cat# 347580) antibodies. Slides were mounted with ProLong Gold Antifade mounting medium and dried. The fiber tracks were imaged on a Nikon Eclipse 90i microscope with a PL Apo 40X/0.95 NA objective and measured using ImageJ.
Proteomics analysis
NK cells and T cells were negatively enriched from 3 healthy donors using negative isolation by dividing the media-suspended PBMCs and allocating a larger proportion to NK cell isolation. Cells were then stimulated as described above and harvested after three days. Following isolation, cells were washed twice with cold PBS and samples were flash frozen using liquid nitrogen. Frozen cells were lysed by bead-beating in Urea lysis buffer containing 8 M urea, 100 mM Ammonium bicarbonate, and a protease inhibitor. The samples were reduced with 5 mM DTT and alkylated with 10 mM iodoacetamide (IAA), which was quenched with 10 mM DTT. A total of 20 μg of protein was chloroform-methanol precipitated. The resulting protein pellets were reconstituted in 100 mM ammonium bicarbonate (pH 8.5), and the protein concentration was determined using a BCA assay (Pierce). Next, 10 μg of total proteins from each sample were digested overnight with Lys-C/trypsin mix protease at a 100:1 protein-to-protease ratio while shaking at 37 °C. Peptides were acidified by adding 1% TFA, vortexed, and subjected to StageTip clean-up via SDB-RPS2 (34). The peptides were then resuspended in 10 µL of 3% acetonitrile/0.1% formic acid and injected onto a Thermo Scientific™ Orbitrap Fusion™ Tribrid™ mass spectrometer using the DIA method for label-free peptide MS/MS analysis (35). Data was analyzed using Microsoft Excel with the given LFQ intensity values to calculate the log2fold change. Graphs were made with Prism 10.0.0 (GraphPad).
NK cell cytotoxicity assays
Cytotoxicity of negatively enriched activated NK cells from PBMCs from 10 healthy donors against K562 cells was performed by four-hour Cr51 release assay as previously described (36).
Western blotting
106 cells were lysed in RIPA buffer (Thermo, Cat# 89900) with 1X Halt Protease/Phosphatase Inhibitor (Thermo, Cat# 78443) immediately after isolation for resting cells or after being activated for six days. Cell lysates were separated by gel electrophoresis using a 4%– 12% gradient gel or 12% gel (Thermo, Cat# NW04120BOX or NW00127BOX, respectively) and then transferred to a 0.2 μm pore-size nitrocellulose membrane (Thermo, Cat# LC2000). The membranes were blocked using 10% nonfat dry milk solution (Fisher Scientific, Cat# 50-488-786) in PBS-Tween 0.1%, then incubated with primary antibodies ([anti-Sld5 (Abcam, catalogue no. ab101346), anti-Cdc45 (Cell Signaling, catalogue no. 11881), actin (Sigma, catalogue no. A5441)] then secondary Abs to mouse or rabbit (Licor, catalogue no. 926-68070 or 926-32211, respectively) in a 5% BSA solution. Membranes were imaged on the LiCOR CxL and analyzed using the ImageStudioLite software (version 5.2.5).
Statistics
Statistical analyses were conducted using Prism 10.0.0 (GraphPad). All data show mean ± SEM. The group size for each experimental group is stated in each figure legend. One-sample 2-tailed Student’s t test was used to compare means of experimental conditions to normalized controls. One-way ANOVA with multiple comparisons was used to compare multiple conditions and two-way ANOVA was used to compare multiple groups with multiple conditions. Values were statistically non-significant when P>0.05. P values on graphs are represented as: *P ≤ 0.05, **P ≤ 0.01, ***P ≤ 0.001, ****P ≤ 0.0001.
Data sharing statement
Original datasets and protocols will be available for analysis upon request. Proteomics data is available through the ProteomeXchange (https://www.proteomexchange.org/).
Results
NK cell activation induces cell cycle dependent DNA damage
Activated NK cells were generated by overnight priming of healthy donor PBMCs with IL-15, IL-12, and IL-18 (CIML) followed by low dose IL-2 for one to three days or low dose IL-2 or IL-15 as a negative control (Fig. 1A) (8–10). As previously described, CIML stimulation of PBMCs led to NK cell proliferation and subsequent enrichment of NK cells within the PBMC population (Supp Fig 1A) (7, 10). When we gated on NK cells, CIML NK cells had a significantly increased frequency of cells found in S phase after four days stimulation relative no prime control (low dose IL-2 only) (Fig. 1B) and IL-15 only (Supp Fig 1B). Consistent with increased progression to S phase, we also confirmed that cell proliferation was increased in this CIML NK cell population when measured by CF-SE (Fig. 1C), and to a lesser degree in IL-15 stimulated cells (Supp Fig 1C).
Figure 1. NK cell activation leads to cell proliferation, cell cycle progression, and DNA damage.

A) Schematic of the PBMC stimulation protocol for negative control conditions (top), CIML NK cell activation (middle), and T cell activation (bottom). Negative controls received no stimulation for T cell experiments in Figures 1E–F, 20 U/mL IL-2 for NK cell experiments for Figures 1B–D. CIML activated NK cells received IL-15, IL-12, and IL-18 overnight stimulation followed by low-dose IL-2 for 1–3 days in the presence or absence of aphidicolin. T cells received 30 U/mL IL-2 stimulation with anti-CD3 and anti-CD28 beads for 1–3 days in the presence or absence of aphidicolin. (B) Percentage of CD56+CD3− NK cells found in S phase by flow cytometric cell cycle analysis of BrdU and 7-AAD staining following activation with CIML cytokines. n=4 healthy donors for no prime control and CIML conditions, representative plot shown on right. (C) Percentage of proliferated NK cells based on CFSE staining by flow cytometry following activation with CIML cytokines. n= 8 (no prime) and 9 (CIML) healthy donors; representative plot shown on right. (D) Mean fluorescence intensity of γH2AX of CD56+CD3− NK cells measured by flow cytometry. γH2AX MFI was gated based on CD56+CD3− NK cells. n=4 healthy donors for CIML and no prime conditions, representative plot shown on right. Unpaired Student’s T test was performed on data in Fig. 1B–D. (E) Percentage of CD3+ T cells which have diluted CFSE dye in response to no stimulation, CIML activation, or T cell stimulation. n=4 healthy donors. One-way ANOVA with multiple comparisons was performed. (F) γH2AX analysis by flow cytometry in CD3+ T cells activated with CIML cytokines or T cell stimulation. n=4 healthy donors compared by unpaired Student’s T test. Representative plots are shown on the right. Cells are gated based on unstained controls. Data shown are mean±SEM for all plots.
To determine the effect of NK cell activation on DNA damage, we measured γH2AX by flow cytometry following activation by CIML cytokines. CIML stimulated NK cells had higher mean fluorescent intensity of γH2AX compared to no prime controls (Fig. 1D). To determine whether induction of DNA damage observed in cytokine primed NK cells is a conserved response amongst lymphocytes after activation, we compared activated NK cells with CD3+ T cells stimulated with anti-CD3/-CD28 magnetic beads and IL-2 (T stim). CD4+ and CD8+ T cells consistently increased expression of activation markers CD69 and CD25 (37, 38) after three days of continuous T cell specific stimulation, whereas CIML cytokines did not have the same effect (Supp Fig 1D). We confirmed using CF-SE staining that the proliferation of activated T cells was increased compared to no stimulation controls or CIML stimulation (Fig. 1E). Despite their robust activation and proliferation, activated T cells had only moderate increases in DNA damage measured by γH2AX when normalized to an unstimulated control or compared to mild activation with CIML cytokines (Fig. 1F). In summary, stimulation of NK and T cells robustly induces proliferation in both populations to a similar extent when measured by CF-SE, however activation leads to a greater frequency of NK cells with DNA damage measured by γH2AX.
Aphidicolin treatment impairs replication fork progression in NK cells and T cells
We sought to use mild replication stress to model the effect of helicase deficiencies on NK cells and T cells following their activation. At low doses (0.25 μM and 0.5 μM), aphidicolin induces replication stress, while higher doses like 1 μM and 5 μM result in cell cycle arrest (39, 40). Following CIML cytokine priming overnight, NK cells were cultured with low dose IL-2 in the presence or absence of 0.25 μM aphidicolin. In parallel, we performed T stimulation followed by aphidicolin treatment for the same length of time as NK cells. Activation of NK cells without aphidicolin did not induce cell death as detected by 7-aminoactinomycin D staining in the CD56bright subset, but CD56dim cells exhibited increased cell death in response to activation (Fig. 2A). Further, low dose replication stress during activation increased the frequency of 7-AAD+ CD56bright NK cells (Fig. 2A). In contrast, T cell activation did not increase the frequency of 7-AAD+ T cells relative to control or with the addition of aphidicolin (Fig. 2A). We sought to determine whether the differential response we observed between activated T and NK cells was due to differences in the effect of aphidicolin on replication fork speed. In a DNA fiber assay, replication fork speed in the absence of aphidicolin was not significantly different between NK cells and T cells. Notably, two hours of aphidicolin treatment with activation similarly decreased fork speeds in NK and T cells (Fig. 2B), suggesting that the differences in response to aphidicolin were not due to baseline differences in fork speed and there are no differential effects of aphidicolin on fork progression.
Figure 2. Aphidicolin treatment impairs replication fork progression in NK cells and T cells.

A) Percent 7-Aminoactinomycin D (7-AAD) positive cells following low dose IL-2, CIML activation (NK cells), or T cell activation with or without aphidicolin treatment. Two-way ANOVA analysis was performed with multiple comparisons. n=4 biological replicates. (B) Fork speed (kilobases per minute) of DNA replication from enriched stimulated NK cells or T cells from a DNA fiber analysis assay. Cells were incubated for two hours with 0.25 μM aphidicolin following overnight cytokine stimulation for enriched NK cells or continuous anti-CD3 -CD28 beads with 30 U/mL IL-2 for T cells. Cells from n=2 healthy donors were pooled to make the DNA fiber slides. n=34 fibers NK 0μM Aph, n=36 fibers NK 0.25μM, n=52 fibers T 0μM, n=52 fibers T 0.25μM. One-way ANOVA with multiple comparisons was performed. (C) Percentage of γH2AX+ cells in NK and T cell subsets with or without low dose aphidicolin following activation with low dose IL-2 or CIML activation (NK cells) or T cell activation. n=4 biological replicates. (D) Percentage of BrdU+ cells without DNase treatment (exposed ssDNA) measured by flow cytometry. n=4 biological replicates. Two-way ANOVA analysis with multiple comparisons was performed for Fig. 2C, D. (E) Example flow plots with BrdU+ gating strategy based on BrdU fluorescence minus one (FMO) control with DNA content on the X-axis. (F) pRPA (Thr21) positive cells in NK and T cell subsets with or without low dose aphidicolin following activation with low dose IL-2 or CIML activation (NK cells) or T cell activation. Cells are gated based on fluorescence minus one (FMO) or no stain controls. Two-way ANOVA analysis with multiple comparisons was conducted, n=4 biological replicates. (G) Representative confocal microscopy images from CIML activated NK cells (top) and activated T cells (bottom). (H) Quantification of γH2AX or pRPA (Thr21) foci. Unpaired Student’s T test was conducted for statistical significance. Data shown are pooled from two healthy donors. n= 75 activated NK cells and n= 77 activated T cells with γH2AX foci. n= 76 activated NK cells and n= 80 activated T cells with pRPA foci. Data are shown as mean±SEM.
We predicted that the addition of aphidicolin would further increase the presence of γH2AX foci induced by activation of NK cells. As CD56bright and CD56dim NK cells have differential proliferative responses to activation (41), we measured these subsets and CD4+ and CD8+ T cell subsets independently. γH2AX intensity was significantly increased in the CD56bright subset in response to aphidicolin (Fig. 2C). The CD56dim population had increased DNA damage in response to activation but did not further accumulate damage with the addition of replication stress (Fig. 2C). Similarly, both CD4+ and CD8+ T cell populations accumulated low amounts of DNA damage with stimulation and maintained this low level even with replication stress (Fig. 2C). These data suggest that CD56bright NK cells are specifically sensitive to replication stress.
Exposed single stranded DNA (ssDNA) is present during homology directed repair and in the process of proliferation and replication activities, and so is an indicator of replication stress (42). The replication protein A (RPA) binding stabilizes ssDNA and facilitates downstream DNA damage repair activities (43). To measure ssDNA, we performed flow cytometry BrdU assays in the absence of the DNA denaturing step. In CD56bright NK cells, we found an increase in exposed ssDNA in response to activation (Fig. 2D, E). The addition of aphidicolin decreased the percentage of BrdU positive cells, likely due to decreased cell cycle progression (Fig. 2D, E). CD56dim cells also increased ssDNA in response to activation, though not to the same degree as the CD56bright subset. Both subsets of T cells maintained low levels of ssDNA that were independent of activation or replication stress (Fig. 2D, E). We found a trend similar to γH2AX distribution when we analyzed phosphorylated RPA (phospho-RPA Thr21) by flow cytometry and found that the CD56bright NK cell subset had increased phospho-RPA (Thr21) following treatment with aphidicolin (Fig. 2F). In contrast, the CD56dim subset and T cell subsets maintained low levels of phospho-RPA regardless of activation or replication stress (Fig 2F). Confocal microscopy showed a greater number of γH2AX and phospho-RPA (Thr21) foci in activated NK cells than T cells (Fig. 2G) and this observation was supported by quantification (Fig. 2H). We further tested the drug etoposide, which inhibits synthesis phase by binding to topoisomerase II and DNA (44), and found similar effects on CD56bright and CD56dim when we measured NK cell survival and DNA damage accumulation (Supp Fig 2A–B). These data indicate that the CD56bright subset is affected by mild replication stress while undergoing activation to a greater extent than CD56dim NK cells or T cell subsets. Further, despite equivalent replication fork speeds and response to aphidicolin, NK cells and T cells respond differently to mild replication stress.
Replication stress leads to apoptosis of activated NK cells
Next, we sought to further investigate the mechanisms of increased NK cell death in response to activation and replication stress. We investigated phospho-P53 (pP53, Ser15) and p21, which is a downstream target of pP53, by flow cytometry for NK and T cell subsets. All experiments in Fig 3 were incubated with low dose IL-2 with or without aphidicolin for one day as NK cells were sensitive to apoptosis. This earlier timepoint allowed for clearer analysis of the apoptotic pathway, whereas all other experiments were incubated for three days. CD56bright NK cells had highest expression of pP53 following activation, with or without replication stress caused by aphidicolin (Fig. 3A) or etoposide (Supp Fig 2C). However, T cells maintained low levels of pP53 and these were not affected by low-dose aphidicolin treatment, and neither T cells nor NK cells had significant pP53 expression in response to low dose IL-2 treatment (Fig. 3A). Analysis of p21 mean fluorescent intensity (MFI) displayed a similar trend (Supp. Fig 3A). Next, we measured pan-caspase expression by flow cytometry to determine signaling pathways resulting in apoptosis. NK cells had a trend of greater caspase expression with increasing replication stress, whereas T cells maintained a low level of caspase expression even in the presence of aphidicolin and both cell types had low caspase expression in low dose IL-2 conditions (Fig. 3B). We confirmed apoptosis with MitoNIR staining, which decreases in intensity with loss of mitochondrial membrane potential, indicating cell death (45). Moderate increases in the percentage of MitoNIRlow cells following replication stress were observed for CD56bright and CD56dim populations, with both NK cell populations having higher frequencies of MitoNIRlow cells than either T cell subset (Supp Fig 3B).
Figure 3. Replication stress leads to apoptosis of activated NK cells.

A) Percent pP53 (Ser15) positive cells in NK and T cell subsets with or without low dose aphidicolin following activation with low dose IL-2 or CIML activation (NK cells) or T cell activation. n=4 biological replicates. (B) Fluorescence intensity of pan-caspase dye was measured for CD56+ NK cells and CD3+ T cells. n=4 biological replicates. (C) Proteomic analysis of the log2(LFQ intensity) of selected pro-apoptotic proteins from isolated NK cell and T cells. n=3 biological replicates. (D) and (E) Flow cytometry of pro-apoptotic markers was conducted on n=3 healthy donors. (F) Percent Autophagy Red positive cells were calculated for each NK and T cell subset. n=4 healthy donors. Two-way ANOVA with multiple comparisons was performed for Fig. 3A–C, E, F. Experiments for Fig. 3 were incubated with aphidicolin for only 1 day. All other figures include data that were incubated for three days.
We conducted proteomics analysis of activated and enriched NK and T cells and found variable differences in pro-apoptotic proteins levels (Fig. 3C). Notably, NK cells upregulated CASP7 and CASP3 compared to T cells, however, several proteins were not detected in activated NK cells, such as TOP2A, XIAP, FADD, and DFFA (Fig. 3C). To complement the proteomics analysis, we investigated anti-and pro-apoptotic proteins by flow cytometry in activated NK cells with and without replication stress, including Bcl-XL (Fig. 3D) and BIM (Fig. 3E). Here, we find that both subsets of NK cells had increased protein expression with CIML activation relative to controls. Thus, NK cell activation, and not just the addition of replication stress, can induce the upregulation of both anti- and pro-apoptotic factors, yet the net effect is increased apoptosis in response to replication stress.
Finally, we asked if autophagy could be playing a role in lymphocyte response to replication stress. We found that the CD56dim subset had the highest percentage of cells undergoing autophagy following activation in the presence or absence of replication stress (Fig. 3F). Relative to CD56dim NK cells, CD56bright NK, CD4+ and CD8+ T cells maintained low levels of autophagy following activation with or without replication stress (Fig 3F). Together these results suggest that through pP53 signaling, loss of mitochondrial membrane potential, and caspase activation, apoptosis occurs in CD56bright NK cells in response to activation. However, the CD56dim subset of NK cells uniquely undergoes autophagy in addition to apoptosis in response to activation and replication stress.
Differential expression of CMG complex members in NK and T cells
We hypothesized that differences in the cell-intrinsic expression of CMG helicase complex proteins could account for the differential response to replication stress between NK cells and T cells. We performed Western blotting for GINS4 and CDC45 on isolated resting NK cells and T cells from three healthy donors. We found no difference in the relative expression of GINS4 (Fig. 4A) and CDC45 (Fig. 4B) in resting NK and T cells when normalized. Next, we chose to activate negatively enriched NK cells to proliferate with IL-15 (10 ng/mL and 1 ng/mL), as the decrease in cell viability under CIML conditions limited the numbers of NK cells we could recover. Negatively enriched T cells were activated with soluble anti-CD3 and -CD28 with soluble IL-2. Activation led to increased expression of GINS4 with a slightly greater increase in expression in T cells than NK cells, though there was no statistical significance (Fig. 4C). We also did not detect a consistently significant increase in CDC45 protein expression between conditions, likely due to variability in expression between donors (Fig. 4D). To perform further unbiased comparison of changes in protein expression, we measured expression of replisome proteins in activated NK and T cells from our proteomics analysis shown in Fig. 3. Here, we consistently found significantly increased MCM proteins in activated T cells compared to NK cells (Fig. 4E, F, G). Similarly, we found increased levels of other canonical proteins required for replication, including PCNA and POLD1, in T cells but not NK cells (Fig. 4H, I). We included ACTB as a housekeeping protein control, which was not significantly different in expression between activated NK and T cells (Fig 4J).
Figure 4. Differential expression of CMG complex members in NK and T cells.
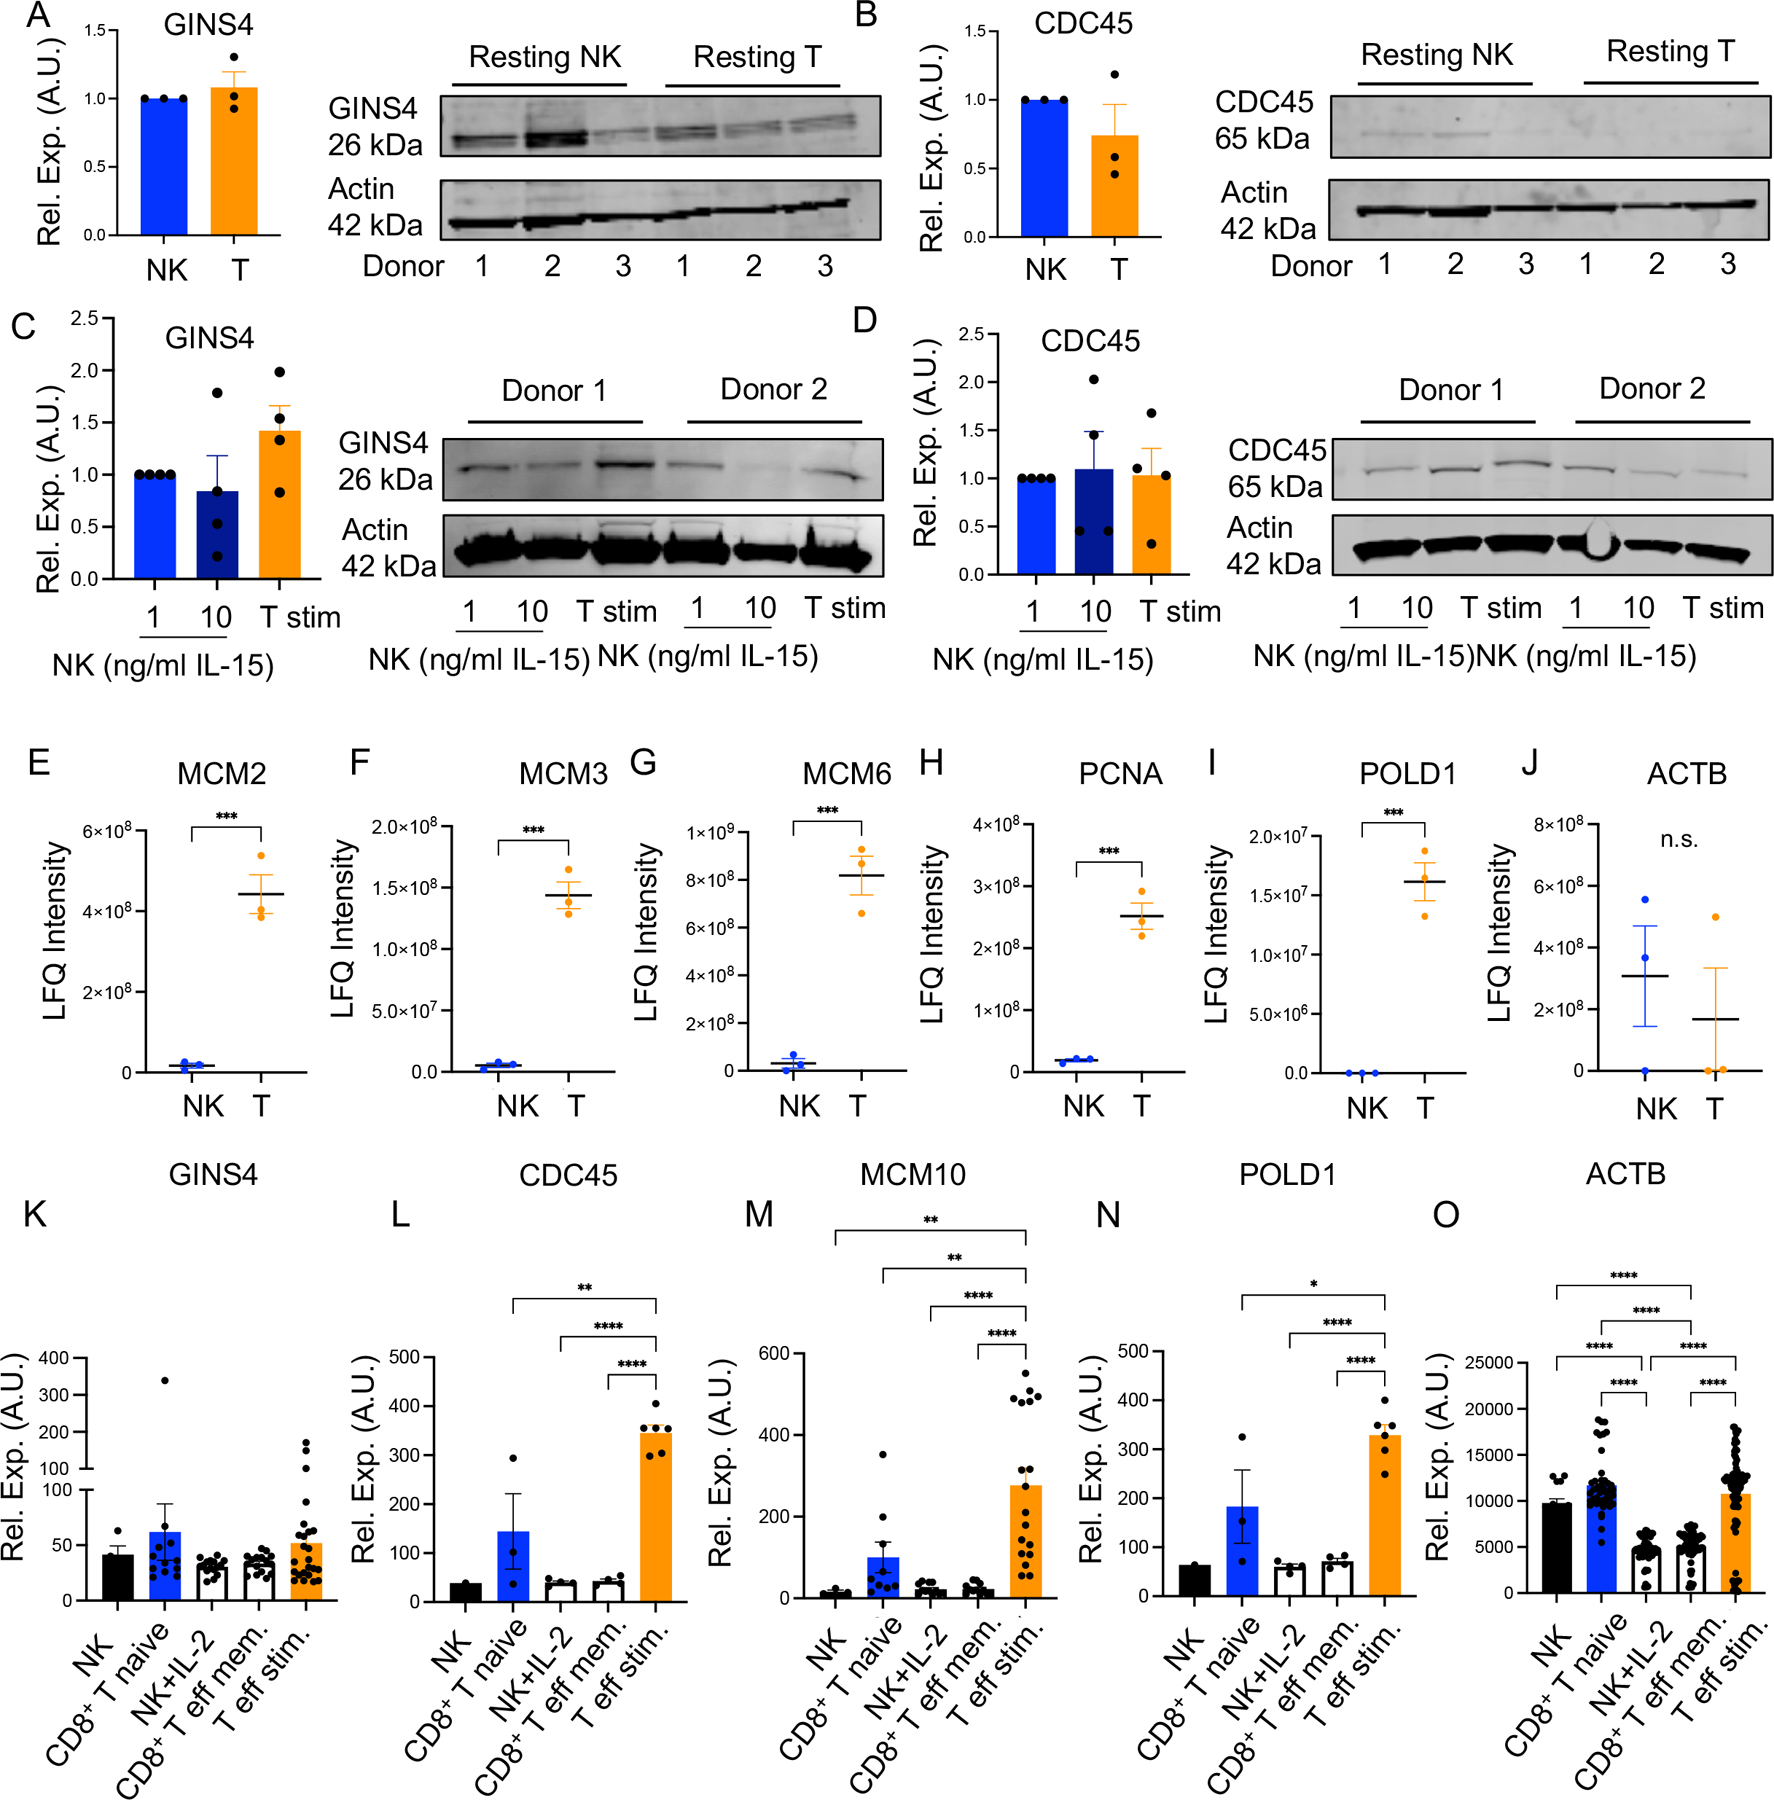
A) and (B) Western blot of resting T cells or NK cells from 3 healthy donors blotted for GINS4, CDC45 and actin (for normalization). Protein was normalized first to actin for each lane then normalized to NK cells. Student’s T test did not find statistical significance between NK and T cells. (C) and (D). Western blotting of activated NK cells (IL-15) and T cells (CD3/CD28 IL-2) from four healthy donors was conducted using the same antibodies and analysis as resting samples. No statistical significance was detected by one-way ANOVA with multiple comparisons. (E-J) Proteomic LFQ intensity data was plotted for selected MCM proteins and cell cycle proteins. One-tailed T tests were performed. n=3 biological repeats. (K-O) Relative expression in arbitrary units (AU) for RNA abundance of helicase proteins and replication genes was analyzed from datasets available on BioGPS (46). One-way ANOVA with multiple comparisons was used to test for differences, except in CDC45 (Fig 4L) and POLD1 (Fig 4N) where the NK cell condition was removed due to n=1. In (K), n=4 NK cells, n=12 NK cells + IL-2, n=16 CD8 T cell naïve, n=16 CD8 T eff memory, n=24 T eff stimulated. In (L), n=1 NK cells, n=3 NK cells + IL-2, n=4 CD8 T cell naïve, n=4 CD8 T eff memory, n=6 T eff stimulated. In (M), n=3 NK cells, n=9 NK cells + IL-2, n=12 CD8 T cell naïve, n=12 CD8 T eff memory, n=18 T eff stimulated. In (N), n=1 NK cell, n=3 NK cells + IL-2, n=4 CD8 T cell naïve, n=4 CD8 T eff memory, n=6 T eff stimulated. In (O), n=15 NK cells, n=45 NK cells + IL-2, n=60 CD8 T cell naïve, n=60 CD8 T eff memory, n=90 T eff stimulated.
Next, we analyzed the primary cell atlas transcriptomic data from BioGPS (46) to compare helicase and DNA replication factors expressions in resting versus IL-2 activated NK cells and naïve versus stimulated T cells. We found a consistent pattern of increased gene expression in response to T or NK cell activation in GINS4 (Fig. 4K), CDC45 (Fig. 4L), MCM10 (Fig. 4M), and POLD1 (Fig. 4N). These increases were generally greater in T cells relative to NK cells, though no statistical significance was found for GINS4 between stimulated T cells and NK cells stimulated with IL-2 (Fig. 4K). ACTB, included as a control protein, was similarly expressed in stimulated NK and T cells (Fig 4O). Notably, with the exception of GINS4, stimulated T cells tended to have increased gene expression in response to activation to a greater extent than NK cells. Thus, differential gene expression changes, namely increased expression in response to activation, could contribute to the greater ability of T cells to withstand mild replication stress relative to NK cells.
Replication stress impairs the cytotoxic capacity of primary human NK cells
Replication stress induced apoptosis in CD56bright and CD56dim cells (Fig. 3), though some cells do survive. We investigated the cytotoxic capacity of surviving NK cells by isolating surviving cells after activation and measuring lytic effector molecules or directly testing cytolytic function against target cells. We found that activation with aphidicolin led to a decreased frequency of granzyme B positive CD56dim and CD56bright cells in a dose-dependent manner and decreased MFI of granzyme B (Fig. 5A). CD56dim cells followed this trend for granzyme A, which triggers cell death through mitochondrial breakdown (47), however the mean fluorescence intensity (MFI) of all cells remained the same or increased and the CD56bright subset were less affected by replication stress (Fig. 5B). The percent of perforin positive CD56dim and CD56bright NK cells also decreased with increasing replication stress (Fig. 5C). Interestingly, IFN-γ production of CD56bright NK cells was unaffected by replication stress and even 5 μM aphidicolin did not affect IFN-γ production, despite CD56bright NK cells being strongly affected by replication stress (Fig. 5D). Finally, we directly tested the lytic capacity of replication stress-affected NK cells on K562 leukemic target cells. Using activated and enriched NK cells from PBMCs from 10 healthy donors, we found decreased lysis of target cells following activation of NK cells in the presence of aphidicolin (Fig. 5E).
Figure 5. Replication stress impairs the cytotoxic capacity of primary human NK cells.

Intracellular granzyme B (A) and granzyme A (B) detected in CD56dim and CD56bright cells by flow cytometry. One-way ANOVA with multiple comparisons. n=4 healthy donors. (C) Intracellular perforin was measured in NK cells from four healthy donors gated on CD56dim and CD56bright cells. One-way ANOVA with multiple comparisons was performed. n=4 healthy donors. (D) Intracellular IFN-γ in CD56bright cells, including a fluorescence minus one (FMO) negative control. No statistical differences were calculated by one-way ANOVA. n=4 healthy donors. Below bar graphs are example histograms showing unstained control (black dashed line), stimulated control (blue line), and 0.25 μM aphidicolin (orange line) conditions for Fig 1A–D. (E) 51Cr release assay to evaluate NK cell cytotoxic function against K562 target cells. Shown is the mean of n=10 healthy donors, each performed in triplicate. Cells were enriched prior to the assay as described in the Methods section. Data shown are mean±SEM. Mann-Whitney tests demonstrated statistical significance of p<0.05 for all effector: target ratios except 1.25:1 and 0.31:1.
Helicase protein knockdown leads to increased NK cell apoptosis
Previously, our lab tested the effect of MCM10 knockdown in the NK92 NK cell line using CRISPR-Cas9 (18). MCM10-knockdown (KD) NK92 cells exhibited increased frequency of cells in early S phase and increased doubling time, indicative of replication stress (18). Induction of replication stress with aphidicolin leads to a similar phenotype as previously reported in cells from helicase-deficient patients, particularly the MCM10-deficient individual (18), including DNA damage and cell cycle arrest in early S phase (Supp. Fig. 4A). To further model the MCM10 loss-of-function variants in an NK cell line with a terminally mature NK cell phenotype (48), we targeted MCM10 using shRNA in the YTS cell line. Western blot confirmed decreased protein expression by 80% in the MCM10 knockdown (MCM10-KD) cell line compared to scramble non-targeting shRNA control (Fig. 6A). We also found a higher proportion of MCM10-KD cells were PI positive by flow cytometry, demonstrating that loss of MCM10 leads to impaired cell viability analogous to that of ex vivo cells in response to replication stress (Fig. 6B). Analysis of cell cycle revealed a significantly higher percentage of MCM10-KD YTS cells in S phase, specifically early S phase (Fig. 6C). Taken together, these data recapitulate previously described impairment in cell cycle progression resulting from loss of MCM10 function (18) and further revealed impaired cell survival resulting from MCM10-knockdown.
Figure 6. MCM10 knockdown leads to increased NK cell apoptosis.

A) Validation of MCM10 knockdown was conducted by Western blotting using anti-MCM10 and anti-actin antibodies and quantified using actin as a loading control. n=3 technical replicates. (B) Relative percent PI positive cells were analyzed by flow cytometry using unstained controls. Representative histograms are shown. n=4 technical replicates. (C) Representative cell cycle graphs with gating strategy based on scramble shRNA (left) and quantification of the frequency of cells in S phase or early S phase (right). n=5 technical repeats. (D) Representative images from confocal microscopy of MCM10-KD or scramble (control) shRNA YTS cells with DAPI staining and antibodies against phospho-RPA and γH2AX. Nuclear area quantification of knockdown cells compared to controls. n=294 and n=205 scramble and MCM10 KD cells, respectively, pooled from n=2 experimental repeats. (E) Number of foci of phospho-RPA and γH2AX compared to scramble shRNA controls. n=294 scramble cells analyzed and n=205 MCM10 KD cells analyzed for phospho-RPA. n=141 and n=77 cells analyzed for scramble and MCM10 KD respectively for γH2AX foci. (F) Relative percent caspase positive cells using fluorescence minus one (FMO) controls. n=4 technical replicates. (G) and (H) Relative fluorescence intensity measured by intracellular flow cytometry for granzyme B and perforin. n=3 technical replicates. Representative histograms are shown. Student’s T test was used to determine statistical significance for Figures A – H. No statistical significance was detected between MCM10-KD and controls in G or H. N.S. not significant. Scramble, scramble shRNA YTS cells; MCM10, MCM10-KD YTS cells.
Next, we sought to quantify the effect of MCM10 knockdown on markers of replication stress. We performed confocal imaging of nuclear area, phospho-RPA (Thr21) foci, and γH2AX foci in MCM10-KD and scramble control lines. Image analysis revealed increased nuclear area, phospho-RPA foci, and γH2AX foci (Fig. 6D, E). This is consistent with the MCM10-deficient patient where increased nuclear area and γH2AX foci were seen (18). We also measured apoptosis and found that the percentage of pan-caspase+ cells was increased in MCM10-KD (Fig. 6F). Finally, looking at cytotoxic proteins, there was a consistent decrease in intracellular granzyme B (Fig. 6G) and perforin (Fig. 6H) relative to scramble controls (Fig. 6G, H). Thus, helicase deficiency as a result of loss of function or decreased expression of replisome proteins results in replication stress, which is ultimately the driver of apoptosis and may contribute to decreased cytotoxicity in NK cells.
Discussion
The association between partial loss-of-function variants in genes encoding the CMG helicase and NKD have been well documented (15–18, 30). Cellular phenotypes of these variants include cell cycle arrest, DNA damage, and replication stress (15–18, 30). While these variants impair NK cell development, they also negatively affect the proliferative response of mature NK cell subsets (15, 16, 18, 30), while T cell responses are often intact or less affected than NK cells (15, 18, 30). Here, we use DNA polymerase inhibition with aphidicolin to increase replication stress in primary NK cells and gene knockdown to recapitulate the effects of helicase deficiency in an NK cell line. Aphidicolin was used throughout our study as a means to delay replication by inhibiting DNA polymerase. Our lab and others have shown that limitations to helicase function through helicase deficiency leads to DNA damage, replication stress and cell cycle arrest, which is a phenotype that also appears when aphidicolin is used at low doses (15, 16, 18, 30). It is also interesting to note that helicase protein knockdown was attempted by various genetic methods in primary human NK cells, including siRNA, shRNA, and CRISPR-Cas9 against several helicase proteins. Manipulated primary NK cells had poor survival in response to genetic knockdown or deletion and could not be validated or further tested, whereas control or mock lines were not as affected. While it would have been of value to demonstrate the effect of helicase deletion in primary cells, it is likely that the increased apoptosis of mature NK cells in response to helicase deletion contributed to this technical difficulty. Here, we show that replication stress induced by aphidicolin strongly impacts the CD56bright NK cell subset by increasing γH2AX and phosphorylated RPA, and ultimately triggers an apoptotic program in NK cells but not T cells. Together, these data demonstrate key differences in the nature of the response to, and tolerance for, replication stress between NK and T lymphocytes, despite both cell types being cytolytic effector cells that undergo activation-induced proliferation.
We found that T cells had a trend towards upregulated helicase genes and proteins to a higher degree than NK cells, not only in our own experiments by Western blot and proteomics, but also from publicly available data sets examining gene expression. Increased helicase protein expression has been associated with increased proliferation, especially in relation to cancer and reviewed in full elsewhere (49–54). Here, we show that activated NK cells and T cells proliferate at a similar rate and have similar replication fork speeds in our in vitro assays, yet T cells seem to have a greater increase in helicase protein expression in response to multiple activation conditions. Perhaps T cell control of helicase proteins during proliferation offers protection against DNA damage and replication stress by allowing multiple dormant origins to fire at once and maintaining adequate DNA damage response signaling (55). T cell upregulation of helicase proteins during activation could combat replication stress by initiating dormant replication origins. Conversely, NK cells may have a lower baseline of helicase proteins necessary during proliferation but are left at risk of programmed cell death when activated.
It is pertinent to note that activated NK cells have significant DNA damage when compared to unstimulated controls even in the absence of replication stress, indicating that NK cells during viral infection will likely accumulate DNA damage just by being activated and undergo activation-induced cell death (AICD). Others have demonstrated that CIML activation of NK cells resulted in decreased viability, with NK cells undergoing apoptosis following failed mitochondrial dynamics and mitophagy (56). T cells, particularly CD8+ T cells, also undergo AICD as a form of peripheral immune regulation (57, 58). However, a threshold for AICD in NK cells after activation may be contributing to our results where we find a higher sensitivity to DNA damage and replication stress.
NKD studies have determined that NK cell maturation is blocked in helicase deficient patients, possibly through apoptosis of the CD56bright population (15, 16). CD56bright NK cells from MCM4-deficient individuals had chromosomal aberrations, indicative of replication stress, and had increased apoptosis (16). In our data, aphidicolin-induced replication stress resulted in apoptosis, particularly of the CD56bright NK cell subset, which left behind a small population of cells that can survive replication stress yet have decreased expression of cytolytic effector molecules. While this study was focused on CIML activation of NK cells, it suggests fundamental differences between mature NK cells and T cells that can contribute to human disease. It also provides insight into previously observed susceptibilities of NK cells to mild replication stress. Together, these data identify a connection between helicase deficiency and replication stress leading to NK cell-specific dysfunction and further shows that human NK cells and T cells can have differential sensitivities to replication stress.
Supplementary Material
Key Points.
NK cells are more sensitive to replication stress, resulting in apoptosis
Helicase deficiency is linked to replication stress and impaired NK cell function
Acknowledgments
We would like to thank the staff of the Columbia Stem Cell Initiative Flow Cytometry Core Facility, under the leadership of Michael Kissner, at Columbia University Irving Medical Center for their contributions to the work presented in this manuscript. These studies also used the resources of the Herbert Irving Comprehensive Cancer Center Flow Cytometry Shared Resources funded in part through Center Grant P30CA013696. This work was supported by grants from NIH-NIGMS (R01GM132604) to DE and NIH-NIAID (R01AI137275) to EMM. The schematic illustration was created using biorender.com.
Footnotes
Conflict-of-interest disclosure
The authors have no competing financial interests to declare.
References
- 1.Poli A, Michel T, Theresine M, Andres E, Hentges F, and Zimmer J. 2009. CD56bright natural killer (NK) cells: an important NK cell subset. Immunology 126: 458–465. [DOI] [PMC free article] [PubMed] [Google Scholar]
- 2.Cooper MA, Fehniger TA, and Caligiuri MA. 2001. The biology of human natural killer-cell subsets. Trends Immunol 22: 633–640. [DOI] [PubMed] [Google Scholar]
- 3.Mujal AM, Delconte RB, and Sun JC. 2021. Natural Killer Cells: From Innate to Adaptive Features. Annu Rev Immunol 39: 417–447. [DOI] [PubMed] [Google Scholar]
- 4.Cerwenka A, and Lanier LL. 2016. Natural killer cell memory in infection, inflammation and cancer. Nat Rev Immunol 16: 112–123. [DOI] [PubMed] [Google Scholar]
- 5.Kamimura Y, and Lanier LL. 2015. Homeostatic control of memory cell progenitors in the natural killer cell lineage. Cell Rep 10: 280–291. [DOI] [PMC free article] [PubMed] [Google Scholar]
- 6.O’Leary JG, Goodarzi M, Drayton DL, and von Andrian UH. 2006. T cell- and B cell-independent adaptive immunity mediated by natural killer cells. Nat Immunol 7: 507–516. [DOI] [PubMed] [Google Scholar]
- 7.Berrien-Elliott MM, Wagner JA, and Fehniger TA. 2015. Human Cytokine-Induced Memory-Like Natural Killer Cells. J Innate Immun 7: 563–571. [DOI] [PMC free article] [PubMed] [Google Scholar]
- 8.Romee R, Schneider SE, Leong JW, Chase JM, Keppel CR, Sullivan RP, Cooper MA, and Fehniger TA. 2012. Cytokine activation induces human memory-like NK cells. Blood 120: 4751–4760. [DOI] [PMC free article] [PubMed] [Google Scholar]
- 9.Cooper MA, Elliott JM, Keyel PA, Yang L, Carrero JA, and Yokoyama WM. 2009. Cytokine-induced memory-like natural killer cells. Proc Natl Acad Sci U S A 106: 1915–1919. [DOI] [PMC free article] [PubMed] [Google Scholar]
- 10.Terren I, Mikelez I, Odriozola I, Gredilla A, Gonzalez J, Orrantia A, Vitalle J, Zenarruzabeitia O, and Borrego F. 2018. Implication of Interleukin-12/15/18 and Ruxolitinib in the Phenotype, Proliferation, and Polyfunctionality of Human Cytokine-Preactivated Natural Killer Cells. Front Immunol 9: 737. [DOI] [PMC free article] [PubMed] [Google Scholar]
- 11.Uppendahl LD, Felices M, Bendzick L, Ryan C, Kodal B, Hinderlie P, Boylan KLM, Skubitz APN, Miller JS, and Geller MA. 2019. Cytokine-induced memory-like natural killer cells have enhanced function, proliferation, and in vivo expansion against ovarian cancer cells. Gynecol Oncol 153: 149–157. [DOI] [PMC free article] [PubMed] [Google Scholar]
- 12.Romee R, Rosario M, Berrien-Elliott MM, Wagner JA, Jewell BA, Schappe T, Leong JW, Abdel-Latif S, Schneider SE, Willey S, Neal CC, Yu L, Oh ST, Lee YS, Mulder A, Claas F, Cooper MA, and Fehniger TA. 2016. Cytokine-induced memory-like natural killer cells exhibit enhanced responses against myeloid leukemia. Sci Transl Med 8: 357ra123. [DOI] [PMC free article] [PubMed] [Google Scholar]
- 13.Mace EM, and Orange JS. 2019. Emerging insights into human health and NK cell biology from the study of NK cell deficiencies. Immunol Rev 287: 202–225. [DOI] [PMC free article] [PubMed] [Google Scholar]
- 14.Orange JS 2013. Natural killer cell deficiency. J Allergy Clin Immunol 132: 515–525. [DOI] [PMC free article] [PubMed] [Google Scholar]
- 15.Cottineau J, Kottemann MC, Lach FP, Kang YH, Vely F, Deenick EK, Lazarov T, Gineau L, Wang Y, Farina A, Chansel M, Lorenzo L, Piperoglou C, Ma CS, Nitschke P, Belkadi A, Itan Y, Boisson B, Jabot-Hanin F, Picard C, Bustamante J, Eidenschenk C, Boucherit S, Aladjidi N, Lacombe D, Barat P, Qasim W, Hurst JA, Pollard AJ, Uhlig HH, Fieschi C, Michon J, Bermudez VP, Abel L, de Villartay JP, Geissmann F, Tangye SG, Hurwitz J, Vivier E, Casanova JL, Smogorzewska A, and Jouanguy E. 2017. Inherited GINS1 deficiency underlies growth retardation along with neutropenia and NK cell deficiency. J Clin Invest 127: 1991–2006. [DOI] [PMC free article] [PubMed] [Google Scholar]
- 16.Gineau L, Cognet C, Kara N, Lach FP, Dunne J, Veturi U, Picard C, Trouillet C, Eidenschenk C, Aoufouchi S, Alcais A, Smith O, Geissmann F, Feighery C, Abel L, Smogorzewska A, Stillman B, Vivier E, Casanova JL, and Jouanguy E. 2012. Partial MCM4 deficiency in patients with growth retardation, adrenal insufficiency, and natural killer cell deficiency. J Clin Invest 122: 821–832. [DOI] [PMC free article] [PubMed] [Google Scholar]
- 17.Hughes CR, Guasti L, Meimaridou E, Chuang CH, Schimenti JC, King PJ, Costigan C, Clark AJ, and Metherell LA. 2012. MCM4 mutation causes adrenal failure, short stature, and natural killer cell deficiency in humans. J Clin Invest 122: 814–820. [DOI] [PMC free article] [PubMed] [Google Scholar]
- 18.Mace EM, Paust S, Conte MI, Baxley RM, Schmit MM, Patil SL, Guilz NC, Mukherjee M, Pezzi AE, Chmielowiec J, Tatineni S, Chinn IK, Akdemir ZC, Jhangiani SN, Muzny DM, Stray-Pedersen A, Bradley RE, Moody M, Connor PP, Heaps AG, Steward C, Banerjee PP, Gibbs RA, Borowiak M, Lupski JR, Jolles S, Bielinsky AK, and Orange JS. 2020. Human NK cell deficiency as a result of biallelic mutations in MCM10. J Clin Invest 130: 5272–5286. [DOI] [PMC free article] [PubMed] [Google Scholar]
- 19.Conte MI, Poli MC, Taglialatela A, Leuzzi G, Chinn IK, Salinas SA, Rey-Jurado E, Olivares N, Veramendi-Espinoza L, Ciccia A, Lupski JR, Aldave Becerra JC, Mace EM, and Orange JS. 2022. Partial loss-of-function mutations in GINS4 lead to NK cell deficiency with neutropenia. JCI Insight 7(21):e154948. [DOI] [PMC free article] [PubMed] [Google Scholar]
- 20.Li H, and O’Donnell ME. 2018. The Eukaryotic CMG Helicase at the Replication Fork: Emerging Architecture Reveals an Unexpected Mechanism. Bioessays 40. [DOI] [PMC free article] [PubMed] [Google Scholar]
- 21.Yuan Z, Georgescu R, Bai L, Zhang D, Li H, and O’Donnell ME. 2020. DNA unwinding mechanism of a eukaryotic replicative CMG helicase. Nat Commun 11: 688. [DOI] [PMC free article] [PubMed] [Google Scholar]
- 22.Ibarra A, Schwob E, and Mendez J. 2008. Excess MCM proteins protect human cells from replicative stress by licensing backup origins of replication. Proc Natl Acad Sci U S A 105: 8956–8961. [DOI] [PMC free article] [PubMed] [Google Scholar]
- 23.Ge XQ, Jackson DA, and Blow JJ. 2007. Dormant origins licensed by excess Mcm2–7 are required for human cells to survive replicative stress. Genes Dev 21: 3331–3341. [DOI] [PMC free article] [PubMed] [Google Scholar]
- 24.Baxley RM, and Bielinsky AK. 2017. Mcm10: A Dynamic Scaffold at Eukaryotic Replication Forks. Genes (Basel) 8. [DOI] [PMC free article] [PubMed] [Google Scholar]
- 25.Baxley RM, Leung W, Schmit MM, Matson JP, Yin L, Oram MK, Wang L, Taylor J, Hedberg J, Rogers CB, Harvey AJ, Basu D, Taylor JC, Pagnamenta AT, Dreau H, Craft J, Ormondroyd E, Watkins H, Hendrickson EA, Mace EM, Orange JS, Aihara H, Stewart GS, Blair E, Cook JG, and Bielinsky AK. 2021. Bi-allelic MCM10 variants associated with immune dysfunction and cardiomyopathy cause telomere shortening. Nat Commun 12: 1626. [DOI] [PMC free article] [PubMed] [Google Scholar]
- 26.Murayama T, Takeuchi Y, Yamawaki K, Natsume T, Li M, Marcela RN, Nishimura T, Kogure Y, Nakata A, Tominaga K, Sasahara A, Yano M, Ishikawa S, Ohta T, Ikeda K, Horie-Inoue K, Inoue S, Seki M, Suzuki Y, Sugano S, Enomoto T, Tanabe M, Tada KI, Kanemaki MT, Okamoto K, Tojo A, and Gotoh N. 2021. MCM10 compensates for Myc-induced DNA replication stress in breast cancer stem-like cells. Cancer Sci 112: 1209–1224. [DOI] [PMC free article] [PubMed] [Google Scholar]
- 27.Mazouzi A, Velimezi G, and Loizou JI. 2014. DNA replication stress: causes, resolution and disease. Exp Cell Res 329: 85–93. [DOI] [PubMed] [Google Scholar]
- 28.Bassing CH, and Alt FW. 2004. The cellular response to general and programmed DNA double strand breaks. DNA Repair (Amst) 3: 781–796. [DOI] [PubMed] [Google Scholar]
- 29.Lindstrom MS, Bartek J, and Maya-Mendoza A. 2022. p53 at the crossroad of DNA replication and ribosome biogenesis stress pathways. Cell Death Differ 29: 972–982. [DOI] [PMC free article] [PubMed] [Google Scholar]
- 30.Conte MI, Poli MC, Taglialatela A, Leuzzi G, Chinn IK, Salinas SA, Rey-Jurado E, Olivares N, Veramendi-Espinoza L, Ciccia A, Lupski JR, Aldave Becerra JC, Mace EM, and Orange JS. 2022. Partial loss-of-function mutations in GINS4 lead to NK cell deficiency with neutropenia. JCI Insight 7. [DOI] [PMC free article] [PubMed] [Google Scholar]
- 31.Guilz NC, Ahn YO, Seo S, and Mace EM. 2023. Unwinding the Role of the CMG Helicase in Inborn Errors of Immunity. J Clin Immunol [DOI] [PMC free article] [PubMed] [Google Scholar]
- 32.Schindelin J, Arganda-Carreras I, Frise E, Kaynig V, Longair M, Pietzsch T, Preibisch S, Rueden C, Saalfeld S, Schmid B, Tinevez JY, White DJ, Hartenstein V, Eliceiri K, Tomancak P, and Cardona A. 2012. Fiji: an open-source platform for biological-image analysis. Nat Methods 9: 676–682. [DOI] [PMC free article] [PubMed] [Google Scholar]
- 33.Terret ME, Sherwood R, Rahman S, Qin J, and Jallepalli PV. 2009. Cohesin acetylation speeds the replication fork. Nature 462: 231–234. [DOI] [PMC free article] [PubMed] [Google Scholar]
- 34.Kulak NA, Pichler G, Paron I, Nagaraj N, and Mann M. 2014. Minimal, encapsulated proteomic-sample processing applied to copy-number estimation in eukaryotic cells. Nat Methods 11: 319–324. [DOI] [PubMed] [Google Scholar]
- 35.Bruderer R, Bernhardt OM, Gandhi T, Miladinovic SM, Cheng LY, Messner S, Ehrenberger T, Zanotelli V, Butscheid Y, Escher C, Vitek O, Rinner O, and Reiter L. 2015. Extending the limits of quantitative proteome profiling with data-independent acquisition and application to acetaminophen-treated three-dimensional liver microtissues. Mol Cell Proteomics 14: 1400–1410. [DOI] [PMC free article] [PubMed] [Google Scholar]
- 36.Ruiz-Garcia R, Vargas-Hernandez A, Chinn IK, Angelo LS, Cao TN, Coban-Akdemir Z, Jhangiani SN, Meng Q, Forbes LR, Muzny DM, Allende LM, Ehlayel MS, Gibbs RA, Lupski JR, Uzel G, Orange JS, and Mace EM. 2018. Mutations in PI3K110delta cause impaired natural killer cell function partially rescued by rapamycin treatment. J Allergy Clin Immunol 142: 605–617 e607. [DOI] [PMC free article] [PubMed] [Google Scholar]
- 37.Testi R, D’Ambrosio D, De Maria R, and Santoni A. 1994. The CD69 receptor: a multipurpose cell-surface trigger for hematopoietic cells. Immunol Today 15: 479–483. [DOI] [PubMed] [Google Scholar]
- 38.Ziegler SF, Ramsdell F, and Alderson MR. 1994. The activation antigen CD69. Stem Cells 12: 456–465. [DOI] [PubMed] [Google Scholar]
- 39.Koundrioukoff S, Carignon S, Techer H, Letessier A, Brison O, and Debatisse M. 2013. Stepwise activation of the ATR signaling pathway upon increasing replication stress impacts fragile site integrity. PLoS Genet 9: e1003643. [DOI] [PMC free article] [PubMed] [Google Scholar]
- 40.Mocanu C, Karanika E, Fernandez-Casanas M, Herbert A, Olukoga T, Ozgurses ME, and Chan KL. 2022. DNA replication is highly resilient and persistent under the challenge of mild replication stress. Cell Rep 39: 110701. [DOI] [PMC free article] [PubMed] [Google Scholar]
- 41.Jin J, Ahn Y-O, Kim TM, Keam B, Kim D-W, and Heo DS. 2018. The CD56bright CD62L+ NKG2A+ immature cell subset is dominantly expanded in human cytokine-induced memory-like NK cells. bioRxiv [Google Scholar]
- 42.Sabatinos SA, and Forsburg SL. 2015. Managing Single-Stranded DNA during Replication Stress in Fission Yeast. Biomolecules 5: 2123–2139. [DOI] [PMC free article] [PubMed] [Google Scholar]
- 43.Kang Y, Han YG, Khim KW, Choi WG, Ju MK, Park K, Shin KJ, Chae YC, Choi JH, Kim H, and Lee JY. 2023. Alteration of replication protein A binding mode on single-stranded DNA by NSMF potentiates RPA phosphorylation by ATR kinase. Nucleic Acids Res [DOI] [PMC free article] [PubMed] [Google Scholar]
- 44.Montecucco A, Zanetta F, and Biamonti G. 2015. Molecular mechanisms of etoposide. EXCLI J 14: 95–108. [DOI] [PMC free article] [PubMed] [Google Scholar]
- 45.Orabi KY, Abaza MS, Luqmani YA, and Al-Attiyah R. 2021. Psiadin and plectranthone selectively inhibit colorectal carcinoma cells proliferation via modulating cyclins signaling and apoptotic pathways. PLoS One 16: e0252820. [DOI] [PMC free article] [PubMed] [Google Scholar]
- 46.Mabbott NA, Baillie JK, Brown H, Freeman TC, and Hume DA. 2013. An expression atlas of human primary cells: inference of gene function from coexpression networks. BMC Genomics 14: 632. [DOI] [PMC free article] [PubMed] [Google Scholar]
- 47.Lieberman J 2010. Granzyme A activates another way to die. Immunol Rev 235: 93–104. [DOI] [PMC free article] [PubMed] [Google Scholar]
- 48.Gunesch JT, Angelo LS, Mahapatra S, Deering RP, Kowalko JE, Sleiman P, Tobias JW, Monaco-Shawver L, Orange JS, and Mace EM. 2019. Genome-wide analyses and functional profiling of human NK cell lines. Mol Immunol 115: 64–75. [DOI] [PMC free article] [PubMed] [Google Scholar]
- 49.Liu Z, Li J, Chen J, Shan Q, Dai H, Xie H, Zhou L, Xu X, and Zheng S. 2018. MCM family in HCC: MCM6 indicates adverse tumor features and poor outcomes and promotes S/G2 cell cycle progression. BMC Cancer 18: 200. [DOI] [PMC free article] [PubMed] [Google Scholar]
- 50.Neves H, and Kwok HF. 2017. In sickness and in health: The many roles of the minichromosome maintenance proteins. Biochim Biophys Acta Rev Cancer 1868: 295–308. [DOI] [PubMed] [Google Scholar]
- 51.Ouyang F, Liu J, Xia M, Lin C, Wu X, Ye L, Song L, Li J, Wang J, Guo P, and He M. 2017. GINS2 is a novel prognostic biomarker and promotes tumor progression in early-stage cervical cancer. Oncol Rep 37: 2652–2662. [DOI] [PMC free article] [PubMed] [Google Scholar]
- 52.Pollok S, Bauerschmidt C, Sanger J, Nasheuer HP, and Grosse F. 2007. Human Cdc45 is a proliferation-associated antigen. FEBS J 274: 3669–3684. [DOI] [PubMed] [Google Scholar]
- 53.Saydam O, Senol O, Schaaij-Visser TB, Pham TV, Piersma SR, Stemmer-Rachamimov AO, Wurdinger T, Peerdeman SM, and Jimenez CR. 2010. Comparative protein profiling reveals minichromosome maintenance (MCM) proteins as novel potential tumor markers for meningiomas. J Proteome Res 9: 485–494. [DOI] [PMC free article] [PubMed] [Google Scholar]
- 54.Seo YS, and Kang YH. 2018. The Human Replicative Helicase, the CMG Complex, as a Target for Anti-cancer Therapy. Front Mol Biosci 5: 26. [DOI] [PMC free article] [PubMed] [Google Scholar]
- 55.Sedlackova H, Rask MB, Gupta R, Choudhary C, Somyajit K, and Lukas J. 2020. Equilibrium between nascent and parental MCM proteins protects replicating genomes. Nature 587: 297–302. [DOI] [PubMed] [Google Scholar]
- 56.Terren I, Sanda V, Amarilla-Irusta A, Lopez-Pardo A, Sevilla A, Astarloa-Pando G, Amo L, Zenarruzabeitia O, Scorrano L, and Borrego F. 2023. IL-12/15/18-induced cell death and mitochondrial dynamics of human NK cells. Front Immunol 14: 1211839. [DOI] [PMC free article] [PubMed] [Google Scholar]
- 57.Arakaki R, Yamada A, Kudo Y, Hayashi Y, and Ishimaru N. 2014. Mechanism of activation-induced cell death of T cells and regulation of FasL expression. Crit Rev Immunol 34: 301–314. [DOI] [PubMed] [Google Scholar]
- 58.Twu YC, Gold MR, and Teh HS. 2011. TNFR1 delivers pro-survival signals that are required for limiting TNFR2-dependent activation-induced cell death (AICD) in CD8+ T cells. Eur J Immunol 41: 335–344. [DOI] [PubMed] [Google Scholar]
Associated Data
This section collects any data citations, data availability statements, or supplementary materials included in this article.