

Abstract
Distant metastasis represents the major lethal cause of breast cancer. To understand the molecular mechanisms of breast cancer metastasis and identify markers with metastatic potential, we established a highly metastatic variant of parental MDA-MB-231 cells (MDA-MB-231HM). Using two-dimensional electrophoresis (2-DE), we performed a proteomic comparison of the two kinds of cells. As much as 51 protein spots were differentially expressed between the selected variant and its parental counterpart in at least 3 experiments. Ten unique proteins were identified using matrix-assisted laser desorption/ionization-time of flight (MALDI-TOF) mass spectrometry (MS), liquid chromatography-electrospray ionization-tandem mass spectrometry (LC-ESI-MS/MS), and database searching software. Among them, nine proteins were up-regulated in MDA-MB-231HM cells, including Macrophage-capping protein (CapG), Galectin-1, Chloride intracellular channel protein 1, Endoplasmic reticulum protein ERp29 precursor, Stathmin-1 (STMN1), Isoform 1 of uridine–cytidine kinase 2(UCK2), Rho GDP-dissociation inhibitor 2 (ARHGDIB), isocitrate dehydrogenase [NADP] cytoplasmic (IDH1), and N-myc downstream regulated gene 1 (NDRG1) protein. Only transgelin-2 was down-regulated. Differential expression was confirmed for three proteins including CapG, STMN1, and transgelin-2 by Western blotting analysis. Transgelin-2 was chosen for further verification by immunohistochemistry. The results suggested that 2-DE would be an efficient way to screen the proteins responsible for specific biological function. Furthermore, the findings imply that different proteins may be involved in the metastatic process in breast carcinomas.
Electronic supplementary material
The online version of this article (doi:10.1007/s00432-010-0812-0) contains supplementary material, which is available to authorized users.
Keywords: Breast cancer, Metastasis, Two-dimensional gel electrophoresis, Mass spectrometry
Introduction
Breast cancer is one of the most common cancers of women worldwide. Moreover, distant metastasis as a common form of recurrence represents the major lethal cause of breast cancer (Fisher et al. 2001; Howell et al. 2005; Weigelt et al. 2005). To better understand the molecular mechanisms of breast cancer metastasis, it is extremely important to identify the markers with metastatic potential. Proteomics has been shown to be a successful method in screening tumor-related protein markers, as exemplified by the identification of Heat-shock protein 27 as a potential biomarker for hepatocellular carcinoma (Feng et al. 2005) and annexin A3 for lung adenocarcinoma (Liu et al. 2009). As to the application of proteomics in breast cancer, in our previous study, we used two-dimensional gel electrophoresis (2-DE) to find out some specific proteins differentially expressed between a highly pulmonary metastatic variant of parental MDA-MB-435 cells (MDA-MB-435HM) and its parental cell line MDA-MB-435 (Li et al. 2006). It has been reported that MDA-MB-435 cells may be derived from melanoma cells (Rae et al. 2007; Ellison et al. 2002; Rae et al. 2004; Christgen and Lehmann 2007), so whether differentially expressed proteins from our previous study can be used as potential markers for metastatic progression of breast cancer is controversial. Fortunately, we have established a highly metastatic variant of parental MDA-MB-231 cells (MDA-MB-231HM). In the present study, we compared the differential protein expression between the metastatic clone and parental cells by using 2-DE coupled with mass spectrometry. We eventually identified 10 proteins as being differentially expressed between the selected variant and its parental counterpart.
Materials and methods
Reagents
L15 medium (Leibovitz) was supplied by GIBCO BRL. DTT, urea, agarose, glycerol, Tris base, ammonium persulfate, glycine, CHAPS, acrylamide, Bis, TEMED, SDS, and 2-D SDS-PAGE standards were obtained from BioRad Laboratories (Hercules, CA). IPG buffer (3–10 L), Immobiline Dry-Strips (13 cm, 3–10 L), and DryStrip cover fluid were purchased from Amersham Pharmacia Biotech AB (Uppsala Sweden). Iodoacetamide (IAA), ammonium bicarbonate, and acetic acid were obtained from Sigma Chemical (St. Louis, MO). 2-D standard protein marker was obtained from Biorad. Thiourea was obtained from SIGMA. ACN and methanol were from Fisher Chemicals (Fair Lawn, NJ). TFA and trypsin (sequencing grade) were obtained from Merck (Darmstadt, Germany) and Boehringer Mannheim (Mannheim, Germany), respectively. Other chemicals are domestic products (analytical grade). All buffers were prepared with Milli-Q water (Millipore, Bedford, MA).
Cell culture and animals
MDA-MB-231, a widely used human breast cancer cell line, was obtained from ATCC (Rockland, MD) and maintained in L15 medium supplemented with 10% fetal bovine serum (FBS), 100 U/mL penicillin, and 100 mg/mL streptomycin at 37°C in a humidified atmosphere containing 5% CO2. Cells were harvested at 80–90% confluence by treatment with 0.25% trypsin/0.53 mM EDTA solution. All culture medium components were obtained from Gibco BRL (Grand Island, NY). Female athymic BALB/c-nu/nu mice, 4–6 weeks old, were obtained from Shanghai Institute of Materia Medica, Chinese Academy of Sciences (Shanghai, China), and housed in laminar-flow cabinets under specific pathogen-free conditions with food and water ad libitum. All experiments on mice were conducted in accordance with the guidelines of National Institutes of Health for the Care and Use of Laboratory Animals.
Establishment of MDA-MB-231HM cells with highly metastatic potential
MDA-MB-231 cells were injected orthotopically into the exposed axillary MFP of anesthetized athymic mice as described previously (Li et al. 2006). After 8–10 weeks of inoculation, mice were killed under anesthesia and tissue samples were removed from pulmonary metastatic lesions. For primary culture, the removed pulmonary metastatic lesions from nude mice were washed in PBS (pH 7.2), finely minced, and then incubated for 2 h at 37°C in freshly prepared L15 medium containing 10% FBS, 100 U/mL penicillin, 100 μg/mL streptomycin, 0.5 μg/mL amphotericin B, and 8 mg/mL of collagenase II (Sigma Chemical Co.). The dissociated cell suspension was filtered through a 100-mesh screen, and a dispersed single-cell suspension was then seeded into a 75-mm2 flask in L15 supplemented with 10% FBS and antibiotics. Cells were continuously passaged by exposure to trypsin–EDTA solution until mesenchymal cells were no longer apparent. When the cells were grown to approximately 80% confluence, they were reinoculated into the MFP of nude mice as mentioned above until pulmonary metastatic lesions formed and then were retreated as above. The procedures were repeated five to six times. A highly metastatic variant of parental MDA-MB-231 cell line, termed MDA-MB-231HM, was established within the presented model system by six cycles of pulmonary metastasis implantation to the MFP and maintained in L15 containing 10% FBS in a 37°C, 5% CO2 environment. MDA-MB-231HM cells were routinely monitored for Mycoplasma contamination by fluorescent staining with Hoechst 33258 and found to be free of it. All cell lines used for in vitro and in vivo studies were from the 3rd to 15th passage. Cell viability was determined by trypan blue (0.4%; w/v) dye exclusion, and experiments were not continued if cell viability was <90%. The tumorigenicity and spontaneous metastatic potential of the cell lines were characterized with the same orthotopic model as above described. The karyotype of the isolated cells was analyzed by Giemsa chromosome banding stain.
In vitro invasion assays
In vitro invasion assays were performed to analyze the invasive potential of parental MDA-MB-231 and MDA-MB-231HM with a Matrigel invasion chamber (Becton–Dickinson Labware, Bedford, MA) as described previously with some modifications (Albini et al. 1987). Each well insert was coated with 100 μl of a 1:3 dilution of Matrigel in serum-free culture medium. Then, a mixture of 300 μl L15 medium with 10% FBS and 300 μl supernatant of NIH/3T3 cell culture was added to the lower chambers as a chemoattractant, and 1 × 10⁵ cells in 100 μl of serum-free L15 medium were added to the top of this Matrigel layer. The cells were incubated at 37°C for 24 h. The cell suspension was aspirated, and excess Matrigel was removed from the filter using a cotton swab. Invasion was assessed by counting the cells that had traveled across the filter and were attached to the bottom side of the filter. Then, the filters were fixed in 10% formalin for 15 min and subsequently stained with Giemsa for 30 min. Cells which had invaded through the Matrigel and reached the lower surface of the filter were counted under a light microscope at a magnification of ×200. Five fields should be counted for each sample.
Tumorigenicity and metastasis assays in nude mice
The tumorigenicity and spontaneously metastatic capability of the different cells were determined using an orthotopic xenograft tumor model in the athymic mice as described previously (Hou et al. 2004). Animals were divided into two groups, including the parental MDA-MB-231 and MDA-MB-231HM groups. Each group had eight mice. As much as 2 × 10⁶ cells were injected orthotopically into the exposed axillary MFP of anesthetized athymic mice. The two kinds of cells were inoculated in 5 weeks. Animals were monitored every 2 days for up to 5 weeks for tumor growth and general health. The rate of primary tumor growth of different cells was determined by plotting the means of two orthogonal diameters of the tumors, measured at 7-day intervals. Animals were killed and autopsied at 5 weeks of postinoculation. The metastasis deposits of the lung were assessed by macroscopic observation to evaluate the metastatic potential. To confirm the presence of lung metastases, sections were cut at 50 μm intervals and H&E staining were performed.
Sample preparation
Cultured MDA-MB-231HM and parental MDAMB-231 cells were grown to approximately 80% confluence and harvested by treatment with 0.25% trypsin and 0.53 mM EDTA. They were rinsed three times in ice-cold PBS and centrifuged in 1.5 mL microtubes. The cell pellets were dissolved in a lysis buffer (7 Murea, 4% CHAPS, 40 mM Tris, and 65 mM DTT) and centrifuged at 25,000g for 1 h at 4°C. Protein concentrations were determined by the Bradford assay (Pierce, Rockford, IL) (Bradford 1976). Five samples per cell line were prepared from individual cell cultures. All samples were stored at −80°C prior to electrophoresis.
2-DE and silver-staining
2-DE was performed as described previously with some modifications (Li et al. 2006), using the IPGphor IEF System and Hoefer SE 600 (Amersham Biosciences, Uppsala, Sweden). Total proteins (170 μg) were run in IEF using a 13-cm pH 3–10 NL IPG strips (Amersham Biosciences). After rehydration for 12 h, focusing was initiated at 200 V for 1 h, 500 V for 1 h, and 1,000 V for 1 h, 5,000 V for 1 h, and then gradually increased to 8,000 V for 1 h in IPGphor. The total Vh was 50,000–55,000. After IEF separation, the gel strip was equilibrated with buffer I (6 M urea, 30% glycerol, 2% SDS, 1% DTT) and then buffer II (6 M urea, 30% glycerol, 2% SDS, 2.5% Iodoacetamide) each for 15 min. The equilibrated gel strip was placed on the top of a 12% SDS-PAGE gel and sealed with 0.5% agarose containing a little bromophenol blue. SDS-PAGE was performed for 60 min at a constant current of 11 mA per gel and then 25 mA per gel until the bromophenol blue reached the bottom of the gels. Proteins were detected by a modified silver-staining method compatible with MS analysis (Yan et al. 2000).
Image analysis
The silver-stained 2-D gels were scanned at an optical resolution of 84.7 mm per pixel using a GS-710 imaging densitometer (BioRad) in transmissive mode. Spot detection, quantification, and matching were performed using the PD Quest 7.1 software package (Bio-Rad). A matchset including all five batches of MDA-MB-231 and MDA-MB-231HM gels was built. A reference gel was selected from one of the MDA-MB-231HM gels, and unmatched protein spots of the member gels were automatically added to the reference gel. The individual protein spot quantity was normalized according to the following method: the raw quantity of each spot in a member gel was divided by the total quantity of the valid spots in the gel (i.e., all the spots in the gel minus canceled spots) and expressed as ppm. Quantitative analysis was performed using the Student’s t test between MDA-MB-231 and MDA-MB-231HM gels.
Protein digestions
The spots of the differentially expressed proteins were manually excised with a scalpel from the preparative gels stained with silver, each slice was cut into small pieces and placed into 0.5 mL siliconized tubes. In-gel digestion was performed as described by Shevchenko et al. (1996). Protein spots were excised from gels, destained for 20 min in 30 mM potassium ferricyanide/100 mM sodium thiosulfate (1:1; v/v), and washed in Milli-Q water until the gels became clear. The spots were kept in 0.2 M NH4HCO3 for 20 min, dried by lyophilization, and digested overnight in 12.5 ng/mL trypsin in 0.1 M NH4HCO3. The peptides were extracted three times with 50% ACN, 0.1% TFA, and dried in vacuo.
Protein identification by MALDI-MS and LC-ESI-MS/MS
The peptide eluate (0.5 μL) was applied to a MALDI target and overlaid with 0.5 mL CHCA (10 mg/mL in 60% ACN, 0.1% TFA). MALDI-TOF MS and tandem TOF/TOF MS was performed on a 4700 MALDI-TOF/TOF Proteomics Analyzer (Applied Biosystems, Foster City, CA, USA). The peptide mass profiles were compared with the theoretical peptide masses using the MASCOT (http://www.matrixscience.com) search engine and IPI-HUMAN database for protein identification.
The other peptide solutions from smaller gel spots were dried thoroughly using a vacuum centrifuge and then resuspended with 5% ACN in 0.1% formic acid, separated by nanoLC and analyzed by on-line electrospray tandem mass spectrometry. The experiments were performed on a Nano Aquity UPLC system (Waters Corporation, Milford, USA) connected to an LTQ Orbitrap XL mass spectrometer (Thermo Electron Corp., Bremen, Germany) equipped with an online nanoelectrospray ion source (Michrom Bioresources, Auburn, USA). The separation of the peptides was performed in a Symmetry® C18, 5 μm, 180 μm id × 2 cm trap-column and a BEH300 C18, 1.7 μm, 75 μm id × 20 cm reverse phase column (Waters Corporation, Milford, USA). The peptide mixtures were injected onto the trap-column with a flow of 15 μl/min for 2 min and subsequently eluted with a linear gradient. Starting from 5% B to 45% B in 45 min (A: water with 0.1% formic acid; B: ACN with 0.1% formic acid). The column was re-equilibrated at initial conditions for 15 min. The column flow rate was maintained at 300 nL/min and column temperature was maintained at 35°C. The electrospray voltage of 1.1 kV versus the inlet of the mass spectrometer was used. LTQ Orbitrap XL mass spectrometer was operated in the data-dependent mode to switch automatically between MS and MS/MS acquisition. Survey full-scan MS spectra with two microscans (m/z 300–1,800) were acquired in the Obitrap with a mass resolution of 100,000 at m/z 400, followed by eight sequential LTQ-MS/MS scans. Dynamic exclusion was used with two repeat counts, 10-s repeat duration, and 60-s exclusion duration. For MS/MS, precursor ions were activated using 25% normalized collision energy at the default activation q of 0.25. All MS/MS spectrums were identified by using SEQUEST [v.28 (revision 12), Thermo Electron Corp.] against the human international protein index (IPI) database (IPI human v3.45 fasta with 71,983 entries). To reduce false positive identification results, a decoy database containing the reverse sequences was appended to the database. The searching parameters were setup as follows: partial trypsin (KR) cleavage with two missed cleavage was considered, the variable modification was oxidation of methionine, the peptide mass tolerance was 20 ppm, and the fragment ion tolerance was 1 Da. Trans Proteomic Pipeline software (revision 4.0) (Institute of Systems Biology, Seattle, WA) was then utilized to identify proteins based upon corresponding peptide sequences with ≧95% confidence. The peptide results were filtered by Peptide Prophet (Keller et al. 2002) with a p value over 0.95 and a Protein Prophet (Nesvizhskii et al. 2003) probability of 0.95 was used for the protein identification results.
Western blotting analysis
Western blotting analysis was performed according to the published method with some modifications (Hou et al. 2004). Proteins (60 μg) from MDA-MB-231HM and MDA-MB-231 cells were separated using 12% SDS-PAGE, and transferred to PVDF for Western blotting. Membranes were blocked by 5% BSA in PBS (containing 0.05% Tween 20). The membranes were incubated with specific polyclonal antibody against profiling (Alexis Biochemicals, Lausanne, Switzerland) or GAPDH. Secondary antibodies were anti-rabbit IgG and anti-mouse IgG, respectively. Antibody dilutions were 1:500–1,000. Antibody complexes were detected by chemiluminescence using the ECL kit. The bands were scanned and quantified by Total Lab 2.01 (Nonlinear Dynamics Ltd, USA), and normalized by that of GAPDH.
Immunohistochemistry (IHC)
To further investigate the functional relevance of these identified proteins in clinical breast cancer metastasis, IHC analysis was performed in 60 breast cancer donors. All 30 lymph node-negative human breast infiltrating ductal carcinoma (IDCA) specimens as well as 30 matched lymph node-positive IDCA from fully informed and consenting donors were obtained after surgical resection from Breast Cancer Institute tissue banking facility. The study was also approved by Fudan University Office of Human Subjects Research. Histopathological diagnosis and lymph node status determined by routine pathological examination of dissected axially lymph nodes were confirmed for each specimen by the same experienced breast cancer pathologist. At least six dissected lymph nodes were histologically examined in all of the node-negative cases. The blocks of paraffin-embedded tissue sections were first sectioned and fixed onto glass slides, followed by baking for 2 h at 80°C. Tissues were de-paraffinized with xylene for three times, then by a series of ethanol (100, 100, 95, 95, 80, and 70%), followed by rinsing with water for 5 min. Antigen retrieval was carried out by putting the slides into boiling citrate buffer (100°C) for 15 min, and 0.5% H2O2 was used to quench endogenous peroxidase interference. After washing with PBS for three times, primary rabbit anti-human transgelin-2 antibody at a dilution of 1:50 was added to each sample, followed by incubation for 3 h at room temperature (RT). After rinsing in PBS three times, the slides were incubated with horseradish peroxidase-conjugated goat anti-rabbit IgG secondary antibody for 2 h at RT, then washed in PBS three times. Finally, the slides were incubated with DAB for 10 min; then, the slides were counterstained with hematoxylin for 3 min, and rinsed with water. The immunohistochemistry results were obtained through microscopic analysis of the slides by a pathologist. Positive staining was categorized as “+” if over 25% of the tumor cells showed positive immunoreactivity and as “−” if stained otherwise as described previously (Ding et al. 2004). The software of SPSS 11.5 for Windows was used for statistical analyses. All tests were two-tailed, and p < 0.05 was considered statistically significant.
Results
Characterization of the MDA-MB-231HM cell line
After MDA-MB-231HM cells were isolated, the karyotype of the cells was analyzed by Giemsa chromosome banding stain. All the MDA-MB-231HM cells exhibited X-shaped chromosomes, which is completely different from V-shaped chromosomes of mice (Fig. 1). To validate the MDA-MB-231HM cells on the invasive potential, we did in vitro invasion assay to quantify the invasion ability. We found that MDA-MB-231HM cells were highly invasive compared with parental MDA-MB-231 cells after 24 h by culturing in transwell (p < 0.05) (Fig. 2a, b). The model system is characterized by orthotopic tumor growth and the significantly enhanced pulmonary metastatic potential. A highly metastatic variant of parental MDA-MB-231 cell line, designated MDA-MB-231HM, was derived within the presented model system by six cycles of in vivo stepwise selection. In MDA-MB-231HM, spontaneous pulmonary metastases from an orthotopic primary tumor develop in 100% of mice as compared with parental MDAMB-231, whereas less than 30% of mice develop metastases by 4 weeks of postinoculation (Fig. 3).
Fig. 1.
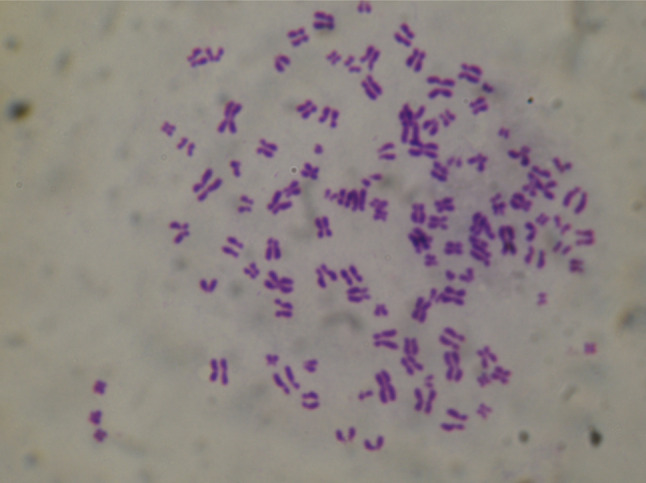
Karyotype analysis of MDA-MB231HM cells by Giemsa chromosome banding stain (×100)
Fig. 2.

a Representative microphotographs of invasive comparison of MDA-MB-231 cells and MDA-MB-231HM cells through respective Matrigel-coated transwell membranes (×200). b Invasive cell numbers per field of MDA-MB-231 cells and MDA-MB-231HM cells after 24 h
Fig. 3.

a Representative microphotographs of pulmonary metastasis lesions from BALB/c-nu/nu athymic mice bearing MDA-MB-231 and MDA-MB-231HM tumors. (H.E., ×100). b Statistical analysis for the number of lung metastasis deposits from the athymic mice bearing the both tumors after 5 weeks, p < 0.05
Proteome differential expression between MDA-MB-231HM and parental MDA-MB-231 cells
The 2-DE was performed at least three times for each cell line to ensure reproducibility. More than 1,200 protein spots were detected on the silver-stained gel by Image-Master (1,236 ± 32 spots in MDA-MB-231 cells, 1,426 ± 23 in MDA-MB-231HM cells) (Fig. 4). Many distinct different protein spots altered more than twofold between the two kinds of cells were excised from the silver-stained gel, and in-gel digestion with trypsin was then carried out to analyze extracted peptides with online MALDI-TOF–MS/MS and LC-ESI-MS/MS. We focused on 10 protein spots (Tables 1, 2) that showed statistically significant variations (p < 0.05). Figure 5 shows the enlarged images of these 10 protein spots. Among them, spot 5 was down-regulated and another nine were up-regulated in MDA-MB-231HM cell line. Figure 6 shows MS and MS/MS spectra for spot 1 (CapG). Figure 7 shows MS and MS/MS map for spot 6 (STMN1).
Fig. 4.

Representative silver-stained 2-DE patterns of total cellular extracts from MDA-MB-231 (left) and MDA-MB-231HM (right) cells. Total proteins (170 μg) were applied to pH 3–10 nonlinear IPG strips (13 cm), and with 12% constant vertical SDS-PAGE as the second dimension. Gels were visualized by silver staining, and the resulting images were analyzed by PD Quest software. Protein Spots marked with a number indicate 10 proteins identified whose abundance changes when comparing MDA-MB-231 versus MDA-MB-231HM
Table 1.
Differentially expressed proteins in MDA-MB-231HM cells and MDA-MB-231 cells identified by MALDI-TOF/TOF–MS
| No. | Protein name | Score | Coverage (%) | Mr (kDa) | p |
|---|---|---|---|---|---|
| 1 | Macrophage-capping protein (CapG) | 265 | 23 | 38.494 | 5.88 |
| 2 | Galectin-1 | 97 | 33 | 14.706 | 5.34 |
| 3 | Chloride intracellular channel protein 1 | 83 | 50 | 26.906 | 5.09 |
| 4 | Endoplasmic reticulum protein ERp29 precursor | 73 | 35 | 28.975 | 6.77 |
| 5 | Transgelin-2 | 85 | 51 | 22.377 | 8.41 |
Table 2.
Differentially expressed proteins in MDA-MB-231HM cells and MDA-MB-231 cells identified by LC-ESI-MS/MS
| No. | Protein name | Probability | Cover percent (%) | Mr (kDa) | p |
|---|---|---|---|---|---|
| 6 | Stathmin-1 (STMN1) | 1 | 36.24 | 17.302 | 5.76 |
| 7 | Isoform 1 of Uridine-cytidine kinase 2(UCK2) | 1 | 50 | 29.281 | 6.30 |
| 8 | Rho GDP-dissociation inhibitor 2 (ARHGDIB) | 1 | 40.8 | 22.974 | 5.1 |
| 9 | Isocitrate dehydrogenase [NADP] cytoplasmic (IDH1) | 1 | 34.5 | 46.630 | 6.53 |
| 10 | NDRG1 Protein NDRG1 | 1 | 32.2 | 42.808 | 5.49 |
Fig. 5.

Differentially expressed protein spots in enlarged images. The pictures marked 1C–10C and 1 V–10 V correspond to the marked protein spots 1–10 in images of MDA-MB-231 (C) and MDA-MB-231HM (V) in Fig. 4. The differentially expressed protein spots are arrowed and marked with numbers accordingly
Fig. 6.

Mass spectrometry of the peptides derived from spots 1(CapG). Each spot was removed from the gel, and in-gel digestion was performed using trypsin. The digested peptides were analyzed by mass spectrometry using a 4700 proteomics analyzer. The results of MS (a) and MS/MS (b, c) analysis are shown
Fig. 7.

LC-ESI-MS/MS result for spot 6 (STMN1). a Spot 6 total ion chromatogram; b peptide MS map for spot 6 at 10.95 min; c MS/MS map for peptide 584.11
Verification of differentially expressed proteins by western blot and immunohistochemistry analyses
Three distinct different proteins were further validated by Western blotting (Fig. 8a, b). The Western blotting results showed that the expression levels of CapG and STMN1 were higher in MDA-MB-231HM. However, the expression level of transgelin-2 was significantly lower in MDA-MB-231HM. Table 3 shows correlation between transgelin-2 expression and the presence of lymph node-negative tissues (19/30) and lymph node-positive tissues (5/30). Figure 9 shows representative photographs of immunohistochemical analysis of transgelin-2 protein expression in human breast.
Fig. 8.

a Representative immunodetection of CAPG, transgelin-2, STMN1. Total proteins (60 μg) extracted from MDA-MB-231 and MDA-MB-231 HM cells were separated by 12% SDS-PAGE gels and transferred to PDVF membrane. Immunoblotting was performed by rabbit antihuman polyclonal antibodies against CAPG, transgelin-2, and STMN1, and detected by ECL. Equal protein loading was evidenced by detection of GAPDH level using a monoclonal mouse antihuman GAPDH antibody. b The relative expressions of transgelin-2, CAPG, STMN1 protein in above two groups of cells was normalized to the signal intensity of GAPDH as an internal control
Table 3.
Association of transgelin-2 with the presence of lymph node metastasis in breast cancer patients
| Patients | Total number of cases | Transgelin-2 | ||
|---|---|---|---|---|
| + | − | |||
| LN (+) | 30 | 5 | 25 | p < 0.05 |
| LN (−) | 30 | 19 | 11 | |
LN (−) lymph node-negative patients, LN (+) lymph node-positive patients
Fig. 9.

Representative photographs of immunohistochemical analysis of transgelin-2 protein expression in human breast. All tissues were counterstained with hematoxylin and viewed by light microscopy (×100). Transgelin-2 expression in lymph node-negative tissues (a) and lymph node-positive tissues (b)
Discussion
Cancer metastasis is a complicated process involved in the coordinate expression of multiple genes (Hurst et al. 2008). Proteomics can just be used to study the global changes in protein expression in disease processes, cellular processes, and networks (Blackstock and Weir 1999). In the present study, our proteomic analysis revealed 10 different proteins which include Macrophage-capping protein (CapG), Stathmin-1 (STMN1), transgelin-2, Galectin-1, Chloride intracellular channel protein 1, Endoplasmic reticulum protein ERp29 precursor, Isoform 1 of Uridine–cytidine kinase 2 (UCK2), Rho GDP-dissociation inhibitor 2 (ARHGDIB), Isocitrate dehydrogenase [NADP] cytoplasmic (IDH1), and N-myc downstream regulated gene 1 (NDRG1) protein. These proteins are more or less expressed differently between MDA-MB-231HM cell line and its parental cell MDA-MB-231. We focus our attention on the five proteins: (1) The CapG protein is an actin filament end capping, Ca(2+)- and polyphosphoinositide-binding protein of the gelsolin family (Renz et al. 2008). It is distributed both in the cytoplasm and in the nucleus (Onoda et al. 1993). CapG can make important contributions to actin-driven motility by binding and capping actin filaments to limit the rapidly growing ends of actin filaments, because short filaments are stiffer than long filaments and can more effectively push on the membrane (Pollard and Borisy 2003). There were some reports revealing that CapG is overexpressed in breast cancer, ovarian and pancreatic cancer, and glioblastoma and ocular melanoma (Dahl et al. 2005; Thompson et al. 2007; Lal et al. 1999; Van Ginkel et al. 1998). Melanoma and glioblastoma are two examples of aggressive cancers killing the patients by metastasis and local invasion, respectively. Renz et al. (2008) reported that CapG knockdown reduces invasiveness of the MDA-MB-231 cells significantly as assessed in Matrigel invasion assay. Invasion of cancer cells usually is the prelude of their metastasis. Furthermore, our results revealed that MDA-MB-231HM cell line with higher metastasis potential expressed more CapG protein than its parental cell MDA-MB-231, which suggests CapG can promote metastasis of breast cancer; (2) Transgelin is a ubiquitous 22 kDa protein among smooth muscle tissues of normal adult vertebrates (Li et al. 2008). Recent evidence indicated transgelin can prevent androgen receptor co-activator to bind with androgen receptor and inhibit androgen-stimulated cell growth in prostate cancer cells (Yang et al. 2007). In addition, Nair et al. (2006) reported that transgelin played a tumor suppressive role in certain cells, because it can interfere with ERK activation and AP-1 signaling to decrease the expression of MMP-9, which is extremely involved in invasiveness of cancer. Our results exhibited transgelin-2 was down-regulated in MDA-MB-231HM cells, which suggests MDA-MB-231HM may exhibit higher invasiveness and is consistent with the phenotype of higher metastasis potential of MDA-MB-231HM cells. More interestingly, in our immunohistochemical analysis, we also demonstrated that transgelin-2 was lowly expressed in lymph node-positive IDCA tissues; which suggests transgelin-2 may be negatively correlated to breast cancer metastasis; (3) Stathmin1 (STMN1), also called oncoprotein 18, is a 149 amino acid ubiquitous cytosolic phosphoprotein (Rana et al. 2008) and involved in microtubule dynamics that is needed for mitosis (Belmont and Mitchison 1996). Baldassarre et al. (2005) reported p27 expression can inhibit cell motility by binding to and limiting the function of the microtubule (MT)-destabilizing protein stathmin in the cell cytoplasm, which suggested stathmin may be positively related to cancer metastasis. Furthermore, overexpression of stathmin has been associated with leukemia, breast, and ovarian cancer (Brattsand et al. 1993; Nylander et al. 1995; Rowlands et al. 1995; Ahn et al. 1999; Budde et al. 2001; Curmi et al. 2000; Price et al. 2000; Luo et al. 1994). Our data also reveal that Stathmin-1 was upregulated in MDA-MB-231HM cells, which implied that it exhibited higher malignancy; (4) NDRG1 (N-Myc downstream regulated gene 1), also named Drg-1 (Van Belzen et al. 1997), Cap43 (Nishio et al. 2008), RTP (Kurdistani et al. 1998), encodes a 394-amino acid protein with a molecular mass of 43 kDa (Nishio et al. 2008) and is most often localized in the nucleus, cytoplasm, cell membrane, and intracellular organelles (Lachat et al. 2002). Its regulation is somewhat complex, governed by hypoxia-inducible factor (HIF-1) and p53-dependent pathways (Ellen et al. 2008), as well as its namesake, N-Myc, and probably many other factors (such as hypoxia, cellular differentiation, heavy metal, and neoplasia), at the transcriptional and translational levels, and through mRNA stability (Lachat et al. 2002). As to carcinogenesis, it has been controversial whether over-expression of NDRG1 inhibits or promotes cancer metastasis. NDRG1 is expressed at lower levels in colon cancer than in normal tissue, as is the case in breast and prostate cancers. However, there are many other reports that NDRG1 is over-expressed in a variety of cancers, including lung, brain, melanoma, liver, prostate, breast, and renal cancer (Cangul et al. 2002). Our data is in agreement with the latter group of findings. Because NDRG1 is strongly upregulated by hypoxia (Cangul et al. 2002; Cangul 2004), maybe higher expression of NDRG1 offers an adaptive and protective mechanism for tumor cells to continue growing under anoxic environments which is a condition prevalent in solid tumors; (5) Rho GDP-dissociation inhibitor 2 (Rho-GDI 2), also known as Rho-GDI beta, is a member of the Rho-GDI family, Rho-GDIs bind to and stabilize GDP-bound form, thereby keeping the Rho protein inactive. It has been controversial whether Rho-GDI 2 inhibits or promotes cancer metastasis. Although Gildea et al. (2002) reported Rho-GDI 2 suppresses invasion and metastasis in bladder cancer, Schunke et al. (2007) recently reported that Rho-GDI2 can stimulate tumor progression by enhancing cox-2 expression. Our data about upregulated Rho-GDI2 expression in MDA-MB-231HM cells tend to support the latter study. In the near future, Immunohistochemical analysis of breast tumor tissues besides transgelin-2 and molecular validation of functions will be needed.
Electronic supplementary material
Below is the link to the electronic supplementary material.
Representative protein spot 1(CapG) was up-regulated in MDA-MB-231 HM cells, which can be repeated in at least 3 experiments (PPT 379 kb)
Representative protein spot 4(ERp29) was up-regulated in MDA-MB-231 HM cells, which can be repeated in at least 3 experiments (PPT 394 kb)
Representative protein spot 6(STMN1) was up-regulated in MDA-MB-231 HM cells, which can be repeated in at least 3 experiments (PPT 567 kb)
References
- Ahn J, Murphy M, Kratowicz S, Wang A, Levine AJ, George DL (1999) Down-regulation of the stathmin/Op18 and FKBP25 genes following p53 induction. Oncogene 18:5954–5958 [DOI] [PubMed] [Google Scholar]
- Albini A, Iwamoto Y, Kleinman HK, Martin GR, Aaronson SA, Kozlowski JM, McEwan RN (1987) A rapid in vitro assay for quantitating the invasive potential of tumor cells. Cancer Res 47:3239–3245 [PubMed] [Google Scholar]
- Baldassarre G, Belletti B, Nicoloso MS, Schiappacassi M, Vecchione A, Spessotto P, Morrione A, Canzonieri V, Colombatti A (2005) p27(Kip1)-stathmin interaction influences sarcoma cell migration and invasion. Cancer Cell 7:51–63 [DOI] [PubMed] [Google Scholar]
- Belmont LD, Mitchison TJ (1996) Identification of a protein that interacts with tubulin dimers and increases the catastrophe rate of microtubules. Cell 84:623–631 [DOI] [PubMed] [Google Scholar]
- Blackstock WP, Weir MP (1999) Proteomics: quantitative and physical mapping of cellular proteins. Trends Biotechnol 17:121–127 [DOI] [PubMed] [Google Scholar]
- Bradford MM (1976) A rapid and sensitive method for the quantitation of microgram quantities of protein utilizing the principle of protein-dye binding. Anal Biochem 72:248–254 [DOI] [PubMed] [Google Scholar]
- Brattsand G, Roos G, Marklund U, Ueda H, Landberg G, Nånberg E, Sideras P, Gullberg M (1993) Quantitative analysis of the expression and regulation of an activation-regulated phosphoprotein (oncoprotein 18) in normal and neoplastic cells. Leukemia 7:569–579 [PubMed] [Google Scholar]
- Budde PP, Kumagai A, Dunphy WG, Heald R (2001) Regulation of Op18 during spindle assembly in Xenopus egg extracts. J Cell Biol 153:149–158 [DOI] [PMC free article] [PubMed] [Google Scholar]
- Cangul H (2004) Hypoxia upregulates the expression of the NDRG1 gene leading to its overexpression in various human cancers. BMC Genet 5:27 [DOI] [PMC free article] [PubMed] [Google Scholar]
- Cangul H, Salnikow K, Yee H, Zagzag D, Commes T, Costa M (2002) Enhanced overexpression of an HIF-1/hypoxia-related protein in cancer cells. Environ Health Perspect 110:783–788 [DOI] [PMC free article] [PubMed] [Google Scholar]
- Christgen M, Lehmann U (2007) MDA-MB-435: the questionable use of a melanoma cell line as a model for human breast cancer is ongoing. Cancer Biol Ther 6:1355–1357 [DOI] [PubMed] [Google Scholar]
- Curmi PA, Noguès C, Lachkar S, Carelle N, Gonthier MP, Sobel A, Lidereau R, Bièche I (2000) Overexpression of stathmin in breast carcinomas points out to highly proliferative tumours. Br J Cancer 82:142–150 [DOI] [PMC free article] [PubMed] [Google Scholar]
- Dahl E, Sadr-Nabavi A, Klopocki E, Betz B, Grube S, Kreutzfeld R, Himmelfarb M, An HX, Gelling S, Klaman I, Hinzmann B, Kristiansen G, Grützmann R, Kuner R, Petschke B, Rhiem K, Wiechen K, Sers C, Wiestler O, Schneider A, Höfler H, Nährig J, Dietel M, Schäfer R, Rosenthal A, Schmutzler R, Dürst M, Meindl A, Niederacher D (2005) Systematic identification and molecular characterization of genes differentially expressed in breast and ovarian cancer. J Pathol 205:21–28 [DOI] [PubMed] [Google Scholar]
- Ding SJ, Li Y, Tan YX, Jiang MR, Tian B, Liu YK, Shao XX, Ye SL, Wu JR, Zeng R, Wang HY, Tang ZY, Xia QC (2004) From proteomic analysis to clinical significance: overexpression of cytokeratin 19 correlates with hepatocellular carcinoma metastasis. Mol Cell Proteomics 3:73–81 [DOI] [PubMed] [Google Scholar]
- Ellen TP, Ke Q, Zhang P, Costa M (2008) NDRG1, a growth and cancer related gene: regulation of gene expression and function in normal and disease states. Carcinogenesis 29:2–8 [DOI] [PubMed] [Google Scholar]
- Ellison G, Klinowska T, Westwood RF, Docter E, French T, Fox JC (2002) Further evidence to support the melanocytic origin of MDA-MB-435. Mol Pathol 55:294–299 [DOI] [PMC free article] [PubMed] [Google Scholar]
- Feng JT, Liu YK, Song HY, Dai Z, Qin LX, Almofti MR, Fang CY, Lu HJ, Yang PY, Tang ZY (2005) Heat-shock protein 27: a potential biomarker for hepatocellular carcinoma identified by serum proteome analysis. Proteomics 5:4581–4588 [DOI] [PubMed] [Google Scholar]
- Fisher B, Dignam J, Bryant J, Wolmark N (2001) Five versus more than five years of tamoxifen for lymph node-negative breast cancer: updated findings from the National Surgical Adjuvant Breast and Bowel Project B-14 randomized trial. J Natl Cancer Inst 93:684–690 [DOI] [PubMed] [Google Scholar]
- Gildea JJ, Seraj MJ, Oxford G, Harding MA, Hampton GM, Moskaluk CA, Frierson HF, Conaway MR, Theodorescu D (2002) RhoGDI2 is an invasion and metastasis suppressor gene in human cancer. Cancer Res 62:6418–6423 [PubMed] [Google Scholar]
- Hou YF, Yuan ST, Li HC, Wu J, Lu JS, Liu G, Lu LJ, Shen ZZ, Ding J, Shao ZM (2004) ERbeta exerts multiple stimulative effects on human breast carcinoma cells. Oncogene 23:5799–5806 [DOI] [PubMed] [Google Scholar]
- Howell A, Cuzick J, Baum M, Buzdar A, Dowsett M, Forbes JF, Hoctin-Boes G, Houghton J, Locker GY, Tobias JS, ATAC Trialists’ Group (2005) Results of the ATAC (Arimidex, Tamoxifen, alone or in combination) trial after completion of 5 years’ adjuvant treatment for breast cancer. Lancet 365:60–62 [DOI] [PubMed] [Google Scholar]
- Hurst DR, Xie Y, Vaidya KS, Mehta A, Moore BP, Accavitti-Loper MA, Samant RS, Saxena R, Silveira AC, Welch DR (2008) Alterations of BRMS1–ARID4A interaction modify gene expression but still suppress metastasis in human breast cancer cells. J Biol Chem 283:7438–7444 [DOI] [PMC free article] [PubMed] [Google Scholar]
- Keller A, Nesvizhskii AI, Kolker E, Aebersold R (2002) Empirical statistical model to estimate the accuracy of peptide identifications made by MS/MS and database search. Anal Chem 74:5383–5392 [DOI] [PubMed] [Google Scholar]
- Kurdistani SK, Arizti P, Reimer CL, Sugrue MM, Aaronson SA, Lee SW (1998) Inhibition of tumor cell growth by RTP/rit42 and its responsiveness to p53 and DNA damage. Cancer Res 58:4439–4444 [PubMed] [Google Scholar]
- Lachat P, Shaw P, Gebhard S, van Belzen N, Chaubert P, Bosman FT (2002) Expression of NDRG1, a differentiation-related gene, in human tissues. Histochem Cell Biol 118:399–408 [DOI] [PubMed] [Google Scholar]
- Lal A, Lash AE, Altschul SF, Velculescu V, Zhang L, McLendon RE, Marra MA, Prange C, Morin PJ, Polyak K, Papadopoulos N, Vogelstein B, Kinzler KW, Strausberg RL, Riggins GJ (1999) A public database for gene expression in human cancers. Cancer Res 59:5403–5407 [PubMed] [Google Scholar]
- Li DQ, Wang L, Fei F, Hou YF, Luo JM, Wei-Chen, Zeng R, Wu J, Lu JS, Di GH, Ou ZL, Xia QC, Shen ZZ, Shao ZM (2006) Identification of breast cancer metastasis-associated proteins in an isogenic tumor metastasis model using two-dimensional gel electrophoresis and liquid chromatography-ion trap-mass spectrometry. Proteomics 6:3352–3368 [DOI] [PubMed] [Google Scholar]
- Li M, Li S, Lou Z, Liao X, Zhao X, Meng Z, Bartlam M, Rao Z (2008) Crystal structure of human transgelin. J Struct Biol 162:229–236 [DOI] [PubMed] [Google Scholar]
- Liu YF, Xiao ZQ, Li MX, Li MY, Zhang PF, Li C, Li F, Chen YH, Yi H, Yao HX, Chen ZC (2009) Quantitative proteome analysis reveals annexin A3 as a novel biomarker in lung adenocarcinoma. J Pathol 217:54–64 [DOI] [PubMed] [Google Scholar]
- Luo XN, Mookerjee B, Ferrari A, Mistry S, Atweh GF (1994) Regulation of phosphoprotein p18 in leukemic cells. Cell cycle regulated phosphorylation by p34cdc2 kinase. J Biol Chem 269:10312–10318 [PubMed] [Google Scholar]
- Nair RR, Solway J, Boyd DD (2006) Expression cloning identifies transgelin (SM22) as a novel repressor of 92-kDa type IV collagenase (MMP-9) expression. J Biol Chem 281:26424–26436 [DOI] [PubMed] [Google Scholar]
- Nesvizhskii AI, Keller A, Kolker E, Aebersold R (2003) A statistical model for identifying proteins by tandem mass spectrometry. Anal Chem 75:4646–4658 [DOI] [PubMed] [Google Scholar]
- Nishio S, Ushijima K, Tsuda N, Takemoto S, Kawano K, Yamaguchi T, Nishida N, Kakuma T, Tsuda H, Kasamatsu T, Sasajima Y, Kage M, Kuwano M, Kamura T (2008) Cap43/NDRG1/Drg-1 is a molecular target for angiogenesis and a prognostic indicator in cervical adenocarcinoma. Cancer Lett 264:36–43 [DOI] [PubMed] [Google Scholar]
- Nylander K, Marklund U, Brattsand G, Gullberg M, Roos G (1995) Immunohistochemical detection of oncoprotein 18 (Op18) in malignant lymphomas. Histochem J 27:155–160 [DOI] [PubMed] [Google Scholar]
- Onoda K, Yu FX, Yin HL (1993) gCap39 is a nuclear and cytoplasmic protein. Cell Motil Cytoskelet 26:227–238 [DOI] [PubMed] [Google Scholar]
- Pollard TD, Borisy GG (2003) Cellular motility driven by assembly and disassembly of actin filaments. Cell 112:453–465 [DOI] [PubMed] [Google Scholar]
- Price DK, Ball JR, Bahrani-Mostafavi Z, Vachris JC, Kaufman JS, Naumann RW, Higgins RV, Hall JB (2000) The phosphoprotein Op18/stathmin is differentially expressed in ovarian cancer. Cancer Invest 18:722–730 [DOI] [PubMed] [Google Scholar]
- Rae JM, Ramus SJ, Waltham M, Armes JE, Campbell IG, Clarke R, Barndt RJ, Johnson MD, Thompson EW (2004) Common origins of MDA-MB-435 cells from various sources with those shown to have melanoma properties. Clin Exp Metastasis 21:543–552 [DOI] [PubMed] [Google Scholar]
- Rae JM, Creighton CJ, Meck JM, Haddad BR, Johnson MD (2007) MDA-MB-435 cells are derived from M14 melanoma cells–a loss for breast cancer, but a boon for melanoma research. Breast Cancer Res Treat 104:13–19 [DOI] [PubMed] [Google Scholar]
- Rana S, Maples PB, Senzer N, Nemunaitis J (2008) Stathmin 1: a novel therapeutic target for anticancer activity. Expert Rev Anticancer Ther 8:1461–1470 [DOI] [PubMed] [Google Scholar]
- Renz M, Betz B, Niederacher D, Bender HG, Langowski J (2008) Invasive breast cancer cells exhibit increased mobility of the actin-binding protein CapG. Int J Cancer 122:1476–1482 [DOI] [PubMed] [Google Scholar]
- Rowlands DC, Williams A, Jones NA, Guest SS, Reynolds GM, Barber PC, Brown G (1995) Stathmin expression is a feature of proliferating cells of most, if not all, cell lineages. Lab Invest 72:100–113 [PubMed] [Google Scholar]
- Schunke D, Span P, Ronneburg H, Dittmer A, Vetter M, Holzhausen HJ, Kantelhardt E, Krenkel S, Müller V, Sweep FC, Thomssen C, Dittmer J (2007) Cyclooxygenase-2 is a target gene of rho GDP dissociation inhibitor beta in breast cancer cells. Cancer Res 67:10694–10702 [DOI] [PubMed] [Google Scholar]
- Shevchenko A, Wilm M, Vorm O, Mann M (1996) Mass spectrometric sequencing of proteins silver-stained polyacrylamide gels. Anal Chem 68:850–858 [DOI] [PubMed] [Google Scholar]
- Thompson CC, Ashcroft FJ, Patel S, Saraga G, Vimalachandran D, Prime W, Campbell F, Dodson A, Jenkins RE, Lemoine NR, Crnogorac-Jurcevic T, Yin HL, Costello E (2007) Pancreatic cancer cells overexpress gelsolin family-capping proteins, which contribute to their cell motility. Gut 56:95–106 [DOI] [PMC free article] [PubMed] [Google Scholar]
- Van Belzen N, Dinjens WN, Diesveld MP, Groen NA, van der Made AC, Nozawa Y, Vlietstra R, Trapman J, Bosman FT (1997) A novel gene which is up-regulated during colon epithelial cell differentiation and down-regulated in colorectal neoplasms. Lab Invest 77:85–92 [PubMed] [Google Scholar]
- Van Ginkel PR, Gee RL, Walker TM, Hu DN, Heizmann CW, Polans AS (1998) The identification and differential expression of calcium-binding proteins associated with ocular melanoma. Biochim Biophys Acta 1448:290–297 [DOI] [PubMed] [Google Scholar]
- Weigelt B, Peterse JL, van ‘t Veer LJ (2005) Breast cancer metastasis: markers and models. Nat Rev Cancer 5:591–602 [DOI] [PubMed] [Google Scholar]
- Yan JX, Wait R, Berkelman T, Harry RA, Westbrook JA, Wheeler CH, Dunn MJ (2000) A modified silver staining protocol for visualization of proteins compatible with matrix-assisted laser desorption/ionization and electrospray ionization-mass spectrometry. Electrophoresis 21:3666–3672 [DOI] [PubMed] [Google Scholar]
- Yang Z, Chang YJ, Miyamoto H, Ni J, Niu Y, Chen Z, Chen YL, Yao JL, di Sant’Agnese PA, Chang C (2007) Transgelin functions as a suppressor via inhibition of ARA54-enhanced androgen receptor transactivation and prostate cancer cell growth. Mol Endocrinol 21:343–358 [DOI] [PubMed] [Google Scholar]
Associated Data
This section collects any data citations, data availability statements, or supplementary materials included in this article.
Supplementary Materials
Representative protein spot 1(CapG) was up-regulated in MDA-MB-231 HM cells, which can be repeated in at least 3 experiments (PPT 379 kb)
Representative protein spot 4(ERp29) was up-regulated in MDA-MB-231 HM cells, which can be repeated in at least 3 experiments (PPT 394 kb)
Representative protein spot 6(STMN1) was up-regulated in MDA-MB-231 HM cells, which can be repeated in at least 3 experiments (PPT 567 kb)