

Abstract
Background:
Dynamic contrast-enhanced (DCE) MRI is useful for diagnosis and assessment of treatment response in breast cancer. Fast DCE MRI offers a higher sampling rate of contrast enhancement curves in comparison to conventional DCE MRI, potentially characterizing tumor perfusion kinetics more accurately for measurement of functional tumor volume (FTV) as a predictor of treatment response.
Purpose:
To investigate FTV by fast DCE MRI as a predictor of neoadjuvant systemic therapy (NAST) response in triple-negative breast cancer (TNBC).
Study Type:
Prospective.
Population/Subjects:
Sixty patients with biopsy-confirmed TNBC between December 2016 and September 2020.
Field Strength/Sequence:
A 3.0 T/3D fast spoiled gradient echo-based DCE MRI
Assessment:
Patients underwent MRI at baseline and after four cycles (C4) of NAST, followed by definitive surgery. DCE subtraction images were analyzed in consensus by two breast radiologists with 5 (A.H.A.) and 2 (H.S.M.) years of experience. Tumor volumes (TV) were measured on early and late subtractions. Tumors were segmented on 1 and 2.5-minute early phases subtractions and FTV was determined using optimized signal enhancement thresholds. Interpolated enhancement curves from segmented voxels were used to determine optimal early phase timing.
Statistical Tests:
Tumor volumes were compared between patients who had a pathologic complete response (pCR) and those who did not using the area under the receiver operating curve (AUC) and Mann–Whitney U test.
Results:
About 26 of 60 patients (43%) had pCR. FTV at 1 minute after injection at C4 provided the best discrimination between pCR and non-pCR, with AUC (95% confidence interval [CI]) = 0.85 (0.74,0.95) (P < 0.05). The 1-minute timing was optimal for FTV measurements at C4 and for the change between C4 and baseline. TV from the early phase at C4 also yielded a good AUC (95%CI) of 0.82 (0.71,0.93) (P < 0.05).
Data Conclusion:
FTV and TV measured at 1 minute after injection can predict response to NAST in TNBC.
Level of Evidence:
1
Technical Efficacy:
4
Triple-negative breast cancer (TNBC) accounts for approximately one-fifth of all breast cancers and is an aggressive subtype of the disease.1 Unlike other subtypes of breast cancer, TNBC does not respond to conventional hormone therapies and is typically treated with neoadjuvant systemic therapy (NAST).2 Unfortunately, less than half of TNBC patients respond to NAST.2 Patients without a pathologic complete response (pCR) to NAST have a high risk of recurrence and poor prognosis.3 Early prediction of NAST response in TNBC could be highly valuable because nonresponders could be triaged to alternative treatments for better outcomes.4
Dynamic contrast-enhanced (DCE) MRI has been reported useful for both initial diagnosis/staging and assessment of treatment response in breast cancer.5–7 In general, malignant breast lesions are highly vascular and exhibit rapid early enhancement (wash-in) followed by a rapid loss of enhancement (wash-out) in DCE MRI. The volume of the tumor regions displaying this fast wash-in/wash-out pattern, as selected by semi-quantitative enhancement ratio thresholds applied to the early and late phases of a DCE scan, has been defined as the functional tumor volume (FTV).8 FTV is assumed to represent the region of viable tumor cells and has been found useful for predicting treatment response.6,9 The definition of FTV is empirical and is adjusted to optimize its predictive performance through selection of optimal image enhancement thresholds.6 The optimal enhancement thresholds used for calculating FTV differ among different subtypes of breast cancer, including TNBC.10,11
Several recent studies have shown that assessment of breast lesion perfusion, specifically with rapid sampling of contrast uptake after contrast injection, is useful for screening and diagnosis.12–14 Because of the requirements for a large imaging volume and high spatial resolution, the temporal resolution of breast DCE MRI is typically limited to approximately 90–120 seconds per phase.13,15,16 Newer imaging techniques, which apply higher acceleration by parallel imaging and/or data sharing, can enable fast DCE MRI and allow acquisition of a large imaging volume in under 20 seconds.13,17 These techniques offer substantially faster sampling of the contrast enhancement curves and potentially more accurate characterization of the tumor perfusion kinetics than conventional DCE-MRI.18,19 One such method, Differential Sub sampling with Cartesian Ordering (DISCO), accelerates data acquisition by sharing views in k-space between a central “a-region” and one or multiple under-sampled outer “b-regions”.20 For semi-quantitative analysis, most prior work on FTV as a predictor of treatment response has been performed using conventional DCE MRI acquisitions with an early phase acquired at approximately 2.5 minutes after injection of contrast agent.8–11,21 Two other studies used early phase images with a 2-minute and 1.5-minute delay after injection.22,23 Rapid tumor enhancement has been shown to correlate with microvessel density and aggressiveness, and assessment of enhancement early after contrast injection by fast DCE MRI may be useful for measuring FTVs.12,24
This study aims to investigate FTV by fast DCE MRI as a predictor of neoadjuvant systemic therapy (NAST) response in triple-negative breast cancer (TNBC).
Materials and Methods
Patients
Treatment-naïve patients with biopsy-confirmed TNBC were enrolled between December 2016 and September 2020 in an Institutional Review Board–approved and Health Insurance Portability and Accountability Act–compliant prospective ongoing clinical trial (“A Robust TNBC Evaluation FraMework to Improve Survival” [ARTEMIS]; NCT02276442). The study patients were prospectively monitored for response to NAST. TNBC was defined from standard pathologic assays as negative for ER and PR (<10% tumor staining) and negative for HER2 (IHC score < 3, gene copy number not amplified). TNBC patients with clinical stage I–III who were scheduled to receive NAST with anthracycline/taxane-based regimens were included in this study. Any patients with stage IV disease prior to initiation of treatment were excluded. All patients provided written informed consent.
All patients received NAST consisting of dose-dense doxorubicin and cyclophosphamide for four cycles followed by paclitaxel, which was given every 2 weeks for four cycles or weekly for a total of 12 doses. All patients underwent an MRI scan at baseline (BL) before the initiation of NAST and a second scan after four cycles (C4) of the treatment. The minimum BL tumor size in all patients was1.0 cm as measured by clinical diagnostic ultrasound, as patients who did not meet this criterion were usually sent directly to surgery. All patients underwent surgery after the completion of NAST. Pathologic findings from surgery were used to classify patients as pCR or non-pCR. pCR was defined as no residual invasive disease in the surgical specimen.
MRI Acquisition
All MRI scans were conducted with the patients in a prone position using a GE 3.0-T MR750w whole body scanner (Waukesha, WI) with an 8-channel phased array bilateral breast coil. Each MRI scan included an axial T2-weighted series and an axial fast DCE MRI series. The fast DCE MRI series used the DISCO sequence with bipolar readouts for two-point Dixon processing to produce water-only and fat-only images for each acquired image.20 Typical scan parameters for the DISCO series in this study were as follows: field of view = 34 × 34 cm, slice thickness/slice spacing = 3.0/−1.5 mm, flip angle = 12°, repetition time/echo time 1/echo time 2 = 7.4/1.1/2.3 msec, matrix = 320 × 320, number of acquired slices = 60–115, in-plane spatial resolution = 0.6–0.8 mm, total acquisition time = 7 minutes, and Auto-calibrating Reconstruction for Cartesian imaging (ARC) factor = 3. DISCO parameters and typical phase timings were as follows: number of b-regions = 5, a-region fraction = 16%, time for fully sampled phase = 34 seconds, backwards view sharing, and time for DISCO accelerated phase = 11 seconds. After at least one mask phase was obtained, a single bolus of gadobutrol (Gadovist, Bayer HealthCare) contrast agent was injected (0.1 mL/kg at ~2 mL/second followed by saline flush) at the start of a DCE phase. Temporal resolution of the DISCO series had a median of 11 seconds and ranged from 8 seconds to 15.5 seconds, depending on the slice coverage.
MRI Analysis
Tumor size along the three orthogonal axes was measured separately on both early and late phase subtraction images. TV was calculated from the early and late phase measurements (TVEarly and TVLate) as the ellipsoid of the three dimensions (Figs. 1a and 2a):
| (1) |
where , and are the anteroposterior, craniocaudal, and transverse tumor dimensions, respectively. Additionally, the maximum of these three measurements was selected to represent the longest diameter (LD) of the tumor.
FIGURE 1:

Examples of tumor volume measurements in a 52-year-old woman with triple-negative breast cancer in her left breast: (a) tumor volume dimensions, (b) segmented enhanced tumor volume, and (c) enhancement threshold-based functional tumor volume in blue at percentage enhancement >130% and signal enhancement ratio > 1.1.
FIGURE 2:

Map of fast dynamic contrast-enhanced MRI data flow, processing, and segmentation for volume measurements: (a) tumor volume by 3D measurements (TV), (b) enhanced tumor volume (ETV) and functional tumor volume (FTV) from early phase segmentations, with percentage enhancement (PE) and signal enhancement ratio (SER) thresholds applied for FTV, and (c) FTV with optimization of early phase timing.
Two sets of images from the DISCO fast DCE MRI acquisition were selected as an early phase for segmentation based on their timing after injection. The phase closest to 1 minute after injection was chosen to show tumor contrast as early as possible after injection while allowing for inter-patient variability in contrast arrival. The phase closest to 2.5 minutes after injection was chosen to match with the earlier studies of FTV as reported in the literature.8–11,21 The final phase of the DCE scan, approximately 6–7 minutes after injection, was selected as the late phase for analysis.
Two breast radiologists, with 5 (A.H.A.) and 2 (H.S.M.) years of experience in breast MRI interpretation, were blinded to the patient clinical outcomes and performed semi-automatic consensus segmentation that encompasses the tumor in all slices. Tumors were first manually segmented on both 1-minute and 2.5-minute early phase subtraction images separately using Image-I, which is a graphic user interface-based in-house software developed for image analysis. Image-I features importing/exporting Digital Imaging and Communications in Medicine-compatible images as well as manual and semi-automatic contouring of image regions of interest.25 All segmentations were further refined by semi-automatic segmentation using the histogram thresholding in Image-I to exclude voxels below enhancement thresholds that were visually determined to be non-tumor by the radiologists. All segmentations were reviewed and confirmed by both radiologists to avoid inter-reader bias. Care was taken to exclude necrotic regions and regions with artifacts from the biopsy clips within the tumors.
Segmented tumor volumes on 1-minute and 2.5-minute subtractions were first extracted as the enhanced tumor volume (ETV; Figs. 1b and 2b). FTV was defined as a subset of the ETV voxels that were above a set percentage enhancement () threshold and below a set signal enhancement ratio (SER, Fig. 1b) threshold.8 and were defined as
| (2) |
| (3) |
where , and are the pixel intensity of the mask, early phase, and late phase images, respectively.
PE and SER thresholds were optimized to best discriminate between pCR and non-pCR patients by FTV (Fig. 1c) with early phase timings of 1 and 2.5 minutes. This optimization was performed separately for BL and C4 scans as well as the relative change between BL and C4 (%C4/BL).
| (4) |
Different combinations of PE thresholds (0%–220%, in increments of 5%) and SER thresholds (0–2.0, in increments of 0.05) were evaluated for calculating FTVs. Contour plots of the area under the receiver operating characteristic curve (AUC) for discriminating pCR from non-pCR were generated for FTVs across a grid of PE and SER thresholds. Optimal PE/SER values were selected as those producing the peak AUC on the contour plot, and optimized FTVs were extracted from all tumors using these thresholds (Fig. 2b).
Fast DCE enhancement curves were then used to search for optimal early phase timing (FTVOpt). Voxel enhancement curves were extracted from the segmentations on the 1-minute subtractions and were then temporally linearly interpolated into a shared frame with a sampling rate of 10 seconds per phase (with t = 0 seconds at injection). Signal levels at early phase timings from 10 seconds to 240 seconds in increments of 10 seconds were used to repeat FTV calculations across PE and SER thresholds for each early phase timing (Fig. 2c). Optimal early phase timing and PE/SER thresholds were taken from the coordinate of the peak AUC of this search and were used to calculate FTVOpt.
Statistical Analysis
For BL, C4, and %C4/BL, all volume measurements and LDs of the tumor were tested for their performance in discriminating pCR from non-pCR patients using the Mann–Whitney U Test and AUC in Matlab 2018b (Mathworks, Natick, MA). As the biomarkers in this study all measure tumor size and are highly positively correlated, the conventional Bonferroni procedure for correcting multiple comparisons would be overly conservative. Therefore, no correction was made for multiple comparisons. P values less than 0.05 were considered statistically significant.
Results
A total of 60 patients were enrolled, and their characteristics are provided in Table 1. Of the 60 patients, 26 (43%) had pCR and 34 (57%) did not have pCR. The results from all volume measurements and LD, as compared between the pCR and non-pCR groups, are presented in Tables 2 and 3.
TABLE 1.
Characteristics of Patients With TNBC Who Received Neoadjuvant Systemic Therapy (N = 60)
| Characteristic | No. (%) |
|---|---|
| Age | |
| Mean ± SD | 52 ± 12 years |
| Median (range) | 50 years (28–79 years) |
| Largest tumor diameter | |
| Mean ± SD | 4.6 ± 2.9 cm |
| Median (range) | 3.8 cm (1.3–9.8 cm) |
| Tumor stage | |
| I | 7 (12) |
| II | 36 (60) |
| III | 17 (28) |
| T category | |
| 1 | 11 (18) |
| 2 | 37 (62) |
| 3 | 11 (18) |
| 4 | 1 (2) |
| N category | |
| 0 | 34 (57) |
| 1 | 19 (32) |
| 2 | 1 (2) |
| 3 | 6 (10) |
| Type of surgery | |
| Total mastectomy | 20 (33) |
| Conservative surgery | 40 (67) |
| Treatment response | |
| pCR | 26 (43) |
| non-pCR | 34 (57) |
pCR, pathologic complete response; SD, standard deviation.
TABLE 2.
Longest Diameter, Tumor Volume, and Enhanced Tumor Volume Measurements for Patients Who Had a Pathologic Complete Response (pCR) and Those Who Did Not
| Measure | AUC [95% CI] | P | Mean ± SD | |
|---|---|---|---|---|
| pCR | Non-pCR | |||
| BL scan | ||||
| LDEarly | 0.62 [0.47,0.76] | 0.13 | 3.3 ± 1.7 cm | 3.9 ± 1.8 cm |
| LDLate | 0.59 [0.45,0.74] | 0.22 | 3.5 ± 1.6 cm | 4.1 ± 1.8 cm |
| TVEarly | 0.63 [0.49,0.77] | 0.085 | 19 ± 37 cm3 | 31 ± 49 cm3 |
| TVLate | 0.62 [0.48,0.77] | 0.11 | 21 ± 37 cm3 | 34 ± 53 cm3 |
| ETV1-min | 0.59 [0.45,0.74] | 0.23 | 15 ± 31 cm3 | 19 ± 24 cm3 |
| ETV2.5-min | 0.60 [0.46,0.75] | 0.18 | 15 ± 36 cm3 | 18 ± 22 cm3 |
| C4 scan | ||||
| LDEarly | 0.81 [0.70,0.93] | <0.05 | 0.80 ± 0.95 cm | 2.3 ± 1.4 cm |
| LDLate | 0.78 [0.65,0.90] | <0.05 | 1.1 ± 1.0 cm | 2.4 ± 1.5 cm |
| TVEarly | 0.82 [0.71,0.94] | <0.05 | 0.74 ± 1.7 cm3 | 7.7 ± 18 cm3 |
| TVLate | 0.82 [0.70,0.93] | <0.05 | 1.1 ± 2.3 cm3 | 9.0 ± 19 cm3 |
| ETV1-min | 0.79 [0.70,0.92] | <0.05 | 0.65 ± 1.6 | 4.0 ± 7.5 |
| ETV2.5-min | 0.79 [0.67,0.91] | <0.05 | 0.45 ± 1.0 | 3.9 ± 8.2 |
| %C4/BL | % change | % change | ||
| LDEarly | 0.76 [0.63,0.89] | <0.05 | -71% ± 33% | -38% ± 33% |
| LDLate | 0.74 [0.62,0.87] | <0.05 | -65% ± 31% | -36% ± 33% |
| TVEarly | 0.77 [0.65,0.90] | <0.05 | -91% ± 20% | -62% ± 46% |
| TVLate | 0.78 [0.67,0.90] | <0.05 | -90% ± 14% | -59% ± 50% |
| ETV1-min | 0.77 [0.65,0.90] | <0.05 | -93% ± 11% | -67% ± 37% |
| ETV2.5-min | 0.76 [0.63,0.88] | <0.05 | -92% ± 15% | -66% ± 38% |
AUC, area under the receiver operator characteristic curve; BL, baseline; CI, confidence interval; TV, clinical tumor volume; LD, longest diameter; C4, cycle 4.
TABLE 3.
Functional Tumor Volume Measurements in Patients With and Without Pathologic Complete Response (pCR)
| Measure | Optimal threshold | AUC [95% CI] | P | Mean ± SD volume, cm3 | ||
|---|---|---|---|---|---|---|
| pCR | Non-pCR | |||||
| BL Scan | ||||||
| FTV1-min | PE > 0 SER > 0 |
0.59 [0.45,0.74] | 0.23 | 15 ± 31 | 19 ± 24 | |
| FTV2.5-min | PE > 0 SER > 0 |
0.60 [0.46,0.75] | 0.18 | 15 ± 35 | 18 ± 22 | |
| FTVOpt | Early Phase = 30 s PE > 0 SER > 1.3 |
0.69 [0.55,0.82] | <0.05 | 0.12 ± 0.34 | 0.32 ± 0.62 | |
| C4 scan | ||||||
| FTV1-min | PE > 40 SER > 0.5 |
0.85 [0.74,0.95] | <0.05 | 0.12 ± 0.25 | 3.2 ± 6.2 | |
| FTV2.5-min | PE > 95 SER > 0.8 |
0.83 [0.72,0.94] | <0.05 | 0.17 ± 0.47 | 2.7 ± 5.4 | |
| FTVOpt | Early Phase = 60 s PE > 40 SER > 0.35 |
0.85 [0.75,0.96] | <0.05 | 0.13 ± 0.26 | 3.5 ± 7.2 | |
| %C4/BL | % change | % change | ||||
| FTV1-min | PE > 130 SER > 1.1 |
0.82 [0.71,0.93] | <0.05 | −99% ± 0.20% | −89% ± 7.0% | |
| FTV2.5-min | PE > 120 SER > 0.85 |
0.79 [0.66,0.91] | <0.05 | −93% ± 24% | −62% ± 63% | |
| FTVOpt | Early Phase = 60 s PE > 115 SER > 0.75 |
0.85 [0.74,0.95] | <0.05 | −100% ± 1.7% | −47% ± 110% | |
AUC, area under the receiver operator characteristic curve; BL, baseline; CI, confidence interval; NA, not applicable; ETV, enhanced tumor volume; FTV, functional tumor volume; PE, percentage enhancement; SER, signal enhancement ratio; Opt, optimal; C4, cycle 4.
TV and LD performed best as predictors of treatment response when measured on the C4 scans (Table 2, Fig. 3). Of these measurements, TVEarly at C4 performed best with an AUC (95% confidence interval [CI]) of 0.82 (0.71,0.94) (P < 0.05, Fig. 3c). TV and LD performance also performed well at %C4/BL, and none of the measures reached statistical significance at BL (minimum P = 0.085). In all cases, TV and LD showed stronger performance when measured on the early phase in comparison to the measurement on the late phase.
FIGURE 3:

Comparison of tumor volume (TV) by 3D measurements from early phase and late phase measurements (a,c,e) and enhanced tumor volume (ETV) from 1-minute and 2.5-minute early phase timings (b,d,f) between patients who had a pathologic complete response (pCR) and those who did not, at the baseline (BL) scan (a,b), cycle 4 (C4) scan (c,d), and %C4/BL (e,f).
ETV showed good performance at the C4 scan and % C4/BL (Table 2, Fig. 3). Top performance from ETV was achieved with an early phase timing of 1 minute at the C4 scan, with AUC (95%CI) = 0.79 (0.67,0.92) (P < 0.05; Fig. 3d). ETV did not reach a statistical significance at BL (P = 0.23 and 0.18 for the 1- and 2.5-minute early phase timings, respectively). Performance was similar between 1- and 2.5-minute early phase timings for all scans.
Optimal thresholds, AUC performance, and P values for FTV measurements are shown in Table 3. Top AUC performance was shown at the C4 scan by FTV with a 1-minute early phase timing and optimal contrast thresholds of PE ≥ 40% and SER ≥ 0.5 (AUC [95% CI] = 0.85 [0.74,0.95], P < 0.05). FTV optimization contour plots at C4 showed a broad plateau near the origin, and higher AUC is visible for the 1-minute early phase timing across high performing PE/SER thresholds (Fig. 4c,d). For %C4/BL, optimized FTV with a 1-minute early phase timing also performed better in terms of maximum AUC and in visual comparison of contour plots (Fig. 4e,f). At BL, the FTV optimization contour plots were similar between the two sets of early phase images in terms of maximum AUC and contour shape (Fig. 4a), though peak performance was achieved for both early phase timings with PE/SER thresholds of 0/0 and no statistical significance was observed (minimum P = 0.18).
FIGURE 4:
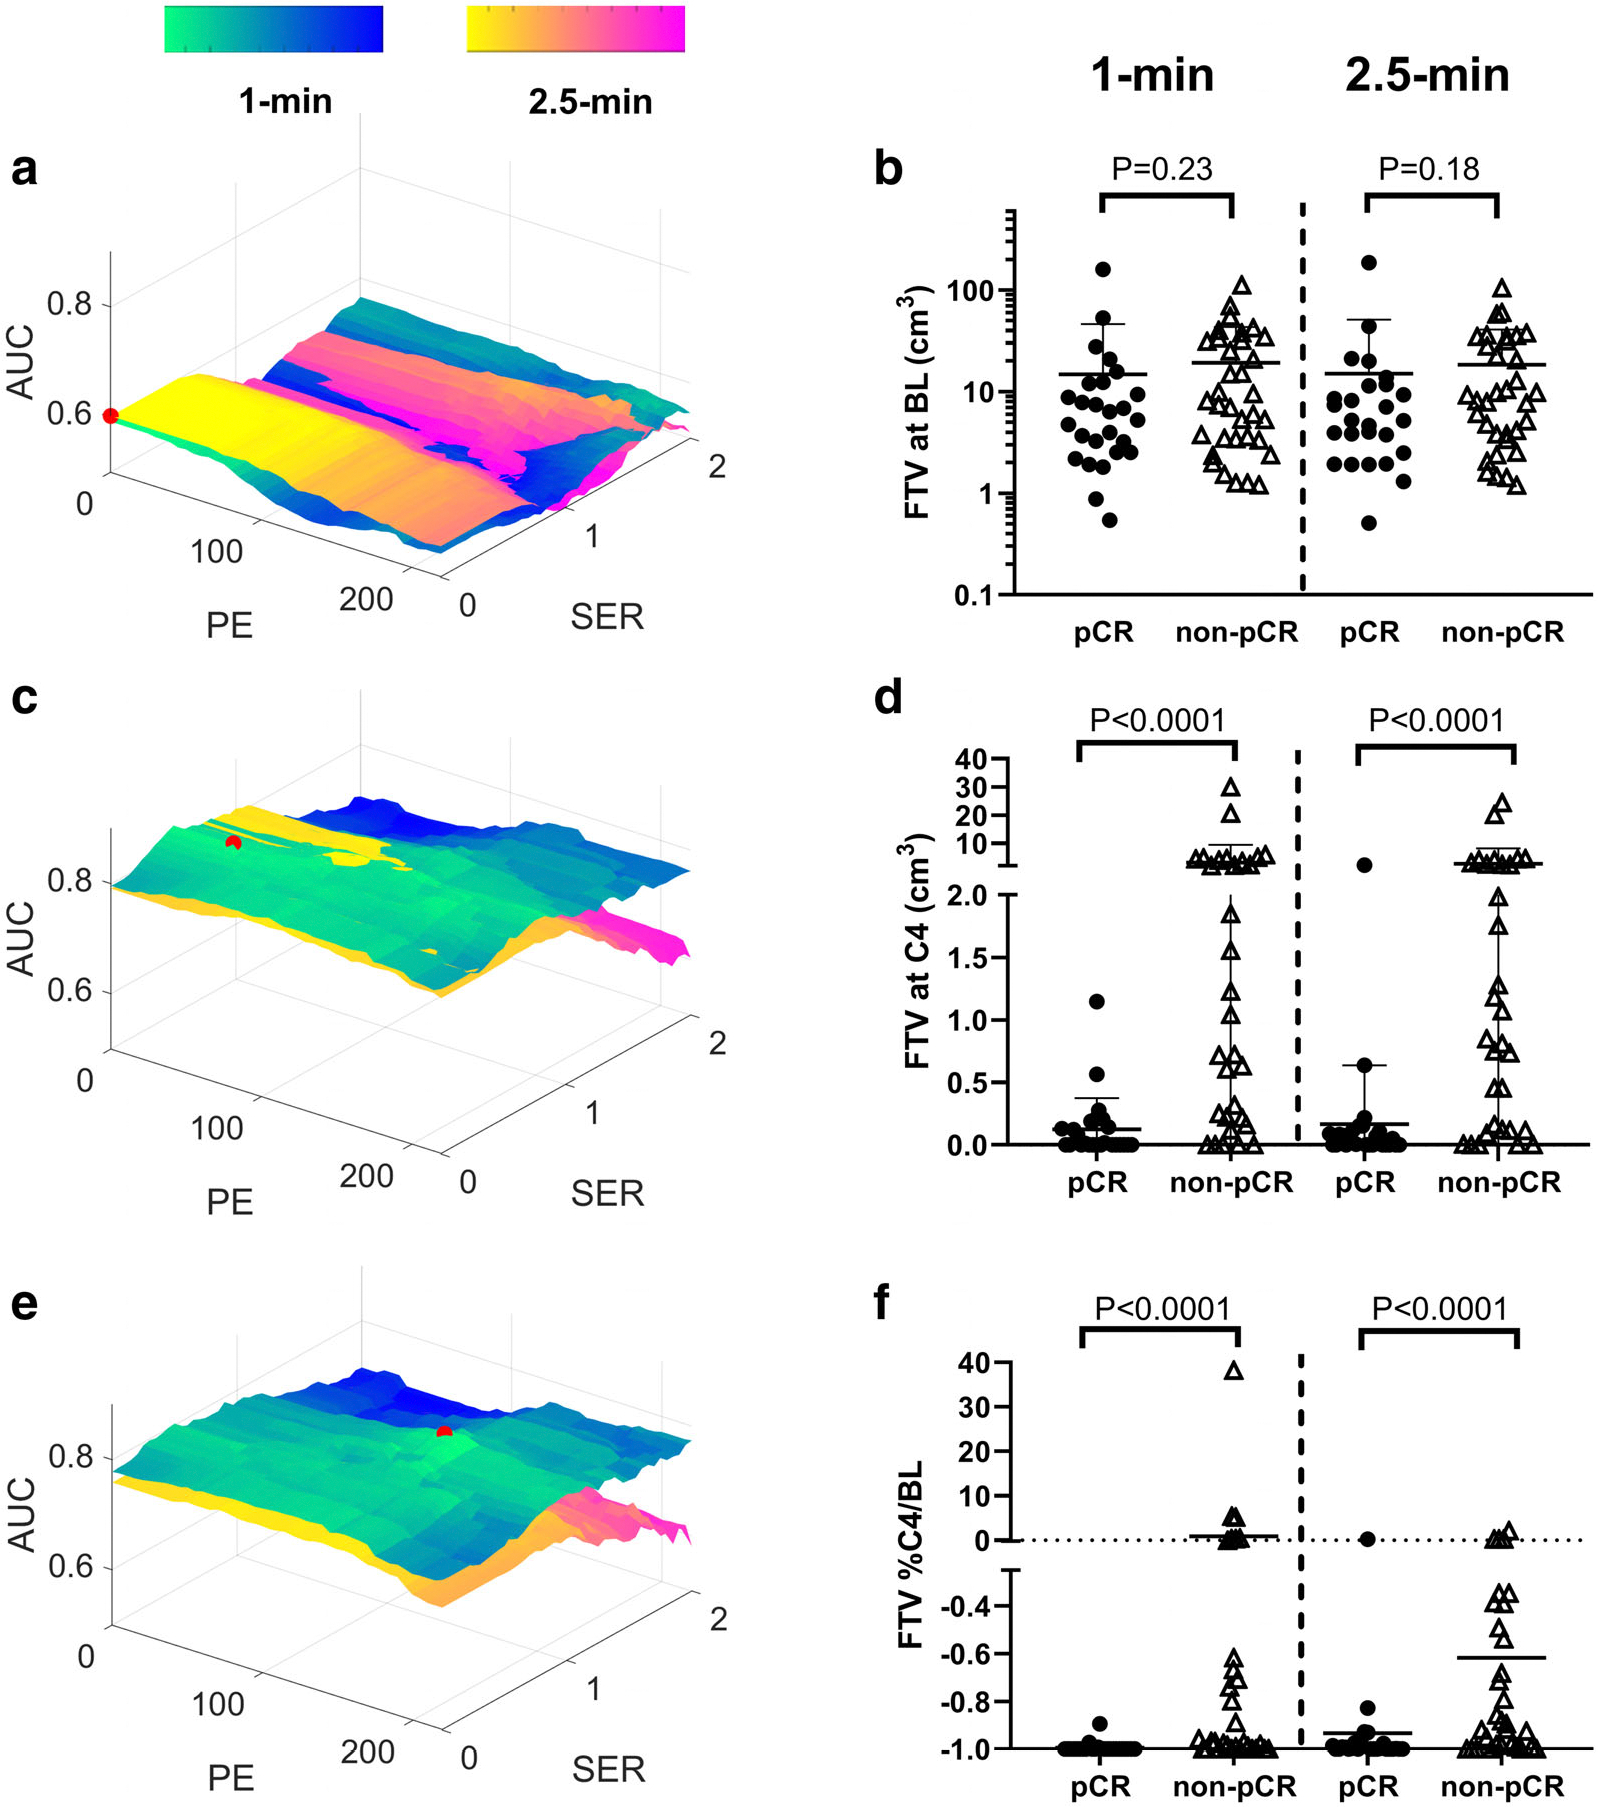
Comparison of functional tumor volume (FTV) optimization contour plots between 1-minute and 2.5-minute early phase timings for the baseline (BL) scan (a), cycle 4 (C4) scan (c), and %C4/BL (e). Peak AUC for each plot is marked with a red dot. Dot plots are also shown, comparing optimal FTV between patients who had a pathologic complete response (pCR) and those who did not for each early phase timing at BL scan (b), C4 scan (d), and %C4/BL (f).
Comparison of the AUC performance for different early phase timings can be seen in the contour plots in Fig. 5a,c,e, where contours corresponding to optimal early phase timings cover suboptimal early phase timings. From interpolated fast DCE MRI data, an optimal early phase timing was found to be 30 seconds for the BL scan, showing an AUC (95% CI) performance of 0.69 (0.55,0.82) (P < 0.05; Table 3, Fig. 5a). Optimal FTV early phase timings were found to be 1 minute for both C4 and %C4/BL (Table 3, Fig. 5b,c). For FTVOpt at C4 and %C4/BL, optimal PE/SER thresholds and peak AUC were similar to those of FTV1-min but were not identical as a result of the interpolation of the enhancement curves.
FIGURE 5:

Comparison of functional tumor volume (FTV) optimization contour plots between different early phase timings for FTVOpt at baseline (BL) scan (a), cycle 4 (C4) scan (b), and the relative change (%C4/BL) between the two scans (c). AUC = area under the receiver operating characteristic curve, PE = percentage enhancement, SER = signal enhancement ratio.
Discussion
Tumor volume measurements by fast DCE MRI at C4 and % C4/BL were found to be capable of discriminating between pCR and non-pCR to NAST in patients with TNBC. In comparison, tumor volume measurements at BL did not discriminate pCR from non-pCR to NAST, with the sole exception of FTV measured on an optimal early phase at 30 seconds after injection. The volume measurements extracted using enhancement thresholds showed stronger performance in comparison to volume measurements that did not use thresholds. Both ETV and optimized FTV showed stronger performance with an early phase timing of 1 minute compared with an early phase timing of 2.5 minutes. By leveraging interpolated rapidly sampled fast DCE enhancement curves, the FTVOpt experiment also showed an optimal early phase timing of 1 minute for both C4 and %C4/BL.
Much of the previous work investigating FTV as a predictor of treatment response in breast cancer preceded or stemmed from the multicenter I-SPY1 and I-SPY2 trials.6,8–10,26,27 Two of these studies applied FTV to predict pCR.10,27 Both studies used early phase timings of 2.5 minutes and with longitudinal imaging. The optimal contrast threshold values for %C4/BL FTV2.5-min were similar to the thresholds used in these earlier studies, though the AUC performance in the earlier studies was slightly lower, likely due to their multicenter setting.10,27
Two previous studies have optimized FTV contrast thresholds for the TNBC subtype.10,11 In a cohort of 30 TNBC patients, Li et al examined change in FTV across four cycles of NAST as a predictor of pCR and found optimal thresholds of PE > 140% and SER > 0.10 Lo et al examined changes in FTV after one cycle of NAST in a small TNBC subset (N = 11) and found that optimized contrast thresholds PE > 120% and SER > 1.4 best predicted recurrence-free survival.11 At %C4/BL, optimal PE thresholds for FTV1-min and FTV2.5-min in the current study were similar to contrast thresholds used in these earlier studies, and SER similar to Lo et al was found to be useful.
Assessment of lesion enhancement early after injection by fast DCE MRI is useful for screening and diagnosis for breast lesions and has been shown to correlate with both microvessel density and aggressiveness.12–14,24 The optimal FTV early phase timings of 30 seconds at BL and 1 minute at C4 and % C4/BL may leverage this correlation to measure the well-perfused volume of the tumor with aggressive characteristics.
Many of the previous studies used early phase timings of 2.5 minutes and a validated semi-automated segmentation tool.9,10,21,26 One of these studies examined FTV obtained using a manual segmentation method aided with visualization of SER maps and reported a slight improvement in predictive performance for volumes measured using this method.23 Although segmentation in the current study was performed on early phase subtractions by referencing PE instead of SER, the ETV measurements were similar to those reported by Henderson et al.23 Because the setup and contrast injection protocols are fairly standardized across institutions and the semi-quantitative DCE MRI measurements have shown strong reproducibility, the FTV measurements in the current study were comparable to those obtained in other studies using a semi-automatic tool28,29.
Limitations
There are some limitation to this current study. First, an inter-reader repeatability test of segmentation and its potential impact on the tumor volume measurements and their predictive performance was not performed. Second, the effect of interpolation on enhancement curves in the FTVOpt analysis was not evaluated, though the results of this analysis would have been difficult to interpret because the actual temporal resolution of the dataset was not fixed and depended on the patient size. Third, the study was performed on a single scanner using a single imaging protocol. Nevertheless, the DISCO sequence used is widely available on the platform of one major vendor, and similar sequences are readily available on the platforms of the other vendors. Further, a prior study has found that the predictive value of FTV is stable with some variation in the imaging protocol.27 Therefore, the findings of the current study are expected to be reproducible and translatable, although additional studies would be helpful and multisite, cross-platform validation is warranted. Finally, interpatient variation in contrast arrival due to circulation differences among patients was not accounted for. Harmonizing contrast arrival at a nearby feeding vessel would reduce a source of potential timing variation; however, reliable identification of a feeding vessel is not always possible and the temporal resolution of the fast DCE MRI in this study was limited to ~11 seconds, which is too long to relative to the expected inter-patient differences in blood circulation.
Conclusions
Tumor volume measurements by fast DCE MRI were compared as discriminators of pCR and non-pCR in TNBC patients undergoing NAST. This study finds that selection of an early phase at 1 minute after contrast injection improves the predictive performance of FTV and TV measured after four cycles of NAST.
Acknowledgments
B.C.M. would like to acknowledge partial support from the American Legion Auxiliary Fellowship in Cancer Research. We thank Erica Goodoff from the Scientific Publications at The University of Texas MD Anderson Cancer Center for her help in editing and proofreading this document. This research was conducted at the MD Anderson Center for Advanced Biomedical Imaging in-part with equipment support from General Electric Healthcare.
References
- 1.Nofech-Mozes S, Trudeau M, Kahn HK, et al. Patterns of recurrence in the basal and non-basal subtypes of triple-negative breast cancers. Breast Cancer Res Treat 2009;118(1):131–137. [DOI] [PubMed] [Google Scholar]
- 2.de Ruijter TC, Veeck J, de Hoon JPJ, van Engeland M, Tjan-Heijnen VC. Characteristics of triple-negative breast cancer. J Cancer Res Clin Oncol 2011;137(2):183–192. [DOI] [PMC free article] [PubMed] [Google Scholar]
- 3.Bauer KR, Brown M, Cress RD, Parise CA, Caggiano V. Descriptive analysis of estrogen receptor (ER)-negative, progesterone receptor (PR)-negative, and HER2-negative invasive breast cancer, the so-called triple-negative phenotype: A population-based study from the California cancer registry. Cancer 2007;109(9):1721–1728. [DOI] [PubMed] [Google Scholar]
- 4.Lehmann BD, Bauer JA, Chen X, et al. Identification of human triple-negative breast cancer subtypes and preclinical models for selection of targeted therapies. J Clin Invest 2011;121(7):2750–2767. [DOI] [PMC free article] [PubMed] [Google Scholar]
- 5.Turnbull LW. Dynamic contrast-enhanced MRI in the diagnosis and management of breast cancer. NMR Biomed 2009;22(1):28–39. [DOI] [PubMed] [Google Scholar]
- 6.Jafri NF, Newitt DC, Kornak J, Esserman LJ, Joe BN, Hylton NM. Optimized breast MRI functional tumor volume as a biomarker of recurrence-free survival following neoadjuvant chemotherapy. J Magn Reson Imaging 2014;40(2):476–482. [DOI] [PMC free article] [PubMed] [Google Scholar]
- 7.Drukker K, Li H, Antropova N, Edwards A, Papaioannou J, Giger ML. Most-enhancing tumor volume by MRI radiomics predicts recurrence-free survival “early on” in neoadjuvant treatment of breast cancer. Cancer Imaging 2018;18(1):12. [DOI] [PMC free article] [PubMed] [Google Scholar]
- 8.Partridge SC, Gibbs JE, Lu Y, et al. MRI measurements of breast tumor volume predict response to neoadjuvant chemotherapy and recurrence-free survival. AJR Am J Roentgenol 2005;184(6):1774–1781. [DOI] [PubMed] [Google Scholar]
- 9.Hylton NM, Gatsonis CA, Rosen MA, et al. Neoadjuvant chemotherapy for breast cancer: Functional tumor volume by MR imaging predicts recurrence-free survival-results from the ACRIN 6657/CALGB 150007 I-SPY 1 TRIAL. Radiology 2016;279(1):44–55. [DOI] [PMC free article] [PubMed] [Google Scholar]
- 10.Li W, Arasu V, Newitt DC, et al. Effect of MR imaging contrast thresholds on prediction of neoadjuvant chemotherapy response in breast cancer subtypes: A subgroup analysis of the ACRIN 6657/I-SPY 1 TRIAL. Tomography 2016;2(4):378–387. [DOI] [PMC free article] [PubMed] [Google Scholar]
- 11.Lo WC, Li W, Jones EF, et al. Effect of imaging parameter thresholds on MRI prediction of neoadjuvant chemotherapy response in breast cancer subtypes. PLoS One 2016;11(2):e0142047. [DOI] [PMC free article] [PubMed] [Google Scholar]
- 12.Mori N, Abe H, Mugikura S, et al. Ultrafast dynamic contrast-enhanced breast MRI: Kinetic curve assessment using empirical mathematical model validated with histological microvessel density. Acad Radiol 2019;26(7):e141–e149. [DOI] [PMC free article] [PubMed] [Google Scholar]
- 13.Mori N, Pineda FD, Tsuchiya K, et al. Fast temporal resolution dynamic contrast-enhanced MRI: Histogram analysis versus visual analysis for differentiating benign and malignant breast lesions. AJR Am J Roentgenol 2018;211(4):933–939. [DOI] [PMC free article] [PubMed] [Google Scholar]
- 14.Verburg E, van Gils CH, Bakker MF, et al. Computer-aided diagnosis in multiparametric magnetic resonance imaging screening of women with extremely dense breasts to reduce false-positive diagnoses. Invest Radiol 2020;55(7):438–444. [DOI] [PubMed] [Google Scholar]
- 15.Kuhl CK, Schild HH, Morakkabati N. Dynamic bilateral contrast-enhanced MR imaging of the breast: Trade-off between spatial and temporal resolution. Radiology 2005;236(3):789–800. [DOI] [PubMed] [Google Scholar]
- 16.Stoutjesdijk MJ, Fütterer JJ, Boetes C, van Die LE, Jager G, Barentsz JO. Variability in the description of morphologic and contrast enhancement characteristics of breast lesions on magnetic resonance imaging. Invest Radiol 2005;40(6):355–362. [DOI] [PubMed] [Google Scholar]
- 17.Wu C, Pineda F, Hormuth Ii DA, Karczmar GS, Yankeelov TE. Quantitative analysis of vascular properties derived from ultrafast DCE-MRI to discriminate malignant and benign breast tumors. Magn Reson Med 2019;81(3):2147–2160. [DOI] [PMC free article] [PubMed] [Google Scholar]
- 18.Pineda FD, Medved M, Wang S, et al. Ultrafast bilateral DCE-MRI of the breast with conventional fourier sampling: Preliminary evaluation of semi-quantitative analysis. Acad Radiol 2016;23(9):1137–1144. [DOI] [PMC free article] [PubMed] [Google Scholar]
- 19.Milon A, Wahab CA, Kermarrec E, Bekhouche A, Taourel P, Thomassin-Naggara I. Breast MRI: Is faster better? AJR Am J Roentgenol 2020;214(2):282–295. [DOI] [PubMed] [Google Scholar]
- 20.Saranathan M, Rettmann DW, Hargreaves BA, Clarke SE, Vasanawala SS. DIfferential subsampling with Cartesian ordering (DISCO): A high spatio-temporal resolution Dixon imaging sequence for multiphasic contrast enhanced abdominal imaging. J Magn Reson Imaging 2012;35(6):1484–1492. [DOI] [PMC free article] [PubMed] [Google Scholar]
- 21.Li W, Newitt DC, Wilmes LJ, et al. Additive value of diffusion-weighted MRI in the I-SPY 2 TRIAL. J Magn Reson Imaging 2019;50(6):1742–1753. [DOI] [PMC free article] [PubMed] [Google Scholar]
- 22.Luo J, Johnston BS, Kitsch AE, et al. Ductal carcinoma in situ: Quantitative preoperative breast MR imaging features associated with recurrence after treatment. Radiology 2017;285(3):788–797. [DOI] [PMC free article] [PubMed] [Google Scholar]
- 23.Henderson SA, Muhammad Gowdh N, Purdie CA, et al. Breast cancer: Influence of tumour volume estimation method at MRI on prediction of pathological response to neoadjuvant chemotherapy. Br J Radiol 2018;91(1087):20180123. [DOI] [PMC free article] [PubMed] [Google Scholar]
- 24.Onishi N, Sadinski M, Hughes MC, et al. Ultrafast dynamic contrast-enhanced breast MRI may generate prognostic imaging markers of breast cancer. Breast Cancer Res 2020;22(1):58. [DOI] [PMC free article] [PubMed] [Google Scholar]
- 25.Musall BC. Quantitative DWI as an early imaging biomarker of the response to chemoradiation in esophageal cancer. UT GSBS Dissertations and Theses 2017. [Google Scholar]
- 26.Newitt DC, Aliu SO, Witcomb N, et al. Real-time measurement of functional tumor volume by MRI to assess treatment response in breast cancer neoadjuvant clinical trials: Validation of the aegis SER software platform. Transl Oncol 2014;7(1):94–100. [DOI] [PMC free article] [PubMed] [Google Scholar]
- 27.Onishi N, Li W, Gibbs J, et al. Impact of MRI protocol adherence on prediction of pathological complete response in the I-SPY 2 neo-adjuvant breast cancer trial. Tomography 2020;6(2):77–85. [DOI] [PMC free article] [PubMed] [Google Scholar]
- 28.Jones KM, Pagel MD, Cárdenas-Rodríguez J. Linearization improves the repeatability of quantitative dynamic contrast-enhanced MRI. Magn Reson Imaging 2018;47:16–24. [DOI] [PMC free article] [PubMed] [Google Scholar]
- 29.Galbraith SM, Lodge MA, Taylor NJ, et al. Reproducibility of dynamic contrast-enhanced MRI in human muscle and tumours: Comparison of quantitative and semi-quantitative analysis. NMR Biomed 2002;15(2):132–142. [DOI] [PubMed] [Google Scholar]