Abstract
Numerous extracellular stimuli activate SK1 (sphingosine kinase type 1) to catalyse the production of sphingosine 1-phosphate, a bioactive lipid that functions as both an extracellular ligand for a family of G-protein-linked receptors and as a putative intracellular messenger. Phorbol esters, calcium or immunoglobulin receptors stimulate SK1 by promoting its translocation to the plasma membrane, which brings it into proximity both to its substrate (i.e. sphingosine) and to activating acidic phospholipids (e.g. phosphatidylserine). To evaluate the consequence of SK translocation, we generated an SK1-derivative tagged with a myristoylation sequence (Myr-SK1) on its N-terminus and overexpressed the construct in 3T3-L1 fibroblasts using recombinant retrovirus. Myr-SK1 overexpression increased SK activity by more than 50-fold in crude membranes, while only stimulating cytoplasmic SK activity by 4-fold. In contrast, the overexpression of WT-SK1 (wild-type SK1), as well as that of a construct containing a false myristoylation sequence (A2-Myr-SK1), markedly increased SK activity in both membrane and cytoplasmic compartments. Immunofluorescence confirmed that Myr-SK1 preferentially localized at the plasma membrane, whereas WT-SK1 and A2-Myr-SK1 partitioned in cytoplasmic/perinuclear cellular regions. Surprisingly, Myr-SK1 overexpression significantly decreased the rates of cell proliferation by delaying exit from G0/G1 phase. Moreover, expression of Myr-SK1 but not WT-SK1 or A2-Myr-SK1 protected cells from apoptosis induced by serum withdrawal. Collectively, these findings reveal that altering the subcellular location of SK1 has marked effects on cell function, with plasma membrane-associated SK having a potent inhibitory effect on the G1–S phase transition.
Keywords: cell-cycle arrest, cell growth, cell survival, myristoylation, sphingolipid, sphingosine
Abbreviations: BrdU, bromodeoxyuridine; FBS, fetal bovine serum; HA, haemagglutinin; IRFL, integral red fluorescence; MAPK, mitogen-activated protein kinase; Myr, myristoylated; PI3K, phosphoinositide 3-kinase; PKB, protein kinase B; S1P, sphingosine 1-phosphate; SK, sphingosine kinase; WT, wild-type
INTRODUCTION
Sphingosine kinases (SKs) catalyse the production of S1P (sphingosine 1-phosphate), a bioactive sphingolipid implicated in the regulation of cell proliferation, apoptosis, stress fibre formation and cell migration (reviewed in [1–3]). SK activity has been found in virtually all the tissues examined, and two mammalian SK isoforms (SK1 and SK2) have been cloned so far [4,5]. Extracellular agonists, including platelet-derived growth factor [6], nerve growth factor [7], vitamin D3 [8], acetylcholine [9], tumour necrosis factor-α [10,11] and the immunoglobulin receptors FcεR1 [12] and FcγR1 [13], stimulate SK1, but the mechanism underlying its activation remains elusive. However, recent studies indicate that some of these extracellular agonists promote a redistribution of SK1 to the plasma membrane [14–16] that could stimulate the enzyme by bringing it into proximity both to its membrane-bound substrate, sphingosine, and to acidic phospholipids, which are allosteric activators [17]. Experiments identifying roles for S1P have mainly resulted from studies involving either the addition of exogenous S1P or the overexpression of SK. Notably, expressing WT-SK1 (wild-type SK1) in NIH-3T3 or HEK-293 (human embryonic kidney 293) fibroblasts, Jurkat T-cells or neuronal PC12 cells markedly increases the rates of cell proliferation and/or protects cells from the apoptosis induced by either serum withdrawal or ceramide addition [18,19]. Similarly, in breast adenocarcinoma MCF-7 cells, enforced expression of SK1 conferred a growth advantage and blocked the cell death induced by anti-cancer drugs, sphingosine and tumour necrosis factor α [20]. Interestingly, overexpression of the SK2 isoform in either NIH-3T3 fibroblasts or HeLa carcinoma cells was shown to induce apoptosis and suppress cellular proliferation [21]. The contrasting, isoform-specific effects of SK1 and SK2 in NIH-3T3 fibroblasts suggest that intracellularly generated S1P can induce different biological processes. In the present study, we sought to determine whether the intracellular sites where S1P is produced could dictate its ultimate biological response.
The mechanisms by which S1P elicits its pleiotropic effects have received considerable attention. A number of S1P effects result from its ability to activate a family of G-protein-coupled receptors (S1P1–5, formerly EDG1, EDG3, EDG5, EDG6 and EDG8), which initiate signalling cascades such as MAPK (mitogen-activated protein kinase) and PI3K-Akt/PKB pathways (where PI3K stands for phosphoinositide 3-kinase) to regulate cell growth and survival (reviewed in [22–24]). The route by which intracellular S1P gets secreted into the extracellular milieu is so far poorly defined. A substantial body of the literature also suggests that S1P acts as an intracellular messenger to regulate Ca2+ homoeostasis [9,25–27] and suppress apoptosis [7,8,28–31]. Evidences in support of an intracellular second messenger role for S1P includes the following: roles for S1P have been identified in yeast and plants, although neither express S1P receptors [33,34]; (ii) dihydro-S1P binds to and activates all of the identified S1P receptors, but does not mimic all the effects of exogenously added S1P, particularly those relating to survival [35]; and (iii) microinjection of S1P into, or photolysis of caged S1P within, mammalian cells induces both Ca2+ mobilization [36] and cell proliferation [35].
The idea underlying the present study derives from analogous work [37] with PI3K, another lipid kinase activated by a broad array of growth-promoting cellular agonists. PI3K activation involves its translocation to the plasma membrane, where it comes into proximity to its lipid substrates. To understand the consequences of PI3K translocation, Klippel et al. [37] overexpressed a myristoylated form of the enzyme in cultured cells, and found that it markedly enhanced various downstream processes [e.g. activation of Akt/PKB (protein kinase B) and rac]. In contrast, overexpressing the WT form of PI3K only weakly stimulated these events. Noting the similarities between the mechanisms of activation of these two lipid kinases (i.e. PI3K and SK1), we reasoned that the addition of a myristoylation sequence to SK1 might similarly augment SK1-dependent responses. Using PCR, we attached the src-myristoylation sequence [38–40] to the 5′-end of the cDNA encoding the enzyme, which we subsequently expressed in 3T3-L1 fibroblasts using recombinant retrovirus. In the present study, results were obtained using this novel, constitutively membrane-targeted form of the enzyme.
METHODS
Antibodies and reagents
Commercial antibodies recognizing the following proteins were used in the present study: phosphorylated MAPK (Promega, Madison, WI, U.S.A.); phosphorylated Akt/PKB (Ser473 site), PARP [poly(ADP-ribose) polymerase], cyclin D and phosphorylated cdc2 (Tyr15 site), p53 and phosphorylated retinoblastoma (Ser807/Ser811 sites) (all obtained from Cell Signaling Technology, Beverly, MA, U.S.A.); caveolin (Upstate Biotechnology, Waltham, MA, U.S.A.); active caspase 3 (BD Pharmingen, San Diego, CA, U.S.A.); and HA (haemagglutinin) and cyclin E (Santa Cruz Technology, Santa Cruz, CA, U.S.A.). Secondary anti-mouse and anti-rabbit antibodies conjugated with FITC and Texas Red respectively were obtained from Jackson Immunoresearch Laboratories (West Grove, PA, U.S.A.). The antibody recognizing BrdU (bromodeoxyuridine) was obtained from BD Pharmingen.
We additionally utilized a diacylglycerol kinase assay kit obtained from Amersham Biosciences (San Francisco, CA, U.S.A.) and a BrdU incorporation detection kit obtained from Roche Applied Sciences (Indianapolis, IN, U.S.A.). RNase A and bisbenzidine hydrochloride (Hoechst 33258) were obtained from Sigma–Aldrich (St. Louis, MO, U.S.A.). Lipids used in the present study were obtained from Biomol (Plymouth Meeting, PA, U.S.A.).
Cloning and expression of SK
Human SK1 cDNA was subcloned into the mammalian retroviral expression vector pLNCX1 as follows. Briefly, using WT-SK1 [18] as a template, we generated a WT-SK1 tagged with an HA epitope on its C-terminus by PCR utilizing the forward primer GGGAAGCTTGCCGCCACCATGGAACCAGAATGCCCTCG and the reverse primer GGGAGATCTTCAAGCGTAATCCGGAACATCGTATGGGTATGGTTCTTCTGGAGGTGG. The myristoylated SK1 was generated using the same reverse primer coupled with a forward primer that additionally included the myristoylation site described by Klippel et al. [37], inserted immediately after the start site (GGGAAGCTTGACCTGGCTATGGGGAGCAGCAAGAGCAAGCCTAAGGACCCTAGCCAGCGCGAACCAGAATGCCCTCG). For control experiments, we also generated an SK1 construct in which the myristoylated glycine residue was mutated to an alanine using the forward primer GGGAAGCTTGACCTGGCTATGGCAAGCAGCAAGAGCAAGCCTAAGGACCCTAGCCAGCGCGAACCAGAATGCCCTCG. The PCR fragments obtained were ligated into the pGEM TA cloning vector (Promega) and then subcloned into the pLNCXI retroviral vector (ClonTech Laboratories, Palo Alto, CA, U.S.A.) using the restriction enzymes HindIII and BglII. STable 3T3-L1 fibroblasts expressing each of these constructs were generated using the methods described in [41].
Cell culture
3T3-L1 fibroblasts and human embryonic kidney cells (HEK-293T) were maintained in high-glucose DMEM (Dulbecco's modified Eagle's medium) supplemented with 10% (v/v) calf serum. Non-clonal pools of cells expressing the various SK1 constructs were periodically selected using G418 (800 μg/ml).
Immunofluorescence
Immunofluorescent detection of the expressed proteins was conducted using methods we have described previously [42]. Cells were counterstained with Hoechst 33342 to identify nuclei. The images were acquired using a digital camera and analysed using Metamorph software (version 4.6; Universal Imaging Corporation, West Chester, PA, U.S.A.).
Assay of SK activity
SK activity was assessed in both particulate and cytoplasmic cellular fractions by the method of Olivera et al. [43].
Measurement of S1P, sphingosine and ceramide
Sphingosine, S1P and ceramide levels were quantified using the method of Edsall et al. [7]. Ceramide levels were quantified as described by Chavez and Summers [44].
Cell-proliferation analysis
A total of 5000 cells were plated on to 40 mm gelatinized plates in DMEM containing 10% calf serum. At the indicated times, cells were washed with PBS, fixed in 70% (v/v) ethanol (20 min) and stained with crystal violet (0.1% in PBS for 10 min). The cells were rinsed thoroughly in water and dried, and the dye incorporated by the cells was eluted in 0.1 M sodium citrate in 50% ethanol (pH 4.2). The absorbance A was measured at 540 nm. In some experiments, cells were trypsinized and counted using a haemocytometer.
Cell-cycle analysis
Cells were synchronized by serum deprival for 24 h and subsequently incubated with DMEM containing 10% (v/v) FBS (fetal bovine serum) for another 24 h. Cell-cycle distributions were assessed using methods described previously [18]. Briefly, cells were fixed in 70% ethanol and DNA was stained with propidium iodide. Total DNA content was analysed in each cell line by flow cytometry (Coulter EPICS V cell sorter; Coulter, Miami, FL, U.S.A.).
DNA synthesis
Cells were grown on coverslips until they reached 50% confluence. The cells were then serum-starved for 24 h, after which they were supplemented with DMEM containing either 0.1 or 10% FBS. BrdU incorporation was assessed using the BrdU incorporation detection kit (Roche Applied Sciences) according to the manufacturer's instructions. Cells were visualized using microscopy and those incorporating BrdU (S phase cells) were counted in at least 25 fields.
Apoptosis analysis
Cells were grown to 80% confluence in DMEM supplemented with 10% serum followed by serum starvation for 24 h. Cells were then serum-deprived for 48 h, and the extent of apoptosis was assessed by quantifying the sub-G1 fraction. Briefly, cells were trypsinized in 0.03% trypsin solution, washed with PBS containing 1% BSA, fixed in ice-cold 70% ethanol and stored at −20 °C overnight. Fixed cells were then centrifuged, washed once with PBS containing 1% BSA, resuspended in 0.5 ml of PBS/1% BSA, incubated with 1 ml of permeabilization buffer (192 parts of 0.2 M Na2HPO4 and 8 parts of 0.1 M sodium citrate, pH 7.8) for 20 min at room temperature (22 °C). Cells were then washed once with 1 ml of PBS/1% BSA and stained in 1.0 ml of PBS containing 5 μg/ml propidium iodide and 40 units of RNase A for at least 20 min. The stained cells were filtered through a 53 μm nylon mesh (Small Parts, Miami Lakes, FL, U.S.A.) before flow-cytometric analysis. The samples were then analysed with a Coulter EPICS V cell sorter interfaced to a Cicero data acquisition and display system (DakoCytomation, Fort Collins, CO, U.S.A.) using 500 mW power at 488 nm. IRFL (integral red fluorescence) and LIRFL (log IRFL) were measured above 610 nm. Fluorescence histograms were gated on forward angle light scattering to exclude the debris and clumped cells. Gating on peak versus integral fluorescence of the propidium iodide signal was set to eliminate clumped cells. At least 50000 cells were counted in an IRFL histogram for better statistical analysis. To determine the fraction of the population that was undergoing apoptosis, the sub-G1 region in the DNA histogram was placed in IRFL and LIRFL histograms. The Cicero program calculates the number of cells in the selected region. DNA histograms were analysed with Multicycle® (Phoenix Flow Systems, San Diego, CA, U.S.A.) software for cell-cycle distribution.
Western blotting
Cellular proteins were resolved by SDS/PAGE and immunoblotted using methods described previously [42].
RESULTS
Generation of 3T3-L1 fibroblasts expressing WT and myristoylated forms of SK
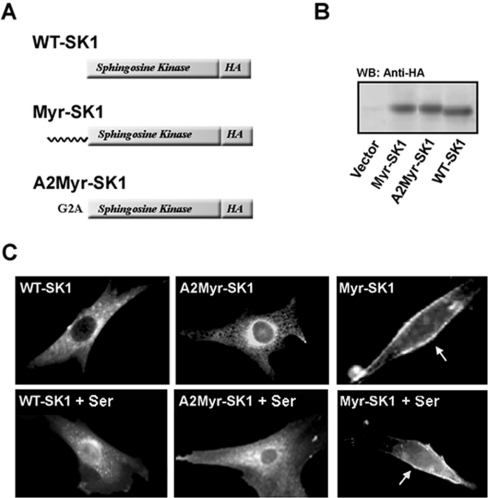
HA-tagged WT (WT-SK1) and myristoylated (Myr-SK1) forms of SK1 were prepared by PCR and then packaged into ecotropic retroviruses that additionally encoded genes providing resistance to G418. We additionally generated a construct containing a false myristoylation site (A2-Myr-SK1) in which the second glycine residue was mutated to an alanine, eliminating acylation. The retroviruses were used to generate sTable 3T3-L1 fibroblast cell lines expressing each of the constructs. Western-blot analysis using an anti-HA antibody confirmed that the proteins encoded by these were translated at similar levels (Figure 1B). Immunofluorescence studies revealed that both WT-SK1 and A2-Myr-SK1 preferentially localized to the cytoplasm and perinuclear organelles, whereas Myr-SK1 was predominantly at the plasma membrane (Figure 1C).
Figure 1. Generation of stable cell lines.
3T3-L1 fibroblasts were stably transfected with WT-SK1, myristoylated SK (Myr-SK1) or a myristoylated construct in which the second glycine residue is mutated to an alanine (A2-Myr-SK1). All were HA-tagged on their C-terminus. A schematic representation of the constructs is shown in (A). (B) Cell lysates from each of these lines, and a control line infected with an empty retroviral vector, were resolved by SDS/PAGE, transferred on to nitrocellulose and immunoblotted with anti-HA antibodies. Proteins were visualized by enhanced chemiluminescence. The blot depicted is representative of at least three independent experiments. (C) Cells were serum-deprived for 2 h (upper panels) and then restimulated with 10% FBS for 30 min (lower panels). Cells were fixed in paraformaldehyde and the subcellular localization of the expressed constructs was assessed by immunofluorescence using anti-HA antibodies and Texas Red-conjugated secondary antibodies. Images were captured using a digital camera. The cells depicted are representative of all cells in the field. Results are representative of five different experiments conducted with at least three independently prepared sets of cell lines.
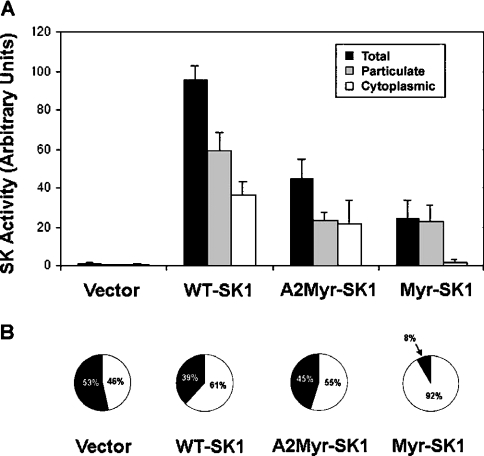
Furthermore, we determined the effect of these proteins on cellular SK activity and S1P levels. First, we quantified SK activity in cytosolic and particulate fractions obtained from the lysed 3T3-L1 fibroblasts. Briefly, each fraction was incubated with [γ-32P]ATP and exogenous sphingosine, and the S1P that was formed thereby was resolved by TLC and detected using a Storm PhosphorImager (Molecular Dynamics, Sunnyvale, CA, U.S.A.). Overexpression of each of these proteins increased the SK activity markedly in a particulate fraction that contained both the plasma membrane and intracellular organelles. Specifically, WT-SK1 increased membrane-associated SK activity to >150 times that of vector cells, whereas the Myr-SK1 and A2-Myr-SK1 constructs increased SK activity to >75 times that of vector cells. In the cytoplasmic fraction, overexpression of WT-SK1 or A2-Myr-SK1 increased SK activity substantially (i.e. to >50 times of that found in cells expressing an empty vector), but the Myr-SK did not (Figure 2). Thus overexpression of each construct had a potent effect on total cellular SK activity, with WT-SK1 demonstrating greater activity than either A2-Myr-SK or Myr-SK1 (Figure 2A). However, while the distribution of SK activity in the vector only, WT-SK1, and A2-Myr-SK1 were similar, with roughly equal distributions of the activity between the cytosolic and membrane fractions, the Myr-SK1 cells demonstrated a markedly different pattern, with >90% of the activity being membrane-associated (Figure 2B).
Figure 2. SK assays.
Cytoplasmic and particulate fractions were prepared from the stable cell lines described in Figure 1. SK was assessed in each by quantifying the incorporation of 32P from [32P]ATP into exogenous sphingosine. Lipids were extracted, resolved by TLC and detected on a Storm PhosphorImager. (A) Results represent the mean fold-increase in activity ±S.E.M. (n=3). (B) The relative distribution of total SK activity in each cell line is shown (black, cytoplasmic; white, particulate).
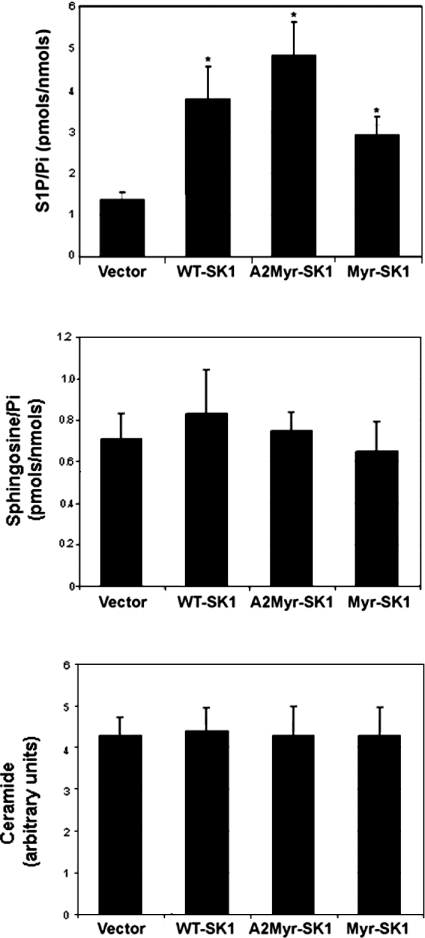
Despite the significant increase in SK activity, cellular S1P levels in the WT-SK1, A2-Myr-SK1 and Myr-SK1 lines increased only slightly (∼2–3-fold) above those found in cells infected with the empty retroviral vector (Figure 3, top panel). No differences in S1P levels were observed between the lines. Expression of any of these SK constructs had no effect on cellular ceramide or sphingosine levels (Figure 3, middle and bottom panels).
Figure 3. Intracellular S1P, sphingosine and ceramide levels.
S1P (top panel), sphingosine (middle panel) and ceramide (bottom panel) levels were quantified in lipid extracts from each of the cell lines as described in the text. Results presented are the mean S1P levels±S.E.M. (n=4).
Effect of SK overexpression on cell proliferation
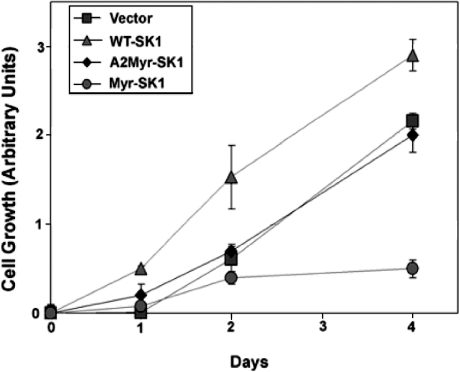
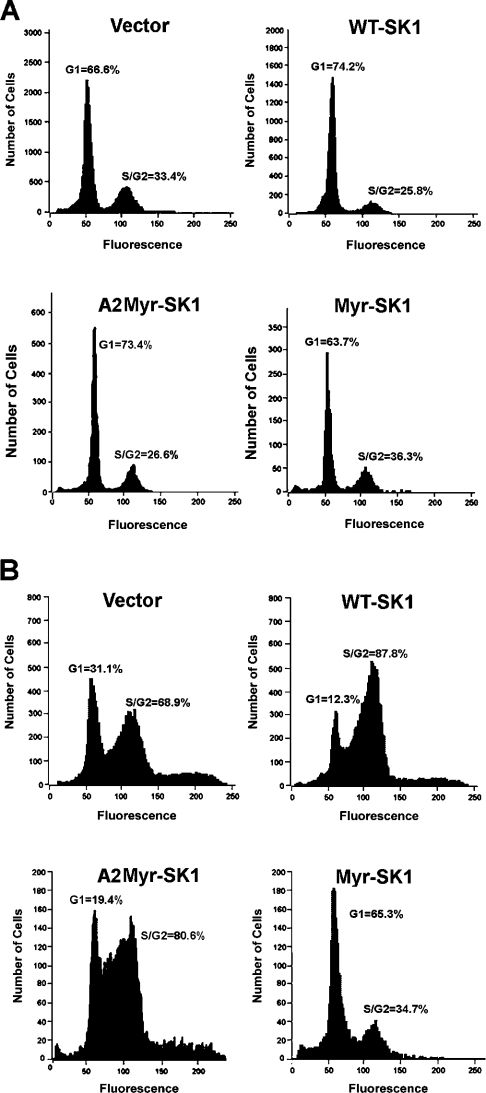
It was shown previously that overexpressing the WT-SK1 accelerates significantly the rate of proliferation [45]. As shown in Figure 4, the WT-SK1 cell line demonstrated slightly enhanced rates of cell division when compared with cells expressing only an empty vector. Surprisingly, however, the Myr-SK1 cell line demonstrated an immediately recognizable slowing down in proliferation rates (Figure 4). Specifically, while vector only cells demonstrated a doubling time of approx. 26 h, the Myr-SK1 cells doubled in approx. 42 h. To investigate further the effect of these constructs on cell cycle, we utilized DNA flow cytometry (FACS) to quantify the distribution of cells in the G1, G2 and S phases of the cell cycle. After 24 h of serum deprivation, all the lines were quiescent, with 63–74% of the cells in the G0/G1 phase (Figure 5A). However, after stimulation with 10% FBS, the various cell lines demonstrated markedly different cell-cycle distributions. Specifically, while WT-SK1 facilitated passage into S and G2 phases during the first 24 h of serum stimulation, Myr-SK1 decreased the rate of exit from G0/G1 phase (Figure 5B).
Figure 4. Cell proliferation.
The cell lines were plated in gelatinized 6-well plates (∼10000 cells/well), fixed on the indicated day and the number of cells were quantified using a crystal violet stain. Absorbance values were normalized on day 0. Results are the mean absorbance values ±S.E.M. (n=5).
Figure 5. Analysis of cell-cycle distributions.
Cells were synchronized by serum deprivation (A) before being restimulated with 10% FBS (B). Cells were fixed in 70% ethanol and cellular DNA was stained with propidium iodide. Total DNA content was measured by FACS analysis. Results are representative of three independent experiments.
Interestingly, the A2-Myr-SK construct, which demonstrated a subcellular localization similar to WT-SK1 but did not increase SK activity to the same extent as the WT-SK1 construct, displayed a phenotype that was intermediate between vector only and WT-SK1 cells. Specifically, although A2-Myr-SK failed to stimulate cell proliferation (Figure 4), it did markedly increase the fraction of cells in the G2/S phase after 24 h of serum stimulation (Figure 5). Although it facilitated passage through G1, its effect was not sufficient to stimulate proliferation in the presence of 10% FBS. Whether the disparities between the A2-Myr-SK1 and WT-SK1 constructs are a consequence of their different effects on SK activity, thus implicating a role for S1P turnover in cell-cycle progression, or are due to an altered distribution in various subcellular organelles will require further investigation.
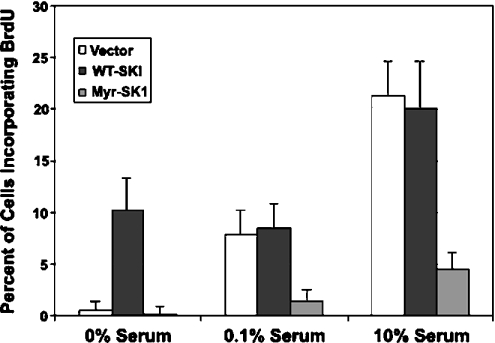
To confirm that Myr-SK1 expression delayed entry into S phase, we specifically monitored DNA synthesis by evaluating the incorporation of BrdU into dividing cells (Figure 6). Removal of serum from the medium used for bathing the cells for 24 h eliminated BrdU incorporation into vector cells or Myr-SK1-expressing cells. However, cells expressing the WT-SK demonstrated marked accumulation of BrdU in the absence of serum. This result is consistent with the aforementioned FACS results, which revealed a 10% increase in the percentage of WT-SK1 cells in the S and G2 phases after serum withdrawal when compared with the other cell lines. Addition of a suboptimal amount of FBS (0.1%) stimulated the entry of the vector cells into the S phase, but had no effect on the cells expressing Myr-SK1. Although the vector cells incorporated comparable amounts of BrdU in the presence of 0.1% serum, the Myr-SK1 cells were completely resistant to the stimulatory effects of the serum. Similarly, in the presence of 10% serum, close to 20% of the vector and WT-SK1 cells demonstrated incorporated BrdU, but only 5% of the Myr-SK1 cells were induced to enter the S phase.
Figure 6. Measuring DNA synthesis (entry into S phase).
Each of the stable cell lines was synchronized by serum deprivation before restimulating with 0, 0.1 or 10% FBS for 16 h. DNA synthesis was quantified by measuring the incorporation of BrdU into DNA by immunofluorescence using anti-BrdU antibodies. Results are the mean number of cells±S.E.M. (n=3) staining positive for BrdU under each condition.
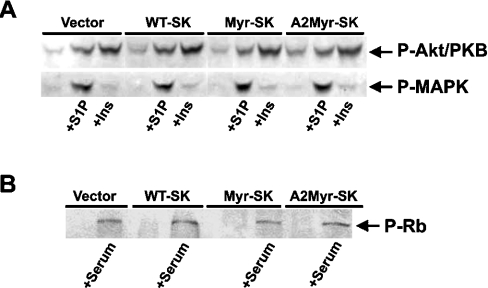
Despite considerable efforts, the mechanism underlying the induction of G1 phase arrest by Myr-SK1 remains unclear. Myr-SK1 expression had no effect on the ability of insulin or exogenous S1P to activate either MAPK or Akt/PKB, two critical regulators of cell growth, proliferation and/or survival (Figure 7A). Moreover, Myr-SK expression had no effect on the induction of retinoblastoma protein phosphorylation (Figure 7B). Lastly, Myr-SK did not affect the expression of the cell-cycle regulators cyclin E, Chk1, p21, p27 or p53, nor did it affect the phosphorylation state of cyclin-dependent kinases on Tyr15 (results not shown).
Figure 7. Effects of construct expression on Akt/PKB, MAPK and Rb phosphorylation.
(A) Each of the stable cell lines was serum-deprived for 2 h before stimulating with S1P (5 μM, 5 min) or insulin (1 μM, 10 min). Cells were lysed, resolved by SDS/PAGE and immunoblotted with antibodies recognizing phosphorylated Akt/PKB or MAPK. Total Akt/PKB or MAPK levels were unchanged by construct expression (results not shown). Results presented are representative of at least six independent experiments. (B) Each of the stable cell lines was synchronized by serum deprivation before restimulating with 10% FBS for 16 h. Cells were lysed, resolved by SDS/PAGE and immunoblotted with antibodies recognizing phosphorylated retinoblastoma (Rb) protein. Results are representative of three independent experiments. Expression of the constructs also did not alter Rb phosphorylation at 2, 4, 6 or 8 h after serum stimulation (results not shown).
Effect of SK overexpression on the apoptosis induced by serum withdrawal
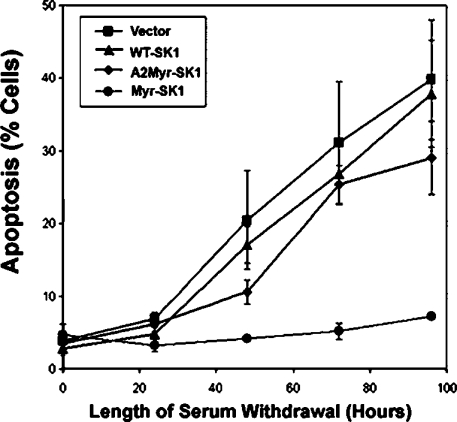
We next addressed whether the cells undergoing G1 phase arrest were more susceptible or less susceptible to the apoptosis induced by serum withdrawal. Briefly, each of the aforementioned cell lines was incubated in serum-free media for several days, with the amount of apoptosis quantified by determining the sub-G1 fraction of propidium iodide-stained cells. In the vector, WT-SK1 and A2-Myr-SK1 cells, approx. 10–20% of the cells underwent apoptosis within 48 h, and more than 40% underwent apoptosis at the end of 96 h (Figure 8). In contrast, only a small fraction (∼5%) of the Myr-SK1 cells was apoptotic even after 96 h of serum withdrawal (Figure 8). Thus the delayed exit from G1 phase was associated with a profound protection from the induction of apoptosis induced by serum withdrawal.
Figure 8. Effects of construct expression on the apoptosis induced by serum withdrawal.
Cells were deprived of trophic factors for the amount of time indicated on the x-axis and fixed in 70% ethanol. Cellular DNA was stained with propidium iodide, and the percentage of cells undergoing apoptosis (i.e. present in a sub-G1 fraction) was quantified by FACS analysis. Results are expressed as mean percentage of cells undergoing apoptosis and represent the means±S.E.M. (n=3).
DISCUSSION
PKC-dependent [15], MAPK-dependent [16] and Ca2+/calmodulin-dependent [14] signalling pathways have been shown to induce the translocation of SK1 from the cytoplasm to the plasma membrane. To mimic the effects of SK1 translocation, we generated an SK1 construct that we constitutively targeted to the plasma membrane by adding an N-terminal myristoylation sequence. Immunofluorescence confirmed that the myristoylated construct Myr-SK1 preferentially localized to the plasma membrane, whereas the WT form WT-SK1 localized predominantly to the cytoplasm and perinuclear membrane domains (Figure 1). Moreover, SK activity assays revealed that overexpressing Myr-SK1 nearly exclusively stimulated the activity of a particulate subcellular fraction, whereas the expression of WT-SK increased activity in both particulate and cytoplasmic fractions (Figure 2). Surprisingly, we observed that cells expressing Myr-SK1 but not WT-SK1 or a construct tagged with a false myristoylation sequence (i.e. one lacking the myristoylated residue) demonstrated markedly decreased rates of cell proliferation (Figure 4). Flow cytometry performed to assess cell-cycle distributions (Figure 5) or BrdU incorporation performed to monitor DNA replication (Figure 6) indicated that cells expressing Myr-SK demonstrated delayed entry into S phase after serum stimulation. Moreover, Myr-SK expression protected cells from apoptosis induced by serum withdrawal (Figure 8).
Overexpression of either SK1 or SK2 has identified roles for these kinases as either positive or negative regulators of cell proliferation and survival respectively [18–21]. Interestingly, a robust increase in SK expression has relatively minor effects on intracellular S1P accumulation. For example, using transient transfection methodologies to express SK1, researchers increased intracellular SK activity 1000-fold, but intracellular S1P levels increased by 4–8-fold only [18]. Similarly, in the studies described herein, stable expression of WT-SK1, Myr-SK1 or A2-Myr-SK1 using recombinant retrovirus increased intracellular SK activity by >50-fold, but S1P levels increased only slightly (i.e. 2- to 3-fold; Figure 4). Importantly, since the S1P levels were comparable in the three lines, the varying effects of the three constructs on cell function are unlikely to result from differences in absolute S1P levels. Rather, we interpret these findings to suggest that S1P produced in different intracellular domains elicits markedly different biological responses.
Previous studies in multiple cell types indicate that overexpressing SK1 stimulates the G1–S phase transition, while overexpressing SK2 blocks this step [18–21,46]. Since Myr-SK1, by inducing G1 phase arrest, recapitulated the effects of SK2, we considered the possibility that SK1 myristoylation rendered it similar to SK2. However, the ability of SK2 to induce G1 phase arrest may result from its ability to localize in the cell nucleus [21]. The addition of a nuclear localization signal to SK1, which is mainly expressed in the cytoplasm, transformed it into an enzyme capable of inducing G1 phase arrest [21]. We saw no evidence that Myr-SK1 localized to the nucleus, and immunofluorescence studies indicated that it instead resided primarily in the plasma membrane. Nonetheless, these two studies demonstrate an intriguingly similar finding, namely that altering the subcellular distribution of SK1 can modulate its ability to regulate the G1–S phase transition.
The best understood effects of S1P result from its ability to act as an extracellular agonist for a family of G-protein-linked receptors. These receptors typically serve mitogenic roles and, in the cell type used herein, exogenous S1P potently stimulates the MAPK cascade. As described above, several other studies support the hypothesis that S1P additionally serves an intracellular signalling role. Herein, the effects of Myr-SK are unlikely to result from the overproduction of extracellular S1P. First, we detected that no S1P secreted into the media using the assay described herein (results not shown). Secondly, overexpression of any of the constructs did not mimic the effects of exogenous S1P on MAPK or Akt/PKB (Figure 8). Finally, the significantly different effects of WT-SK versus Myr-SK are difficult to reconcile if their effects are mediated by a common extracellular mechanism. Thus we hypothesize that intracellular S1P has the ability to activate in a selective manner different effectors on the basis of its subcellular location.
Interestingly, Myr-SK expression additionally provided protection from apoptosis induced by serum withdrawal. Although inducers of cell-cycle arrest often trigger apoptosis, some previous studies indicate that blocking the G1–S phase transition can prevent the apoptosis induced by the withdrawal of trophic factors. For example, treating neuronal cells with agents that inhibit cell-cycle progression, including chlorophenylthio-cAMP [47], N-acetylcysteine [48,49] and the cyclin-dependent kinase inhibitors flavopiridol and olomoucine [50], promote the survival of neuronal PC12 cells and sympathetic neurons deprived of trophic support. Similarly, the G1/S blockers mimosine, deferoxamine and ciclopirox, but not various S and M phase blockers, prevented cell death induced by the withdrawal of the nerve growth factor [51].
Summary – location, location, location
Previous studies have shown that overexpressing SK intracellularly can have potent effects on cell proliferation and survival. The findings of the present study indicate that the intracellular locus of the generated S1P, rather than the total amount produced, may dictate the cellular response to this sphingolipid metabolite. Our results provide clues to a potential intracellular role for S1P, and studies investigating the mechanism for these effects could have important implications regarding the role of this novel signalling molecule in basic cell function.
While this paper was under review, Pitson et al. [52] reported that expression of a myristylated SK1 construct in NIH-3T3 cells markedly increased S1P production and accelerated cell-cycle progression. Thus an apparent contrast exists between the findings in these two papers. Whether these opposing results are a consequence of expressing the constructs in different cell types or perhaps represent the induction of a negative feedback pathway in the cell lines described herein will require further examination in future studies.
Acknowledgments
This work was supported by National Institutes of Health grants R01-DK58784 (to S.A.S.) and CA61774 (to S.S.) and a Career Development Award from the American Diabetes Association (to S.A.S.).
References
- 1.Spiegel S., Milstien S. Sphingosine-1-phosphate: signaling inside and out. FEBS Lett. 2000;476:55–57. doi: 10.1016/s0014-5793(00)01670-7. [DOI] [PubMed] [Google Scholar]
- 2.Spiegel S. Sphingosine 1-phosphate: a prototype of a new class of second messengers. J. Leukoc. Biol. 1999;65:341–344. doi: 10.1002/jlb.65.3.341. [DOI] [PubMed] [Google Scholar]
- 3.Spiegel S., Milstien S. Sphingosine-1-phosphate: an enigmatic signalling lipid. Nat. Rev. Mol. Cell. Biol. 2003;4:397–407. doi: 10.1038/nrm1103. [DOI] [PubMed] [Google Scholar]
- 4.Kohama T., Olivera A., Edsall L., Nagiec M. M., Dickson R., Spiegel S. Molecular cloning and functional characterization of murine sphingosine kinase. J. Biol. Chem. 1998;273:23722–23728. doi: 10.1074/jbc.273.37.23722. [DOI] [PubMed] [Google Scholar]
- 5.Liu H., Sugiura M., Nava V. E., Edsall L. C., Kono K., Poulton S., Milstien S., Kohama T., Spiegel S. Molecular cloning and functional characterization of a novel mammalian sphingosine kinase type 2 isoform. J. Biol. Chem. 2000;275:19513–19520. doi: 10.1074/jbc.M002759200. [DOI] [PubMed] [Google Scholar]
- 6.Olivera A., Spiegel S. Sphingosine-1-phosphate as second messenger in cell proliferation induced by PDGF and FCS mitogens. Nature (London) 1993;365:557–560. doi: 10.1038/365557a0. [DOI] [PubMed] [Google Scholar]
- 7.Edsall L. C., Pirianov G. G., Spiegel S. Involvement of sphingosine 1-phosphate in nerve growth factor-mediated neuronal survival and differentiation. J. Neurosci. 1997;17:6952–6960. doi: 10.1523/JNEUROSCI.17-18-06952.1997. [DOI] [PMC free article] [PubMed] [Google Scholar]
- 8.Kleuser B., Cuvillier O., Spiegel S. 1Alpha,25-dihydroxyvitamin D3 inhibits programmed cell death in HL-60 cells by activation of sphingosine kinase. Cancer Res. 1998;58:1817–1824. [PubMed] [Google Scholar]
- 9.Meyer zu Heringdorf D., Lass H., Alemany R., Laser K. T., Neumann E., Zhang C., Schmidt M., Rauen U., Jakobs K. H., van Koppen C. J. Sphingosine kinase-mediated Ca2+ signalling by G-protein-coupled receptors. EMBO J. 1998;17:2830–2837. doi: 10.1093/emboj/17.10.2830. [DOI] [PMC free article] [PubMed] [Google Scholar]
- 10.Xia P., Gamble J. R., Rye K. A., Wang L., Hii C. S., Cockerill P., Khew-Goodall Y., Bert A. G., Barter P. J., Vadas M. A. Tumor necrosis factor-alpha induces adhesion molecule expression through the sphingosine kinase pathway. Proc. Natl. Acad. Sci. U.S.A. 1998;95:14196–14201. doi: 10.1073/pnas.95.24.14196. [DOI] [PMC free article] [PubMed] [Google Scholar]
- 11.Xia P., Wang L., Gamble J. R., Vadas M. A. Activation of sphingosine kinase by tumor necrosis factor-alpha inhibits apoptosis in human endothelial cells. J. Biol. Chem. 1999;274:34499–34505. doi: 10.1074/jbc.274.48.34499. [DOI] [PubMed] [Google Scholar]
- 12.Choi O. H., Kim J. H., Kinet J. P. Calcium mobilization via sphingosine kinase in signalling by the Fc epsilon RI antigen receptor. Nature (London) 1996;380:634–636. doi: 10.1038/380634a0. [DOI] [PubMed] [Google Scholar]
- 13.Prieschl E. E., Csonga R., Novotny V., Kikuchi G. E., Baumruker T. The balance between sphingosine and sphingosine-1-phosphate is decisive for mast cell activation after Fc epsilon receptor I triggering. J. Exp. Med. 1999;190:1–8. doi: 10.1084/jem.190.1.1. [DOI] [PMC free article] [PubMed] [Google Scholar]
- 14.Pitson S. M., Moretti P. A., Zebol J. R., Lynn H. E., Xia P., Vadas M. A., Wattenberg B. W. Activation of sphingosine kinase 1 by ERK1/2-mediated phosphorylation. EMBO J. 2003;22:5491–5500. doi: 10.1093/emboj/cdg540. [DOI] [PMC free article] [PubMed] [Google Scholar]
- 15.Johnson K. R., Becker K. P., Facchinetti M. M., Hannun Y. A., Obeid L. M. PKC-dependent activation of sphingosine kinase 1 and translocation to the plasma membrane. Extracellular release of sphingosine-1-phosphate induced by phorbol 12-myristate 13-acetate (PMA) J. Biol. Chem. 2002;277:35257–35262. doi: 10.1074/jbc.M203033200. [DOI] [PubMed] [Google Scholar]
- 16.Young K. W., Willets J. M., Parkinson M. J., Bartlett P., Spiegel S., Nahorski S. R., Challiss R. A. Ca2+/calmodulin-dependent translocation of sphingosine kinase: role in plasma membrane relocation but not activation. Cell Calcium. 2003;33:119–128. doi: 10.1016/s0143-4160(02)00205-1. [DOI] [PubMed] [Google Scholar]
- 17.Olivera A., Spiegel S. Sphingosine kinase: a mediator of vital cellular functions. Prostaglandins Other Lipid Mediat. 2001;64:123–134. doi: 10.1016/s0090-6980(01)00108-3. [DOI] [PubMed] [Google Scholar]
- 18.Olivera A., Kohama T., Edsall L., Nava V., Cuvillier O., Poulton S., Spiegel S. Sphingosine kinase expression increases intracellular sphingosine-1-phosphate and promotes cell growth and survival. J. Cell Biol. 1999;147:545–558. doi: 10.1083/jcb.147.3.545. [DOI] [PMC free article] [PubMed] [Google Scholar]
- 19.Edsall L. C., Cuvillier O., Twitty S., Spiegel S., Milstien S. Sphingosine kinase expression regulates apoptosis and caspase activation in PC12 cells. J. Neurochem. 2001;76:1573–1584. doi: 10.1046/j.1471-4159.2001.00164.x. [DOI] [PubMed] [Google Scholar]
- 20.Nava V. E., Hobson J. P., Murthy S., Milstien S., Spiegel S. Sphingosine kinase type 1 promotes estrogen-dependent tumorigenesis of breast cancer MCF-7 cells. Exp. Cell Res. 2002;281:115–127. doi: 10.1006/excr.2002.5658. [DOI] [PubMed] [Google Scholar]
- 21.Igarashi N., Okada T., Hayashi S., Fujita T., Jahangeer S., Nakamura S. Sphingosine kinase 2 is a nuclear protein and inhibits DNA synthesis. J. Biol. Chem. 2003;278:46832–46839. doi: 10.1074/jbc.M306577200. [DOI] [PubMed] [Google Scholar]
- 22.Pyne S., Pyne N. J. Sphingosine 1-phosphate signalling and termination at lipid phosphate receptors. Biochim. Biophys. Acta. 2002;1582:121–131. doi: 10.1016/s1388-1981(02)00146-4. [DOI] [PubMed] [Google Scholar]
- 23.Watterson K., Sankala H., Milstien S., Spiegel S. Pleiotropic actions of sphingosine-1-phosphate. Prog. Lipid Res. 2003;42:344–357. doi: 10.1016/s0163-7827(03)00015-8. [DOI] [PubMed] [Google Scholar]
- 24.Spiegel S., Milstien S. Sphingosine 1-phosphate, a key cell signaling molecule. J. Biol. Chem. 2002;277:25851–25854. doi: 10.1074/jbc.R200007200. [DOI] [PubMed] [Google Scholar]
- 25.Alemany R., Sichelschmidt B., zu Heringdorf D. M., Lass H., van Koppen C. J., Jakobs K. H. Stimulation of sphingosine-1-phosphate formation by the P2Y(2) receptor in HL-60 cells: Ca(2+) requirement and implication in receptor-mediated Ca(2+) mobilization, but not MAP kinase activation. Mol. Pharmacol. 2000;58:491–497. doi: 10.1124/mol.58.3.491. [DOI] [PubMed] [Google Scholar]
- 26.Alemany R., Meyer zu Heringdorf D., van Koppen C. J., Jakobs K. H. Formyl peptide receptor signaling in HL-60 cells through sphingosine kinase. J. Biol. Chem. 1999;274:3994–3999. doi: 10.1074/jbc.274.7.3994. [DOI] [PubMed] [Google Scholar]
- 27.Mattie M., Brooker G., Spiegel S. Sphingosine-1-phosphate, a putative second messenger, mobilizes calcium from internal stores via an inositol trisphosphate-independent pathway. J. Biol. Chem. 1994;269:3181–3188. [PubMed] [Google Scholar]
- 28.Cuvillier O., Pirianov G., Kleuser B., Vanek P. G., Coso O. A., Gutkind S., Spiegel S. Suppression of ceramide-mediated programmed cell death by sphingosine-1-phosphate. Nature (London) 1996;381:800–803. doi: 10.1038/381800a0. [DOI] [PubMed] [Google Scholar]
- 29.Perez G. I., Knudson C. M., Leykin L., Korsmeyer S. J., Tilly J. L. Apoptosis-associated signaling pathways are required for chemotherapy-mediated female germ cell destruction [see comments] Nat. Med. 1997;3:1228–1232. doi: 10.1038/nm1197-1228. [DOI] [PubMed] [Google Scholar]
- 30.Morita Y., Perez G. I., Paris F., Miranda S. R., Ehleiter D., Haimovitz-Friedman A., Fuks Z., Xie Z., Reed J. C., Schuchman E. H., et al. Oocyte apoptosis is suppressed by disruption of the acid sphingomyelinase gene or by sphingosine-1-phosphate therapy. Nat. Med. 2000;6:1109–1114. doi: 10.1038/80442. [DOI] [PubMed] [Google Scholar]
- 31.Cuvillier O., Rosenthal D. S., Smulson M. E., Spiegel S. Sphingosine 1-phosphate inhibits activation of caspases that cleave poly(ADP-ribose) polymerase and lamins during Fas- and ceramide-mediated apoptosis in Jurkat T lymphocytes. J. Biol. Chem. 1998;273:2910–2916. doi: 10.1074/jbc.273.5.2910. [DOI] [PubMed] [Google Scholar]
- 32. Reference deleted.
- 33.Birchwood C. J., Saba J. D., Dickson R. C., Cunningham K. W. Calcium influx and signaling in yeast stimulated by intracellular sphingosine 1-phosphate accumulation. J. Biol. Chem. 2001;276:11712–11718. doi: 10.1074/jbc.M010221200. [DOI] [PubMed] [Google Scholar]
- 34.Ng C. K., Carr K., McAinsh M. R., Powell B., Hetherington A. M. Drought-induced guard cell signal transduction involves sphingosine-1-phosphate. Nature (London) 2001;410:596–599. doi: 10.1038/35069092. [DOI] [PubMed] [Google Scholar]
- 35.Van Brocklyn J. R., Lee M. J., Menzeleev R., Olivera A., Edsall L., Cuvillier O., Thomas D. M., Coopman P. J., Thangada S., Liu C. H., et al. Dual actions of sphingosine-1-phosphate: extracellular through the Gi-coupled receptor Edg-1 and intracellular to regulate proliferation and survival. J. Cell Biol. 1998;142:229–240. doi: 10.1083/jcb.142.1.229. [DOI] [PMC free article] [PubMed] [Google Scholar]
- 36.van Koppen C. J., Meyer zu Heringdorf D., Alemany R., Jakobs K. H. Sphingosine kinase-mediated calcium signaling by muscarinic acetylcholine receptors. Life Sci. 2001;68:2535–2540. doi: 10.1016/s0024-3205(01)01049-9. [DOI] [PubMed] [Google Scholar]
- 37.Klippel A., Reinhard C., Kavanaugh W. M., Apell G., Escobedo M. A., Williams L. T. Membrane localization of phosphatidylinositol 3-kinase is sufficient to activate multiple signal-transducing kinase pathways. Mol. Cell. Biol. 1996;16:4117–4127. doi: 10.1128/mcb.16.8.4117. [DOI] [PMC free article] [PubMed] [Google Scholar]
- 38.Deichaite I., Casson L. P., Ling H. P., Resh M. D. In vitro synthesis of pp60v-src: myristylation in a cell-free system. Mol. Cell. Biol. 1988;8:4295–4301. doi: 10.1128/mcb.8.10.4295. [DOI] [PMC free article] [PubMed] [Google Scholar]
- 39.Kaplan J. M., Varmus H. E., Bishop J. M. The src protein contains multiple domains for specific attachment to membranes. Mol. Cell. Biol. 1990;10:1000–1009. doi: 10.1128/mcb.10.3.1000. [DOI] [PMC free article] [PubMed] [Google Scholar]
- 40.Schultz A. M., Henderson L. E., Oroszlan S., Garber E. A., Hanafusa H. Amino terminal myristylation of the protein kinase p60src, a retroviral transforming protein. Science. 1985;227:427–429. doi: 10.1126/science.3917576. [DOI] [PubMed] [Google Scholar]
- 41.Summers S. A., Whiteman E. L., Cho H., Lipfert L., Birnbaum M. J. Differentiation-dependent suppression of platelet-derived growth factor signaling in cultured adipocytes. J. Biol. Chem. 1999;274:23858–23867. doi: 10.1074/jbc.274.34.23858. [DOI] [PubMed] [Google Scholar]
- 42.Stratford S., DeWald D. B., Summers S. A. Ceramide dissociates 3′-phosphoinositide production from pleckstrin homology domain translocation. Biochem. J. 2001;354:359–368. doi: 10.1042/0264-6021:3540359. [DOI] [PMC free article] [PubMed] [Google Scholar]
- 43.Olivera A., Barlow K. D., Spiegel S. Assaying sphingosine kinase activity. Methods Enzymol. 2000;311:215–223. doi: 10.1016/s0076-6879(00)11084-5. [DOI] [PubMed] [Google Scholar]
- 44.Chavez J. A., Summers S. A. Characterizing the effects of saturated fatty acids on insulin signaling and ceramide and diacylglycerol accumulation in 3T3-L1 adipocytes and C2C12 myotubes. Arch. Biochem. Biophys. 2003;419:101–109. doi: 10.1016/j.abb.2003.08.020. [DOI] [PubMed] [Google Scholar]
- 45.Olivera A., Kohama T., Edsall L., Nava V., Cuvillier O., Poulton S., Spiegel S. Sphingosine kinase expression increases intracellular sphingosine-1-phosphate and promotes cell growth and survival. J. Cell Biol. 1999;147:545–558. doi: 10.1083/jcb.147.3.545. [DOI] [PMC free article] [PubMed] [Google Scholar]
- 46.Liu H., Toman R. E., Goparaju S. K., Maceyka M., Nava V. E., Sankala H., Payne S. G., Bektas M., Ishii I., Chun J., et al. Sphingosine kinase type 2 is a putative BH3-only protein that induces apoptosis. J. Biol. Chem. 2003;278:40330–40336. doi: 10.1074/jbc.M304455200. [DOI] [PubMed] [Google Scholar]
- 47.Rydel R. E., Greene L. A. cAMP analogs promote survival and neurite outgrowth in cultures of rat sympathetic and sensory neurons independently of nerve growth factor. Proc. Natl. Acad. Sci. U.S.A. 1988;85:1257–1261. doi: 10.1073/pnas.85.4.1257. [DOI] [PMC free article] [PubMed] [Google Scholar]
- 48.Ferrari G., Yan C. Y., Greene L. A. N-acetylcysteine (D- and L-stereoisomers) prevents apoptotic death of neuronal cells. J. Neurosci. 1995;15:2857–2866. doi: 10.1523/JNEUROSCI.15-04-02857.1995. [DOI] [PMC free article] [PubMed] [Google Scholar]
- 49.Yan C. Y., Ferrari G., Greene L. A. N-acetylcysteine-promoted survival of PC12 cells is glutathione-independent but transcription-dependent. J. Biol. Chem. 1995;270:26827–26832. doi: 10.1074/jbc.270.45.26827. [DOI] [PubMed] [Google Scholar]
- 50.Park D. S., Farinelli S. E., Greene L. A. Inhibitors of cyclin-dependent kinases promote survival of post-mitotic neuronally differentiated PC12 cells and sympathetic neurons. J. Biol. Chem. 1996;271:8161–8169. doi: 10.1074/jbc.271.14.8161. [DOI] [PubMed] [Google Scholar]
- 51.Farinelli S. E., Greene L. A. Cell cycle blockers mimosine, ciclopirox, and deferoxamine prevent the death of PC12 cells and postmitotic sympathetic neurons after removal of trophic support. J. Neurosci. 1996;16:1150–1162. doi: 10.1523/JNEUROSCI.16-03-01150.1996. [DOI] [PMC free article] [PubMed] [Google Scholar]
- 52.Pitson S. M., Xia P., Leclercq T. M., Moretti P. A., Zebol J. R., Lynn H. E., Wattenberg B. W., Vadas M. A. Phosphorylation-dependent translocation of sphingosine kinase to the plasma membrane drives its oncogenic signalling. J. Exp. Med. 2005;201:49–54. doi: 10.1084/jem.20040559. [DOI] [PMC free article] [PubMed] [Google Scholar]


