

Abstract
The importance of Gly-93 and Gly-94 in transmembrane segment M1 of the Na+,K+-ATPase for interaction with Na+ and K+ was demonstrated by functional analysis of mutants Gly-93-Ala and Gly-94-Ala. In the crystal structures of the Ca2+-ATPase, the corresponding residues, Asp-59 and Leu-60, are located exactly where M1 bends. Rapid kinetic measurements of K+-induced dephosphorylation allowed determination of the affinity of the E2P phosphoenzyme intermediate for K+. In Gly-94-Ala, the K+ affinity was reduced 9-fold, i.e., to the same extent as seen for mutation of the cation-binding residue Glu-329. Furthermore, Gly-94-Ala showed strongly reduced sensitivity of the E1P-E2P equilibrium to Na+, with accumulation of E2P even at 600 mM Na+, indicating that interaction of E2P with extracellular Na+ is impaired. On the contrary, in Gly-93-Ala, the affinity for K+ was slightly increased, and the E1P-E2P equilibrium was displaced in favor of E1P. In both mutants, the affinity of the cytoplasmically facing sites of E1 for Na+ was reduced, but this effect was relatively small compared with the effects seen for E2P in Gly-94-Ala. Comparison with Ca2+-ATPase mutagenesis data suggests that the role of M1 in binding of the transported ions is universal among P-type ATPases, despite the low sequence homology in this region. Structural modeling of Na+,K+-ATPase mutant Gly-94-Ala on the basis of the Ca2+-ATPase crystal structures indicates that the alanine side chain comes close to Ile-287 of M3, particularly in E2P, thus resulting in a steric clash that may explain the present observations.
Keywords: membrane transport, mutagenesis, P-type ATPase
The Na+,K+-ATPase (EC 3.6.1.37) is a prominent member of the family of cation-transporting P-type ATPases, which in addition include H+,K+-ATPase, H+-ATPase, heavy metal transporting ATPases, and plasma membrane and organellar Ca2+-ATPases. The Na+,K+-ATPase exchanges intracellular Na+ for extracellular K+ at a ratio of 3:2, using energy liberated by ATP hydrolysis. A common feature of the transport cycles of P-type ATPases is the phosphorylated intermediate formed by transfer of the γ-phosphoryl group of ATP to a conserved aspartyl residue within the protein. The simplified reaction sequence  describes how transitions between major Na+,K+-ATPase conformational states lead to ATP hydrolysis coupled with sequential ion translocation across the membrane (1, 2). In E1 and E2P, the enzyme binds the cations from the cytoplasmic and extracellular sides of the membrane, respectively. In E1P(Na3) and E2(K2), the ions are bound in so-called “occluded” states (indicated by parentheses), where they have no access to the medium on either side of the membrane due to closure of cytoplasmic as well as extracellular gates (2, 3). The Na+,K+-ATPase is made up of 10 transmembrane helices, M1–M10 (4, 5), and a cytoplasmic part consisting of three domains denoted A (actuator), N (nucleotide-binding), and P (phosphorylation) domains in the terminology based on the high-resolution crystal structure of the closely related Ca2+-ATPase (6). No high-resolution structure of the Na+,K+-ATPase is yet available, but oxygen-containing residues making up the three Na+-binding sites in the E1 conformation of the enzyme have been pinpointed in transmembrane segments M4, M5, M6, M8, and M9, based on biochemical and mutagenesis experiments in conjunction with homology modeling (7–12). Glu-329 of M4 (Ca2+-ATPase Glu-309) has been pinpointed as a gating residue (11, 13, 14). In the Ca2+-ATPase, the conformation of Glu-309 seems to be locked in the correct position for Ca2+ occlusion by transmembrane segment M1 (14), in accordance with site-directed mutagenesis studies demonstrating that M1 is critical for Ca2+ interaction (15). Structural models based on x-ray crystallography now exist for several Ca2+-ATPase intermediates except E2P. Conformational differences between the various Ca2+-ATPase crystal structures encompass a shift of M1–M2 helices in the direction perpendicular to the membrane, as well as a bending of M1 at Asp-59, and these movements might be important for the gating of the Ca2+-binding sites (6, 14, 16–19). The bending of M1 may occur by steric collision with M3 (16). It is not known whether M1 is critical for cation interaction in other P-type ATPase family members, and whether M1 plays a role in binding of the countertransported ions in E2P (H+ in Ca2+-ATPase, K+ in Na+,K+-ATPase).
In the present study, we have focused on the functional role of M1 of the Na+,K+-ATPase, which has not been previously investigated. The amino acid sequence homology between Na+,K+-ATPase and Ca2+-ATPase is relatively weak in M1, as seen from the structure-based sequence alignment in Fig. 1, making it difficult to judge whether M1 plays the same role(s) in Na+,K+-ATPase as in Ca2+-ATPase. Importantly, all Na+,K+-ATPase (and H+,K+-ATPase) isoforms contain two glycines (Gly-93 and Gly-94) at the positions corresponding to Asp-59 and Leu-60 of the Ca2+-ATPase, which represents quite a large difference in side-chain properties exactly where M1 bends in the Ca2+-ATPase crystal structures. We have replaced Gly-93 and Gly-94 individually with alanine and demonstrate that Gly-94 is crucial for the correct interaction with Na+ and K+, particularly in the E2P form. The data support the view that, despite the lack of sequence homology in the region where M1 bends in the Ca2+-ATPase, this region exhibits similar overall structural features in Na+,K+-ATPase and Ca2+-ATPase and plays a critical role in cation interaction, which is universal among P-type ATPases.
Fig. 1.

Sequence alignment (5) of the M1 region of Ca2+-ATPase (Upper) and Na+,K+-ATPase (Lower). The residues studied here (Gly-93 and Gly-94) and the corresponding residues in the Ca2+-ATPase are highlighted in yellow, and conserved residues are shown in red.
Methods
Mutations Gly-93-Ala and Gly-94-Ala were introduced directly into full-length cDNA encoding the ouabain-resistant rat α1-isoform of Na+,K+-ATPase using the QuickChange Site-Directed Mutagenesis kit (Stratagene). Expression in COS cells and isolation of the plasma membrane fraction, which was made leaky before functional analysis, have been described (9, 20). Steady-state and transient kinetic measurements of overall and partial reactions were performed by using a manual mixing technique or a quench-flow module (QFM-5 or SFM-400/Q, Bio-Logic Science Instruments, Claix, France), according to previously described principles (9, 20–22) and as detailed in the legends to Figs. 2, 3, 4. An assay (Fig. 4B) was applied to determine the apparent affinity of the K+ sites of E2P by measurement of the K+ dependence of E2P dephosphorylation, using a double-mixing protocol. Background phosphorylation, determined with 50 mM KCl instead of NaCl, was subtracted from each data point. Data were normalized, averaged, and fitted as described (22).
Fig. 2.

Na+ dependence (A) and time course (B) of phosphorylation from [γ-32P]ATP. (A) Phosphorylation at 0°C for 15 s in 20 mM Tris (pH 7.5)/3 mM MgCl2/2 μM [γ-32P]ATP/10 μM ouabain/20 μg/ml oligomycin, and the indicated concentrations of NaCl with N-methyl-d-glucamine added to maintain the ionic strength. Each line shows the best fit of the Hill equation, and the extracted K0.5 and Hill number (nH) values are listed in Table 1: filled squares, wild type; open triangles pointing downward, Gly-93-Ala; open squares, Gly-94-Ala. (B) Phosphorylation of E1Na3 at 25°C in the presence of 100 mM NaCl/40 mM Tris (pH 7.5)/3 mM MgCl2/1 mM EGTA/10 μM ouabain/20 μg/ml oligomycin/2 μM[γ-32P]ATP. Each line shows the best fit of a monoexponential function, and the extracted rate constants are listed in Table 1. Symbols as for A.
Fig. 3.

Distribution of phosphoenzyme between E1P and E2P intermediates at 20 mM Na+ (A) and 600 mM Na+ (B) and dephosphorylation at 600 mM Na+ (C). Symbols as for Fig. 2. (A) Phosphorylation was performed at 0°C for 15 s in 20 mM NaCl/130 mM choline chloride/20 mM Tris (pH 7.5)/3 mM MgCl2/1mM EGTA/10 μM ouabain/2 μM[γ-32P]ATP. Dephosphorylation was studied upon chase with 1 mM ATP and 2.5 mM ADP. Each line shows the best fit of a biexponential decay function. (B) Twenty millimolar NaCl plus 130 mM choline chloride was replaced by 600 mM NaCl. The initial amounts of E1P and E2P, corresponding to the amplitudes of the rapid and slow phases, respectively, are listed in Table 1. (C) Phosphoenzyme was formed at 0°C for 15 s in 600 mM NaCl/20 mM Tris (pH 7.5)/3 mM MgCl2/1 mM EGTA/10 μM ouabain/2 μM [γ-32P]ATP. Dephosphorylation was studied upon addition of 1 mM ATP and 20 mM KCl. The phosphoenzyme half-lives are: wild-type, 3.85 s; Gly-93-Ala, 6.52 s; and Gly-94-Ala, 0.83 s.
Fig. 4.

K+ dependence of Na+,K+-ATPase activity (A) and Na+ and K+ dependencies of E2P dephosphorylation (B and C). (A) Na+,K+-ATPase activity measured at 37°C in 40 mM NaCl/3 mM ATP/3 mM MgCl2/30 mM histidine buffer (pH 7.4)/1 mM EGTA/10 μM ouabain, and the indicated concentrations of KCl. Symbols as for Fig. 2. Each line shows the best fit of the Hill equation, and the extracted K0.5 and nH values are listed in Table 1. (B) Phosphorylation was performed at 25°C for 5 s in 20 mM NaCl/130 mM choline chloride/20 mM Tris (pH 7.5)/3 mM MgCl2/1 mM EGTA/10 μM ouabain (1 μM ouabain was used with Gly-94-Ala, because of the increased ouabain affinity of this mutant)/2 μM [γ-32P]ATP. Dephosphorylation was studied upon addition of 1 mM unlabeled ATP and 200 mM NaCl (dashed lines with circles), or 1 mM unlabeled ATP and 1 mM KCl (solid lines with squares and triangles). Each line shows the best fit of a monoexponential decay function, and the extracted rate constants are: filled circles, wild-type, 3.4 s–1; open circles, Gly-94-Ala, 1.1 s–1; filled squares, wild-type, 62 s–1; open triangles pointing downward, Gly-93-Ala, 64 s–1; open squares, Gly-94-Ala, 15 s–1; open triangles pointing upward, Glu-329-Gln, 8 s–1.(C) The experiments were performed as in B (solid lines), except that various concentrations of KCl with choline chloride (to maintain ionic strength) were added, and the rate constants are shown as a function of the K+ concentration. Each line shows the best fit of the Hill equation, and the extracted K0.5 and nH values are listed in Table 1. Symbols as for B. The maximal rate of dephosphorylation corresponding to infinite K+ concentration is: wild-type, 210 s–1; Gly-93-Ala, 192 s–1; Gly-94-Ala, 258 s–1; and Glu-329-Gln, 186 s–1.
Results
Expression, Na+,K+-ATPase Activity, and Ouabain Sensitivity. The expression strategy takes advantage of the lower ouabain sensitivity of the exogenous rat Na+,K+-ATPase [ligand concentration giving half-maximum effect (K0.5) of wild type, >100 μM] compared with the endogenous COS cell Na+,K+-ATPase (K0.5 ≈0.3 μM), allowing stable cell lines expressing functional rat Na+,K+-ATPase to be isolated in the presence of 5 μM ouabain, due to preferential inhibition of the endogenous enzyme (9, 20). Like the wild-type rat Na+,K+-ATPase, mutants Gly-93-Ala and Gly-94-Ala conferred ouabain resistance to the COS cells when 5 mM K+ was present in the growth medium, indicating that the Na+,K+-transport rate of the mutants is high enough to preserve cell viability. The cells expressing Gly-94-Ala were, however, unable to grow at a reduced K+ concentration of 0.9 mM, which was sufficient for wild type and Gly-93-Ala, indicating that the affinity for extracellular K+ was reduced in Gly-94-Ala.
The mutants and wild type were expressed to similar protein levels (≈60 pmol per mg of total membrane protein). Relative to wild type, the catalytic turnover rate was reduced to 57% in Gly-94-Ala, whereas Gly-93-Ala was wild type-like. The ouabain concentration dependence of Na+,K+-ATPase activity showed a 7-fold decrease of K0.5 for ouabain inhibition in Gly-94-Ala relative to wild type, whereas Gly-93-Ala was wild type-like (Table 1).
Table 1. Parameters of overall and partial reactions.
| Mutation | Turnover rate for ATP hydrolysis, min-1* | K0.5 for ouabain inhibition, μM† | K0.5 for Na+ activation of phosphorylation, mM‡ | Phosphorylation rate, s-1§ | E2(K2), %¶ | E1P/E2P at 20 mM Na+, %/%∥ | E1P/E2P at 600 mM Na+, %/%** | K0.5 for K+ activation of ATPase activity, mM†† | K0.5 for K+ activation of E2P → E2(K2), mM‡‡ |
|---|---|---|---|---|---|---|---|---|---|
| Wild type | 8,474 ± 165 | 128 ± 8 | 0.51 ± 0.03 | 27 ± 1 | 90 ± 1 | 22/78 | 100/0 | 0.59 ± 0.01 | 2.50 ± 0.76 |
| (nH = 1.49) | (nH = 1.36) | (nH = 0.85) | |||||||
| Gly-93-Ala | 9,393 ± 354 | 168 ± 12 | 0.86 ± 0.05 | 23 ± 1 | 84 ± 3 | 49/51 | 100/0 | 0.51 ± 0.03 | 1.64 ± 0.27 |
| (nH = 1.51) | (nH = 1.35) | (nH = 1.19) | |||||||
| Gly-94-Ala | 4,825 ± 386 | 18 ± 1.4 | 1.40 ± 0.10 | 16 ± 1 | 81 ± 2 | 10/90 | 24/76 | 2.17 ± 0.09 | 22.8 ± 5.88 |
| (nH = 1.35) | (nH = 1.67) | (nH = 0.86) | |||||||
| Glu-329-Gln | 2,530 ± 106§§ | — | 2.6§§ | — | <10§§ | 17/83§§ | 100/0 | — | 24.1 ± 10.1 |
| (nH = 1.04) |
The turnover rate was calculated as the ratio between the Na+, K+-ATPase activity (at 37°C, 130 mM NaCl, 20 mM KCl, and 3 mM ATP) and the maximum capacity for phosphorylation (21).
Determined by ouabain titration of the Na+, K+-ATPase activity at 37°C in 30 mM histidine (pH 7.4), 130 mM NaCl, 20 mM KCl, 3 mM ATP, 3 mM MgCl2, and 1 mM EGTA. The data were fitted by the sum of two hyperbolic components, a high-affinity component corresponding to endogenous COS cell Na+, K+-ATPase (K0.5 0.3 μM) and a low-affinity component corresponding to recombinant exogenous rat enzyme.
From Fig. 2A.
From Fig. 2B.
K+ deocclusion measured as described (11) following preequilibration in the presence of 1 mM K+.
From Fig. 3A.
From Fig. 3B.
From Fig. 4A.
From Fig. 4C.
Na+ Dependence and Time Course of Phosphorylation from [γ-32P]ATP. Activation of phosphorylation from ATP requires the binding of Na+ at cytoplasmically facing high-affinity sites of the E1 form. As seen in Fig. 2A and Table 1, the apparent affinity for Na+ activation of phosphorylation was 2.7-fold reduced (K0.5 increased) for mutant Gly-94-Ala compared with wild type. Likewise, substitution of Gly-93 with alanine resulted in an increase of K0.5, although to a lesser extent (1.7-fold). It should be noted that oligomycin was included in the reaction medium to stabilize the phosphorylated E1P(Na3) form of the enzyme, thereby minimizing the effect of variation in the dephosphorylation rate on apparent Na+ affinity.
The time course of phosphorylation of the E1 form from 2 μM [γ-32P]ATP in the presence of a saturating Na+ concentration of 100 mM is shown in Fig. 2B. To allow measurements within milliseconds, a quench-flow technique was used (22). The phosphorylation rate was 1.2-fold reduced in Gly-93-Ala, relative to wild type, whereas Gly-94-Ala was more severely affected, displaying 1.7-fold reduction (Table 1).
K+ Occlusion. Because the data in Fig. 2 A indicate that the apparent affinity for Na+ is reduced in the mutants, we wondered whether the E1-E2 conformational equilibrium was displaced away from the Na+-binding E1 form toward the K+-binding E2 form. The relative amount of K+-occluded E2(K2) present at equilibrium was determined at 1 mM K+ by measuring the enzyme fraction, which is unable to phosphorylate instantaneously after addition of Na+ and [γ-32P]ATP to enzyme preequilibrated with K+ (11, 22). As seen in Table 1, the equilibrium level of K+-occluded E2(K2) was slightly reduced in Gly-93-Ala and Gly-94-Ala compared with wild type, thus arguing against a shift of the E1-E2 equilibrium in favor of E2. The rate of K+ deocclusion from E2(K2), also determined by this method (see refs. 11 and 22), was very similar to that of the wild type (wild type, 0.015 ± 0.001 s–1; Gly-93-Ala, 0.020 ± 0.002 s–1; and Gly-94-Ala, 0.016 ± 0.002 s–1).
Distribution of Phosphoenzyme Between E1P and E2P Forms. E1P and E2P differ in their interaction with nucleotide and the transported ions. E1P has Na+ bound in an occluded state and is K+-insensitive and ADP-sensitive, i.e., able to react with ADP and donate the phosphoryl group back to ADP, forming ATP. In contrast, E2P is ADP-insensitive (dephosphorylates only by reaction with water) and possesses extracellularly facing cation-binding sites with low affinity for Na+ and high affinity for K+. The binding of extracellular K+ accelerates hydrolysis of E2P [the K+-sensitive phosphoenzyme intermediate (1, 23)]. The difference in ADP sensitivity can be used to quantify the relative amounts of E1P and E2P. Fig. 3A shows the time course of dephosphorylation upon addition of ADP to phosphoenzyme formed from [γ-32P]ATP in the presence of a relatively low Na+ concentration of 20 mM. Two exponential decay phases could be distinguished, the rapid phase corresponding to E1P, reacting backward with ADP, and the slow phase corresponding to hydrolysis of E2P. The amounts of E1P and E2P initially present were estimated by fitting a biexponential function to the data. Under these conditions, the E1P/E2P ratio was 22/78, 49/51, and 10/90 in wild type, Gly-93-Ala, and Gly-94-Ala, respectively (Fig. 3A). Thus, alanine substitution of Gly-93 and Gly-94 affects the E1P-E2P distribution in opposite directions. The E1P/E2P ratio was also determined at a high Na+ concentration of 600 mM, known to promote accumulation of E1P in the wild type. Under these conditions, the phosphoenzyme was exclusively E1P in the wild type and Gly-93-Ala (Fig. 3B and Table 1; E1P/E2P ratio, 100/0), whereas the E1P/E2P ratio was only 24/76 in Gly-94-Ala. Thus, in Gly-94-Ala, the E2P form accumulated even in the presence of a high Na+ concentration, demonstrating insensitivity of the E1P-E2P equilibrium to Na+. To exclude that the accumulation of E2P in Gly-94-Ala was caused by ouabain binding (as described above, this mutant displayed increased affinity for ouabain), the same experiment was carried out in the complete absence of ouabain. Apart from the contribution to the rapid phase by the endogenous enzyme (≈10% of the phosphorylation), the two data sets were indistinguishable (not shown). Fig. 3C shows the time course of dephosphorylation of phosphoenzyme formed at 600 mM Na+ upon chase with nonlabeled ATP without ADP. The chase solution in addition contained 20 mM K+ to allow rapid hydrolysis of E2P. For wild type and Gly-93-Ala, the phosphoenzyme intermediate present at 600 mM Na+ was E1P, and the dephosphorylation studied under these conditions therefore occurred through the reaction sequence E1P → E2P → E2. Because the E1P → E2P transition is rate limiting (E2P → E2 being relatively rapid in the presence of K+), the slower phosphoenzyme decay seen for Gly-93-Ala relative to wild type (1.7-fold increase of the half-life) must be due to slowing of E1P → E2P. For Gly-94-Ala, on the other hand, the major part of the phosphoenzyme was the K+-sensitive E2P form, as described above, and accordingly the phosphoenzyme decay contained a relatively fast phase reflecting E2P → E2.
Interaction of E2P with K+ and Na+. As seen in Fig. 4A and Table 1, examination of the K+ concentration dependence of Na+,K+-ATPase activity showed that the K0.5 for K+ activation of Gly-93-Ala is similar to that of the wild-type enzyme, whereas a 3.7-fold increase of the K0.5 for K+ was found for Gly-94-Ala, i.e., a reduced apparent K+ affinity. To examine the binding of K+ at the transport sites of E2P more directly, we studied the K+ concentration dependence of the rate of E2P dephosphorylation. To accumulate E2P, phosphoenzyme was formed from [γ-32P]ATP in the presence of 20 mM Na+ at 25°C, using quench-flow module QFM-5, and the dephosphorylation induced by various K+ concentrations was followed. Fig. 4B depicts results obtained at 1 mM K+. A monoexponential function could be fitted to the data, and Fig. 4C shows the rate constants of E2P dephosphorylation determined in this way for several K+ concentrations, allowing extraction of the K0.5 values for K+ activation of E2P dephosphorylation by fitting a Hill function. The K0.5 of 2.5 mM found for wild type matches well the value of 1.9–4.5 mM determined for K+ binding to extracellularly facing transport sites in a sided system consisting of nonpermeabilized cells or Na+,K+-ATPase reconstituted in planar bilayer membranes (24, 25), consistent with the notion that K+ activates E2P dephosphorylation from the extracellular side (1, 2). The K0.5 value of Gly-93-Ala was reduced 1.5-fold relative to wild type, whereas a conspicuous 9.1-fold increase of the K0.5 value (decrease of K+ affinity) was found for Gly-94-Ala, indicating that the function of the transport sites of E2P is defective (Fig. 4C and Table 1). For comparison, mutant Glu-329-Gln with alteration to the cation-binding residue in M4 (11, 12) was also studied, revealing a 9.6-fold increase of K0.5 for K+ activation of E2P dephosphorylation. Furthermore the rate of E2P dephosphorylation observed in the presence of 200 mM Na+ without K+ was found 3-fold reduced in Gly-94-Ala compared with wild type (Fig. 4B).
Finally, it was examined whether the active inward transport of K+ mediated by Na+,K+,2Cl–, and K+,Cl– cotransporters was needed for growth of the cells expressing Gly-94-Ala, Glu-329-Gln, or wild type, by addition to the cell culture of the efficient inhibitors bumetanide and azosemide (26) of the cotransporters. Neither of these inhibitors prevented cell growth for mutants or wild type.
Discussion
This study provides functional evidence for a critical role of transmembrane segment M1 of the Na+,K+-ATPase in interaction with Na+ and K+. Mutational effects on cation binding were found both for E1 and E2P intermediates, but the effects were most pronounced for E2P (Table 1).
Dealing first with the effects on the E1 form, the K0.5 for Na+ activation of phosphorylation was increased 2.7-fold in Gly-94-Ala and 1.7-fold in Gly-93-Ala. In neither case can the effect be explained by a displacement of the E2-E1 equilibrium away from the Na+-binding E1 form, in favor of E2, because the equilibrium level of K+-occluded E2(K2) was slightly decreased in both mutants. Hence, our data suggest a defective interaction of E1 with Na+ in both mutants. The mutations moreover reduced the rate of phosphorylation of E1, which may be explained by the defective Na+ interaction, interfering with the Na+-induced propagation of conformational changes to the catalytic site.
Our measurements of the K+ concentration dependence of Na+,K+-ATPase activity revealed a 3.7-fold increase of the K0.5 for K+ activation in mutant Gly-94-Ala compared with wild type. Furthermore, the cells expressing mutant Gly-94-Ala required a higher K+ concentration in the growth medium than the cells expressing the wild type, indicating reduced affinity of the mutant for extracellular K+. In principle, such effects could reflect either an impaired binding of K+ at the transport sites, or a lower steady-state level of the K+-binding E2P phosphoenzyme intermediate. Because the distribution of phosphoenzyme between E1P and E2P was shifted in favor of E2P in Gly-94-Ala, it appears that K+ binding to E2P is defective in the mutant. Direct evidence that the reduced apparent affinity for K+ in Gly-94-Ala is caused by a change of the binding of K+ to E2P was obtained in rapid kinetic studies of K+ dependence of E2P dephosphorylation, demonstrating a conspicuous 9-fold increase of K0.5 for K+ activation (Fig. 4 B and C). In contrast, Gly-93-Ala showed a slightly increased affinity for K+. It is noteworthy that the observed change of affinity of E2P for K+ in Gly-94-Ala is similar in magnitude to that displayed by mutant Glu-329-Gln, in which the cation-binding glutamate of M4 is replaced. For Glu-329-Gln, we previously observed a remarkable acceleration of K+ deocclusion from E2(K2), implying improper gate closure (11). The rate of K+ deocclusion from E2(K2) was wild type-like in Gly-94-Ala, thus excluding a gating defect in E2(K2) of Gly-94-Ala. Hence, for Gly-94-Ala, the defective K+ interaction seems to be associated primarily with the E2P form. The defect may be caused by interference with the binding of extracellular K+, or the cytoplasmic gate could be improperly closed in E2P, resulting in binding of K+ from both sides of the membrane with accompanying change of apparent K+ affinity. The latter situation should lead to backward leak of K+ out of the cells through the pump protein in the E2P conformation. However, because the cells expressing the mutant were able to grow even in the presence of inhibitors of other active K+ transport systems (Na+,K+,2Cl– and K+,Cl– cotransporters), the mutant Na+,K+-ATPase seems to mediate net uptake of K+ into the cytoplasm, thus indicating that any backward leak of K+ must be relatively small. For comparison, it may be noted that also mutation Glu-329-Gln was compatible with cell growth in the presence of inhibitors of Na+,K+,2Cl– and K+,Cl– cotransporters, whereas substitution of this gating residue with the smaller residues aspartate and alanine was lethal, even without the presence of these inhibitors (8, 9).
In wild-type Na+,K+-ATPase, Na+ is released at the extracellular side of the membrane in connection with the conformational transition from E1P to E2P, and a high Na+ concentration displaces the E1P-E2P conformational equilibrium in favor of E1P. Mutant Gly-93-Ala showed an increased tendency for accumulation of E1P compared with wild type, caused by a slower E1P(Na3) → E2P transition. By contrast, in Gly-94-Ala, the E1P/E2P ratio was reduced, being only 24/76 at the high Na+ concentration of 600 mM where all phosphoenzyme is E1P in wild type (Fig. 3B). To our knowledge, this kind of functional perturbation has not previously been described for any Na+,K+-ATPase mutant. Because the K+ affinity of E2P is reduced as discussed above, it appears likely that the cation-binding sites of E2P are distorted in some way, and the insensitivity of the E1P-E2P equilibrium to high Na+ concentrations may therefore result from interference with binding of extracellular Na+ to E2P and consequent prevention of the conversion of E2P back to E1P. Given that the interaction of E1 with Na+ is defective, as discussed above, it is moreover plausible that a destabilization of the Na+-occluded E1P form contributes to the shift of the E1P-E2P equilibrium in favor of E2P. The 3-fold reduced rate of dephosphorylation of E2P at 200 mM Na+ (Fig. 4B) supports the notion that Na+ binding to E2P is defective in Gly-94-Ala, because Na+ at such high concentration is known to induce some activation of dephosphorylation of E2P in wild type (1). This is an effect exerted from the extracellular side, presumably by binding of Na+ in place of K+ at the transport sites of E2P (1, 27), because it correlates with activation of the turnover rate by extracellular Na+ in sided systems in the absence of K+, and because Na+ at concentrations above 25 mM does not affect the turnover rate when acting from the cytoplasmic side (27).
Gly-94-Ala was furthermore characterized by an increased apparent affinity for ouabain, which may be a consequence of the accumulation of E2P, because ouabain binds preferentially to E2P (note that accumulation of E2P was seen also in the absence of ouabain, excluding the possibility that it could be secondary to ouabain binding). Another possibility is a more direct effect of the structural perturbation of M1, because the extracellular loop connecting M1 and M2 is thought to participate in ouabain binding (8).
According to the sequence alignment of the M1 region shown in Fig. 1, the positions of Gly-93 and Gly-94 of the Na+,K+-ATPase are equivalent to those of Asp-59 and Leu-60 of the Ca2+-ATPase. In a recent study (15), we found that replacement of Asp-59 and Leu-60 interfered with Ca2+ occlusion in the E1 form, which corresponds well with the reduction of the intrinsic Na+ affinity of E1 in Na+,K+-ATPase mutants Gly-93-Ala and Gly-94-Ala observed here. Interestingly, substitution of Asp-59 of the Ca2+-ATPase with leucine furthermore accelerated the E1P(Ca2) → E2P transformation and slowed dephosphorylation of E2P (15). In light of the present findings with the Na+,K+-ATPase, a likely interpretation of the latter effects is that the Asp-59-Leu mutation reduces the affinity for Ca2+ on the luminal side (facilitates Ca2+ dissociation) and interferes with binding of countertransported protons required for activation of the dephosphorylation of E2P, i.e., effects analogous to those described here for Na+,K+-ATPase mutant Gly-94-Ala with respect to Na+ and K+ interaction at the extracellularly facing sites. It is not straightforward to demonstrate directly a role for proton binding in the activation of dephosphorylation of Ca2+-ATPase analogous to that for K+ in connection with Na+,K+-ATPase dephosphorylation, because pH changes exert multiple functional effects. Hence, for characterization of the interaction with counterions, the Na+,K+-ATPase is an advantageous experimental system compared with Ca2+-ATPase.
The difference between Na+,K+-ATPase and Ca2+-ATPase with respect to side-chain bulkiness in the region where M1 bends in Ca2+-ATPase may appear surprising, considering the similarity between the functional perturbations induced by mutations in this region in the two proteins. A clue to understanding is obtained by noting that in the Ca2+-ATPase crystal structures, the bend of M1 comes very close to M3, this approach being allowed by the presence of a small glycine, Gly-257, in M3. Because the Na+,K+-ATPase has an isoleucine (Ile-287) in M3 at the position corresponding to Gly-257 of the Ca2+-ATPase, a glycine must be present in M1 of the Na+,K+-ATPase at the position corresponding to Leu-60 of the Ca2+-ATPase to avoid steric clash, if the overall relations of M1 and M3 are similar in the Na+,K+-ATPase and the Ca2+-ATPase. Under the latter assumption, the substitution of Na+,K+-ATPase Gly-94 with the more bulky alanine should lead to steric problems with Ile-287 of M3 (see Fig. 5), which may explain the present findings. Because the part of M1 immediately next to the bend interacts with the cation-binding glutamate of M4 (14), improper positioning of the M1 helix and restriction of its movement during the transport cycle are likely to interfere with cation binding and reduce cation affinity both in the E1 conformation and in E2P, as observed. It is noteworthy that the disturbance of the membrane region by changes to M1 does not seem to hinder the movements of the cytoplasmic domains leading to loss of ADP sensitivity [E1P → E2P transition, i.e., the insertion of the TGES motif of domain A into the catalytic site (18)], because E2P was found to accumulate in Gly-94-Ala. In the absence of a crystal structure corresponding to the E2P form, the E2 crystal forms with bound MgF42– or AlF4– represent the most useful models of genuine E2P (18, 19). Importantly, the distance between M1 and M3 near the bend of M1 is particularly small in these crystal structures (see Fig. 5), thus explaining that the Gly-94-Ala mutation was found most disruptive in E2P. It is interesting to speculate that in genuine E2P, the Gly-94–Ile-287 pair (Ca2+-ATPase Leu-60–Gly-257) might form a contact point between M1 and M3, which could play a role as pivot for the movement of M1 in connection with the opening of the ion-binding sites toward the extracellular side in E2P, thereby being critical to the interaction of E2P with extracellular ions.
Fig. 5.
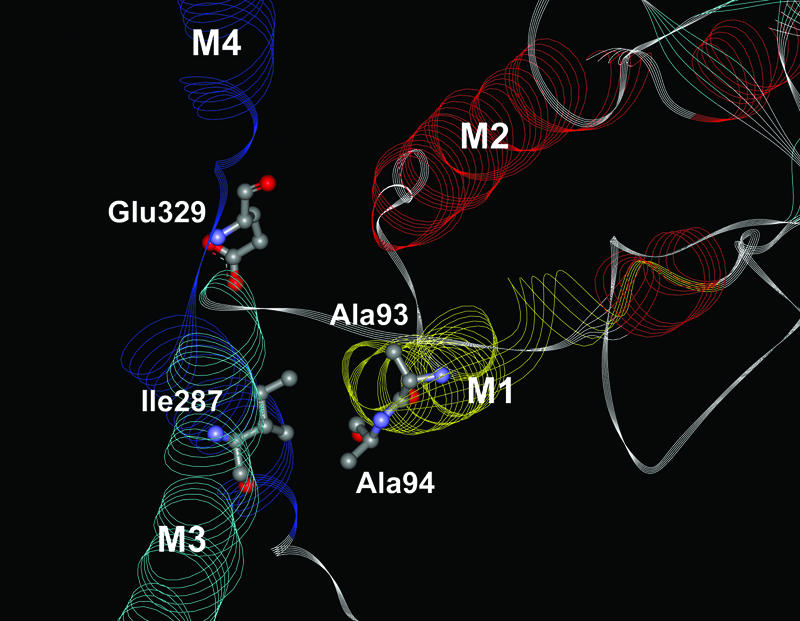
View from the cytoplasmic side of transmembrane segments M1–M4 of the crystal structure of the Ca2+-ATPase E2 form with bound MgF42– [mimicking phosphate (18)], with alanine replacement of Asp-59 and Leu-60 (M1) and isoleucine replacement of Gly-257 (M3) to model the Na+,K+-ATPase mutants Gly-93-Ala and Gly-94-Ala. The residue numbering shown corresponds to Na+,K+-ATPase. The side chain of the alanine replacing Gly-94 in the mutant comes within3Åof Ile-287, leading to steric problems.
Acknowledgments
We thank Janne Petersen, Jytte Jorgensen, and Kirsten Lykke Pedersen for expert technical assistance. This work was supported in part by grants from the Danish Medical Research Council, the Lundbeck Foundation, the Novo Nordisk Foundation, and the Research Foundation of Aarhus University.
Author contributions: A.P.E., J.P.A., and B.V. designed research; A.P.E. and M.T.-J. performed research; A.P.E., M.T.-J., J.P.A., and B.V. analyzed data; and A.P.E., J.P.A., and B.V. wrote the paper.
This paper was submitted directly (Track II) to the PNAS office.
Abbreviation: K0.5, ligand concentration giving half-maximum effect.
References
- 1.Post, R. L., Hegyvary, C. & Kume, S. (1972) J. Biol. Chem. 247, 6530–6540. [PubMed] [Google Scholar]
- 2.Glynn, I. M. (1993) J. Physiol. 462, 1–30. [DOI] [PMC free article] [PubMed] [Google Scholar]
- 3.Vilsen, B., Andersen, J. P., Petersen, J. & Jorgensen, P. L. (1987) J. Biol. Chem. 262, 10511–10517. [PubMed] [Google Scholar]
- 4.Hu, Y. K. & Kaplan, J. H. (2000) J. Biol. Chem. 275, 19185–19191. [DOI] [PubMed] [Google Scholar]
- 5.Sweadner, K. J. & Donnet, C. (2001) Biochem. J. 356, 685–704. [DOI] [PMC free article] [PubMed] [Google Scholar]
- 6.Toyoshima, C., Nakasako, M., Nomura, H. & Ogawa, H. (2000) Nature 405, 647–655. [DOI] [PubMed] [Google Scholar]
- 7.Arguello, J. M. & Kaplan, J. H. (1994) J. Biol. Chem. 269, 6892–6899. [PubMed] [Google Scholar]
- 8.Lingrel, J. B. & Kuntzweiler, T. (1994) J. Biol. Chem. 269, 19659–19662. [PubMed] [Google Scholar]
- 9.Vilsen, B. (1995) Biochemistry 34, 1455–1463. [DOI] [PubMed] [Google Scholar]
- 10.Blostein, R., Wilczynska, A., Karlish, S. J., Arguello, J. M. & Lingrel, J. B. (1997) J. Biol. Chem. 272, 24987–24993. [DOI] [PubMed] [Google Scholar]
- 11.Vilsen, B. & Andersen, J. P. (1998) Biochemistry 37, 10961–10971. [DOI] [PubMed] [Google Scholar]
- 12.Ogawa, H. & Toyoshima, C. (2002) Proc. Natl. Acad. Sci. USA 99, 15977–15982. [DOI] [PMC free article] [PubMed] [Google Scholar]
- 13.Inesi, G., Ma, H., Lewis, D. & Xu, C. (2004) J. Biol. Chem. 279, 31629–31637. [DOI] [PubMed] [Google Scholar]
- 14.Toyoshima, C. & Mizutani, T. (2004) Nature 430, 529–535. [DOI] [PubMed] [Google Scholar]
- 15.Einholm, A. P., Vilsen, B. & Andersen, J. P. (2004) J. Biol. Chem. 279, 15888–15896. [DOI] [PubMed] [Google Scholar]
- 16.Toyoshima, C. & Nomura, H. (2002) Nature 418, 605–611. [DOI] [PubMed] [Google Scholar]
- 17.Sorensen, T. L., Moller, J. V. & Nissen, P. (2004) Science 304, 1672–1675. [DOI] [PubMed] [Google Scholar]
- 18.Toyoshima, C., Nomura, H. & Tsuda, T. (2004) Nature 432, 361–368. [DOI] [PubMed] [Google Scholar]
- 19.Olesen, C., Sorensen, T. L., Nielsen, R. C., Moller, J. V. & Nissen, P. (2004) Science 306, 2251–2255. [DOI] [PubMed] [Google Scholar]
- 20.Vilsen, B. (1995) Acta Physiol. Scand. 154, Suppl. 624, 1–146. [PubMed] [Google Scholar]
- 21.Vilsen, B. (1997) Biochemistry 36, 13312–13324. [DOI] [PubMed] [Google Scholar]
- 22.Toustrup-Jensen, M. & Vilsen, B. (2002) J. Biol. Chem. 277, 38607–38617. [DOI] [PubMed] [Google Scholar]
- 23.Post, R. L., Kume, S., Tobin, T., Orcutt, B. & Sen, A. K. (1969) J. Gen. Physiol. 54, 306s–326s. [DOI] [PMC free article] [PubMed] [Google Scholar]
- 24.Wall, S. M. & Koger, L. K. (1994) Am. J. Physiol. 267, F660–F670. [DOI] [PubMed] [Google Scholar]
- 25.Gropp, T., Cornelius, F. & Fendler, K. (1998) Biochim. Biophys. Acta 1368, 184–200. [DOI] [PubMed] [Google Scholar]
- 26.Heitzmann, D., Warth, R., Bleich, M., Henger, A., Nitschke, R. & Greger, R. (2000) Eur. J. Physiol. 439, 378–384. [DOI] [PubMed] [Google Scholar]
- 27.Cornelius, F. & Skou, J. C. (1988) Biochim. Biophys. Acta 944, 223–232. [DOI] [PubMed] [Google Scholar]