Abstract
Myxobacteria provide one of the simplest models of cell–cell interaction and organized cell movement leading to cellular differentiation. When starved, tens of thousands of cells change their movement pattern from outward spreading to inward concentration; they form aggregates that become fruiting bodies. Cells inside fruiting bodies differentiate into round, nonmotile, environmentally resistant spores. Traditionally, cell aggregation has been considered to imply chemotaxis; a long-range cell interaction. However, myxobacterial aggregation is the consequence of direct cell-contact interactions, not chemotaxis. We present here a 3D stochastic lattice-gas cellular automata model of cell aggregation based on local cell–cell contact, and no chemotaxis. We demonstrate that a 3D discrete stochastic model can simulate two stages of cell aggregation. First, a “traffic jam” forms embedded in a field of motile cells. The jam then becomes an aggregation center that accumulates more cells. We show that, at high cell density, cells stream around the traffic jam, generating a 3D hemispherical mound. Later, when the nuclear traffic jam dissolves, the aggregation center becomes a 3D ring of streaming cells.
Keywords: cell aggregation, cellular automata, collective behavior, myxobacteria, pattern formation
Different types of cells in a multicellular organism have the same genome, yet they specialize, structurally and chemically, to carry out particular functions. How do developing cells differentiate? How, for example, do hairs or feathers differentiate in the uniform skin ectoderm of vertebrates? Differentiation within groups of equivalent cells appears to depend on local interactions between cells. A 3D multiscale model of morphogenesis that includes differentiation, growth, death, and migration of cells, as well as changes in the shapes of cells and tissues and the secretion and absorption of extracellular materials, has been described (1). Although the complex interactions between cells in vertebrate organogenesis have received the most attention, genetic programs for differentiation are also found in bacteria. The relative simplicity of bacterial development means that their genes and cell movements can be delineated more clearly (2).
Myxobacteria are found in cultivated soils all over the earth. Their biological success is due to social behavior that resembles the cellular slime molds and, to some extent, development in animals and plants (3). Myxobacteria move by gliding across the surface of soil particles, or of agar in the laboratory. They feed on colonies of other bacteria like packs of microbial wolves: Surrounding a colony, each myxobacterial cell secretes hydrolytic enzymes that digest the prey and shares the products of hydrolysis with its mates. Competing with many other micro-predators in soil, their food supply is often depleted. As they approach nutrient depletion, 100,000 myxobacterial cells stop growing and first use a quorum sensor to communicate with each other. If a quorum is present, the cells aggregate in several stages, culminating in formation of a multicellular fruiting body that ensures their long-term survival and facilitates dispersion of their spores. The modes of cell–cell communication that lead to myxobacterial fruiting bodies are quite unique. Myxobacteria use two cell–cell signals: first, the diffusible, quorum-sensing A-signal to certify the presence of enough cells to build a fruiting body, then the cell-surface-bound C-signal to coordinate the gliding movements of individual cells by cell contact. C-signal switches cell behavior from frequent reversal to consistent streaming (4).
Aggregation models of Escherichia Coli (5, 6), Bacillus subtilis (7–9), and Dictyostelium amoebae (7, 10, 11) have been based on chemotaxis, a long-range cell interaction that has chemical reaction-diffusion dynamics. Cells move up the chemical gradient toward aggregates that are large and near. By contrast, without using chemotactic cues (15, 16), myxobacteria can travel many cell lengths to enter an aggregate (17). Here, we demonstrate that local cell-contact interactions are sufficient to produce 3D aggregates.
The traveling wave patterns (or ripples) observed early in myxobacterial aggregation have been reproduced in 2D models based on cell collisions (20–23). Two complementary models have been proposed for myxobacteria aggregation: a continuous model developed for rippling that has been extended to aggregation (24), and a discrete model that focuses on aggregation without rippling (25, 26). Cells in the latter simulations move on a 2D lattice with local interaction rules based entirely on contact-mediated cell signaling and result in a two-stage process of aggregation mediated by streams of cells. These aggregates resemble the experimentally observed aggregates and are stable to large perturbations. Noise actually increases the effectiveness of streams and leads to larger, more stable aggregates.
Myxobacterial Movement
Myxobacteria cells are elongated, rod-shaped cells. They move only on surfaces, and their motion is directed along their long axis. They move in one direction for awhile, then reverse. Two molecular motors, retractile grappling hooks at their leading end (S-motility) (28) and jets for secreting a polysaccharide gel at the trailing end (A-motility) (29), provide thrust. A plastic peptidoglycan cell wall surrounds the cell, giving it a cylindrical rod shape. However, if the cell lies on a curved surface, the wall can bend. The C-signal, a 17-kDa cell-surface-associated protein (15), coordinates cell movement during fruiting-body development. C-signal is exchanged when a pair of cells makes end-to-end contact with each other (30); side-by-side or end-by-side contacts do not exchange signal. When development starts, there are few C-signal molecules per cell, and cells making end-to-end contact respond to signal exchange by reversing their direction of gliding (31). Regular reversals generate the ripple pattern. However, each time C-signal is exchanged, a positive feedback loop elevates the number of signal molecules on signaling cells. After cells have accumulated 25–50 C-signal molecules, instead of reversing in response to C-signal exchange, they respond to the signal by suppressing reversal and continue to move in the same direction. When the end of a cell nudges the cell ahead of it, this response causes the two cells to move as a chain (17). A chain of many cells moving in the same direction is a stream.
Aggregation
Myxobacterial aggregation begins with the formation of stationary traffic jams involving hundreds of cells [Fig. 1, first and fourth frames (31)]. When cells moving in opposite directions happen to meet in a small area, they stall at the points of collision if they are prevented from turning by other cells at their side or behind them. In the experiment with cells submerged in culture (19), cells first settle on the bottom of the culture and immediately form domains of cells (facet patterns) (19), where cells align roughly parallel to each other within each domain while different domains have different orientations. Traffic jams then form at intersections of two domains (32). Such jammed cells remain stationary for several hours. Jam formation is purely mechanical, it does not involve C-signaling. The high cell density of a traffic jam prevents other cells from penetrating it. The system enters a second stage of aggregation, after cells have elevated their C-signal levels and have begun to stream. As a stream of cells approaches a traffic jam, the stream glides over or around the jam, treating the jam as if it were an inanimate lump. The stream of cells must bend as it passes over or around the jam and thus initiates a roughly circular orbit. Because the traffic jam has a long and a short axis (Fig. 1, first frame), the shape begins as a semiellipsoid (second frame). However, as more layers of circulating cells form, the mass becomes more spherical (third frame).
Fig. 1.
Photographs (taken with a ×16 phase contrast objective lens) of M. xanthus aggregates at 8, 11, and 24 h for the first three frames. The last frame shows an electron micrograph of an early aggregate, a traffic jam. [Reproduced with permission from refs. 19 and 32 (Copyright 1982 and 2004, American Society for Microbiology).]
In this article, we demonstrate a 3D model of fruiting-body formation based entirely on cell-contact interactions. When cells are at high density, a traffic jam forms a central domain in the nascent aggregate. Cells stall their engines in a traffic jam when they collide in a disordered way. Later, when cells happen to stream toward a traffic jam, they circulate around the jam in both counterclockwise and clockwise orbits, enlarging the aggregate. Then when the nuclear traffic jam dissipates, the aggregate becomes a ring whose center has a lower cell density than its periphery, as observed experimentally (27). Our model is able to describe all three of these stages of aggregate formation.
Computational Model
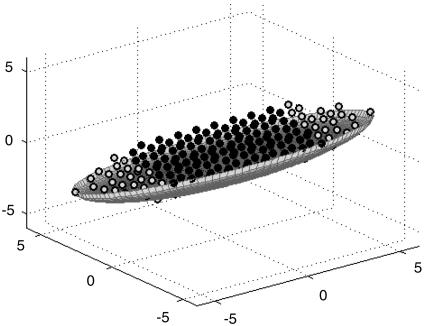
Our 3D lattice-gas cellular automata model is based on local rules that are suggested by the experimental evidence of fruiting-body development in Myxococcus xanthus (18). It relies on C-signal transmission between pairs of cells, the responses of cells to signaling, and collective motion in streams. The cell body is represented by an array of pixels on a 3D hexagonal lattice that is generated automatically once the geometric shape, orientation, and sizes of the cell are given. For this study, we have chosen to model rod-like myxobacteria cells as ellipsoids (see Fig. 2). Each cell has two poles: a head and a tail, whose sizes can be varied. The cells are modeled as elongated ellipsoids with a length of 2–12 μm and a diameter of 0.7–1.2 μm. All simulation results shown below employ cells of length 11.0 μm and of diameter 2.4 μm, except for the section describing the effect of varying the cell aspect ratio (cell length to diameter). On a 3D hexagonal lattice each node has 12 nearest neighbors. Therefore, the long axis of each cell has 12 possible orientations (or channels). By an exclusion rule of the lattice-gas cellular automata, there can be only one cell center of mass per node per channel. Thus, a maximum of 12 cell centers, each occupying a different channel, can occupy a single node on the lattice. The nodes occupied by the extended cell body, on the other hand, allow overlapping. As mentioned above, real myxobacteria are flexible and can turn through small angles. The model constrains cells to turn by 60° or to persist moving in the original direction. In addition, a cell moves preferentially in the direction that maximizes the overlap of its pole areas with one of its immediate neighbors.
Fig. 2.
A single myxobacterial cell body (dark dots) with its poles (light dots) as arrays of pixels on a 3D hexagonal lattice contained in an ellipsoid of particular size. The surface is grayed to indicate the cell surface.
In accord with experiments, the cell poles are the only C-signaling-sensitive areas, and C-signaling occurs in the model only when the poles of several cells overlap. During aggregation, when the level of C-signal is high, the cells interact only when a “head” array overlaps with a “tail” array of another cell, and the cells stream. The cells are also allowed to climb over each other and to glide down the other side. A cell moves to an upper layer only if all neighboring nodes in the current layer are occupied. This condition embodies the fact that myxobacteria move on surfaces by gliding only and do not swim (18). During each time step, we first calculate the probabilities of all possible reorientations of a particular cell as a function of the amount of overlap of its head pole with the tail poles of its neighbors. Each cell can turn by 60° in the 3D hexagonal lattice or preserve its current orientation. The probability of choosing orientation (i) is
 |
where β is an alignment parameter; Z is the normalization factor, Z=∑iPi; and C(i) describes the overlap between head pole of the current cell oriented along ith direction and tails of cells in the neighborhood.
Results
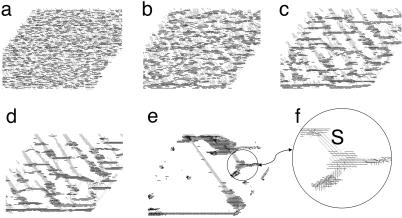
To simulate formation of traffic jams, we start with 6,000 cells randomly distributed on the lowest level (the substrate) in a 100 × 100 × 3 lattice (Fig. 3a), which corresponds to the experimental cell density (32). [The cell density is 60% = (number of occupied nodes/number of all bottom nodes) × 100%.] Although we represent the cell body as an elongated ellipsoid in our simulations, we represent the cells in pictures by unit vectors plotted at the cell centers and directed in accordance with the cells' orientations. When the cell density is high, this drawing style helps distinguish one cell from another. The cells are initially randomly distributed both in spatial directions and orientations. Fig. 3 shows different stages of development starting with initially random pattern and culminating in several traffic jams. Even though all cells in our model follow the same simple set of rules, several different patterns emerge as a result of cell interactions. At first, cells form patches, within which cells have predominantly the same orientation. Cells located near a boundary between two patches that have opposite orientations jam against each other (Fig. 3b), resulting in a 2D structure that we call a traffic jam. Cells that are not in the immediate vicinity of such jams can form streams (Fig. 3c), in which cells align with each other and move in the same direction. In time, the streams become more pronounced (Fig. 3d). Because of cell streaming, not all of the 2D jammed structures survive. Some of them dissipate by joining streams moving toward other jammed structures. This results in the formation of bigger 3D asymmetric stationary aggregates that we consider mature traffic jams (Fig. 3e). Streams appear in our simulations as thin 2D threads with cells gliding on the substrate. Recalling that myxobacteria interact only with their neighbors and only through contact, cell–cell interactions are limited to a small region of a few cell lengths. Long and thin streams forming between traffic jams redistribute the cells. Cells outside of jams continue a random walk until they join one of the streams.
Fig. 3.
Traffic jam formation (2D projections of 3D simulations) starting from random initial distribution of cells on the bottom level of the domain 100 × 100 × 3 with the cell density 60% at 0 (a), 4 (b), 15 (c), 32 (d), and 1,370 (e) time steps. (f) An enlarged view of a small section from e, showing the details of cell arrangements. The cells are not drawn to scale but are represented by unit vectors passing through the cell centers. Shades of gray correspond to cell orientations. “S” in f indicates a stream. Cells in streams move parallel to each other in both directions.
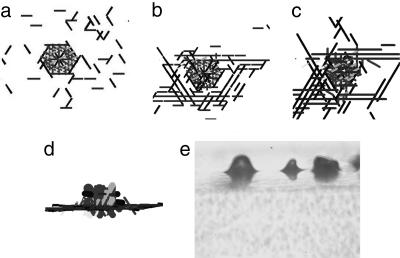
We have previously reported the formation and interaction between aggregates (25, 26). In this paper, to study the formation of a single aggregate, we have inserted an artificially constructed 3D traffic jam into the middle of the simulation domain and have left the rest of the cells distributed randomly on the bottom level. Cells are oriented to move only on the bottom level, and they are given a density of 40% (Fig. 4a). Initially, cells in the inserted traffic jam were “frozen”; they were not allowed to move. To build a 3D aggregate, we added cells at a constant rate to the boundaries of the simulation domain. Those incoming cells had random in-plane orientations.
Fig. 4.
Simulations of aggregate growth starting from “frozen” jam (a). Some cells start to circulate around jam in both clockwise and counterclockwise directions, forming a motile “skirt” (b), and some of them glide over the jam, where some part of gliding cells is getting “stuck” (c), resulting in a bell-shaped aggregate formation [d (side view)]. (e) Experimental photo of M. xanthus fruiting bodies in a side view (×10 magnification). The cells in a–c are represented by unit vectors passing through the cell center rather than by their real shape and dimensions to visually distinguish one cell from another.
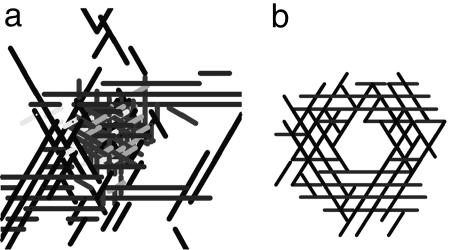
Several different types of cell behavior were observed. Some cells that approach the jam glide over it. Others circulate around the jam in both counterclockwise and clockwise directions, forming a sort of “skirt” around the jammed cells. Still others climb over the jam, remain on it, and increase its volume (Fig. 4b). After 400 time steps, a bell-shaped structure formed over the initial traffic jam [Fig. 4 c (top view) and d (side view)]. For this simulation, the C-signal level of the cells engaged in circular motion had been set to be 100 times higher than the rest of the cells. To summarize, the simulations showed that a traffic jam can trigger the formation of an aggregate and that an aggregate with a stationary traffic jam inside grows larger with time. When the frozen cells on the bottom level of the traffic jam in the middle of an aggregate were unfrozen, the aggregate transformed into a completely motile toroidal shell with a low cell density in the center. In the resulting aggregate, all of the cells were moving, and the structure was capable of fusing with other aggregates (25, 26, 32) (see Fig. 5).
Fig. 5.
Evolution of a 3D bell-shaped aggregate (a) after “unfreezing” bottom jammed cells, into motile 2D toroid-like structure (b).
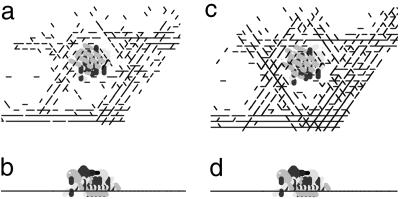
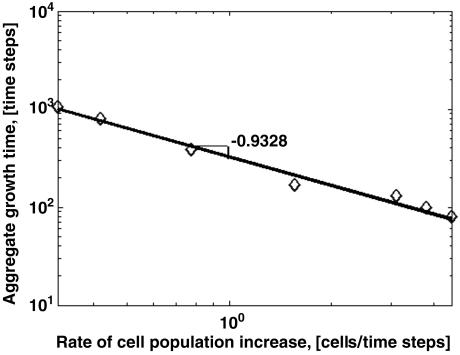
The simulated aggregates stopped growing when they became hemispheres, even though there were plenty of cells for further growth. Once the aggregate reached a hemispherical shape, incoming cells continued joining cells in a “motile skirt” [Fig. 6 a (top view) b (side view)], but apparently their addition was balanced by a loss of cells from the skirt. Fig. 6 demonstrates that the enlargement of a hemispherical aggregate stops after 2,000 time steps. The average time required for an aggregate to reach its final hemispherical shape depends on the initial cell density and the rate at which cells are added to the simulation domain. Fig. 7 demonstrates that the aggregation time drops nearly hyperbolically as the rate of cell population change increases.
Fig. 6.
Final configuration of a 3D aggregate as it reaches a hemispherical form by 2,000 time steps. (a) Top view. (b) Side view. Further development does not change the aggregate form, despite of sufficient amount of cells available for further growth. (c) Top view, 4,000 time steps. (d) Side view, 4,000 time steps. The initial cell density is 26%. The rate of cell population increase is 0.19 cells per time step.
Fig. 7.
The average time it takes an aggregate to reach a final hemispherical form versus the rate of cell population increase for the initial cell density of 45%. The graph is in log–log scale. The linear function that fits the data points in a least squares sense is ln(y) = –0.9328 ln(x) + 5.8463.
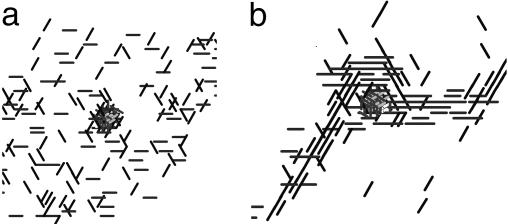
In our model, the cell shape changes the areas of the head and tail poles and increases or decreases the interactions between neighboring cells. Consequently the cells' shape influences their ability to aggregate. In our simulations, elongated cells with a wide range of aspect ratios from 9:2.4 to 19:2.4 aggregated around a frozen traffic jam and created a “skirt” and then a 3D mound. Shorter cells did not aggregate. For example, in the simulation represented in Fig. 8a, the rounded cells, which initially were randomly distributed over the simulation domain, did not accumulate near or over the traffic jam. However, long cells with aspect ratios of 19:2.4 (Fig. 8b) gathered into a motile toroidal shell surrounding a frozen traffic jam, and they started to accumulate on top of the traffic jam.
Fig. 8.
Pattern formation with different cell aspect ratio (cell length/cell diameter) after 200 time steps. (a) Round cells. (b) Cells with aspect ratios of 19:2.4.
Further development of the aggregate into a mature 3D fruiting body will require cell differentiation, in which rod-shaped myxobacteria differentiate into rounded spores that have lost the ability to move.
Conclusions
We have constructed a 3D stochastic computational model for studying myxobacteria aggregation that is based on cell-contact interactions and the streaming of cells, without chemotaxis. The model reproduced several of the stages of aggregation that have been experimentally observed, including nonsymmetric, initial aggregates (traffic jams), streams, and hemispherical 3D mounds surrounded by a motile “skirt.”
The model demonstrates that the traffic jams can serve as initial “seeds” for aggregation, which then develop into mature 3D mounds. Specifically, a traffic jam acted as a mechanical obstacle for the cells streaming toward it. Cells tried to bypass a traffic jam by either climbing on top of it or by going around it. After an initial motile “skirt” was created around the traffic jam, new cells joined its edge until a 3D toroidal shell was formed. Three-dimensional simulations captured both the formation of a skirt around a traffic jam and the subsequent dissolution of the jam by cell bending and cell reversal. Then, cells from the jam joined the motile skirt. We also demonstrated the importance of cell polarity, showing that rod-like cells could aggregate but spheres could not. We have demonstrated the feasibility of a cellular model of myxobacterial morphogenesis that is described at the subcellular level by pixels, while the operational unit is the whole cell. Conceivably, a similar approach could be adopted to unravel the mechanisms of morphogenesis in animals.
Acknowledgments
M.A. and O.S. were partially supported by National Science Foundation Grant IBN-0083653, Y.J. was supported by the Department of Energy under Contract W-7405-ENG-36, and D.K. was supported by National Institutes of Health Grant GM23441.
Author contributions: O.S., Y.J., D.K., and M.A. designed research; O.S., Y.J., D.K., and M.A. performed research; O.S., Y.J., and M.A. contributed new reagents/analytic tools; O.S. analyzed data; and O.S., Y.J., D.K., and M.A. wrote the paper.
References
- 1.Chaturvedi, R., Huang, C., Kazmierczak, B., Schneider, T., Izaguirre, J. A., Glimm, T., Hentschel, H. G. E., Glazier, J. A., Newman, S. A. & Alber, M. (2005) J. R. Soc. Interface 2, 237–253. [DOI] [PMC free article] [PubMed] [Google Scholar]
- 2.Zhang, R., Pappas, T., Brace, J. L., Miller, P. C., Oulmassov, T., Molyneaux, J. M., Anderson, J. C., Bashkin, J. K., Winans, S. C. & Joachimiak, A. (2002) Nature 417, 971–974. [DOI] [PubMed] [Google Scholar]
- 3.Igoshin, O. A., Kaiser, D. & Oster, G. (2004) Curr. Biol. 14, R459–R462. [DOI] [PubMed] [Google Scholar]
- 4.Sproer, C., Reichenbach, H. & Stackebrandt, E. (1999) Int. J. Syst. Bacteriol. 49, 1255–1262. [DOI] [PubMed] [Google Scholar]
- 5.Tsimring, L. & Levine, H. (1995) Phys. Rev. Lett. 75, 1859–1862. [DOI] [PubMed] [Google Scholar]
- 6.Brenner, M. P., Levitov, L. S. & Budrene, E. O. (1998) Biophys. J. 74, 1677–1693. [DOI] [PMC free article] [PubMed] [Google Scholar]
- 7.Matsushita, M. & Fujikawa, H. (1990) Physica A 168, 498–506. [Google Scholar]
- 8.Ben-Jacob, E., Cohen, I. & Levine, H. (2000) Adv. Phys. 49 4, 395–554. [Google Scholar]
- 9.Komoto, A., Hanaki, K., Maenosono, S., Wakano, J. Y., Yamaguchi, Y. & Yamamoto, K. (2003) J. Theor. Biol. 225, 91–97. [DOI] [PubMed] [Google Scholar]
- 10.Martiel, J. & Goldbeter, A. (1987) Biophys. J. 52, 807. [DOI] [PMC free article] [PubMed] [Google Scholar]
- 11.Hofer, T., Sherratt, J. A. & Maini, P. K. (1995) Proc. R. Soc. London Ser. B 259, 249–257. [DOI] [PubMed] [Google Scholar]
- 12.Wakano, J. Y., Maenosono, S., Komoto, A., Eiha, N. & Yamaguchi, Y. (2003) Phys. Rev. Lett. 90, 258102. [DOI] [PubMed] [Google Scholar]
- 13.Maree, A. F. M. & Hogeweg, P. (2001) Proc. Natl. Acad. Sci. USA 98, 3879–3883. [DOI] [PMC free article] [PubMed] [Google Scholar]
- 14.Maree, A. F. M., Panfilov, A. V. & Hogeweg, P. (1999) Proc. R. Soc. London Ser. B 266, 1351–1360. [Google Scholar]
- 15.Lobedanz, S. & Sogaard-Andersen, L. (2003) Genes Dev. 17, 2151–2161. [DOI] [PMC free article] [PubMed] [Google Scholar]
- 16.Dworkin, M. (1996) Microbiol. Rev. 60, 70–102. [DOI] [PMC free article] [PubMed] [Google Scholar]
- 17.Jelsbak, L. & Sogaard-Andersen, L. (2000) Curr. Opin. Microbiol. 3, 637–642. [DOI] [PubMed] [Google Scholar]
- 18.Kaiser, D. (2004) Annu. Rev. Microbiol. 58, 75–98. [DOI] [PubMed] [Google Scholar]
- 19.Kuner, J. M. & Kaiser, D. (1982) J. Bacteriol. 151, 458–461. [DOI] [PMC free article] [PubMed] [Google Scholar]
- 20.Igoshin, O. A., Mogilner, A., Kaiser, D. & Oster, G. (2001) Proc. Natl. Acad. Sci. USA 98, 14913–14918. [DOI] [PMC free article] [PubMed] [Google Scholar]
- 21.Borner, U., Deutsch, A., Reichenbach, H. & Bar, M. (2002) Phys. Rev. Lett. 89, 078101. [DOI] [PubMed] [Google Scholar]
- 22.Lutscher, F. & Stevens, A. (2002) Nonlinear Sci. 12, 619–640. [Google Scholar]
- 23.Alber, M. S., Jiang, Y. & Kiskowski, M. A. (2004) Physica D. 191, 343–358. [Google Scholar]
- 24.Igoshin, O., Welsh, R., Kaiser, D. & Oster, G. (2004) Proc. Natl. Acad. Sci. USA 101, 4256–4261. [DOI] [PMC free article] [PubMed] [Google Scholar]
- 25.Alber, M. S., Kiskowski, M. A. & Jiang, Y. (2004) Phys. Rev. Lett. 9, 068301. [DOI] [PubMed] [Google Scholar]
- 26.Kiskowski, M. A., Jiang, Y. & Alber, M. S. (2004) Phys. Biol. 1, 173–183. [DOI] [PubMed] [Google Scholar]
- 27.Sager, B. & Kaiser, D. (1993) Genes Dev. 7, 1645–1653. [DOI] [PubMed] [Google Scholar]
- 28.Nudleman, E. & Kaiser, D. (2004) J. Mol. Microbiol. Biotechnol. 7, 52–62. [DOI] [PubMed] [Google Scholar]
- 29.Wolgemuth, C., Hoiczyk, E., Kaiser, D. & Oster, G. (2002) Curr. Biol. 12, 369–377. [DOI] [PubMed] [Google Scholar]
- 30.Kim, S. K. & Kaiser, D. (1990) Science 249, 926–928. [DOI] [PubMed] [Google Scholar]
- 31.Welch, R. & Kaiser, D. (2001) Proc. Natl. Acad. Sci. USA 98, 14907–14912. [DOI] [PMC free article] [PubMed] [Google Scholar]
- 32.Kaiser, D. & Welch, R. (2004) J. Bacteriol. 186, 919–927. [DOI] [PMC free article] [PubMed] [Google Scholar]


