

Abstract
The estimated glucose disposal rate (eGDR) serves as a novel indicator of insulin resistance, which has been shown to correlate with cardiovascular disease risk; however, its relationship with cognitive function remains unclear.This article describes a cross-sectional study design based on data from the 2011–2014 National Health and Nutrition Examination Survey (NHANES). The Weighted logistic regression and the restricted cubic spline were employed to examine the relationship between eGDR and cognitive ability.The subjects were divided into two categories: the normal group and the cognitive function decline (CFD) group, based on their cognitive scores. There were significant differences in eGDR levels between the two groups(P = 0.001).After adjusting for relevant covariates, notable differences were found between eGDR and cognitive function when eGDR was expressed in both continuous and categorical data forms (P < 0.05). The stability of these findings was further confirmed through sensitivity analyses.This difference persisted in subgroups, including women, individuals with education beyond high school, moderate drinkers, and those who had not been diagnosed with stroke (P < 0.05). A restricted cubic spline revealed a non-linear relationship with an inflection point between the two (P-for-non-linear < 0.05, P-overall < 0.001). This study contributes to the understanding of the relationship between eGDR and cognitive performance by identifying a potential non-linear association.
Supplementary Information
The online version contains supplementary material available at 10.1038/s41598-025-89623-8.
Subject terms: Neurology, Neurological disorders
Introduction
As the world’s population ages, the cognitive well-being of individuals has become an important public health concern deserving of focus1, with cognitive impairment becoming increasingly prevalent among the elderly2. Cognitive decline is hypothesized to impose a substantial burden on both the economy and society as a whole3,4. From this perspective, the early detection of cognitive decline holds considerable significance. Insulin, a peptide hormone secreted by the pancreas, plays a critical role in various physiological processes. Previous research indicates that insulin dysregulation may lead to neurodegeneration through multiple biological pathways5. Insulin resistance (IR) refers to the inability of target tissues to respond appropriately to insulin. It is recognized as a crucial pathophysiological feature of metabolic syndrome6, and is considered a major risk factor in the progression of cognitive decline7. Common methods for measuring IR include the hyperinsulinemic-euglycemic (HI-EG) clamp and the Homeostasis Model Assessment of IR (HOMA-IR). However, the former is invasive and often unavailable in most clinical settings, and the cutoff value for HOMA-IR in diagnosing IR remains uncertain8.
The estimated glucose disposal rate (eGDR), an innovative, straightforward, cost-effective, and non-invasive approach for detecting insulin resistance (IR), has demonstrated strong validation and practicality as a method compared to the hyperinsulinemic-euglycemic clamp (HI-EG) method9. Recent studies have indicated that an increased eGDR correlates with a diminished likelihood of developing cardiovascular and cerebrovascular conditions, along with a decrease in overall mortality rates9–13. However, whether an association exists between eGDR and cognitive performance remains unclear. In view of this, our main purpose is to investigate their potential relationship.
Our study hypothesises that the estimated glucose disposal rate (eGDR) is significantly positively correlated with cognitive performance. Specifically, it is proposed that higher eGDR levels may be associated with better cognitive function, reflecting the potential impact of insulin resistance on cognitive health.
Methods
Study population
The NHANES is a great, well-represented nationwide survey that is considered to provide unbiased estimates due to the use of sample weights. This survey conducted at a single point in time seeks to collect data about the health and nutritional status of Americans. The data for this study are derived from the NHANES public database. The NHANES protocol received approval from the National Center for Health Statistics Research Ethics Review Board, and informed consent was obtained from all participants.We chose data from the 2011–2012 and 2013–2014 NHANES cycles, which contained 19,931 individuals. The screening process was as follows: 1. Screening for Age: Of the initial sample, 16,299 participants aged below 60 were excluded, leaving 3,632 participants.2. Variable Availability: Subsequently, 601 participants with incomplete data on waist circumference and HbA1c were excluded, resulting in a final sample size of 3,031 participants.3. Cognitive Score: Subsequently, 343 participants lacking cognitive score data were excluded, reducing the sample size to 2,688 participants.4. Hypertension Data: Subsequently, 23 participants with incomplete data on hypertension were excluded, leaving a final sample size of 2,665 participants with complete data for the final analysis. This rigorous selection process ensured that the final sample size was 2,665 participants with complete data, enabling robust and reliable analyses.The exclusion criteria were primarily determined on the basis of the composition of the exposure and outcome variables. The exposure variable, estimated glucose disposal rate (eGDR), is calculated using a formula that incorporates three variables: haemoglobin A1c (HbA1c), waist circumference, and hypertension status. Consequently, participants lacking data on any of the aforementioned variables were excluded from the subsequent analysis. With regard to the outcome variable, cognitive function scores were only accessible for individuals aged 60 years or above in the NHANES database. Consequently, individuals below the age of 60 and those lacking cognitive function data were excluded from the study. Figure 1 presents this screening process.
Fig. 1.

Flow chat for the study design and participants.
Data Collection.Trained interviewers collected data on sociodemographic and lifestyle factors, medical history, anthropometric measurements, and laboratory results. The sociodemographic factors included age, sex, ethnicity, educational attainment, marital status, and the family income to poverty ratio (PIR). Lifestyle factors encompassed smoking, drinking, and physical activity. Participants were categorized based on their smoking history: non-smokers were defined as individuals who had smoked fewer than 100 cigarettes throughout their lives, while smokers were those who had smoked a minimum of 100 cigarettes in their lifetime. Physical activity was evaluated using the World Health Organization (WHO) guidelines14. Participants whose physical activity levels fell below the recommended amounts were classified as less active, while those meeting or exceeding the recommendations were considered active. Individuals who did not partake in any moderate or vigorous physical activity were labeled as inactive.
Diabetes and hypertension (HT) are partially defined by medical history. All definitions of stroke are also derived from medical history. Participants who received notification from a physician or another healthcare provider regarding their experience of having a stroke were categorized as ‘yes’, while those who had not received such a diagnosis were classified as ‘no’.
Anthropometric and laboratory data included waist circumference, systolic blood pressure (SBP), diastolic blood pressure (DBP), height, weight, glycosylated hemoglobin (HbA1c), fasting blood glucose (FBG) and the oral glucose tolerance test (OGTT).Body mass index (BMI) was calculated as weight (kg) / height (m)².
Body Mass Index (BMI) was systematically classified into three distinct categories based on established health standards. The first category, deemed ‘normal,’ includes individuals with a BMI below 25.0 kg/m². The second category is classified as ‘overweight,’ which encompasses those with a BMI ranging from 25.0 to just under 30 kg/m². Lastly, the third category is identified as ‘obesity,’ which applies to individuals whose BMI is 30 kg/m² or greater. This categorization follows the specific limits set forth by the WHO15, ensuring that the classifications align with widely recognized health guidelines.
Diabetes diagnosis was defined as follows:1. self-reported diagnosis by medical staff;2.self-reported diabetes related medications use.3. FPG not less than 126 mg/dL or HbA1c not less than 6.5% or the OGTT test shows that the 2-hour blood glucose is greater than or equal to 200 mg/dL.
The definitions of alcohol consumption and hypertension are presented in Table 1.
Table 1.
Alcohol consumption and hypertension classification.
| Category | Definition |
|---|---|
| Drinking Status | |
| Never Drinkers | Participants who have not consumed a minimum of 12 servings of any alcoholic beverage in their lifetime. |
| Moderate Drinkers | Individuals who have consumed one alcoholic beverage per day for women or a maximum of two drinks per day for men over the past year. |
| Heavy Drinkers | Women who exceed one drink daily, men who exceed two drinks daily, or those who have ever consumed more than four alcoholic beverages in a single day |
| Hypertension | |
| Definition | (1) Systolic blood pressure ≥ 140 mm Hg and/or diastolic blood pressure ≥ 90 mm Hg; (2) Personal history indicating a diagnosis of hypertension;3. Use of antihypertensive medications. |
The classification of drinking status is based on guidelines from the National Institute on Alcohol Abuse and Alcoholism (NIAAA)16. Definitions of hypertension are primarily derived from participants’ medical history and specified diagnostic criteria.
In our study, a range of potential confounding variables were selected for consideration, primarily based on their established associations with cognitive function. These variables included age, gender, race, education level, marital status, poverty-income ratio (PIR) group, BMI group, diabetes, smoking, drinking, physical activity, and stroke. Research indicates that age is negatively correlated with cognitive function, with older adults at a higher risk for cognitive decline. The impact of gender and race on cognitive abilities may be differential, while education is a crucial determinant of cognitive development. Marital status, PIR, and BMI have also been demonstrated to influence cognitive health. Diabetes, smoking, and drinking are recognised as biological and behavioural factors that affect cognitive function, whereas physical activity is protective and can enhance cognitive performance. Furthermore, the impact of stroke history on cognitive abilities is significant, thus necessitating its inclusion in the analysis. The selection of these covariates aims to control for potential confounding variables, thereby allowing a more precise assessment of the primary factors influencing cognitive function.
eGDR.The formula9 used to estimate the Glucose Disposal Rate (eGDR) is given by: eGDR (mg/kg/min) = 21.158 − (0.09 × WC) − (3.407 × HT) − (0.551 ×HbA1c). In this equation, WC represents waist circumference in centimeters (cm), HT indicates the presence of hypertension (with yes = 1 and no = 0), and HbA1c is expressed as a percentage (%).The eGDR formula incorporates waist circumference, hypertension, and HbA1c due to their strong association with insulin sensitivity, as validated by the euglycemic hyperinsulinemic clamp technique. The superior predictive value of waist circumference for cardiovascular mortality and insulin sensitivity, in comparison to waist-to-hip ratio (WHR), is well-documented. Hypertension and HbA1c are recognised as key indicators of metabolic and vascular health, facilitating clinical outcome prediction.
Cognitive function.In this study, we employed various standardized cognitive tests to assess the cognitive function of participants. These tests included the CERAD Word Learning subtest (CERAD W-L), the Digit Symbol Substitution Test (DSST), and the Animal Fluency Test (AFT). The selection of these tests is based on their widespread application in large-scale cognitive impairment screening and epidemiological studies. In the context of the CERAD W-L test, participants were presented with a list of ten words for learning during a designated learning trial. Following a delay of approximately five minutes, participants were requested to recall the words both immediately and after a longer delay of 20 min. This methodological approach permits the evaluation of different aspects of memory performance, specifically encoding and retrieval17. The Digit Symbol Substitution Test (DSST), derived from the Wechsler Adult Intelligence Scale (WAIS III), evaluates cognitive function by examining processing speed, focused attention, and working memory capacity18,19. In this test, participants are provided with a key that pairs specific digits with symbols. The subject is then required to fill in the blanks with the corresponding symbols for as many digits as possible within a time span of 120 s. This test is of crucial importance in the assessment of cognitive processing speed and accuracy.The AFT further enhances the understanding of executive function by measuring verbal fluency20. In the AFT, participants were instructed to name as many animals as possible within a time limit of one minute. This task provides insight into verbal fluency and the ability to access and produce verbal information quickly.Through these comprehensive tests, we are able to assess participants’ cognitive functions thoroughly and provide reliable data support for subsequent research. The choice of these tests is not only based on their broad application in relevant fields but also considers their applicability and effectiveness in evaluating specific populations. Recognizing the critical importance of cognitive test data as the dependent variable in our study, we excluded participants lacking cognitive data from the database to avoid potential biases introduced by incomplete data.Lower scores on all three tests indicate poorer cognitive ability. Cognitive function was categorized into two groups: participants who scored below the 25th percentile on any cognitive test were defined as the cognitive function decline (CFD) group, while the remaining participants were classified as the normal group. The cutoff points for the three cognitive tests were set at 21 points, 34 points, and 13 points, respectively. The present assessment method was adopted on the basis of established research practices, in which the 25th percentile threshold has demonstrated reliable discrimination in cognitive assessment. The cutoff values were specifically calibrated for the demographic characteristics of the study population, and this approach has been validated for detecting early cognitive decline in previous studies21,22.
Statistical analysis.In order to generate nationally representative estimates, the SDMVPSU and SDMVSTRA procedures were employed in order to account for NHANES’s complex survey design, with the R survey package being used for analysis. For the combined datasets from the two cycles (2011–2012 and 2013–2014), each cycle’s WTMEC2YR weight was halved to derive the final weight applied to all data. This methodological approach was adopted to ensure the accurate representation and analysis of the sampled population over the specified years. The results are shown as weighted averages (95% CI) for continuous data and as weighted percentages (95% confidence interval [CI]) for categorical data. The Wilcoxon rank-sum test was applied to analyze the former, while the latter was evaluated using the Chi-square test. The main statistical analysis method to assess the association between eGDR and cognitive performance was weighted logistic regression. In our actual operations, eGDR was represented in two forms: as categorical variables and as continuous variables. In order to validate the linearity assumption between eGDR and Age, we employed the logit (P) transformation of the outcome variable using the Box-Tidwell method for the weighted logistic regression model. Additionally, we assessed the presence of multicollinearity with the variance inflation factor (VIF) and tested for independence using the Durbin-Watson test from the `car` package. The analysis confirmed a linear relationship between eGDR and Age with the logit (P) transformation of the outcome variable, ruled out multicollinearity with VIF values below 5, and verified independence with a Durbin-Watson test p-value of 0.48. The model diagnostics for the statistical analysis are presented in Supplementary Table 1.During the analysis, we adjusted for potential confounding variables as follows: three models were constructed to more robustly capture the relationship. Model 1 was unadjusted; Model 2 was adjusted for age, gender, race, education level, marital status, household poverty-to-income ratio (PIR), and body mass index (BMI); Model 3 was further adjusted for diabetes, smoking status, alcohol consumption, physical activity, and history of stroke. For each model, odds ratios (ORs) and their corresponding 95% confidence intervals (CIs) were calculated. The lowest eGDR category was designated as the reference group. Among the covariates, age (continuous variable), sex, and race (categorical variables) had complete data, while others had missing values. All covariates with missing data were treated as categorical variables, with missing values categorized as a separate group in the model.This multivariable adjustment strategy was implemented to account for potential confounding factors that may influence cognitive outcomes, thereby ensuring a more accurate representation of the relationship under investigation. This approach aligns with methods widely used in previous studies23,24, maximizing sample size while avoiding potential selection bias that might arise from complete case analysis.
The results of the weighted logistic regression analysis indicate an independent association of the exposure variable with the outcome. However, treating eGDR as a categorical variable revealed inconsistent odds ratios (ORs) for the Q2 group versus Q1 when examining Q3 and Q4, suggesting potential nonlinearity. To further investigate nonlinearity, we conducted a restricted cubic spline analysis on the weighted data. We chose the restricted cubic spline model because it allows flexible modelling of complex non-linear relationships between continuous variables and outcomes, while avoiding the loss of information associated with dichotomisation or linear assumptions, thereby improving model fit and predictive performance25. Leveraging the “rms” package, we fitted restricted cubic splines with three knots, treating eGDR as a continuous variable. It is important to note that the ‘rms’ package is unable to directly apply the complex sampling results generated by the ‘svydesign’ function from the ‘survey’ package. Consequently, the weights must be converted into a format that the ‘rms’ package can process. The subsequent steps in the process are outlined below: Initially, the data was extracted from the ‘svydesign’ result using the code ‘data <- fit$survey.design$variables’. Subsequently, the weight variable was added to ‘weights’ and the weight variable to be used for calculation was generated, which was added to the ‘data’ using the code ‘ori.weight <- 1/(fit$survey.design$prob); mean.weight <- mean(ori.weight); data$weights <- ori.weight/mean.weight’. Subsequent to this transformation, the ‘data’ were loaded into the environment and the weighted model was constructed with restricted cubic splines.The Akaike Information Criterion (AIC) was utilised to identify three optimal knots, and the analysis was further evaluated using the analysis of variance (ANOVA) to ascertain the nonlinear relationship. The p-value for the nonlinear relationship was 0.0441, and the overall model p-value was less than 0.0001, indicating successful model construction. By examining the restricted cubic spline plot and identifying the corresponding eGDR value where the odds ratio (OR) was 1 in the fitted model, we determined the inflection point of eGDR.The smoothness of the model is illustrated in Fig. 2.
Fig. 2.

Restricted Cubic Spline Plot of eGDR and Cognitive Function. Note: Analysis adjusted for all covariates from model 3 in Table 3. The inflection point at 5.88 mg/kg/min represents a critical threshold in the relationship between insulin resistance and cognitive function. This threshold may reflect a potential physiological tipping point, below which the odds of normal cognitive function begin to decline significantly. The shaded areas represent 95% confidence intervals. Statistical significance is indicated with p-overall < 0.001 and p-non-linear < 0.05.
Finally, subgroup analyses were conducted, with a specific emphasis on gender, educational attainment and alcohol consumption. This approach was primarily driven by the recognition that biological attributes and behavioural patterns within these populations may exert a considerable influence on the analytical outcomes. To further examine the robustness of the results, we also performed sensitivity analyses. These analyses were conducted to verify the stability of the findings and assess the potential impact of different modeling assumptions or data exclusions on the overall conclusions.The statistical software we used was R language(version 4.4.1), Results were accepted as statistically difference at the p < 0.05 level.
Results
A total of 2,665 people were selected, representing about 49 million Americans, with a mean age of 69.07 years.Two groups of participants were interviewed, namely normal group and CFD group according to their cognitive score. In our research, women constituted 54.21% of the overall demographics, while non-Hispanic Whites made up 79.77%. Additionally, 84.34% of the population had completed postsecondary education. As shown in Table 2, participants in the CFD group were significantly older (72.00 vs. 67.76 years, P < 0.001), had a smaller proportion of females (48.11% vs. 56.93%, P = 0.003), and demonstrated reduced levels of education (> high school education: 67.70% vs. 91.74%, P < 0.001).They were also more likely to be economically disadvantaged (PIR < 1.13: 20.57% vs. 6.76%, P < 0.001), less likely to have partners (58.57% vs. 68.88%, P < 0.001), and more physically inactive (71.12% vs. 61.34%, P = 0.003). Furthermore, this group exhibited different drinking patterns (moderate drinking: 33.03% vs. 45.56%, P < 0.001) and demonstrated a higher prevalence of diabetes (32.37% vs. 24.49%, P = 0.009), hypertension (76.10% vs. 62.80%, P < 0.001), and stroke (9.51% vs. 4.45%, P = 0.001).The CFD group also showed higher HbA1c levels (6.05% vs. 5.89%, P = 0.007). Moreover, eGDR levels were significantly lower in this population (6.03 vs. 6.54 mg/kg/min, P = 0.001).
Table 2.
Characteristics of the included participants (stratified by cognitive function).
| Characteristic | Overall, N = 2665 | Normal, N = 1511 | CFD, N = 1154 | P Value |
|---|---|---|---|---|
| Age, years | 69.07 (68.69 ,69.45) | 67.76 (67.41 ,68.12) | 72.00 (71.21 ,72.78) | < 0.001 |
| Gender | 0.003 | |||
| Male,% | 45.79 (43.69 ,47.90) | 43.07 (40.01 ,46.18) | 51.89 (48.23 ,55.53) | |
| Female,% | 54.21 (52.10 ,56.31) | 56.93 (53.82 ,59.99) | 48.11 (44.47 ,51.77) | |
| Race | < 0.001 | |||
| Mexican American,% | 3.42 (2.19 ,5.30) | 2.46 (1.55 ,3.86) | 5.58 (3.51 ,8.75) | |
| Other Hispanic,% | 3.79 (2.59 ,5.52) | 2.13 (1.47 ,3.08) | 7.52 (4.89 ,11.39) | |
| Non-Hispanic White,% | 79.77 (75.77 ,83.26) | 85.36 (82.34 ,87.94) | 67.22 (59.42 ,74.16) | |
| Non-Hispanic Black,% | 7.95 (5.94 ,10.57) | 5.37 (3.89 ,7.37) | 13.75 (9.97 ,18.67) | |
| Other Race,% | 5.07 (3.85 ,6.64) | 4.68 (3.28 ,6.65) | 5.93 (4.41 ,7.93) | |
| Education | < 0.001 | |||
| < High school ,% | 5.50 (4.30 ,7.01) | 1.44 (0.76 ,2.68) | 14.63 (11.72 ,18.10) | |
| Completed High school,% | 10.14 (8.04 ,12.72) | 6.82 (5.25 ,8.81) | 17.61 (13.34 ,22.88) | |
| > High school ,% | 84.34 (81.03 ,87.16) | 91.74 (89.28 ,93.68) | 67.70 (61.93 ,72.98) | |
| Missing ,% | 0.02 (0.00 ,0.08) | 0.00 (0.00 ,0.00) | 0.06 (0.01 ,0.24) | |
| Martial_status | < 0.001 | |||
| Widowed/Divorced/Separated/Never married [n (%)] | 34.27 (32.34 ,36.26) | 31.11 (28.94 ,33.36) | 41.38 (36.81 ,46.11) | |
| Married/Living with partner,% | 65.70 (63.71 ,67.64) | 68.88 (66.62 ,71.05) | 58.57 (53.85 ,63.14) | |
| Missing ,% | 0.02 (0.01 ,0.11) | 0.02 (0.00 ,0.12) | 0.05 (0.01 ,0.36) | |
| PIR_group | < 0.001 | |||
| < 1.13,% | 11.01 (9.30 ,13.00) | 6.76 (5.43 ,8.38) | 20.57 (17.58 ,23.93) | |
| >=1.13,% | 82.71 (80.21 ,84.95) | 87.03 (84.19 ,89.41) | 73.01 (69.74 ,76.04) | |
| Missing ,% | 6.28 (4.76 ,8.24) | 6.22 (4.45 ,8.62) | 6.42 (4.77 ,8.59) | |
| BMI_group | 0.11 | |||
| Normal,% | 26.33 (23.73 ,29.10) | 25.36 (21.77 ,29.33) | 28.49 (25.56 ,31.62) | |
| Overweight ,% | 35.98 (33.60 ,38.43) | 35.88 (33.09 ,38.77) | 36.20 (31.71 ,40.93) | |
| Obesity ,% | 37.23 (34.57 ,39.98) | 38.52 (35.51 ,41.63) | 34.33 (29.39 ,39.64) | |
| Missing,% | 0.46 (0.24 ,0.88) | 0.23 (0.05 ,0.97) | 0.98 (0.50 ,1.92) | |
| Hypertension | < 0.001 | |||
| No,% | 33.10 (30.84 ,35.45) | 37.20 (34.08 ,40.43) | 23.90 (20.32 ,27.90) | |
| Yes,% | 66.90 (64.55 ,69.16) | 62.80 (59.57 ,65.92) | 76.10 (72.10 ,79.68) | |
| Diabetes | 0.009 | |||
| No,% | 71.04 (68.69 ,73.29) | 73.37 (70.16 ,76.36) | 65.82 (61.91 ,69.53) | |
| Yes,% | 26.92 (24.36 ,29.64) | 24.49 (21.12 ,28.20) | 32.37 (28.63 ,36.35) | |
| Missing,% | 2.04 (1.34 ,3.09) | 2.14 (1.31 ,3.48) | 1.80 (0.99 ,3.25) | |
| Smoking | 0.6 | |||
| No,% | 49.48 (46.47 ,52.49) | 49.96 (46.23 ,53.70) | 48.39 (44.87 ,51.93) | |
| Yes,% | 50.49 (47.47 ,53.51) | 50.01 (46.27 ,53.76) | 51.57 (48.03 ,55.11) | |
| Missing,% | 0.03 (0.01 ,0.11) | 0.02 (0.00 ,0.16) | 0.03 (0.00 ,0.27) | |
| Drinking | < 0.001 | |||
| Never,% | 12.43 (10.44 ,14.73) | 10.66 (8.69 ,13.01) | 16.40 (13.72 ,19.48) | |
| Moderate,% | 41.70 (38.20 ,45.29) | 45.56 (41.72 ,49.46) | 33.03 (27.94 ,38.56) | |
| Heavy,% | 27.97 (25.25 ,30.87) | 28.64 (25.31 ,32.22) | 26.47 (22.77 ,30.54) | |
| Missing,% | 17.90 (15.70 ,20.32) | 15.14 (12.85 ,17.75) | 24.09 (20.81 ,27.71) | |
| Physicial | 0.003 | |||
| Inacitve ,% | 64.36 (60.29 ,68.22) | 61.34 (56.25 ,66.19) | 71.12 (67.04 ,74.89) | |
| Less acitve,% | 10.70 (9.14 ,12.47) | 11.75 (10.04 ,13.70) | 8.34 (6.18 ,11.16) | |
| Active,% | 24.77 (21.33 ,28.56) | 26.84 (22.25 ,32.00) | 20.10 (16.39 ,24.42) | |
| Missing ,% | 0.18 (0.06 ,0.53) | 0.07 (0.02 ,0.29) | 0.43 (0.11 ,1.68) | |
| Stroke | 0.001 | |||
| No,% | 93.92 (92.99 ,94.74) | 95.52 (94.01 ,96.66) | 90.35 (87.67 ,92.49) | |
| Yes,% | 6.01 (5.20 ,6.95) | 4.45 (3.31 ,5.96) | 9.51 (7.38 ,12.18) | |
| Missing,% | 0.06 (0.04 ,0.10) | 0.03 (0.01 ,0.13) | 0.14 (0.12 ,0.16) | |
| Waist circumference, cm | 102.45 (101.39 ,103.50) | 102.55 (101.34 ,103.77) | 102.22 (100.85 ,103.58) | 0.7 |
| Ghb,% | 5.94 (5.89 ,5.99) | 5.89 (5.82 ,5.97) | 6.05 (5.97 ,6.14) | 0.007 |
| eGDR, mg/kg/min | 6.38 (6.25 ,6.52) | 6.54 (6.36 ,6.72) | 6.03 (5.85 ,6.22) | 0.001 |
Continuous variables are presented as survey-weighted mean (95% CI), categorical variables are presented as survey-weighted percentage (95% CI).
Wilcoxon rank-sum test for complex survey samples; chi-squared test with Rao & Scott’s second-order correction.
Table 3 indicates that eGDR levels are closely related to cognitive function after adjusting for several covariates when eGDR is analyzed as both continuous and categorical variables. The covariates taken into account are educational level, age, BMI category, gender, marital status, PIR group, race, presence of diabetes, smoking habits, alcohol consumption, physical activity, and instances of stroke, while excluding waist circumference, hypertension, and hemoglobin levels (P < 0.05).
Table 3.
Association between eGDR and cognitive function.
| eGDR (mg/kg/min) | Model 1 | Model 2 | Model 3 | |||
|---|---|---|---|---|---|---|
| OR (95% CI) | P-value | OR (95% CI) | P-value | OR (95% CI) | P-value | |
| Continuous | 0.92 (0.87– 0.96) | <0.001 | 0.91 (0.85– 0.97) | 0.008 | 0.91 (0.85– 0.98) | 0.011 |
| Q1 | Ref. | Ref. | Ref. | |||
| Q2 | 1.25 (0.85–1.83) | 0.2 | 1.16 (0.79–1.70) | 0.4 | 1.18 (0.80–1.73) | 0.4 |
| Q3 | 1.05 (0.74–1.47) | 0.8 | 0.86 (0.56–1.33) | 0.5 | 0.87 (0.58–1.31) | 0.5 |
| Q4 | 0.53 (0.38–0.76) | <0.001 | 0.58 (0.39–0.88) | 0.012 | 0.60 (0.39–0.91) | 0.019 |
| p for trend | < 0.001 | 0.006 | 0.009 | |||
Model 1, Unadjusted;.
Model 2, adjusted for Age, Gender; Race, Education, Martial_status, PIR_group and BMI_group;.
Model 3, adjusted for Age, Gender; Race, Education, Martial_status, PIR_group, BMI_group, Diabetes, smoking, drinking, physicial and stroke;.
The exclusion of these three variables was based on the consideration that they are constituent elements of the eGDR variable. We drew upon the research methods outlined in previous literature26 for this analysis. Using the weighted quartile of eGDR as the cut-off point, we divided eGDR into four groups: Q1 (eGDR < 4.7397 mg/kg/min), Q2 (4.7397 mg/kg/min ≤ eGDR < 6.0129 mg/kg/min), Q3 (6.0129 mg/kg/min ≤ eGDR < 8.2872 mg/kg/min), and Q4 (eGDR ≥ 8.2872 mg/kg/min). Interestingly, when eGDR is examined as subtyped data, the odds ratio (OR) obtained from model 3 comparing groups Q3 and Q4 with group Q1 is less than 1 (OR = 0.87, 95% CI: 0.58–1.31; OR = 0.60, 95% CI: 0.39–0.91, p for trend = 0.009, Table 3). In contrast, when group Q2 is compared with group Q1, the OR value is greater than 1 (OR = 1.18, 95% CI: 0.80–1.73, p for trend = 0.009, Table 3).
To asses the relationship between the two more thoroughly, we employed a restricted cubic spline analysis.The analysis indicated a non-linear relationship between the two variables, with an inflection point identified at an eGDR value of 5.88 mg/kg/min (Fig. 2). By examining the restricted cubic spline plot and identifying the corresponding eGDR value where the odds ratio (OR) was 1 in the fitted model, we determined this inflection point. Below the 5.88 mg/kg/min threshold, a clear positive correlation was observed between eGDR and cognitive function, whereas above this point, a negative correlation emerged (P-for-non-linear < 0.05, P-overall < 0.001).This suggests that lower eGDR levels, indicating greater insulin resistance, are associated with poorer cognitive performance until a certain threshold, beyond which the relationship reverses. The identification of this inflection point provides insights into the potential critical value of eGDR in relation to cognitive outcomes, highlighting the importance of considering non-linear associations when evaluating the impact of metabolic health on cognition.
The outcomes of the subgroup analyses are illustrated in Figs. 3 and 4, and Fig. 5. After analyzing with the inclusion of other covariates aside from the stratification variables, the findings revealed statistically significant differences in the association between eGDR and cognitive ability among specific subgroups, including women (P = 0.042, Fig. 3), individuals with higher education (P = 0.046, Fig. 4), moderate drinkers (P = 0.039, Fig. 4), and those without a history of stroke (P = 0.019, Fig. 5).However, the interaction tests showed that the P-values for the interaction terms were all greater than 0.05, indicating no significant effect modification by these subgroups. These findings suggest that the relationship between metabolic health, as measured by eGDR, and cognitive function may be influenced by certain demographic and lifestyle factors, though the interactions were not statistically significant.The results highlight the importance of considering these subgroup characteristics when evaluating the impact of metabolic dysfunction on cognitive outcomes.
Fig. 3.

Gender and Age subgroup.
Fig. 4.

Education and Drinking subgroup.
Fig. 5.
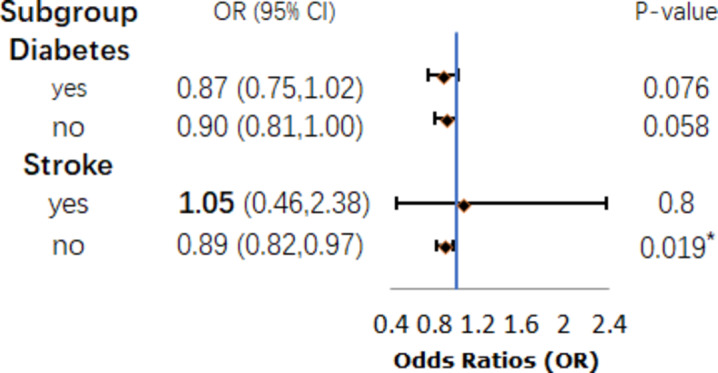
Diabetes and Stroke subgroup.
In order to provide a comprehensive assessment of the robustness of our findings, we conducted sensitivity analyses. These analyses incorporated waist circumference and HbA1c into Model 4, despite the fact that they are components of eGDR. The depression grouping was based on Model 3 (see Supplementary Table 2).The sensitivity analysis did not include hypertension due to significant collinearity with estimated glucose disposal rate (eGDR), as indicated by a variance inflation factor (VIF) greater than 10. Consequently, the hypertension variable was excluded to maintain objectivity. Furthermore, extant literature27 signifies a correlation between depression and cognitive function; thus, we included the depression grouping as a covariate in Model 4. This grouping was based on the Patient Health Questionnaire-9 (PHQ-9) responses from participants. The PHQ-9 questionnaire comprises nine questions designed to assess symptoms of depression experienced over the previous fortnight, with total scores ranging from 0 to 27. Participants were categorised into three groups: those with no depression symptoms (total score 0–4, n = 2001), those with depression symptoms (total score > 4, n = 631), and those with uncertain symptoms (n = 33). According to Supplementary Table 2, the model remains robust after including these three variables.
Additionally, we modified the definition of the dependent variable, cognitive test scores. We first excluded 2 participants who lacked educational data, then calculated education-dependent Z-scores for each test, and averaged the Z-scores from the three tests to obtain a composite Z-score, with those below the lowest quartile classified as the Cognitive Function Decline (CFD) group (n = 666), while the remainder were categorized as the normal group (n = 1997). We then included all previously mentioned covariates, excluding educational attainment, and constructed a weighted logistic regression model (Model 5). The results, shown in Supplementary Table 3, remained robust.
Discussion
To date, no research has specifically examined the relationship of eGDR and cognitive ability in the older adults. We discovered a non-linear relationship between these two variables. The non-linear relationship observed at the 5.88 mg/kg/min inflection point may indicate a critical threshold in the physiological effects of insulin resistance on cognition. Prior studies suggest that cognitive decline accelerates beyond specific levels of insulin resistance due to impaired glucose metabolism in the brain28. This finding corroborates earlier research while concomitantly offering novel insights into the non-linear dynamics of the aforementioned association. The identification of individuals on the verge of this threshold could facilitate the implementation of early interventions, such as lifestyle modifications or pharmacological treatments, to mitigate cognitive decline. Routine screening for insulin resistance, particularly in populations at risk of cognitive impairment, may inform public health strategies to reduce dementia-related burdens. Further investigation is necessary to confirm the underlying mechanisms and long-term implications of these findings.The conclusions of our article align with those of Baojian Wei et al.29, who linked the high triglyceride-glucose index, another biomarker of insulin resistance, to cognitive function decline in non-diabetic elderly individuals. However, their research was limited to a specific population without diabetes, which may restrict its generalizability. Additionally, their assessment of cognitive function focused solely on memory, which may not be sufficiently comprehensive. Our research serves as a significant extension of this related study. Similar studies include the work of Na Tian et al.30, who also used the TyG index and came to similar conclusions. Both studies use population-based designs and surrogate markers of insulin resistance (eGDR in our study and TyG index in their article), while using advanced statistical methods to identify non-linear relationships. However, there are important differences: their article focuses on a rural Chinese population with limited education, whereas our study examines a more diverse US population with a higher proportion of individuals with post-secondary education. In addition, their article includes brain structural changes as outcomes, whereas our study focuses solely on cognitive function. Despite these differences, both studies highlight the critical role of insulin resistance in cognitive health and provide complementary insights into the metabolic-cognitive relationship in different populations. Moreover, prospective studies and meta-analyses have indicated that a high baseline TyG index is associated with an elevated risk of Alzheimer’s disease31 and the TyG index may be a useful tool for early risk assessment in cognitive impairment32. This hypothesis is supported by findings from animal studies33, which have demonstrated a correlation between insulin sensitivity index (another measure of the degree of insulin resistance) and cognitive impairment. These findings collectively corroborate the results of our study.
The possible mechanisms by which insulin resistance (IR) leads to cognitive decline include several key factors. Firstly, hyperglycemia, a potential consequence of insulin resistance, may negatively impact brain function through mechanisms that possibly involve glucose neurotoxicity and vascular damage34. Glucose neurotoxicity refers to the harmful effects that elevated glucose levels can exert on neurons, leading to oxidative stress and neuronal apoptosis35–37. This neurotoxic effect can impair synaptic function and plasticity, both essential for cognitive processes36,37. Moreover, vascular damage caused by hyperglycemia disrupts cerebral blood flow, further contributing to cognitive impairments36–38. Secondly, insulin resistance has been associated with alterations in brain structure, particularly the reduction of gray matter volume in critical brain regions such as the hippocampus and prefrontal cortex39–43. This atrophy can detrimentally impact memory and executive functions, which are vital components of cognitive performance40,41,44. Neuroimaging studies have shown that reduced insulin sensitivity correlates with decreases in gray matter density, reinforcing the link between metabolic dysfunction and brain health39,41,45. Thirdly, abnormal insulin regulation may result in chronic inflammation, which is a recognised contributor to cognitive decline. The presence of inflammation in the brain can result in the activation of microglial cells and the subsequent release of pro-inflammatory cytokines. This, in turn, can lead to the deprivation of synapses and, ultimately, the accumulation of amyloid-beta (Aβ) and tau proteins46,47. These pathological hallmarks of neurodegeneration have been extensively investigated with regard to their involvement in conditions such as Alzheimer’s disease. This suggests that the interplay between insulin resistance and neuroinflammation may represent a crucial pathway through which metabolic dysfunction is linked to cognitive impairment5,48–51. Finally, it has been proposed that insulin resistance in peripheral tissues may reflect the brain’s response to insulin31. It has been demonstrated that impaired insulin signalling in the brain can result in a disruption of glucose metabolism, which in turn affects cognitive performance. This relationship can be corroborated through functional imaging, which provides insights into the brain’s metabolic responses to insulin5,52. Our study supports the notion that eGDR, a robust marker of insulin resistance, is significantly related to cognitive performance in the elderly. The non-linear relationship between them suggests that lower eGDR levels are significantly associated with cognitive impairment, as indicated by the odds ratio approaching 1. This finding highlights the critical role of adequate glucose supply in neuronal energy metabolism. Insufficient glucose availability may impair synaptic function and neuroplasticity, ultimately leading to cognitive decline. The eGDR cut-off of 5.88 mg/kg/min indicates that cognitive function may decline more severely below this threshold, reflecting conditions such as insulin resistance or impaired glucose tolerance, both of which are detrimental to brain health. Insulin resistance is associated with neuroinflammation, oxidative stress and impaired neurotransmitter signalling, which further contribute to cognitive deficits. Therefore, interventions aimed at improving glucose metabolism may be critical for preserving cognitive function in older adults.
Subgroup analysis indicated that the correlation between the two variables remains significant in specific populations, such as women, college-educated individuals, moderate drinkers, and those without a stroke history. Gender differences may stem from variations in insulin sensitivity and adipose tissue distribution53, as well as hormonal influences like estrogen’s protective role in women pre-menopause. Post-menopause, reduced estrogen levels may diminish this protection, contributing to gender-specific outcomes54. Additionally, structural and functional brain differences, including hippocampal volume, may interact with metabolic factors in women55. The heightened health awareness associated with higher education may explain the significant findings in educated individuals56–58. This demographic tends to maintain structured lifestyles and engage in healthy long-term behavior patterns, such as regular check-ups and proactive metabolic management59. Furthermore, they have better access to health information that supports cognitive health. Research suggests that light alcohol consumption can reduce the risk of diabetes, stroke, and other diseases in individuals over 40 years old, partially clarifying findings among moderate drinkers60. Moderate alcohol consumption is associated with cardiovascular benefits, which may lower cognitive decline risk61. However, it is crucial to differentiate these benefits from the negative impacts of excessive drinking. Given that insulin resistance contributes to over half of stroke cases and is on the rise62, it is reasonable to expect that individuals without a stroke history have a lower risk of insulin resistance. The stratified analysis results support the need for tailored health management strategies for these specific groups. In conclusion, these findings underscore the importance of incorporating demographic and lifestyle factors into targeted cognitive health interventions. Future research should investigate the mechanisms behind these differences for optimized preventive strategies. For instance, health education programs targeted at women could emphasize nutrition, exercise, and hormone management, while interventions for moderate drinkers should focus on increasing awareness of health impacts and providing opportunities for regular health check-ups. In practice, the eGDR criteria can guide clinicians in intervention strategies for diabetes management and neurocognitive assessment. For example, in high-risk patient groups, clinicians can use eGDR to assess their insulin resistance status and thus formulate personalised lifestyle interventions, such as dietary modifications and exercise plans, to reduce the risk of cognitive decline. In addition, the results of this study may support the development of strategies targeted at women and moderate drinkers, encouraging early screening and tailored education to improve metabolic health and cognitive function in these populations.
Our research has both strengths and limitations. The NHANES database offers a substantial amount of data and employs a weighted methodology, ensuring that it accurately represents national data and often provides a theoretical basis for formulating public health policies. Our study leverages this database, thereby improving the reliableness and representativeness of our results. What is more, despite our efforts to adjust for numerous covariates, our conclusions remain relatively convincing. However, our study also has limitations. First, our study’s cross-sectional design limits our ability to establish causal associations between the variables examined. This inherent limitation underscores the need for caution in interpreting the results. To enhance the validity of these findings, we recommend that future research adopt longitudinal study designs to better elucidate the potential causal relationships among these variables. Second, in our analysis of the NHANES database, we recognise the potential for bias associated with self-reported variables, such as alcohol consumption, which are susceptible to social desirability and recall bias. Moreover, despite the implementation of a multitude of confounding factor controls, it is not feasible to account for the full range of potential confounders, thereby introducing the possibility of residual confounding that may impact the observed associations between eGDR and cognitive function. Several methodological limitations of our sensitivity analyses should be acknowledged. First, the inclusion of waist circumference and HbA1c as model covariates, although necessary for comprehensive adjustment, may introduce mild collinearity due to their inherent relationship with eGDR (VIF < 10). Second, the exclusion of hypertension due to its high collinearity with eGDR potentially limits our assessment of the independent effects of blood pressure on cognitive outcomes. Third, the relatively small sample size in the uncertain depression symptoms group (n = 33) and the exclusion of participants with missing education data (n = 2) may affect the stability of subgroup estimates. Nevertheless, the consistency of our findings across different analytical approaches supports the robustness of our main conclusions.Finally, despite the fact that the NHANES dataset encompasses a range of cognitive assessments, it does not employ a gold standard cognitive assessment tool, such as the Mini-Mental State Examination (MMSE) or the Montreal Cognitive Assessment (MoCA).
Additionally, while the NHANES dataset is diverse, certain demographic characteristics may limit the generalizability of our findings. Our study primarily focuses on older adults in the United States, which may not apply to younger populations or those outside the U.S. Future research should include different regions and populations to enhance generalizability. Moreover, the subgroup analyses are exploratory and provide preliminary insights into specific groups, but these findings should not be overgeneralized. We recommend validating these results in larger, more diverse samples.
It would be beneficial for future research to investigate the mechanisms through which eGDR is associated with cognitive outcomes. This should include an examination of potential mediating factors, such as inflammation, vascular health and metabolic control. It is imperative that large-scale longitudinal studies be conducted in order to establish causality and gain insight into the temporal relationships between eGDR levels and cognitive decline. Furthermore, randomised controlled trials evaluating interventions designed to enhance eGDR and their impact on cognitive function could provide valuable insights for clinical applications.
Conclusions
In circumstances where the estimated glucose disposal rate (eGDR) surpasses 5.88 mg/kg/min, there is a tendency for cognitive function scores to rise in proportion to increasing eGDR levels. This critical threshold of 5.88 mg/kg/min aligns with values reported in previous literature26, suggesting that it may serve as a meaningful marker in this context. Nevertheless, further exploration is required to ascertain its clinical relevance, particularly with regard to identifying specific risk thresholds and their application in diverse populations. As an economical, effective, and non-invasive marker, eGDR shows significant potential for early screening of cognitive decline, especially in developing countries and economically disadvantaged areas where accessibility to advanced diagnostic methods is limited. Furthermore, the tailoring of management strategies for specific subgroups, such as women, could offer a pragmatic approach to the delay of cognitive decline. Nevertheless, additional prospective and longitudinal studies are warranted to confirm the generalizability, causal relationships, and long-term utility of eGDR in this field.
Electronic supplementary material
Below is the link to the electronic supplementary material.
Acknowledgements
The authors thank all of the survey teams and all of the study participants in the NHANES for their contributions and dedication to this study.
Author contributions
L.Ldesigned the research, conducted research, analyzed data, and wrote the paper; C. L: assisted in data analysis; J.Z: assisted in manuscript preparation; and all authors: read and approved the final manuscript. None of the authors has any confficts of interest to declare.
Funding
This study was part of S&T Program of Chengde (202204A038). Institutional Review Board Statement: The Ethics Review Board (ERB) approved the data collection protocol. The ethical approval code for NHANES data collection from 2011 to 2012 was Protocol #2011-17 and 2013–2014 was Continuation of Protocol #2011-17.You can find more information from website:https://www.cdc.gov/nchs/nhanes/irba98.htm.
Data availability
The NHANES data are publicly available and can be accessed without restriction at the following link: https://wwwn.cdc.gov/nchs/nhanes/default.aspx.
Declarations
Competing interests
The authors declare no competing interests.
Informed consent
Informed consent was obtained from all subjects involved in the study.
Footnotes
Publisher’s note
Springer Nature remains neutral with regard to jurisdictional claims in published maps and institutional affiliations.
References
- 1.Anderson, L. A. & Egge, R. Expanding efforts to address Alzheimer’s disease: the healthy Brain Initiative. Alzheimers Dement.10, S453–456 (2014). [DOI] [PMC free article] [PubMed] [Google Scholar]
- 2.Montine, T. J., Bukhari, S. A. & White, L. R. Cognitive impairment in older adults and therapeutic strategies. Pharmacol. Rev.73, 152–162 (2021). [DOI] [PMC free article] [PubMed] [Google Scholar]
- 3.AAIC. Alzheimer’s disease facts and figures. Alzheimers Dement. 20, 3708–3821 (2024). [DOI] [PMC free article] [PubMed]
- 4.Jia, J. et al. The cost of Alzheimer’s disease in China and re-estimation of costs worldwide. Alzheimers Dement.14, 483–491 (2018). [DOI] [PubMed] [Google Scholar]
- 5.Kellar, D. & Craft, S. Brain insulin resistance in Alzheimer’s disease and related disorders: mechanisms and therapeutic approaches. Lancet Neurol.19, 758–766 (2020). [DOI] [PMC free article] [PubMed] [Google Scholar]
- 6.Tian, Y. et al. PCOS-GWAS susceptibility variants in THADA, INSR, TOX3, and DENND1A are Associated with metabolic syndrome or insulin resistance in Women with PCOS. Front. Endocrinol. (Lausanne). 11, 274 (2020). [DOI] [PMC free article] [PubMed] [Google Scholar]
- 7.Cui, Y., Tang, T. Y., Lu, C. Q. & Ju, S. Insulin resistance and cognitive impairment: evidence from neuroimaging. J. Magn. Reson. Imaging. 56, 1621–1649 (2022). [DOI] [PubMed] [Google Scholar]
- 8.Jing, L., Soha, N., Danny, P. & Niema, M. P. Abstract 16533: non-invasive insulin resistance evaluation using carotid pressure waveforms in Framingham Heart Study. Circulation. 148 (Suppl_1), 0–0 (2023).
- 9.Nyström, T., Holzmann, M. J., Eliasson, B., Svensson, A. M. & Sartipy, U. Estimated glucose disposal rate predicts mortality in adults with type 1 diabetes. Diabetes Obes. Metab.20, 556–563 (2018). [DOI] [PubMed] [Google Scholar]
- 10.Zabala, A. et al. Estimated glucose disposal rate and risk of stroke and mortality in type 2 diabetes: a nationwide cohort study. Cardiovasc. Diabetol.20, 202 (2021). [DOI] [PMC free article] [PubMed] [Google Scholar]
- 11.Penno, G. et al. Insulin resistance, diabetic kidney disease, and all-cause mortality in individuals with type 2 diabetes: a prospective cohort study. BMC Med.19(1):66 (2021). [DOI] [PMC free article] [PubMed]
- 12.Olson, J. C. et al. Subclinical atherosclerosis and estimated glucose disposal rate as predictors of mortality in type 1 diabetes. Ann. Epidemiol.12, 331–337 (2002). [DOI] [PubMed] [Google Scholar]
- 13.Garofolo, M. et al. Insulin resistance and risk of major vascular events and all-cause mortality in type 1 diabetes: a 10-Year follow-up study. Diabetes Care. 43, e139–e141 (2020). [DOI] [PMC free article] [PubMed] [Google Scholar]
- 14.Bull, F. C. et al. World Health Organization 2020 guidelines on physical activity and sedentary behaviour. Br. J. Sports Med.54, 1451–1462 (2020). [DOI] [PMC free article] [PubMed] [Google Scholar]
- 15.Obesity: preventing and managing the global epidemic. Report of a WHO consultation. World Health Organ Tech Rep Ser 894, i-xii, 1. (2000). [PubMed]
- 16.Xie, Z. Q. et al. Association of Serum Vitamin C with NAFLD and MAFLD among adults in the United States. Front. Nutr.8, 795391 (2021). [DOI] [PMC free article] [PubMed] [Google Scholar]
- 17.Morris, J. C. et al. The Consortium to establish a Registry for Alzheimer’s Disease (CERAD). Part I. Clinical and neuropsychological assessment of Alzheimer’s disease. Neurology39, 1159–1165 (1989). [DOI] [PubMed]
- 18.Rosano, C., Newman, A. B., Katz, R., Hirsch, C. H. & Kuller, L. H. Association between lower digit symbol substitution test score and slower gait and greater risk of mortality and of developing incident disability in well-functioning older adults. J. Am. Geriatr. Soc.56, 1618–1625 (2008). [DOI] [PMC free article] [PubMed]
- 19.Bienias, J. L., Beckett, L. A., Bennett, D. A., Wilson, R. S. & Evans, D. A. Design of the Chicago Health and Aging Project (CHAP). J. Alzheimers Dis.5, 349–355 (2003). [DOI] [PubMed]
- 20.Troyer, A. K., Moscovitch, M. & Winocur, G. Clustering and switching as two components of verbal fluency: evidence from younger and older healthy adults. Neuropsychology11, 138–146 (1997). [DOI] [PubMed]
- 21.Chen, S. P., Bhattacharya, J. & Pershing, S. Association of Vision Loss with Cognition in older adults. JAMA Ophthalmol.135, 963–970 (2017). [DOI] [PMC free article] [PubMed] [Google Scholar]
- 22.Sun, M. et al. The Association among Inflammatory Diet, Glycohemoglobin, and cognitive function impairment in the Elderly: based on the NHANES 2011–2014. J. Alzheimers Dis.87, 1713–1723 (2022). [DOI] [PubMed] [Google Scholar]
- 23.Middleton, M., Nguyen, C., Moreno-Betancur, M., Carlin, J. B. & Lee, K. J. Evaluation of multiple imputation approaches for handling missing covariate information in a case-cohort study with a binary outcome. BMC Med. Res. Methodol.22, 87 (2022). [DOI] [PMC free article] [PubMed] [Google Scholar]
- 24.Choi, J., Dekkers, O. M. & le Cessie A comparison of different methods to handle missing data in the context of propensity score analysis. Eur. J. Epidemiol.34, 23–36 (2019). [DOI] [PMC free article] [PubMed] [Google Scholar]
- 25.Gauthier, J., Wu, Q. V. & Gooley, T. A. Cubic splines to model relationships between continuous variables and outcomes: a guide for clinicians. Bone Marrow Transpl.55, 675–680 (2020). [DOI] [PubMed] [Google Scholar]
- 26.Lu, Z. et al. Insulin resistance estimated by estimated glucose disposal rate predicts outcomes in acute ischemic stroke patients. Cardiovasc. Diabetol.22, 225 (2023). [DOI] [PMC free article] [PubMed] [Google Scholar]
- 27.Rock, P. L., Roiser, J. P., Riedel, W. J. & Blackwell, A. D. Cognitive impairment in depression: a systematic review and meta-analysis. Psychol. Med.44, 2029–2040 (2014). [DOI] [PubMed] [Google Scholar]
- 28.Talbot, K. et al. Demonstrated brain insulin resistance in Alzheimer’s disease patients is associated with IGF-1 resistance, IRS-1 dysregulation, and cognitive decline. J. Clin. Invest.122, 1316–1338 (2012). [DOI] [PMC free article] [PubMed] [Google Scholar]
- 29.Baojian, W., Qiaoxiang, D., Jinlong, M. & Aihua, Z. The association between triglyceride-glucose index and cognitive function in nondiabetic elderly: NHANES 2011–2014. Lipids Health Dis.22(1), 188 (2023). [DOI] [PMC free article] [PubMed]
- 30.Ma, Y. et al. Association between the triglyceride-glucose index and cognitive impairment in China: a community population-based cross-sectional study. Nutr. Neurosci.27, 342–352 (2024). [DOI] [PubMed] [Google Scholar]
- 31.Sun, J. et al. Association of the triglyceride-glucose index with risk of Alzheimer’s Disease: a prospective cohort study. Am. J. Prev. Med.65, 1042–1049 (2023). [DOI] [PubMed] [Google Scholar]
- 32.Wang, H., Ling, Q., Wu, Y. & Zhang, M. Association between the triglyceride glucose index and cognitive impairment and dementia: a meta-analysis. Front. Aging Neurosci.15, 1278730 (2023). [DOI] [PMC free article] [PubMed] [Google Scholar]
- 33.Chen, S. et al. Relationship between insulin sensitivity index and cognitive function in diet-induced insulin resistant rats. Pharmazie64, 410–414 (2009). [PubMed] [Google Scholar]
- 34.Hamed, S. A. Brain injury with diabetes mellitus: evidence, mechanisms and treatment implications. Expert Rev. Clin. Pharmacol.10, 409–428 (2017). [DOI] [PubMed] [Google Scholar]
- 35.Shemesh, D., Bokobza, N., Rozenberg, K., Rosenzweig, T. & Abookasis, D. Decreased cerebral blood flow and hemodynamic parameters during acute hyperglycemia in mice model observed by dual-wavelength speckle imaging. J. Biophotonics. 12, e201900002 (2019). [DOI] [PubMed] [Google Scholar]
- 36.Xiaosong, H. et al. Hyperactivation of working memory-related brain circuits in newly diagnosed middle-aged type 2 diabetics. Acta Diabetol.52, 133–142 (2015). [DOI] [PMC free article] [PubMed]
- 37.Zaib Ali, S. et al. Natural fatty Acid guards against Brain endothelial cell death and Microvascular Pathology following ischemic insult in the Presence of Acute Hyperglycemia. Biomedicines.11(12), 3342 (2023). [DOI] [PMC free article] [PubMed]
- 38.David, S., Naor, B., Konstantin, R., Tovit, R. & David, A. Decreased cerebral blood flow and hemodynamic parameters during acute hyperglycemia in mice model observed by dual-wavelength speckle imaging. J. Biophotonics.12(8), e201900002 (2019). [DOI] [PubMed]
- 39.Margherita, C. et al. Metabolic syndrome, brain magnetic resonance imaging, and Cognition. Diabetes Care.33(12), 2489–2495 (2010). [DOI] [PMC free article] [PubMed]
- 40.Christian, B. et al. Impaired insulin sensitivity as indexed by the HOMA score is Associated with deficits in verbal fluency and temporal lobe Gray Matter volume in the Elderly. Diabetes Care.35(3), 488–494 (2012). [DOI] [PMC free article] [PubMed]
- 41.Stephanie, K. et al. Brain insulin resistance at the crossroads of metabolic and cognitive disorders in humans. Physiol. Rev.96(4), 1169–209 (2016). [DOI] [PubMed]
- 42.Auriel, A. W. et al. Insulin resistance, brain atrophy, and cognitive performance in late middle–aged adults. Diabetes Care.36(2), 443–449 (2013). [DOI] [PMC free article] [PubMed]
- 43.Jiyeon, L. et al. Moderating effect of insulin resistance on the relationship between Gray Matter volumes and cognitive function. J. Clin. Med.7(11), 413 (2018). [DOI] [PMC free article] [PubMed]
- 44.Zaldy, S. T. et al. Association of Metabolic Dysregulation with Volumetric Brain Magnetic Resonance Imaging and cognitive markers of subclinical brain aging in Middle-aged adults. Diabetes Care.34(8), 1766–1770 (2011). [DOI] [PMC free article] [PubMed]
- 45.Shan, Z. et al. Cognitive dysfunction in diabetes: abnormal glucose metabolic regulation in the brain. Front. Endocrinol.14, 1192602 (2023). [DOI] [PMC free article] [PubMed]
- 46.Pratchayasakul, W. et al. Obesity accelerates cognitive decline by aggravating mitochondrial dysfunction, insulin resistance and synaptic dysfunction under estrogen-deprived conditions. Horm. Behav.72, 68–77 (2015). [DOI] [PubMed] [Google Scholar]
- 47.Marta, B., Juan Ramón, P. & Jesús, Á. Alzheimer’s disease as an inflammatory disease. Biomolecular Concepts.8(1), 37–43 (2017). [DOI] [PubMed]
- 48.Clifford, R. J. et al. Hypothetical model of dynamic biomarkers of the Alzheimer’s pathological cascade. Lancet Neurol.9(1), 119–128 (2010). [DOI] [PMC free article] [PubMed]
- 49.Alexandre, B. et al. Tau pathology and neurodegeneration contribute to cognitive impairment in Alzheimer’s disease. Brain.140(12), 3286–3300 (2017). [DOI] [PMC free article] [PubMed]
- 50.Ryszard, P., Marzena, U. K., Sławomir, J. & Stanisław, J. C. Participation of amyloid and tau protein in neuronal death and neurodegeneration after Brain Ischemia. Int. J. Mol. Sci.21(13), 4599–4599 (2020). [DOI] [PMC free article] [PubMed]
- 51.Tara, L. S. J. & Bradley, T. H. The intersection of amyloid Beta and tau at synapses in Alzheimer’s Disease. Neuron.82(4), 756–771 (2014). [DOI] [PMC free article] [PubMed]
- 52.de la Monte, S. M. & Tong, M. Brain metabolic dysfunction at the core of Alzheimer’s disease. Biochem. Pharmacol.88, 548–559 (2014). [DOI] [PMC free article] [PubMed] [Google Scholar]
- 53.Ciarambino, T., Crispino, P., Guarisco, G. & Giordano, M. Gender differences in Insulin Resistance: New Knowledge and perspectives. Curr. Issues Mol. Biol.45, 7845–7861 (2023). [DOI] [PMC free article] [PubMed] [Google Scholar]
- 54.Simpkins, J. W., Singh, M., Brock, C. & Etgen, A. M. Neuroprotection and estrogen receptors. Neuroendocrinology96, 119–130 (2012). [DOI] [PMC free article] [PubMed] [Google Scholar]
- 55.Frangou, S. et al. Hippocampal volume reduction is associated with direct measure of insulin resistance in adults. Neurosci. Res.174, 19–24 (2022). [DOI] [PMC free article] [PubMed] [Google Scholar]
- 56.Lawrence, E. M. Why do College graduates Behave more healthfully than those who are less educated? J. Health Soc. Behav.58, 291–306 (2017). [DOI] [PMC free article] [PubMed] [Google Scholar]
- 57.Li, J. & Powdthavee, N. Does more education lead to better health habits? Evidence from the school reforms in Australia. Soc. Sci. Med.127, 83–91 (2015). [DOI] [PubMed] [Google Scholar]
- 58.Raghupathi, V. & Raghupathi, W. The influence of education on health: an empirical assessment of OECD countries for the period 1995–2015. Arch. Public. Health. 78, 20 (2020). [DOI] [PMC free article] [PubMed] [Google Scholar]
- 59.Koivusilta, L. K., Acacio-Claro, P. J., Mattila, V. M. & Rimpelä, A. H. Health and health behaviours in adolescence as predictors of education and socioeconomic status in adulthood - a longitudinal study. BMC Public. Health. 24, 1178 (2024). [DOI] [PMC free article] [PubMed] [Google Scholar]
- 60.Collaborators, G. A. Population-level risks of alcohol consumption by amount, geography, age, sex, and year: a systematic analysis for the global burden of Disease Study 2020. Lancet400, 185–235 (2022). [DOI] [PMC free article] [PubMed] [Google Scholar]
- 61.Zhang, R. et al. Association of Low to Moderate Alcohol drinking with cognitive functions from middle to older Age among US adults. JAMA Netw. Open.3, e207922 (2020). [DOI] [PMC free article] [PubMed] [Google Scholar]
- 62.Saini, V., Guada, L. & Yavagal, D. R. Global Epidemiology of Stroke and Access to acute ischemic stroke interventions. Neurology97, S6–S16 (2021). [DOI] [PubMed] [Google Scholar]
Associated Data
This section collects any data citations, data availability statements, or supplementary materials included in this article.
Supplementary Materials
Data Availability Statement
The NHANES data are publicly available and can be accessed without restriction at the following link: https://wwwn.cdc.gov/nchs/nhanes/default.aspx.