

Abstract
Background
Fat content (FC) and fatty acids (FA) are the most important traits in shea tree breeding, controlled by several genes with relatively small effects. Therefore, determining the genes involved in the biosynthesis of such traits is crucial for improving oil quantity and quality and for the domestication process of the species. To identify the quantitative trait nucleotides (QTNs) controlling FC and FA, we conducted a multi-locus genome-wide association study (GWAS) using six multi-locus GWAS methods for FC and FA in 122 superior shea trees (SSTs). SSTs were genotyped using DArTseq, resulting in 7,559 non-redundant single nucleotide polymorphism markers.
Results
Fat content varied from 36 to 58% with a mean of 50%. Fatty acid composition was 51.26 ± 4.21, 38.76 ± 4.67, 6.45 ± 0.76 and 3.53 ± 0.52% for oleic, stearic, linoleic and palmitic acids, respectively. A very high negative correlation coefficient (-0.98) was found between stearic and oleic acids. A total of 47 significant QTNs associated with fat-related traits were detected by the GWAS methods. Among these QTNs, 25 were identified as common QTNs based on their detection by multiple GWAS methods. Using the superior allele information of the 4 common QTNs associated with fat content in 17 high-fat and 21 low-fat SSTs, we found a higher percentage of superior alleles in SSTs with high FC (47.1%) than in SSTs with low FC (14.3%). Pathway analysis of the common QTNs identified 24 potential candidate genes likely involved in the biosynthesis of FC and FA composition in shea tree seeds.
Conclusions
These findings will contribute to the discovery of the polygenic networks controlling FC in shea tree, improve our understanding of the genetic basis and regulation of FC, and be useful for molecular breeding of high-fat shea tree cultivars.
Supplementary Information
The online version contains supplementary material available at 10.1186/s12864-025-11344-z.
Keywords: Fatty acid components, Multi-locus GWAS, Vitellaria paradoxa, Quantitative Trait Nucleotide, Candidate gene, Superior Allele proportion, Single Nucleotide Polymorphism
Background
Shea tree (Vitellaria paradoxa), a member of the Sapotaceae family, is an economically important species in the Sudano-Sahelian zone [1]. It consists of two subspecies: V. paradoxa subsp. paradoxa from West and Central Africa and V. paradoxa subsp. nilotica found in East Africa [2]. Shea butter, extracted from shea's kernels, is a key resource in local economies and international markets, serving as an essential ingredient in the food, cosmetic, and pharmaceutical industries [3]. The extraction process for shea butter is still not standardized and is typically performed by manual or semi-mechanized methods [4]. Regardless of factors such as origin, genetic variation and climatic conditions, the qualitative and quantitative composition of shea butter is mainly related to the extraction process [4, 5]. Therefore, the Codex Alimentarius specifies quality parameters for unrefined shea butter, allowing its classification into two categories based on water content, free fatty acids, peroxide value and insoluble impurities: butter for direct consumption (grade 1a) and butter for use in the food industry (grade 1b) [4].
Shea butter predominantly consists of four main fatty acids: approximately 48% oleic acid (C18:1), 40% stearic acid (C18:0), 5% linoleic acid (C18:2), and 3% palmitic acid (C16:0) [6]. Its high stearic acid and oleic acid content makes it particularly suitable for applications in the chocolate and confectionery industries. Furthermore, shea butter is the most widely utilized commercial source of Sat-O-Sat (Sat: saturated fatty acid and O: oleic acid), a key component in the production of confectionery fats [7].
Despite its economic and industrial importance, traditional shea cultivation faces significant challenges. These include the species’ long juvenile phase of 15–20 years [8] and the high heterogeneity of natural populations due to its outcrossing nature [9]. This variability often leads to inconsistencies in oil quality and yield, hindering its full market potential [10].
V. paradoxa is a diploid species (2n = 24) with a genome estimated at 658.7 Mbp containing over 38,000 coding genes [10]. This genomic information provides a strong foundation for the study of genetic traits associated with agronomic value. Through participatory surveys, potential superior shea trees have been identified based on traits such as tree yield, fruit size, pulp taste, and early flowering [11]. Previous studies have characterized these superior trees at both morphological and molecular levels [12–14]. However, their fat content and fatty acid composition, key traits that influence shea butter quality, have not been thoroughly investigated.
Determining these traits in superior shea trees and using advanced genomic tools, such as genome-wide association studies (GWAS), will provide new opportunities to identify quantitative trait nucleotides (QTNs) associated with fat content and fatty acid profile. Multi-locus GWAS methods have proven to be highly efficient and accurate in identifying genetic markers associated with complex traits. Unlike single-marker models, these approaches reduce false positives and provide a comprehensive understanding of genetic influences.
In this study, multi-locus GWAS approaches were applied to dissect the genetic basis of fat content and fatty acid composition in a genetically diverse population of superior shea trees. The specific objectives were: (I) to determine the fat content and fatty acid composition; (II) to identify significant QTNs associated with fat content and fatty acids; and (III) to discover candidate genes controlling fat-related traits in shea trees.
Ultimately, the results of this research, combined with the recently developed affordable and efficient DNA extraction protocol described Attikora et al. [15], are expected to increase scientific knowledge of superior shea trees and advance shea tree breeding programs. This will increase the economic potential of the species by addressing market challenges such as variability in oil quality, in terms of fatty acid profiles, and yield. To our knowledge, this is the first genome-wide association study (GWAS) focused on fat content and fatty acid composition in Vitellaria paradoxa. These findings will serve as a foundation for future genetic improvement efforts, benefiting local farmers and global industries that rely on shea butter.
Methods
Plant materials and leaf sampling for DNA extraction
An initial population of 170 genotyped mature superior shea trees (SSTs) from the Hambol, Poro and Tchologo districts of Côte d’Ivoire were considered for shea fruit sampling. The savannas of northern Côte d’Ivoire, where shea trees grow, are divided into the Sudanese savanna (Poro, Tchologo districts) with monomodal rainfall (1,200 mm/year) and the sub-Sudanese savanna (Hambol district), a transitional zone with bimodal rainfall (1,050 mm/year). Average annual temperatures are approximately 27 °C, and vegetation includes wooded and grassy savannas with gallery forests along waterways. Soils are predominantly ferralitic, with subclasses including soils on basic rocks, tropical ferruginous soils, and hydromorphic soils. Key crops include cotton, cashew nuts, and mangoes, while common tree and shrub species include Vitellaria paradoxa, Paria biglobosa, Pilliostigma thonningii, and others [13].
The number of initial SSTs in each district was based on the density of the shea population. In addition, the selection of superior shea trees consisted of a participatory survey in which farmers were allowed to select SSTs based on specific criteria, including high fruit yield, large fruit size, early flowering each year, and periodicity of fruit production [12].
A total of 122 mature SSTs from the initial population (170 SSTs) were selected for fruit sampling based on the initial number of SSTs in each district. In fact, in Hambol district, 100% of the SSTs were sampled (25/25 SSTs) and in Poro district, 48 out of 53 SSTs were sampled since any fruit was found under the five remaining SSTs. Regarding the district of Tchologo, only 50% of the initial SSTs, representing 48 out of 97, were randomly selected for fruit sampling for this study. The sequences of the genotypes include in this study were uploaded in NCBI as Sequence Read Archive (SRA) under the BioProject “PRJNA1167878”. Leaves sampling and DNA extraction were described in our previous study [13]. One hundred fruits (100) were randomly collected from each genotype for shea butter extraction. The pulp was removed, and the nuts were boiled in water at 98 ± 2 °C under atmospheric pressure for 15 min. They were then sun-dried for two weeks and the coat was removed from the kernels. The kernels were oven-dried at 40 °C for 24 h, then ground into a paste using a high-speed laboratory grinder (FRITSCH, 19.1020/00426, ROHS, Oberstein, Germany). The obtained pastes were stored at 4 °C in sealed plastic containers under vacuum until fat extraction.
The fat extraction process was carried out in the Food Science and Formulation Laboratory at TERRA, ULiège GxABT, Belgium. The extraction of the fat was carried out according to the maceration method described by Kaoussi et al. [16] to preserve the physicochemical properties of the fat while also enhancing the yield. One hundred grams (100 g) of the sample were mixed with 200 mL of hexane in a 500 mL capacity Duran flask and heated to 40 °C while stirring for 90 min using a temperature-controlled heating agitator system. The extracts were then centrifuged at 7000 rpm for 15 min at 30 °C using a Jouan C312 centrifuge (France). Finally, the clarified supernatant was filtered using a vacuum filtration setup consisting of a Buchner funnel with Whatman No. 1 filter paper (Ø125 mm) placed on an Erlenmeyer flask and separated by a gasket. A vacuum pump is attached to the setup to generate the vacuum. The extraction process was repeated three times on the same matrix to deplete it of fats, with the filtrates collected and combined in a 1000 mL flask. The solvent was then removed using a rotary evaporator (Büchi Labortechnik AG, Flawil, Switzerland), and any remaining solvent traces were eliminated by nitrogen flushing. The extracted shea butters were stored in the dark at − 20 °C until analysis. All extractions were conducted in triplicate for each sample.
Fatty acid composition
The fatty acid composition of the extracted shea butter was determined following transesterification with BF3, according to the AOCS Ce 2–66 method. Fatty acid methyl esters (FAME) were analyzed using a GC ULTRA gas chromatograph (Thermo Scientific Interscience) equipped with a flame ionization detector (FID) and an HP-Innowax column (Agilent Technology) of 30 m × 0.5 µm × 0.25 µm (length x thickness x diameter). The injection was carried out in splitless mode (splitless time: 2 min) at 250 °C. Helium served as the carrier gas, with a constant flow rate of 1 mL/min. The temperature program was set as follows: starting at 50 °C with a 1-min hold, then increasing to 150 °C at a rate of 30 °C/min, followed by a rise to 240 °C at 5 °C/min with a 25-min hold. The FID was set to 250 °C. Fatty acid methyl esters were identified by comparing their retention times with those of pure reference standards. Analyses were performed in triplicate and the mean values for each sample were considered.
Phenotypic data analysis
The fat related-traits data were analyzed using R software, version 4.3.3. An analysis of variance (ANOVA) was performed to determine the variations within and among the genotypes. The correlation coefficients between the studied traits were calculated and presented in graphical form. Additionally, a principal component analysis (PCA) was performed to structure the studied traits.
SNP genotyping data analysis
The methods used for SNP genotyping and mapping were described in previous study [13]. Sequencing was performed using genotyping by sequencing DArTseq technology. DArTseq SNP markers were aligned to the Vitpa_HiCP0_Assembly reference genome (https://bioinformatics.psb.ugent.be/orcae/overview/Vitpa) to locate the corresponding chromosomal positions. A total of 42,705 SNP markers were mapped. To discard low-quality SNP and ensure data integrity, markers with more than 20% missing data were removed. In addition, minor allele frequency (MAF) SNPs with less than 5% were considered rare and were therefore excluded. A final dataset consisting of 7,559 SNP markers was used for the further analysis.
Analysis of population structure and linkage disequilibrium
Bayesian clustering approach was performed using STRUCTURE 2.3.4 software to investigate the structure of the shea panel based on an admixture model excluding the LOCPRIOR option was used [17]. The algorithm of the model-based clustering is to identify genetic groups in terms of K values. The analysis was performed in 10 runs, with successive values of K ranging from 1 to 10 and burn-in period of 50,000 and 100,000 Markov-chain Monte Carlo (MCMC) replicates. The optimal K value was determined based on the delta-K [∆(K)] method using the rate of change in [Ln(P(D)] between successive K values. An unweighted neighbor-joining (NJ) tree was constructed based on a dissimilarity matrix (DM) estimated from the 7,559 SNPs using TASSEL 5.2.80 [18]. In addition, discriminant analysis of principal component (DAPC) was performed using the “find.clusters” function of the “adegenet” package in R software version 3.4. 4 to access the structure of the Shea panel. Genome-wide linkage disequilibrium (LD) was generated by plotting average r2 (correlation frequency among SNPs) values as a function of genetic distance in base pairs (bp) against the twelve chromosomes across the shea tree genome using the TASSEL 5.2.80. The LD decay plot was calculated in R.
Genome-wide association study
The R platform mrMLM 4.0.2 (https://cran.r-project.org/web/packages/mrMLM.GUI/index.html) for ML-GWAS was used to map candidate QTNs. Six multi-locus GWAS methods within the mrMLM R package were used to identify significant QTNs, including mrMLM [19], FASTmrMLM [20], FASTmrEMMA [21], pLARmEB [22], pKWmEB [23], and ISIS EM-BLASSO [24]. All parameters were set to default values, and the critical LOD score was set to 3 for robust QTNs in the final step. In this study, the six multi-locus GWAS methods were applied because they have demonstrated their advantages over single-locus GWAS methods. In addition, the combination of multi-locus methods is also highly recommended to improve the power and robustness of GWAS. To control false-positives, the Q + K model, in which are included the population structure matrix (Q) and the kinship matrix (K), were used in the analysis. The kinship matrix was calculated using the R package mrMLM 4.0.2.
Superior allele analysis
We considered the QTNs detected by at least two ML-GWAS methods as common QTNs. Based on the effect values of each common QTN and the genotype for code 1, we could determine the superior alleles of each QTN. If the QTN effect value is positive, the genotype for code 1 is the superior allele; if the effect value is negative, the alternative genotype is the superior allele. For each QTN, the proportion of superior alleles in 38 SSTs, consisting of 17 with high fat content and 21 with low fat content, was equal to the number of genotypes containing the superior allele divided by the total number of genotypes. For each genotype, the proportion of superior alleles in these QTNs was calculated as the number of superior alleles divided by the total number of QTNs. These 38 SSTs were selected based on the average fat content.
Candidate genes annotation
QTNs detected by ML-GWAS methods were selected as candidate genes. To account for putative genes associated with traits, a window range of 10 kb (upstream and downstream) was defined; and genes were searched from the V. paradoxa Whole Genome v2.0 Assembly and Annotation in the ORCAE database (https://bioinformatics.psb.ugent.be/orcae, accessed on July 26, 2024), with a search for candidate genes associated with fat content traits. The gene name, description, and AGPv4 coordinates with its protein were then searched in the Vitellaria paradoxa reference genome database. The putative functional candidate genes associated with the corresponding SNPs were then annotated according to any initially annotated genes from other species.
Results
Fat content and fatty acid composition of superior shea trees
A significant degree of variability was observed in the fat content of the superior shea trees (Fig. 1 and Table S1). The mean fat content of the 122 superior shea trees was found to be 49.7%, ranging from 36.2–58.1% (Fig. 1a). A summary of the fatty acid composition of the shea genotypes is presented in Table S1. This study examined the four main fatty acids found in shea butter: palmitic acid (C16:0), stearic acid (C18:0), oleic acid (C18:1), and linoleic acid (C18:2). Oleic acid (51.3%) and stearic acid (38.8%) were the most abundant, with proportion ranging from 40.3–65.7% and 22.3–50.5%, respectively (Fig. 1c and d). Linoleic acid followed with an average of 6.4%, ranging from 4.8 to 9% (Fig. 1e).
Fig. 1.

Box plots of the distributions of the proportion relative-fat traits: a Fat content, b palmitic acid, c stearic acid, d oleic acid, and e linoleic acid, P(%): proportion
Furthermore, the coefficient of variation (CV) of fat content (7.44%) and oleic acid (8.21%) observed in superior shea trees was found to be low, while CV of palmitic acid (14.73%), stearic acid (12.05%) and linoleic acid (11.78%) was medium (Table S1). This indicates that the panel of superior shea trees exhibited low to moderate variation.
A positive correlation was observed between fat content and stearic acid (r = 0.31). In contrast, negative correlation was observed between fat content and C16:0 (r = −0.13), C18:1 (r = −0.25), and C18:2 (r = −0.43). Moreover, a strong negative correlation was found between stearic acid and oleic acid (r = −0.98) (Fig. 2).
Fig. 2.
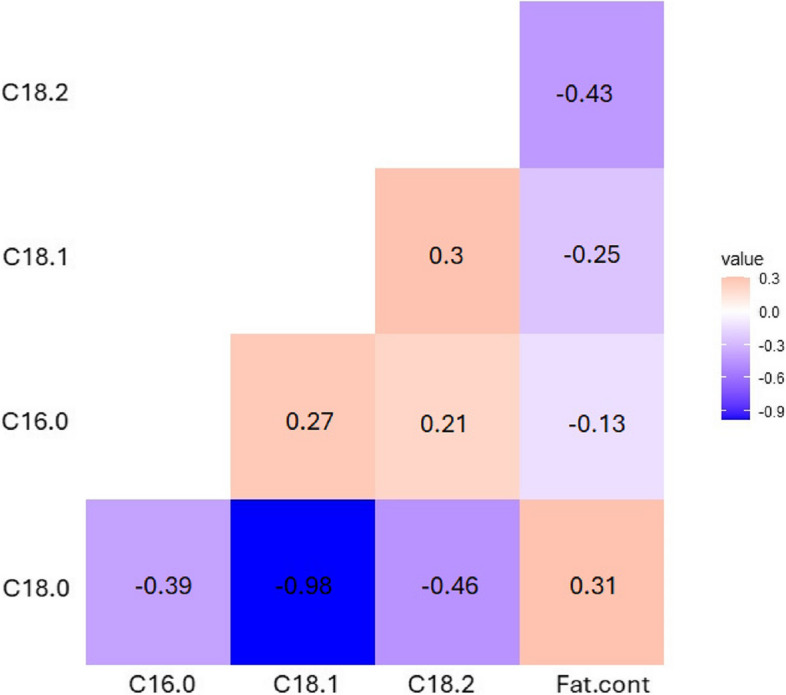
Correlation between five fat-related traits (C18.0: Stearic acid, C18.1: Oleic acid, C18.2: Linoleic acid and Fat.cont: Kernel Fat content) of the 122 superior shea trees. Color in the boxes indicates the value of the correlation relationship
The fat content and fatty acid composition of superior shea trees in different districts are shown in Table S2. Slight variations in fat content, palmitic acid, and linoleic acid were observed among superior shea trees across different districts (Table S2, Fig. 3). The mean fat content was 49% in Hambol and 49.9% in both the Poro and in Tchologo districts (Fig. 3a). Similarly, the proportion of palmitic acid was 3.6% in Hambol and 3.5% in both Poro and Tchologo districts (Fig. 3b). Mean linoleic acid content was 6.6% in Hambol, 6.3% in Poro, and 6.6% in Tchologo (Fig. 3e). However, significant quantitative variation was noted for stearic acid and oleic acid. The mean proportion of stearic acid was 36.9% in Hambol, 39.8% in Poro, and 38.6% in Tchologo (Fig. 3c). Oleic acid proportions were 52.9% in Hambol, 50.4% in Poro, and 51.3% in Tchologo (Fig. 3d).
Fig. 3.

Box plots of the distributions of Fat content and Fatty Acid Composition of Superior Shea Trees by District; a Fat content, b palmitic acid, c stearic acid, d oleic acid, and e linoleic acid
An analysis of variance (ANOVA) was performed to evaluate the effect of geographical regions on the fat content and fatty acid composition of superior shea trees. The results indicated statistically significant differences in the levels of stearic acid (p = 0.03) and oleic acid (p = 0.05) across districts (Table S2). However, no significant variations were found in fat content, palmitic acid, or linoleic acid between the districts.
Principal Component Analysis (PCA)
PCA was conducted to identify the variables that significantly influence the principal components (PCs), thereby explaining the variability in the data set. The PCA generated five principal components (PCs) in total, with the first two main PCs (eigenvalues > 1) accounting for 72.4% of the total variation (Figure S1). PC1 explained 52% of the total variance, mainly driven by C18:0 (positive loading) and opposed by C18:1 variable (negative loading). The residual variance in PC2 (20.46%) was mostly explained by C18:2 (negative loading) and fat content (positive loading).
Population structure and linkage disequilibrium
The population structure of 122 superior shea trees was analyzed using the 7559 high-quality genome-wide SNP markers. The density and distribution of SNPs on each chromosome across the shea tree genome are presented in Fig. 4.
Fig. 4.

The number and size of SNPs within 1 Mb window size of V. paradoxa subsp paradoxa genome
Model-based simulation of population structure showed the highest peak at K = 3 as the number of genetic groups plotted against delta K (∆K) by Structure Harvester (Fig. 5a). This indicating the presence of three genetic groups (GG1, GG2 and GG3) in the reference set (Fig. 5b). GG1 was the largest with 52 superior shea trees, including 33 pure types and 19 admixture types that constituted 42.62% of the shea panel. GG2 with 30 SST included 20 pure types and 10 admixtures constituting 24.59% of the total accessions and GG3 with 40 SST included 21 pure types and 19 admixtures, 32.79% of the entire population. The estimated fixation index (FST) was 0.012, 0.018 and 0.021 for GG1, GG2 and GG3 respectively. The highest allelic frequency of divergence was found between GG2 and GG3 (Table S3).
Fig. 5.

Population structure, phylogenetic analysis and linkage disequilibrium (LD). a Delta K for various numbers of clusters (K); b Population structure inferred into three subgroups (K = 3) based on delta K values; c Scatter plot of DAPC showing the genetic networks for the three groups; d Phylogenetic analysis using the neighbor-joining method grouped into three clusters; e LD decay plot from all population. The x-axis represents the physical distance, and the y-axis represents the average pairwise correlation coefficient (r2) of SNPs
Consistent with the findings from Bayesian model-based simulation of population structure, the discriminant analysis of principal components (DAPC) also suggested three distinct clusters based on the value of BIC (822.91) (Fig. 5c). Cluster I had 24 accessions, cluster II had 66 accessions and cluster III had 32 accessions. Similarly, the unweighted neighbor-joining (NJ) tree method clustered the accessions into three groups. Cluster I had 89 accessions, cluster II had 24 and cluster III had 9 accession and individuals from each district were found in the three clusters (Fig. 5d).
The average distance of LD decay (r2) based on 7,559 SNP markers in the whole genome were calculated. The value of r2 declined rapidly to reach a plateau at 0.01. The corresponding distance was considered as the average distance of LD decay in this population. The overall LD decay was very low (r2 > 0.2) at a physical distance of 1107 pb in shea tree germplasm (Fig. 5e).
Multi-locus genome-wide association study analysis of fat-related traits in V. paradoxa
All five fat-related traits were analyzed using six ML-GWAS methods (mrMLM, FASTmrMLM, FASTmrEMMA, pKWmEB, pLARmEB and, ISIS EM-BLASSO) to identify QTNs. A total of 47 significant QTNs (LOD ≥ 3) were identified on all twelve chromosomes (Table S4 andFig. 6). Of these, 21, 16, 5, 29 and 26 were detected with mrMLM, FASTmrMLM, FASTmrEMMA, pLARmEB, and ISIS EM-BLASSO respectively. In contrast, pKWmEB ML-GWAS method did not identified any QTN. Of the detected QTNs, 8, 9, 18, 12, and 9 were defined to be associated with FC, C16:0, C18:0, C18:1, and C18:2 respectively. It should be notice that 9 of the detected QTNs were associated with both C18:0 and C18:1 (Table S4).
Fig. 6.

Manhattan and QQ plots for five fat-related traits in in GWAS using mrMLM v4.0.2. with 7559 SNP markers. Left is Manhattan plot, while right is QQ plot. Loci discovered by multiple methods together are marked with pink dots in the Manhattan diagram, those discovered by a single method are marked in blue above the horizontal line that indicates a critical LOD score of 3.0. a Fat content; b Palmitic acid; c Stearic acid; d Oleic acid; e Linoleic acid
A total of 25 identified QTNs were detected by at least two ML-GWAS methods (20 QTNs) or/and co-associated with two traits (9 QTNs) or/and were flanking near a putative coding regions (10 QTNs) that have a crucial role in V. paradoxa lipid biosynthesis. These QTNs were then chosen as common QTNs for the five fat-related traits.
For the 20 QTNs detected by at least two ML-GWAS methods, 6 were found to be tightly associated with both C18:0 and C18:1 (Table S4). For the remaining QTNS, 4, 4, and 6 were found to be associated with FC, C16:0 and C18:2, respectively. The six common QTNs detected for both C18:0 and C18:1 were located on chromosomes 2, 3, and 6. For FC, the 4 common QTNs were distributed on chromosomes 2, 4 and, 11. The 4 common QTNs of C16:0 were distributed on chromosomes 3, 7, 9 and 12. A total of 6 QTNs which commonly associated with C18:2, spread over 1, 2, 5, 6, and 7 chromosomes. Of these, fourteen QTNs were co-detected by at least 3 three ML-GWAS methods while 10 QTNS were co-identified by at least 4 ML-GWAS methods. Notably, q6_3096993 and q4_46157457 were determined across all five ML-GWAS approaches.
Distribution of superior alleles in superior shea trees
As fatty acids composition depends on the fat content, the 4 common QTNs associated with fat content were used to explore the proportion of superior alleles in 38 superior shea trees (SSTs). Hence, 17 genotypes with higher fat content were considered as SSTs with higher phenotypic values while 21 genotypes with low fat content were considered as SSTs with lower phenotypic values. Genotypes with fat content above the addition of the average fat content and the standard deviation of the shea tree panel were considered as SSTs with higher phenotypic values. In contrast, genotypes with fat content below the subtraction of standard deviation in the average fat content were considered as SSTs with lower phenotypic values. Therefore, 17 SSTs had higher phenotypic values (53.51–58.09%) and 21 had lower phenotypic values (36.24–46.03%). For each of the 21 SSTs with lower fat content, the proportion of superior alleles ranged from 0 to 25%, while the proportion of superior alleles in the 17 SSTs with higher fat content ranged from 25 to 100%. Thus, the superior shea trees with high fat content have more superior alleles than the shea trees with low fat content (Fig. 7).
Fig. 7.

Heat map of the superior alleles distribution for the 4 common QTNs associated to fat content in 17 high-fat (lower part of the figure) and 21 low-fat (upper part of the figure) superior shea trees. Green and white colors represent superior and inferior alleles, respectively
However, it is observed that there is no proportional relationship between the fat content and the percentage of superior alleles among SSTs with high phenotypic value. For example, sample K359 exhibited a fat content of 58.09% with 25% of superior alleles, while sample K360 displayed a fat content of 54.42% with 100% of superior alleles (Table 1).
Table 1.
Phenotypic averages of kernel fat content and proportion of superior alleles in 38 genotypes across 4 common QTNs
| Individual | FC(%) | PSA(%) | Individual | FC(%) | PSA(%) | Individual | FC(%) | PSA(%) |
|---|---|---|---|---|---|---|---|---|
| K359 | 58.09 | 25 | K297 | 53.86 | 25 | KK11 | 44.42 | 25 |
| KK46 | 55.86 | 75 | K328 | 53.81 | 50 | KK03 | 44.18 | 0 |
| KK60 | 55.54 | 25 | KK19 | 53.52 | 75 | K300 | 43.79 | 25 |
| KK08 | 55.54 | 25 | K387 | 53.51 | 25 | KK16 | 43.78 | 25 |
| K385 | 55.11 | 50 | KK54 | 46.03 | 0 | KK22 | 43.55 | 25 |
| KK41 | 55.1 | 25 | KBON04 | 45.97 | 25 | K379 | 43.3 | 25 |
| KK48 | 54.56 | 50 | K358 | 45.78 | 0 | KK24 | 42.92 | 0 |
| KBON05 | 54.49 | 50 | KBON03 | 45.43 | 25 | K308 | 42.62 | 0 |
| K360 | 54.42 | 100 | KOUA35 | 45.36 | 25 | KOUA38 | 41.72 | 0 |
| KK29 | 54.33 | 50 | KTI07 | 45.27 | 0 | KBON09 | 41.28 | 25 |
| KOUA40 | 54.28 | 50 | K319 | 44.71 | 25 | K334 | 41.01 | 25 |
| K304 | 54.24 | 50 | KTI05 | 44.65 | 0 | KK02 | 36.24 | 25 |
| K380 | 54.15 | 50 | KN06 | 44.42 | 0 | - | - | - |
FC Fat content, PSA proportion of superior allele, characters in bolt represent genotypes with low fat content
Based on the superior allele information of these 4 important QTNs within the 38 superior genotypes, the PSAs for QTNs ranged from 0 to 82.35%. Among them, 2 QTNs showed a PSA above 50%, while the remaining 2 QTNs showed PSA lower than 20%.
Within the 17 SSTs with high fat content, the PSA for QTNs ranged from 11.76 to 82.35%. Two QTNs had PSA values higher than 60% while the other two QTNs had PSA value lower than 50%. The range of PSAs of QTNs was 0–33.33% in the 21 SSTs with lower phenotypic values. All the QTNs had PSAs lower than 50% (Table 2 and Fig. 7). The number of QTNs with superior alleles proportion, higher than 50%, was more in the 17 SSTs than in the 21 SSTs with lower phenotypic values.
Table 2.
Superior alleles and their proportions of 25 common QTNs and the five fat-related traits in 17 high FC SSTs and 21 low FC SSTs
| Trait | QTN | Superior genotypes | Chr | QTN position | LPV (%) | HPV (%) | ||
|---|---|---|---|---|---|---|---|---|
| Fat content | q4_46157457 | CC | 4 | 46,157,457 | 33.33 | 14.29 | 82.35 | 47.06 |
| q11_13733557 | GG | 11 | 13,733,557 | 0 | 29.41 | |||
| q2_13023583 | TT | 2 | 13,023,583 | 23.81 | 64.71 | |||
| q2_49928619 | TT | 2 | 49,928,619 | 0 | 11.76 | |||
| C16:0 | q3_57006090 | CC | 3 | 57,006,090 | 61.9 | 41.61 | 64.71 | 39.71 |
| q7_45956782 | GG | 7 | 45,956,782 | 0 | 0 | |||
| q9_42857113 | TT | 9 | 42,857,113 | 9.52 | 17.65 | |||
| q12_1933151 | CC | 12 | 1,932,377 | 95.24 | 76.47 | |||
| C18:0 | q2_70518009 | AA | 2 | 70,518,009 | 80.95 | 35.42 | 76.47 | 44.12 |
| q2_5991246 | AA | 2 | 5,991,246 | 0 | 23.53 | |||
| q6_3096993 | GG | 6 | 3,096,993 | 74.43 | 82.35 | |||
| q3_45009201 | CC | 3 | 45,009,201 | 23.81 | 35.29 | |||
| q6_48934498 | CC | 6 | 48,934,498 | 4.76 | 17.67 | |||
| q2_15731361 | GG | 2 | 15,731,361 | 28.57 | 29.41 | |||
| q9_1241251 | TT | 9 | 1,241,251 | 4.76 | 0 | |||
| q3_43202766 | TT | 3 | 43,202,766 | 0 | 0 | |||
| q1_78304163 | TT | 1 | 78,304,163 | 38.1 | 35.29 | |||
| q6_28898438 | TT | 6 | 28,898,438 | 28.57 | 5.88 | |||
| q9_1135448 | CC | 9 | 1,135,448 | 85.71 | 88.24 | |||
| C18:1 | q2_5991246 | GG | 2 | 5,991,246 | 80.95 | 43.65 | 52.94 | 27.45 |
| q6_3096993 | CC | 6 | 3,096,993 | 4.76 | 5.88 | |||
| q2_70518009 | GG | 2 | 70,518,009 | 9.52 | 0 | |||
| q3_45009201 | TT | 3 | 45,009,201 | 38.1 | 23.53 | |||
| q6_48934498 | AA | 6 | 48,934,498 | 80.95 | 58.82 | |||
| q2_15731361 | AA | 2 | 15,731,361 | 47.62 | 23.53 | |||
| q9_1241251 | CC | 9 | 1,241,251 | 95.24 | 82.35 | |||
| q3_43202766 | CC | 3 | 43,202,766 | 76.19 | 64.71 | |||
| q1_78304163 | GG | 1 | 78,304,163 | 23.81 | 23.53 | |||
| C18:2 | q1_20786407 | TT | 1 | 20,786,407 | 42.86 | 42.18 | 17.65 | 28.57 |
| q2_51742656 | GG | 2 | 51,742,656 | 33.33 | 5.88 | |||
| q5_ 9,317,929 | TT | 5 | 9,317,929 | 71.43 | 58.82 | |||
| q6_43871960 | CC | 6 | 43,871,960 | 19.05 | 17.65 | |||
| q6_10189604 | TT | 6 | 10,189,604 | 4.76 | 0 | |||
| q7_48678186 | TT | 7 | 48,678,186 | 80.95 | 64.71 | |||
| q10_3420702 | CC | 10 | 3,420,702 | 42.86 | 35.29 | |||
Chr chromosome, LPV low fat content, HPV high fat content
Table 2: Superior alleles and their proportions of 25 common QTNs and the five fat-related traits in 17 high FC SSTs and 21 low FC SSTs.
We further explored the superior alleles within the 17 SSTs with high fat content for stearic and oleic acids as they are the major fatty acids in V. paradoxa. As results, 44.12% of superior alleles were found for C18:0 while 27.45% of superior alleles were found for C18:1 (Table 2).
Potential candidates genes and annotations
To predict candidate genes for loci significantly associated with fat content and fatty acid composition, the detected QTNs were used to confirm the genomic regions in V. paradoxa reference genome. We identified 24 putative genes that possibly influence fat content and fatty acid composition (Table 3). These putative genes were associated with six gene/protein families involved in the fatty acid biosynthesis of shea nuts. For fat content, four putative genes Vitpa04g20550, Vitpa11g11370, Vitpa02g10450, Vitpa02g28870, corresponding to 3 gene/protein families were discovered: Long Chain Acyl-CoA Synthetase (LACS) on chromosome 4 at locus q4_46157457, SNF1-related protein kinase regulatory subunit beta-2 (KINB2) on chromosome 11 at locus q11_13733557, 3-Ketoacyl-ACP synthase (KAS) on chromosome 2 at loci q2_13023583 and q2_49928619 (Table 3). These genes are all involved in the fatty acid biosynthesis pathway.
Table 3.
Gene annotation for the common QTNs of fat content and fatty acid composition of V. paradoxa
| Trait | QTN | Chr | pos | Gene ID | G.O | Function |
|---|---|---|---|---|---|---|
| Fat cont | q4_46157457 | 4 | 46,157,457 |
Vitpa04g20550 Long chain Acyl-CoA Synthetase 5: LACS5 |
GO:0001676 | Long-chain fatty acid metabolic process |
| q11_13733557 | 11 | 13,733,557 |
Vitpa11g11370 SNF1-related protein kinase regulatory subunit beta-2: KINB2 |
GO:0006633 | Regulation of fatty acid synthesis by phosphorylation of acetyl-CoA carboxylase | |
| q2_13023583 | 2 | 13,023,583 |
Vitpa02g10450 3-ketoacyl-CoA synthase 1: KASI |
GO:0016021 | Fatty acid biosynthesis | |
| q2_49928619 | 2 | 49,928,619 |
Vitpa02g28870 Ketoacyl-ACP synthase 2: KASII |
GO:0006633 | Fatty acid biosynthetic process | |
| C16:0 | q3_57006090 | 3 | 57,006,090 |
Vitpa01g27780 Fatty acid desaturase 2: FAD2 |
GO:0006629 | Lipid metabolic process |
| q7_45956782 | 7 | 45,956,782 |
Vitpa07g24400 Acyl-CoA binding protein 1: ACBP1 |
GO:0005515 | Protein binding | |
| q9_42857113 | 9 | 42,857,113 |
Vitpa09g21310 Long chain Acyl-CoA Synthetase 6: LACS6 |
GO:0022857 | Transmembrane transporter activity | |
| q12_1933151 | 12 | 1,933,151 |
Vitpa12g00850 Long chain Acyl-CoA Synthetase 1: LACS1 |
GO:003677 | DNA binding | |
| C18:0 | q2_70518009 | 2 | 70,518,009 |
Vitpa02g441500 Acetyl-CoA Carboxylase alpha-CT subunit: CAC3 |
GO:0003989 | Acetyl-CoA carboxylase activity |
| q2_5991246 | 2 | 5,991,246 |
Vitpa02g04990 3-ketoacyl-ACP synthase 3: KASIII |
IPR029058 | Lipid metabolism; fatty acid biosynthesis | |
| q6_3096993 | 6 | 3,096,993 |
Vitpa06g02800 Acetyl-CoA Carboxylase 1: CAC1 |
GO:0016874 | Ligase activity | |
| q3_45009201 | 3 | 45,009,201 |
Vitpa03g23170 Long chain Acyl-CoA Synthetase 2: LACS2 |
GO:0005524 | ATP binding | |
| q6_48934498 | 6 | 48,934,498 |
Vitpa06g31150 Biotin carboxyl carrier protein of acetyl-CoA carboxylase 1: BCCP1 |
PTHR45667 | Component of the acetyl coenzyme A carboxylase complex | |
| q2_15731361 | 2 | 15,731,361 |
Vitpa02g12030 Acyl-CoA binding Protein 5: ACBP5 |
GO:0008080 GO:0005778 |
N-acetyltransferase activity | |
| q6_28898438 | 6 | 28,898,438 |
Vitpa06g20320 Long-chain Acyl-CoA Synthase 2: LACS2 |
PTHR43272:SF4 | Long-chain fatty acid-CoA ligase activity | |
| q9_1135448 | 9 | 1,135,448 |
Vitpa09g00560 Fatty Acid Exporter 2: FAX2 |
GO:0035338 | Long-chain fatty-acyl-CoA biosynthetic process | |
| q3_43202766 | 3 | 43,202,766 |
Vitpa03g22110 Long chain Acyl-CoA Synthetase 2: LACS 2 |
GO:0006636 | Unsaturated fatty acid biosynthetic process | |
| q1_78304163 | 1 | 78,304,163 |
Vitpa01g39960 Acyl-CoA binding protein 1: ACBP1 |
GO:0005515 | Protein binding | |
| q9_1241251 | 9 | 1,241,251 |
Vitpa09g00560 Fatty Acid Exporter 2: FAX2 |
GO:0035338 | Long-chain fatty-acyl-CoA biosynthetic process | |
| C18:1 | q2_5991246 | 2 | 5,991,246 |
Vitpa02g04990 3-ketoacyl-ACP synthase 3: KASIII |
IPR029058 | Lipid metabolism; fatty acid biosynthesis |
| q3_43202766 | 3 | 43,202,766 |
Vitpa03g22110 Long chain Acyl-CoA Synthetase 2: LACS 2 |
GO:0006636 | Long-chain fatty acid-CoA ligase activity | |
| q1_78304163 | 1 | 78,304,163 |
Vitpa01g39960 Acyl-CoA binding protein 1: ACBP1 |
GO:0005515 | Protein binding | |
| q9_1241251 | 9 | 1,241,251 |
Vitpa09g00560 Fatty Acid Exporter 2: FAX2 |
GO:0035338 | Long-chain fatty-acyl-CoA biosynthetic process | |
| q6_3096993 | 6 | 3,096,993 |
Vitpa06g02800 Acetyl-CoA Carboxylase 1: CAC1 |
GO:0016874 | Ligase activity | |
| q2_70518009 | 2 | 70,518,009 |
Vitpa02g44080 CAC3: Acetyl-CoA Carboxylase alpha-CT subunit |
GO:0008324 | Cation transmembrane transporter activity | |
| q3_45009201 | 3 | 45,009,201 |
Vitpa03g23170 LACS: Long chain Acyl-CoA Synthetase |
GO:0005524 | ATP binding | |
| q6_48934498 | 6 | 48,934,498 |
Vitpa06g31150 Biotin carboxyl carrier protein of acetyl-CoA carboxylase 1: BCCP1 |
PTHR45667 | Component of the acetyl coenzyme A carboxylase complex | |
| C18:2 | q1_20786407 | 1 | 20,786,407 |
Vitpa01g16230 Fatty acid Desaturases: FADs |
GO:0005506 | Fatty acid metabolism |
| q2_51742656 | 2 | 51,742,656 |
Vitpa02g30850 Acetyl-CoA Carboxylase: CAC |
GO:0004672 | Acetyl-CoA carboxylase activity | |
| q5_ 9,317,929 | 5 | 9,317,929 |
Vitpa05g05820 Fatty acid Desaturase 1: FAD1 |
GO:0016702 | Oxidoreductase activity | |
| q6_43871960 | 6 | 43,871,960 |
Vitpa06g27010 Long-chain acyl-CoA synthetase 5: LACS 5 |
GO:0005682 | Long-chain fatty acid-CoA ligase activity | |
| q6_10189604 | 6 | 10,189,604 |
Vitpa06g09060 Fatty acid Desaturase 2: FAD2 |
GO:0006636 | Unsaturated fatty acid biosynthetic process | |
| q7_48678186 | 7 | 48,678,186 |
Vitpa07g26220 Acyl-CoA binding protein 2: ACBP2 |
PTHR43840:SF2 | Metal ion binding | |
| q10_3420702 | 10 | 3,420,702 | Acyl-CoA binding protein 6: ACBP6 | GO:0000062 | Fatty-acyl-CoA binding |
Chr chromosome, pos QTN position, G.O Gene ontology, Fat cont Fat content
For the Fatty acids (palmitic, stearic, oleic and linoleic), 20 putative genes corresponding to 7 gene/protein families were discovered in shea butter: Fatty acid desaturases (FADs) on chromosomes 1, 3, 5 and, 6; Acyl-CoA-binding protein (ACBP) on chromosomes 1, 2, 7 and 10; Long Chain Acyl-CoA Synthetase (LACS) on chromosomes 3, 6, 9 and 12; Acetyl-CoA Carboxylase (CAC) on chromosomes 2 and 6; Fatty Acid Export (FAX) on chromosome 9; Biotin carboxyl carrier protein of acetyl-CoA carboxylase (BCCP) on chromosome 6; and 3-Ketoacyl-ACP synthase (KAS) on chromosome 2 (Table 3).
For palmitic acid, three family of genes were found; ACBP1 on chromosome 7; LACS on chromosomes 9 and 12 and; FAD2 on chromosome 3. Stearic and oleic acid identified the same putative genes. Four gene families were discovered: CAC, KAS, LACS, BCCP, ACBP, FAX and FADs. Finaly, FADs, LACS, CAC and ACBP gene families were identified for linoleic acid (Table 3). The genes identified from fatty acid are involved in Fatty acid biosynthesis and Fatty acid transmembrane transport pathways (Table 3).
Discussion
Phenotypic characteristics of shea fat-related traits
The shea industry prioritizes shortening the juvenile maturity period, increasing oil yield per hectare, and improving oil quality [25].
The analysis revealed significant variation within populations but non-significant variation among populations for fat content. The lack of variation among populations suggests that newly bred varieties could adapt well across in the Côte d'Ivoire shea parklands [13], supported by the high proportion of admixture genotypes observed (Fig. 5b). Reliable heritability estimates indicate that the selection of marker-associated traits for high-fat yield can significantly enhance genetic progress in shea breeding.
The fat content observed in this study (49.7%) exceeded that reported for V. paradoxa subsp. paradoxa in Nigeria (45.5%) (6), likely due to the participatory selection of high oil-yielding genotypes (54–58%). Similar findings have been reported in Uganda, although their fat content exceeded ours, reflecting genetic differences between V. paradoxa subsp. paradoxa in West Africa and V. paradoxa subsp. nilotica in East Africa [26]. Methodological differences in fat extraction are likely to influence the reported variation, highlighting the need for standardization when comparing studies [4, 6]. Variation in fat content may also be due to the influence of environmental conditions. Authors have reported that environmental cues such as high light intensity increase seed oil content, while high temperature, drought and salinity decrease seed oil content in plant species [27, 28].
As expected, the fatty acid composition of shea butter exhibited its characteristic profile, with oleic acid (C18:1) and stearic acid (C18:0) as the dominant components. Oleic acid was more prevalent (50–53%) compared to stearic acid (36.8–40%), a trend consistent with findings from Burkina Faso [4]. West and Central African shea butter typically contains higher stearic acid and lower oleic acid levels, while the nilotica subspecies in East Africa is characterized by higher oleic acid and lower stearic acid levels [29–31]. Interestingly, "soft shea butter," high in oleic acid, has also been observed in some paradoxa regions, including Côte d’Ivoire [32]. As with fat content, environmental conditions influence fatty acid composition [27, 28, 33]. In addition, developmental cues such as gibberellins, auxin and jasmonates can alter seed oil content and modify fatty acid composition [27].
These phenotypic findings are critical for evaluating genetic and environmental interactions influencing stearic and oleic acid traits in Côte d’Ivoire. They also highlight the importance of identifying and using superior shea trees to meet industry demands for quality and consistency in shea butter production.
Detected QTNs by ML-GWAS in shea tree
In this study, six ML-GWAS methods were used to analyze five fat-related traits in 122 superior shea tree germplasm. A total of 47 significant QTNs were identified across the methods, with pLARmEB detecting the highest number (29 QTNs), suggesting its relative efficiency [34]. Similar findings have highlighted the complementarity of multi-locus GWAS methods in the analysis of complex traits, as each method captures some distinct QTNs [35]. The identified QTNs were distributed across all 12 chromosomes, underscoring the robustness of ML-GWAS in detecting small-effect loci [36] for fat-related traits in V. paradoxa.
Among the QTNs, 25 were commonly detected by at least two methods, with many located in coding regions associated with fatty acid biosynthesis genes. This highlights their importance in the regulation of fat-related trait in shea tree. Nine QTNs were associated with stearic acid (C18:0) and oleic acid (C18:1), demonstrating opposite effect values for these fatty acids. This aligns with the strong negative correlation (−0.98) observed between stearic and oleic acids, suggesting that these fatty acids are controlled, regulated or influenced by the same factors with opposite effects. Similar trends have been reported in other species, including mango, where fatty acid proportions are influenced by genetic and environmental factors [37].
High-fat-content genotypes exhibited a greater proportion of superior alleles, with notable QTNs such as q4_46157457 and q2_13023583 showing strong associations with fat biosynthesis. These findings highlight the genetic complexity of fat content, which is influenced by developmental and environmental cues [27]. In addition, superior alleles for C18:0 were more abundant than those for C18:1, consistent with their observed correlations with fat content.
Advances in omics technologies have facilitated the identification of candidate genes involved in lipid biosynthesis in shea tree [3, 10]. This study identified 24 candidate genes associated with fatty acid biosynthesis pathways. These genes are part of different protein family, including acetyl-CoA carboxylase (ACCase), the key enzyme that catalyzes the first committed step of de novo fatty acid synthesis in V. paradoxa [10]. The genes of the fatty acid complex synthase consisting of Ketoacyl-ACP synthase (KAS) that combines acetyl-CoA with malonyl-ACP to produce C16-C18 fatty acids [10, 27]. It has been shown that a higher number of lipid biosynthesis genes, such as ketoacyl ACP synthase genes in the shea tree might be responsible of the high lipid content in shea fruits [3]. Further desaturation and elongation produce longer and more unsaturated fatty acids in the endoplasmic reticulum [3, 10, 27]. This is assured by fatty acid desaturase (FADs) genes. Finally, several genes involved in the transmembrane transport of fatty acids from the plastid to the endoplasmic reticulum, including Fatty Acid Export (FAX), acyl-CoA binding proteins (ACBPs) and Long Chain Acyl-CoA Synthetases (LACS) were identified. These genes regulate key steps in fatty acid synthesis, elongation, and desaturation, contributing to the high levels of C18 fatty acids characteristic of shea butter [3, 10]. Notably, V. paradoxa encodes more lipid biosynthesis genes than species like Arabidopsis thaliana or Theobroma cacao, consistent with its superior fat yield [10].
The identified QTNs and candidate genes provide a foundation for breeding programs aimed at improving shea butter yield and quality. Three strategies can be used to incorporate these findings into breeding programs. First, the identified QTN-allele matrix can be used to predict optimal crosses, such as selecting the top 10 crosses based on their fat content and the proportion of superior allele frequency. Second, SSR markers can be developed near the identified QTNs and applied in marker-assisted selection to enhance crop improvement. Third, the significant SNPs associated with the traits of interest can be integrated into genomic selection models to improve breeding accuracy and efficiency. However, the identified genes need to be validated through functional analysis to strengthen the biological relevance of the findings.
This research underscores the potential of ML-GWAS in addressing key challenges in shea cultivation, advancing genetic improvement efforts, and supporting the economic and industrial value of V. paradoxa.
Conclusion
In this study, six multi-locus GWAS approaches were used to identify quantitative trait nucleotide (QTN) associated with fat content and fatty acid composition of V. paradoxa based on 7559 SNP markers. A total of 47 significant QTNs corresponding to 9, 18, 12, 9 and 8 were associated with fat content, palmitic acid, stearic acid, oleic acid and linoleic acid respectively, with 9 QTNs associated with both stearic and oleic acids. Among these QTNs, 25 were commonly detected by at least two GWAS methods. In total, 24 candidates genes were obtained based on the common QTNs, with 10 previously reported to be involved in the shea tree seed oil and fatty acid biosynthesis and transmembrane transport pathway. Based on 38 SSTs corresponding to 17 SSTs with high fat content and 21 SSTs with low fat content, the proportion of superior alleles of FC common QTNs ranged from 0 to 82.35%. In addition, the proportion of superior alleles within the genotypes with high fat content was higher than that with the genotypes with low fat content. This suggests that these superior alleles exhibit an additive effect on the shea tree seed oil accumulation. These findings suggest that an improvement of the shea tree seed oil yield can be achieved by integrating more superior alleles into shea genotypes by marker-assisted selection (MAS). The 17 high-fat SSTs can be directly propagated by grafting and in vitro culture to provide farmers with high-performing plant material, or can be included in breeding programs for the development of new cultivars.
Supplementary Information
Acknowledgements
We thank Adrien Francis and Franck Michels (Laboratory of Chemistry of Natural Molecules, University of Liège, Gembloux Agro-Bio Tech) for assistance with the methodology of fatty acid composition determination.
Abbreviations
- QTN
Quantitative trait nucleotide
- SST
Superior shea tree
- GWAS
Genome-wide association study
- FC
Fat content
- FA
Fatty acid
- C16:0
Palmitic acid
- C18:0
Stearic acid
- C18:1
Oleic acid
- C18:2
Linoleic acid
- PSA
Proportion of superior allele
Authors’ contributions
A.J.P.A., E.A.D and L.L., conceptualized the topic. A.J.P.A., K.A.K., and E.A.D analyzed the data. A.J.P.A., D.N.D, K.A.K., E.A.D and L.L. set up the methodology. A.J.P.A., S.S., S.D.M.Y., D.N.D., E.A.D., and L.L. provided resources. M.L.F., S.D., N.D., T.A. and L.L. supervised the study. A.J.P.A., S.D.M.Y., M.L.F., S.D., E.A.D., C.D.C., N.D., and L.L. validated the work. A.J.P.A., K.A.K., and L.L. wrote the main manuscript text. All authors reviewed and approved the final manuscript.
Funding
The author(s) declare financial support was received for the research, authorship, and/or publication of this article. This research was supported by the University of Liege Scientific Research mobility (2019/MOB/02924 and 2021/MOB/00089) and the ULiege-PACODEL "Valorization / Reinforcement” Grant.
Data availability
Sequence data that support the findings of this study have been deposited in the European Nucleotide Archive with the primary accession code PRJNA1167878. Additionally, supporting data for the findings presented in this study can be found either within the manuscript or in the supplementary files.
Declarations
Ethics approval and consent to participate
Not applicable.
Consent for publication
Not applicable.
Competing interests
The authors declare no competing interests.
Footnotes
Publisher’s Note
Springer Nature remains neutral with regard to jurisdictional claims in published maps and institutional affiliations.
References
- 1.Boffa JM. Opportunities and challenges in the improvement of the Shea (Vitellaria paradoxa) Resource and Its Management. World Agrofor Cent. 2015;76p.
- 2.Naughton CC, Lovett PN, Mihelcic JR. Land suitability modeling of shea (Vitellaria paradoxa) distribution across sub-Saharan Africa. Appl Geogr. 2015;1(58):217–27. [Google Scholar]
- 3.Wei Y, Ji B, Siewers V, Xu D, Halkier BA, Nielsen J. Identification of genes involved in shea butter biosynthesis from Vitellaria paradoxa fruits through transcriptomics and functional heterologous expression. Appl Microbiol Biotechnol. 2019;103(9):3727–36. [DOI] [PMC free article] [PubMed] [Google Scholar]
- 4.Goumbri BWF, Kouassi AK, Djang’eing’a RM, Semdé R, Mouithys-Mickalad A, Sakira AK, et al. Quality Characteristics and Thermal Behavior Diversity of Traditional Crude Shea (Vitellaria paradoxa Gaertn) Butter from Burkina Faso. Food Biophys. 2024;19(3):609–26.
- 5.Badu M, Awudza J, Budd PM, Yeates S. Determination of Physical Properties and Crystallization Kinetics of Oil From Allanblackia Seeds and Shea Nuts Under Different Thermal Conditions. Eur J Lipid Sci Technol. 2018;120(3):1700156. [Google Scholar]
- 6.Abdul-Hammed M, Jaji AO, Adegboyega SA. Comparative studies of thermophysical and physicochemical properties of shea butter prepared from cold press and solvent extraction methods. J King Saud Univ - Sci. 2020;32(4):2343–8. [Google Scholar]
- 7.Ray J, Smith KW, Bhaggan K, Nagy ZK, Stapley AGF. Characterisation of high 1,3-distearoyl-2-oleoyl-sn-glycerol content stearins produced by acidolysis of high oleic sunflower oil with stearic and palmitic acids. Eur J Lipid Sci Technol. 2014;116(5):532–47. [Google Scholar]
- 8.Lovett PN, Haq N. Evidence for anthropic selection of the Sheanut tree (Vitellaria paradoxa). Agrofor Syst. 2000;48(3):273–88. [Google Scholar]
- 9.Lovett PN, Haq N. Diversity of the Sheanut tree (Vitellaria paradoxa C.F. Gaertn.) in Ghana. Genet Resour Crop Evol. 2000;47(3):293–304. [Google Scholar]
- 10.Hale I, Ma X, Melo ATO, Padi FK, Hendre PS, Kingan SB, et al. Genomic Resources to Guide Improvement of the Shea Tree. Front Plant Sci. 2021;12. Available from: https://www.frontiersin.org/articles/10.3389/fpls.2021.720670. [DOI] [PMC free article] [PubMed]
- 11.Diarrassouba N, Yao S.D.M., Traoré B. Identification participative et caractérisation des arbres élites de karité dans la zone de production en Côte d’Ivoire. 2017 p. 15 pages. (projet FIRCA/Karité). Report No.: N° 069/2016.
- 12.Attikora AJP, Diarrassouba N, Yao SDM, Clerck CD, Silue S, Alabi T, et al. Morphological traits and sustainability of plus shea trees (Vitellaria paradoxa C.F.Gaertn.) in Côte d’Ivoire. Biotechnol Agron Société Environ. 2023 Sep 25 [cited 2023 Oct 19]. Available from: https://orbi.uliege.be/handle/2268/307173.
- 13.Attikora AJP, Yao SDM, Dago DN, Silué S, De Clerck C, Kwibuka Y, et al. Genetic diversity and population structure of superior shea trees (Vitellaria paradoxa subsp. paradoxa) using SNP markers for the establishment of a core collection in Côte d’Ivoire. BMC Plant Biol. 2024;24(1):913. [DOI] [PMC free article] [PubMed] [Google Scholar]
- 14.Yao SDM, Diarrassouba N, Attikora A, Fofana IJ, Dago DN, Silue S. Morphological diversity patterns among selected elite Shea trees (Vitellaria paradoxa C.F. Gaertn.) from Tchologo and Bagoué districts in Northern Côte d’Ivoire. Int J Genet Mol Biol. 2020;12:1–10. [Google Scholar]
- 15.Attikora AJP, Silué S, Yao SDM, De Clerck C, Shumbe L, Diarrassouba N, et al. An innovative optimized protocol for high-quality genomic DNA extraction from recalcitrant Shea tree (Vitellaria paradoxa, C.F. Gaertn) plant and its suitability for downstream applications. Mol Biol Rep. 2024;51(1):171. [DOI] [PubMed] [Google Scholar]
- 16.Kouassi AK, Alabi T, Cissé M, Purcaro G, Moret S, Moret E, et al. Assessment of composition, color, and oxidative stability of mango (Mangifera indica L.) kernel fats from various Ivorian varieties. J Am Oil Chem Soc. 2023;101(3):283–95. [Google Scholar]
- 17.Pritchard JK, Stephens M, Donnelly P. Inference of Population Structure Using Multilocus Genotype Data. Genetics. 2000;155(2):945–59. [DOI] [PMC free article] [PubMed] [Google Scholar]
- 18.Perrier X, Flori A, Bonnot F. Methods of data analysis. In: Genetic diversity of cultivated tropical plants. CRC Press. 2003;360(1) 31–63.
- 19.Wang SB, Feng JY, Ren WL, Huang B, Zhou L, Wen YJ, et al. Improving power and accuracy of genome-wide association studies via a multi-locus mixed linear model methodology. Sci Rep. 2016;6(1):19444. [DOI] [PMC free article] [PubMed] [Google Scholar]
- 20.Tamba CL, Zhang YM. A fast mrMLM algorithm for multi-locus genome-wide association studies. bioRxiv; 2018 [cited 2024 Jul 26]. p. 341784. Available from: https://www.biorxiv.org/content/10.1101/341784v1.
- 21.Wen YJ, Zhang H, Ni YL, Huang B, Zhang J, Feng JY, et al. Methodological implementation of mixed linear models in multi-locus genome-wide association studies. Brief Bioinform. 2018;19(4):700–12. [DOI] [PMC free article] [PubMed] [Google Scholar]
- 22.Zhang J, Feng JY, Ni YL, Wen YJ, Niu Y, Tamba CL, et al. pLARmEB: integration of least angle regression with empirical Bayes for multilocus genome-wide association studies. Heredity. 2017;118(6):517–24. [DOI] [PMC free article] [PubMed] [Google Scholar]
- 23.Ren WL, Wen YJ, Dunwell JM, Zhang YM. pKWmEB: integration of Kruskal-Wallis test with empirical Bayes under polygenic background control for multi-locus genome-wide association study. Heredity. 2018;120(3):208–18. [DOI] [PMC free article] [PubMed] [Google Scholar]
- 24.Tamba CL, Ni YL, Zhang YM. Iterative sure independence screening EM-Bayesian LASSO algorithm for multi-locus genome-wide association studies. PLOS Comput Biol. 2017;13(1):e1005357. [DOI] [PMC free article] [PubMed] [Google Scholar]
- 25.Odoi JB, Adjei EA, Barnor MT, Edema R, Gwali S, Danquah A, et al. Genome-Wide Association Mapping of Oil Content and Seed-Related Traits in Shea Tree (Vitellaria paradoxa subsp. nilotica) Populations. Horticulturae. 2023;9(7):811. [Google Scholar]
- 26.Allal F, Sanou H, Millet L, Vaillant A, Camus-Kulandaivelu L, Logossa ZA, et al. Past climate changes explain the phylogeography of Vitellaria paradoxa over Africa. Heredity. 2011;107(2):174–86. [DOI] [PMC free article] [PubMed] [Google Scholar]
- 27.Yang Y, Kong Q, Lim ARQ, Lu S, Zhao H, Guo L, et al. Transcriptional regulation of oil biosynthesis in seed plants: Current understanding, applications, and perspectives. Plant Commun. 2022;3(5):100328. [DOI] [PMC free article] [PubMed] [Google Scholar]
- 28.Coban F, Ozer H, Lan Y. Genetic and environmental influences on fatty acid composition in different fenugreek genotypes. Ind Crops Prod. 2024;15(222):119774. [Google Scholar]
- 29.Davrieux F, Allal F, Piombo G, Kelly B, Okulo JB, Thiam M, et al. Near Infrared Spectroscopy for High-Throughput Characterization of Shea Tree (Vitellaria paradoxa) Nut Fat Profiles. J Agric Food Chem. 2010;58(13):7811–9. [DOI] [PubMed] [Google Scholar]
- 30.Di Vincenzo D, Maranz S, Serraiocco A, Vito R, Wiesman Z, Bianchi G. Regional Variation in Shea Butter Lipid and Triterpene Composition in Four African Countries. J Agric Food Chem. 2005;53(19):7473–9. [DOI] [PubMed] [Google Scholar]
- 31.Ugese F, Baiyeri P, Mbah B. Agroecological variation in the fruits and nuts of shea butter tree (Vitellaria paradoxa C. F. Gaertn.) in Nigeria. Agrofor Syst. 2010;79:201–11. [Google Scholar]
- 32.Maranz S, Kpikpi W, Wiesman Z, De Saint Sauveur A, Chapagain B. Nutritional values and indigenous preferences for Shea Fruits(vitellaria paradoxa C.F. Gaertn. F.) in African Agroforestry Parklands. Econ Bot. 2004;58(4):588–600. [Google Scholar]
- 33.Zhang JL, Zhang SB, Zhang YP, Kitajima K. Effects of phylogeny and climate on seed oil fatty acid composition across 747 plant species in China. Ind Crops Prod. 2015;1(63):1–8. [Google Scholar]
- 34.Zhang YM, Jia Z, Dunwell JM. Editorial: The Applications of New Multi-Locus GWAS Methodologies in the Genetic Dissection of Complex Traits. Front Plant Sci. 2019 Feb 11 [cited 2024 Aug 2];10. Available from: https://www.frontiersin.org/journals/plant-science/articles/10.3389/fpls.2019.00100/full. [DOI] [PMC free article] [PubMed]
- 35.Peng Y, Liu H, Chen J, Shi T, Zhang C, Sun D, et al. Genome-Wide Association Studies of Free Amino Acid Levels by Six Multi-Locus Models in Bread Wheat. Front Plant Sci. 2018 Aug 14 [cited 2024 Aug 2];9. Available from: https://www.frontiersin.org/journals/plant-science/articles/10.3389/fpls.2018.01196/full. [DOI] [PMC free article] [PubMed]
- 36.Zhong H, Liu S, Sun T, Kong W, Deng X, Peng Z, et al. Multi-locus genome-wide association studies for five yield-related traits in rice. BMC Plant Biol. 2021;21(1):364. [DOI] [PMC free article] [PubMed] [Google Scholar]
- 37.Kouassi AK, Alabi T, Purcaro G, Blecker C, Danthine S. Assessment of the Impact of Annual Growing Conditions on the Physicochemical Properties of Mango Kernel Fat. Horticulturae. 2024;10(8):814. [Google Scholar]
Associated Data
This section collects any data citations, data availability statements, or supplementary materials included in this article.
Supplementary Materials
Data Availability Statement
Sequence data that support the findings of this study have been deposited in the European Nucleotide Archive with the primary accession code PRJNA1167878. Additionally, supporting data for the findings presented in this study can be found either within the manuscript or in the supplementary files.